Embed Size (px)
Citation preview

Chapter 3
Applying the Supply-and-Demand Model
© 2004 Pearson Addison-Wesley. All rights reserved 3-2
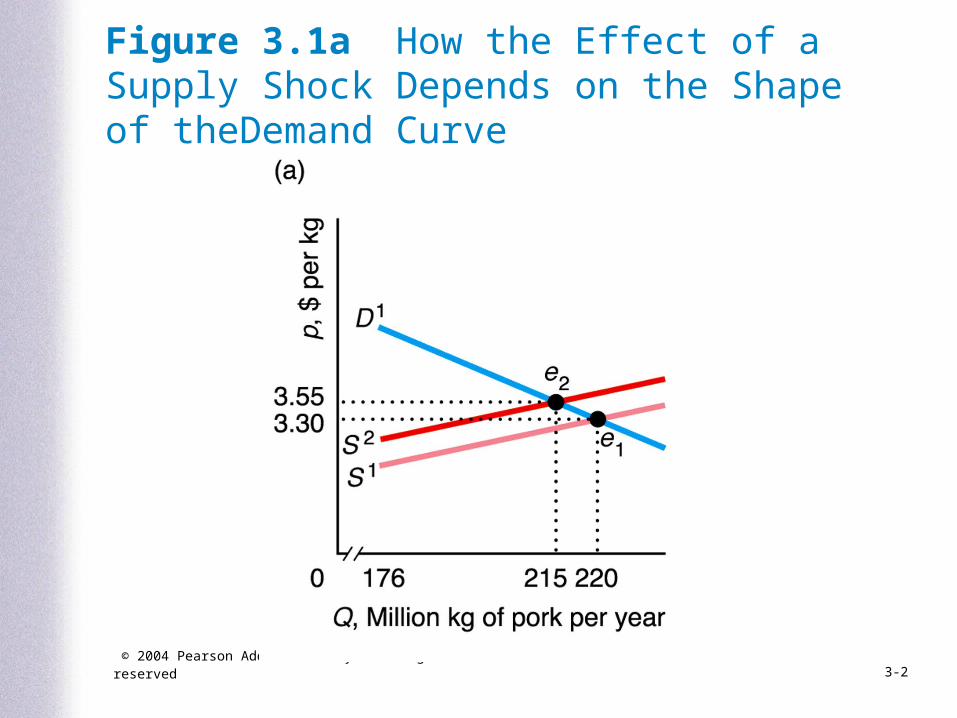
Figure 3.1a How the Effect of a Supply Shock Depends on the Shape of theDemand Curve

© 2004 Pearson Addison-Wesley. All rights reserved 3-3
Figure 3.1b How the Effect of a Supply Shock Depends on the Shape of the Demand Curve
© 2004 Pearson Addison-Wesley. All rights reserved 3-4
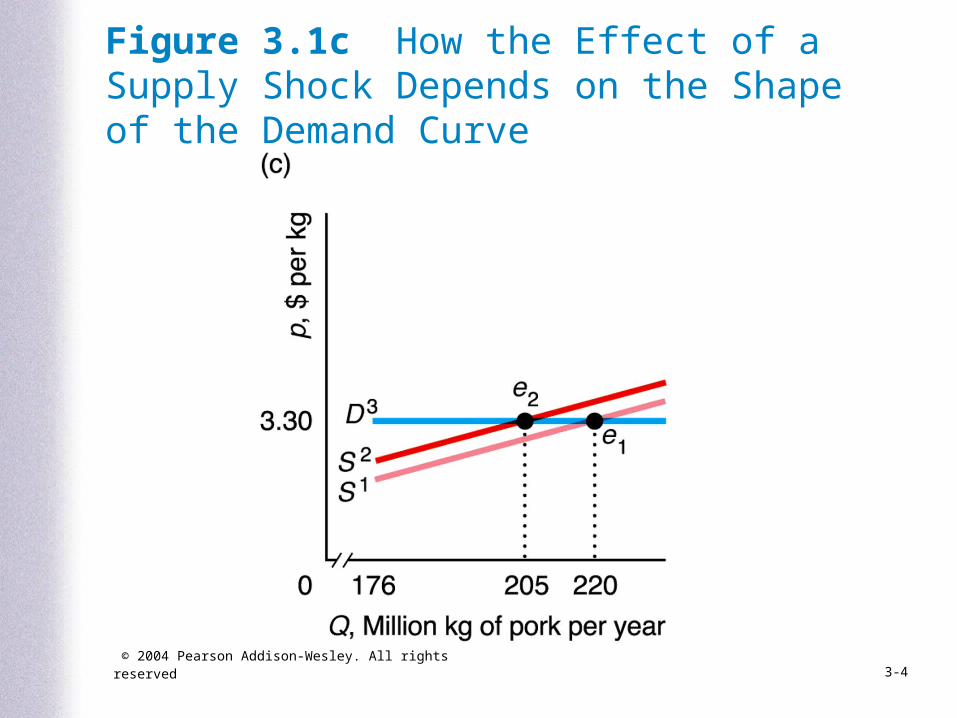
Figure 3.1c How the Effect of a Supply Shock Depends on the Shape of the Demand Curve

© 2004 Pearson Addison-Wesley. All rights reserved 3-5
Figure 3.2 Elasticity Along the Pork Demand Curve

© 2004 Pearson Addison-Wesley. All rights reserved 3-6
Figure 3.3a Vertical and Horizontal Demand Curves

© 2004 Pearson Addison-Wesley. All rights reserved 3-7
Figure 3.3b Vertical and Horizontal Demand Curves

© 2004 Pearson Addison-Wesley. All rights reserved 3-8
Figure 3.3c Vertical and Horizontal Demand Curves

© 2004 Pearson Addison-Wesley. All rights reserved 3-9
Figure 3.4 Elasticity Along the Pork Supply Curve

© 2004 Pearson Addison-Wesley. All rights reserved 3-10
Figure 3.5 Effect of a $1.5 Specific Tax on the Pork Market Collected from Producers

© 2004 Pearson Addison-Wesley. All rights reserved 3-11
Page 64 Solved Problem 3.1

© 2004 Pearson Addison-Wesley. All rights reserved 3-12
Figure 3.6 Effect of a $1.5 Specific Tax on Pork Collected from Consumers

© 2004 Pearson Addison-Wesley. All rights reserved 3-13
Figure 3.7 Comparison of an Ad Valorem and a Specific Tax on Pork

© 2004 Pearson Addison-Wesley. All rights reserved 3-14
Page 68 Solved Problem 3.2


![Describe how individuals, events, and ideas have changed communities, past and present.[3.1A] October 2014THIRD GRADE SOCIAL STUDIES](https://img.dokumen.tips/doc/110x75/56649e225503460f94b0f411/describe-how-individuals-events-and-ideas-have-changed-communities-past.jpg)