Embed Size (px)
Citation preview

5
Chapter 2
The Glow Discharge
2.2 Introduction
The term “plasma” was first introduced by Irving Langmuir (1881–1957) in the
1920’s. The behavior of low pressure DC electrical discharges in gases was studied
by many English and German physicists during the 19th century. They developed
various evacuated tubes to illustrate the strange behavior of the plasma.
Electrons and ions are charged particles, they can be preferentially heated by applying
an electric or magnetic field to the plasma, keeping the neutral gas atoms at a low
temperature. Most notably, electrons with low mass are easily accelerated to energies
for ionization of the gas atoms, with typical values of kinetic energy in the 1-10 eV
range (equivalent to ~104-105 K). Due to the low gas temperatures of electrical
discharge plasmas, they are sometimes also referred to as cold plasmas. Obviously,
electrical discharge plasmas are not in thermal equilibrium, since ge TT >> and
gie TTT >> [6].
The two most common types of electrically induced plasmas are the direct-current
glow discharge, and the radio-frequency discharge, where a radio-frequency electric
field is coupled either capacitively or inductively to the electrons of the discharge [6].

6
2.2. Brief History of Glow Discharge
The scientific examination of the glow discharge started during the latter half of the
19th century and was closely related to advances in vacuum technology. When high
potentials were obtainable together with means of pumping air out of closed glass
vessels, it was observed that the high-voltage electric spark between two electrodes
produced a variety of colourful and silent ribbon-like discharges as the gas pressure
was progressively reduced. In 1944, Faraday discovered that, as the gas pressure was
reduced, the luminosity receded towards the anode of a discharge tube, leaving a dark
space, demonstrating the existence of a dark discharge of electricity in gases.
Development of electrode material, and technical advances in electrode and glass- /
quartz-tube constructions have played an important role in the investigation of
various forms of glow discharges [7]. In the mid of 19th century, Geissler introduced
a mercury pump and developed a technique for constructing glass discharge tubes
with metal electrodes inside (1858-60). Plucker (1858) noticed the glass in the
vicinity began to phosphoresce, as the gas pressure was reduced. Throughout the
following 25 years, investigations of the cause of this effect were carried out by
Crookes, Hittorf, Glodstein and Hertz. In 1895, Rontgen discovered X-rays, and the
work of J. J. Thomson using discharge tubes at low gas pressures ( 410−≤ mmHg) led
to the discovery of the electron, and the measurement of the ratio of the charge to
mass. Following that, J. J. Thomson and F.W. Aston developed the mass
spectroscopy of ions, after the discovery that ‘positive rays’ could be passed from a
glow discharge through a hole in the cathode. Thus, research into understanding of
glow discharge played a vital role in the opening up of modern physics [7].

7
Today, glow discharges have been utilized in a wide range of practical applications.
With much research and development, glow discharges are now not only being
operated at low pressures, but also at high pressures up to atmospheric pressure
without needing a vacuum system.
2.3 Introduction to Glow Discharge and Applications
The glow discharge owes its name to the fact that the plasma is luminous. This
luminosity is produced because the electron energy and number density are high
enough to generate visible light by recombination and excitation collisions [8].
Glow discharges are used in a large number of applications. The light emitting
character of glow discharge has several applications such as in the light industry (the
classical electrical discharge tube used in fluorescence lamps, neon discharge tube for
advertisements, etc.), as the pump source for gas lasers, and as flat plasma display
panels for the new generation of flat, large area television screens. Besides, there are
other important applications such as those in the microelectronic industry and in the
material processing technology. These include surface treatment, etching of surfaces
(for the fabrication of integrated circuits, etc.), plasma polymerisation, plasma
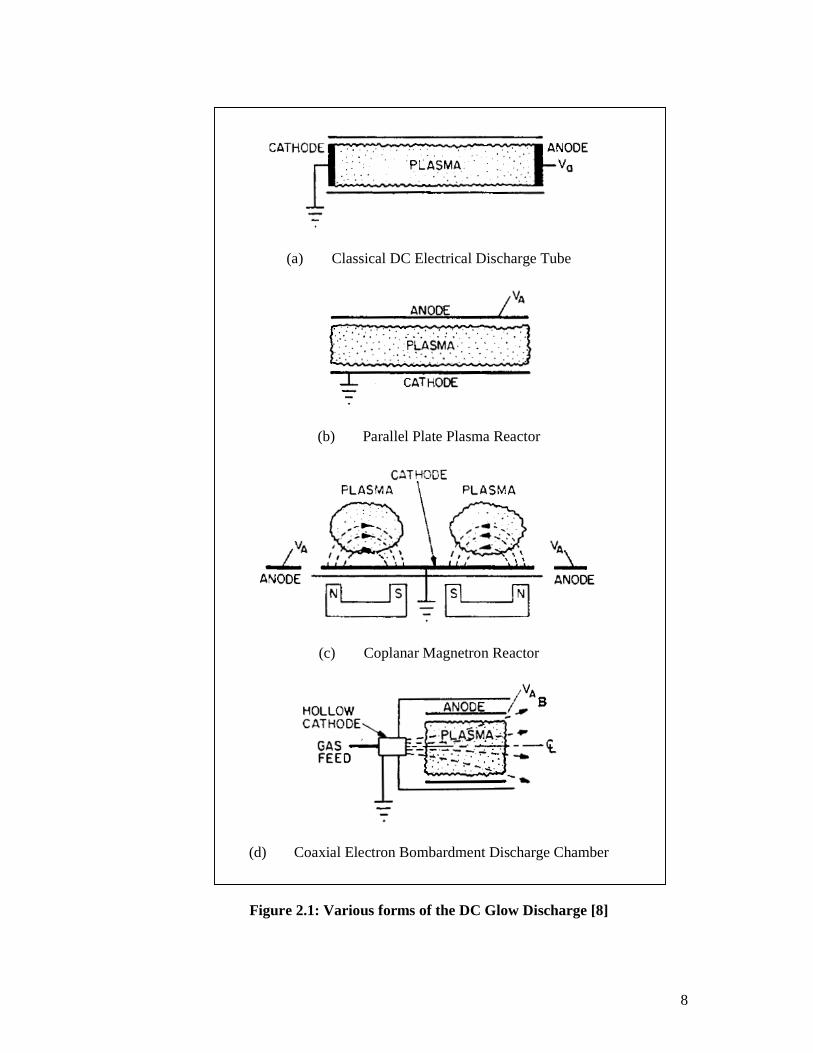
modification of polymers, and the deposition of thin protective coatings. Other forms of
glow discharge for industrial applications are such as DC parallel plate plasma reactors,
electron bombardment plasma sources, etc. [8, 9]. Some of the common configurations
of the glow discharge used in industry are shown in Figure 2.1.
8
(a) Classical DC Electrical Discharge Tube
(b) Parallel Plate Plasma Reactor
(c) Coplanar Magnetron Reactor
(d) Coaxial Electron Bombardment Discharge Chamber
Figure 2.1: Various forms of the DC Glow Discharge [8]

9
In the simplest case, glow discharge is formed by applying a potential difference (of a
few 100 V to a few kV) between two electrodes that are inserted in a cell or chamber
filled with gas (an inert gas or a reactive gas) at a pressure ranging from a few mTorr to
atmospheric pressure [9]. Due to the potential difference, the electrons are accelerated
away from the cathode, and increase the collisions with the gas atoms and molecules.
The collisions may produce processes such as excitation, ionization, dissociation, etc..
The excitation collisions create excited species, which can decay to lower levels by the
emission of light, and this is responsible for the characteristic name of the “glow”
discharge. The ions are accelerated toward the cathode, and they release secondary
electrons when bombarding at the cathode surface. These secondary electrons are
accelerated away from the cathode and they can give rise to more ionization collisions.
Ionization collisions create ion-electron pairs, and this ion-electron multiplication
process makes glow discharge a self-sustained plasma [9].
10
2.4 Different Types of Glow Discharge
There are various types of glow discharge plasmas. The basic version described above
is the direct current (dc) glow discharge. A continuous potential difference is applied
between the cathode and anode, producing a constant current. This setup may give rise
to problems when one of the electrodes is non-conducting, as due to the constant current,
the electrodes will be charged up and leading to burn-out of the glow discharge [9].
The problem in DC glow discharge is overcome by applying an alternating voltage
between the two electrodes, such as in the capacitively coupled radio-frequency (cc rf)
glow discharge. In this case, the charge accumulated during one half of the cycle, will
be neutralized by the opposite charge accumulated during the next half-cycle [9].
An alternating current applied across the electrodes will give rise to an alternating
current (ac) glow discharge. This can be considered as a consecution of short
discharges, where the role of cathode and anode is changed alternately. One of the
important ac glow discharge, operating at atmospheric pressure, is the dielectric barrier
discharge (DBD), in which the electrodes are typically covered by a dielectric barrier [9].
The glow discharge may also be operated by using a pulsed current source. This is the
pulsed glow discharge, which consists of short glow discharges (with time lengths
typically in the milli- or microsecond range), followed by an afterglow, which is
generally characterized by a longer time-period. The advantage of this type of discharge
is that for a low average power, high peak electrical power can be reached, resulting in
high peak efficiencies for various applications [9].

11
A magnetic field can also be applied to a glow discharge besides applying a potential
difference (or an electric field). The magnetron discharge is a well-known discharge
type with crossed magnetic and electric fields. In the magnetron discharge, the electrons
circulate in helices around the magnetic field lines and creating more ionisation. Hence,
they are typically operated at lower pressures and higher currents as compared to the
conventional glow discharges.
Several new discharge types characterized by low pressure and high plasma densities
have also been developed. Their major difference from the conventional glow discharge
is that the electrical power is applied by electromagnetic induction, not by application of
a potential difference between the two electrodes as in the conventional type. This is the
inductively coupled discharge, where the RF power is inductively coupled to the plasma.
Another type of glow discharge is produced by using microwave power. The
combination of the microwave discharge and a magnetic field gives rise to the electron
cyclotron resonance (ECR) reactor [9].
2.5 DC (Direct Current) Glow Discharge
The DC glow discharge has been historically important, both in applications and in
studying the properties of the plasma medium. For studying the glow discharge, the
usual configuration is a long glass cylinder with anode electrode at one end and
cathode electrode at the other end. The usual pressure range of operation is 10 mTorr
to 10 Torr, and the typical voltage is a few hundreds volts between cathode and anode
to maintain the discharge [10]. The parameter ranges of glow discharges are
summarized in Table 2.1.

12
Table 2.1: Characteristic parameter ranges of DC Glow Discharge [8]
Parameter Low Value Characteristic Value
High Value
Neutral gas pressure (Torr) 10-6 0.5 760
Electrode voltage (V) 100 1000 50 000
Electrode current (A) 10-4 0.5 20
Number density (electrons/m3) 1014 5×10¹⁵ 6×10¹⁸
Electron kinetic temperature (eV) 1 2 5
Power level (W) 10-2 200 250 000
Plasma volume (liters) 10-6 0.1 100
As the voltage across the classical DC low pressure electrical discharge tube is
increased through the dark discharge region shown in the Figure 2.2, the current
increases exponentially in the Townsend discharge region. When one approaches the
breakdown voltage at the point E, and if the internal resistance of the power supply is
relatively low, the gas will break down at the voltage VB. Then the discharge will
move from the dark region into the normal glow discharge region [8].
The glow discharge region is shown in greater details in Figure 2.3. The region from
F to G is called the normal glow discharge. In this region, the voltage is relatively
independent of the total current flowing in the discharge tube, and the current density
reaching the electrode is also relatively independent of the total current. This means
that the plasma is in contact with only a small part of the cathode surface at low
current in the normal glow discharge region. The contact surface fills more and more
of the total cross section of the cathode as the current increases, until at the point G,
the boundary of the abnormal glow, the plasma covers the entire surface of the
cathode, in order to deliver the required total current at a constant current density. In

13
the abnormal glow discharge region, the voltage increases significantly with
increasing total current, in order to force the cathode current density above its natural
value and provide the desired current. The electrodes become sufficiently hot that the
cathode emits electrons thermionically at point H. Then the discharge will undergo a
glow-to-arc transition, if the DC power supply has a sufficient low internal resistance
[8].
Figure 2.2: Voltage-Current characteristic of the DC low pressure electrical discharge [8].

14
Figure 2.3: The variation of voltage and current density with current of a normal glow discharge [8].
2.6 The Qualitative Characteristics of Normal Glow Discharge
A classical electrical discharge in the normal glow region has the characteristics
shown in Figure 2.4. The structures of Figure 2.4 (a) were first observed in the
1830’s by Michael Faraday. The characteristic of the normal glow discharge received
individual names, often in honor of the 19th century investigators who were among
the first to observe or investigate them [8]. The appearance of the glow discharge can
be identified into various regions as described below:
15
2.6.1 The Cathode
The secondary electron emission at the cathode surface plays a significant role in a
self-sustaining glow discharge. The Townsend theory of gas discharge considers the
ion bombardment at the cathode surface as a secondary source of electrons and
defines the secondary electron emission coefficient as the number of electrons
emitted from the cathode per ion bombardment. With the inclusion of this secondary
source of electrons, the current density is described by [8]
)1(10
−−=
d
d
e
eJJ α
α
γ (A/m2) . ……………………………………………...(2.1)
This leads to the condition of electrical breakdown and subsequently the self-
sustained glow discharge.
2.6.2 Aston dark space
A thin region immediately in front of the cathode with a strong electric field and
negative space charge is called the Aston dark space. It contains slow electrons
which are in the process of being accelerated from the cathode. The electrons are of
too low in density and energy to excite the gas, so it appears dark [8]. As it has
negative space charge, which means that the initial stray electrons plus the secondary
electrons, outcome the ions in this region [11].

16
2.6.3 Cathode glow
The next region is the cathode glow, which has a relatively high ion density. In this
region, the electrons are energetic enough to excite the neutral atoms they collide
with. It is often reddish or orange in colour due to the emission by excited atoms or
incoming positive ions which are moving toward the cathode, sputtered off the
cathode surface. The axial length of cathode glow region depends on the type of gas
and the pressure. The cathode glow sometimes clings to the cathode and masks the
Aston dark space [8].
2.6.4 Crookes (or Hittorf) dark space / Cathode fall
The region after the cathode glow is the Crookes dark space. It is the region over
which most of the voltage drop occurs and has moderate electric field. This region
has a positive space charge and relatively high ion density [8, 10].
2.6.5 Negative glow
This region has the brightest intensity in the entire discharge. It is the most intense on
the cathode side and has relatively low electric field. The negative glow is usually
longer than the cathode glow, and the electrons carry almost the entire current in this
region. Here the electrons that have been accelerated through the cathode region
produce ionization and intense excitation, hence the bright light output observed.
Energy for excitation is no longer available as these electrons slow down, and the

17
Faraday dark space begins. The electron number density in the negative glow region
is about 1016 electrons/m3 [8].
2.6.6 Faraday dark space
The electron energy is low, and the electron number density decreases by
recombination and diffusion to the walls in this region. The net space charge is very
low and the axial electric field is relatively small [8].
2.6.7 Positive Column
This region is quasi-neutral as what Irving Langmuir had in mind when he defined
plasma. The electric field is small in this region, typically 1 V/cm, and it is just large
enough to maintain the required degree of ionization at its cathode end. The length of
the positive column region can be varied by changing the distance between electrodes
at a constant pressure and constant voltage drop, while the other regions maintain
their lengths. The electron number density in the positive column is typically 1015 to
1016 electrons/m3, with electron kinetic temperature of 1 to 2 eV. The positive
column is a long, uniform glow, except when standing or moving striations are
triggered spontaneously, or ionization waves are triggered by a disturbance. For a
glow discharge in air, the positive column plasma is pinkish to blue [8, 10].

18
2.6.8 Anode glow
The anode glow is a bright region which is slightly more intense than the positive
column. It is at the right end of positive column and is not always present. This is
the boundary of the anode sheath [8].
2.6.9 Anode dark space
The anode dark space is the space between anode glow and the anode itself. It is the
anode sheath which has a negative space charge due to electrons traveling from the
positive column to the anode. The electric field in the anode dark space is higher than
the positive column. The anode pulls electrons out of the positive column, acts like a
Langmuir probe in electron saturation [8].
The characteristic axial profiles of the light intensity, potential distribution, field
strength, net space charge, negative charges, and positive charges are shown in Figure
2.4 (b) with the visible structures to which they correspond indicated by Figure 2.4 (a)
[8].

19
Figure 2.4: Typical characteristics of a normal glow discharge [10].

20
2.7 RF (Radio Frequency) Discharges
RF glow discharge and DC glow discharge plasmas are similar in many ways. The
main difference is that RF glow discharge can be used to treat both conductors and
non-conductors while DC glow discharge cannot [12].
The superiority RF glow discharge over DC glow discharge in their applications to
material processing is due to several advantages namely wider range of operating
parameters; more stable plasma; less affected by surface oxidation; greater sputtering
depth [12].
In current practice, glow discharge processes used for the treatment of insulating
materials are often driven by high frequency power source, usually in the megahertz
(MHz) range. For an AC discharge, conventional main frequency (50 Hz) was found
to be not very effective for the treatment of insulator. It is because if the time during
which the insulator charge up is much less than half the period of the AC supply, then
most of the time the discharge will be off. Thus at low frequency, there will be series
of short-lived discharges with the electrodes successively taking opposite polarities
[13].
When estimating the time to charge up the insulator by considering the voltage rise
across the capacitor, although the current i to the target will actually decrease as the
target charges up, it will be sufficient to regard it as constant. Therefore, the charge
accumulated in t seconds will be Q = it [13].

21
V
it
V
QC == , ………………………….……………………………………..(2.2)
i
CVt = . ……………...……………………………………………………..(2.3)
For example, the capacitance of a piece of quartz 1/8” thick is about 1 pF/cm2, the
applied voltage V is 1000 volts, the current density Q is 1 mA/cm2, and assumed the
RF ion currents are similar to DC sputtering currents, ~ 1 mA/cm2 [13].
Therefore,
63
12
101101
)1000(101 −−
−
×=×
×==i
CVt s . ………………………………….......(2.4)
This means a discharge can be produced continuously at frequencies above about 1
MHz (where frequency, t
f1= ). In actual case, the insulator will not charge up so
rapidly, because the current will not be sustained at a constant value. In practice, a
discharge can be maintained quasi-continuously for frequencies above 100 kHz [13].
Many RF glow discharge processes operate at the frequency of 13.56 MHz. It is just
because it is the frequency allocated by international communications authorities at
which one can radiate a certain amount of energy without interferring with
communications. However, RF glow discharge has so many nonlinear effects that it
generates harmonic frequencies. Some of the harmonics falls in the VHF broadcast
band and aircraft communication bands, etc. [13]. Therefore, operating frequencies
are basically chosen at which it can optimize performance.
22
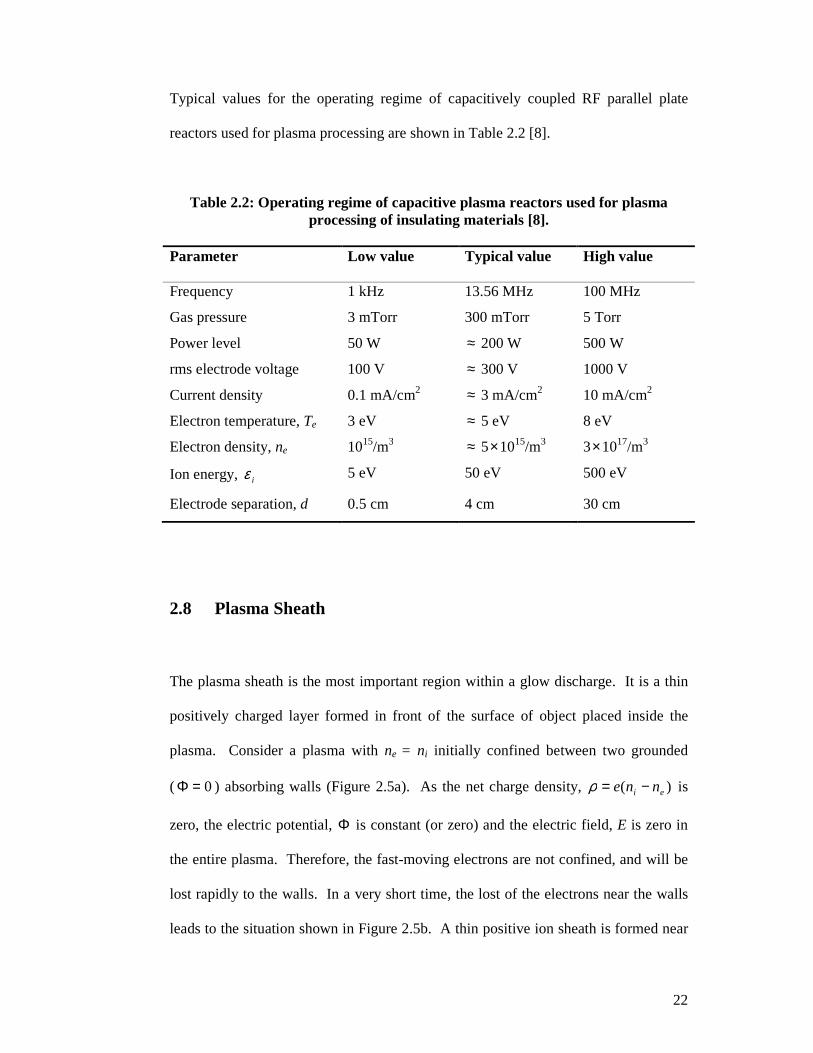
Typical values for the operating regime of capacitively coupled RF parallel plate
reactors used for plasma processing are shown in Table 2.2 [8].
Table 2.2: Operating regime of capacitive plasma reactors used for plasma processing of insulating materials [8].
Parameter Low value Typical value High value
Frequency 1 kHz 13.56 MHz 100 MHz
Gas pressure 3 mTorr 300 mTorr 5 Torr
Power level 50 W ≈ 200 W 500 W
rms electrode voltage 100 V ≈ 300 V 1000 V
Current density 0.1 mA/cm2 ≈ 3 mA/cm2 10 mA/cm2
Electron temperature, Te 3 eV ≈ 5 eV 8 eV
Electron density, ne 1015/m3 ≈ 5×10¹⁵/m3 3×10¹⁷/m3
Ion energy, iε 5 eV 50 eV 500 eV
Electrode separation, d 0.5 cm 4 cm 30 cm
2.8 Plasma Sheath
The plasma sheath is the most important region within a glow discharge. It is a thin
positively charged layer formed in front of the surface of object placed inside the
plasma. Consider a plasma with ne = ni initially confined between two grounded
( 0=Φ ) absorbing walls (Figure 2.5a). As the net charge density, )( ei nne −=ρ is
zero, the electric potential, Φ is constant (or zero) and the electric field, E is zero in
the entire plasma. Therefore, the fast-moving electrons are not confined, and will be
lost rapidly to the walls. In a very short time, the lost of the electrons near the walls
leads to the situation shown in Figure 2.5b. A thin positive ion sheath is formed near

23
the wall in which ni >> ne. The net positive charge density within the sheaths leads to
a potential profile that is positive within the plasma and falls sharply to zero near the
walls [10]. The voltage across the sheath has influence on the energy of the ion
striking the substrate. The ion enters the sheath with very low energy, then
accelerated by the sheath voltage, and in the absence of collisions in the sheath, the
ion would strike the substrate with a kinetic energy equivalent to the sheath voltage
[13].
Figure 2.5: The formation of plasma sheaths: (a) initial ion and electron densities and potential; (b) densities, electric field, and potential after formation of the
sheath [10].
In principle, the sheath thickness, s can be determined by solving the Poisson
equation in the sheath region, using the sheath charge density, ns. Assuming a
uniform ion density in the sheath, == is nn constant, and choose x = 0 at the
grounded wall, we get [6]
02
2
εien
dx
d −=Φ . ………………………………………………………………(2.5)

24
Set pVsx ==Φ )( , the matrix sheath thickness is
2
1
02
=
i
p
en
Vs
ε . ……………………………………………………………...(2.6)
2.9 Energy Distribution Function
The velocities of particles in a plasma at thermal equilibrium are expected to follow
the Maxwell distribution. The one-dimensional Maxwell distribution is given by
−=
Tk
mAf
B
xx 2
exp)(2υυ , ……………………..…………………………….(2.7)
where xfdυ is the number of particles per cm3 with velocity between xυ and
xx dυυ + , 2
2
1xmυ is the kinetic energy, and kB is Boltzmann’s constant.
The density, n (number of particles per cm3), is given by
∫∞
∞−= xx dfn υυ )( , ………………………………………………………….(2.8)
and the constant A is related to the density, n by
2
1
2
=
Tk
mnA
Bπ . ……………………………………………………………(2.9)
25
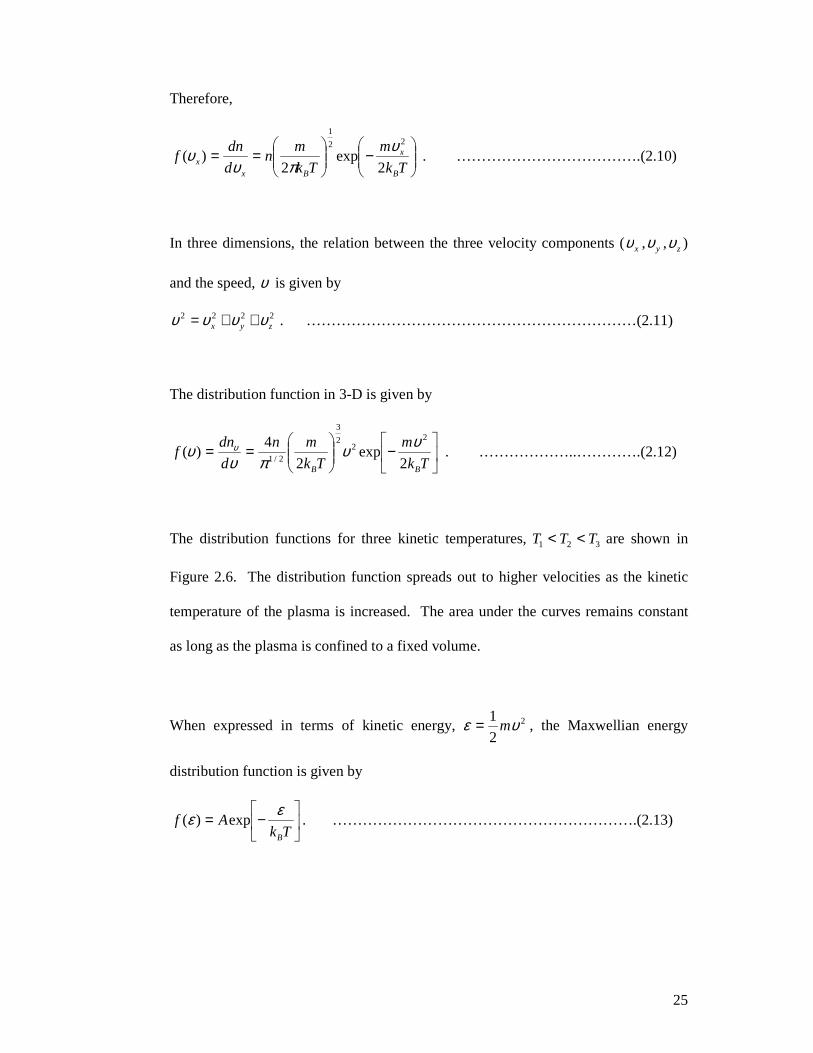
Therefore,
−
==
Tk
m
Tk
mn
d
dnf
B
x
Bxx 2
exp2
)(22
1
υπυ
υ . ……………………………….(2.10)
In three dimensions, the relation between the three velocity components (xυ , yυ , zυ )
and the speed, υ is given by
2222zyx υυυυ ++= . …………………………………………………………(2.11)
The distribution function in 3-D is given by
−
==
Tk
m
Tk
mn
d
dnf
BB 2exp
2
4)(
22
2
3
2/1
υυπυ
υ υ . ………………..………….(2.12)
The distribution functions for three kinetic temperatures, 321 TTT << are shown in
Figure 2.6. The distribution function spreads out to higher velocities as the kinetic
temperature of the plasma is increased. The area under the curves remains constant
as long as the plasma is confined to a fixed volume.
When expressed in terms of kinetic energy, 2
2
1 υε m= , the Maxwellian energy
distribution function is given by
−=
TkAf
B
εε exp)( . …………………………………………………….(2.13)

26
Figure 2.6: The distribution functions for three kinetic temperatures, 321 TTT << [8].
In the actual situation, the electrons in the glow discharge may not have achieved a
total thermal equilibrium. The slower electrons make elastic collisions while
electrons with energies above the excitation and ionization thresholds are making
inelastic collisions, and lose a large fraction of their energy. Besides, fast electrons
are also lost rapidly by diffusion to the walls and recombination. Therefore, there is a
shift of electrons from high energy to low energy states, and it might be expected to
have fewer electrons with high energies than predicted by Maxwell distribution [10].
Although the Maxwell statistics describes the thermal equilibrium state, where the
motion of the particles of the system is perfectly random, the distribution function is
also often used in near thermal equilibrium situations. The reasons for this are: (1)
the system may only be slightly deviated from thermal equilibrium, and (2) the
actually distribution function of the system may be very difficult to determine. The
Maxwell distribution function may be used as a valid first approximation and it can
be mathematically manipulated with relative ease [14].
27
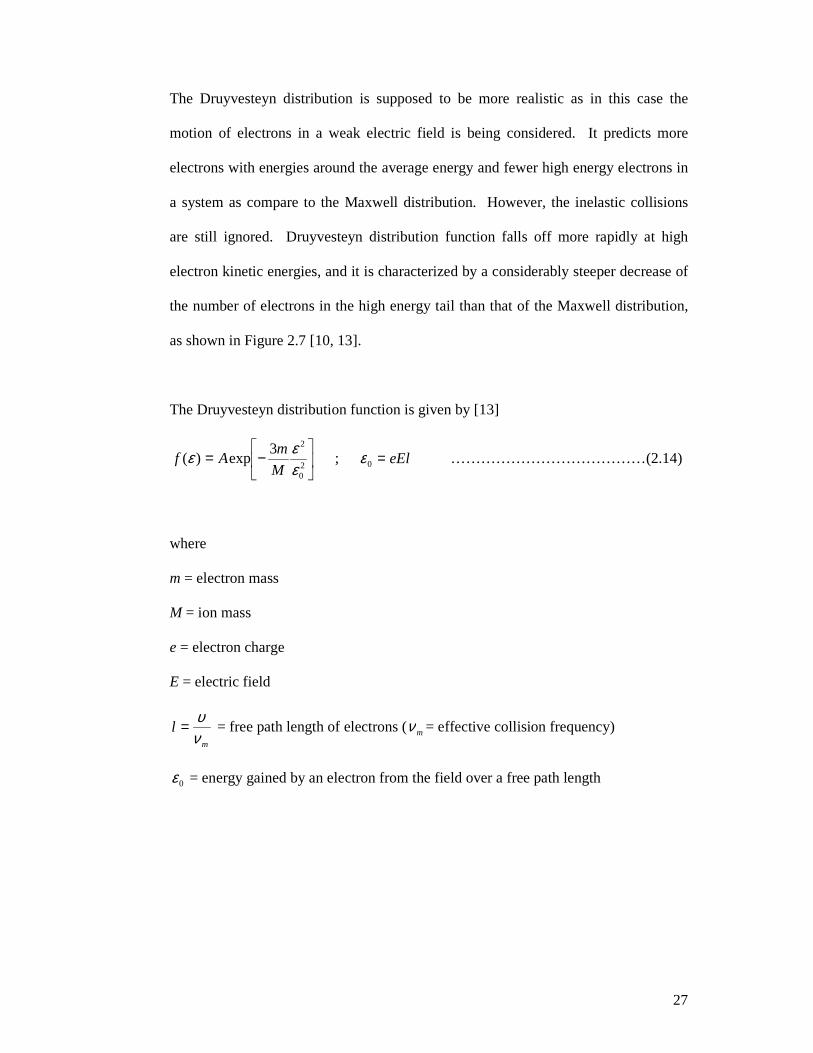
The Druyvesteyn distribution is supposed to be more realistic as in this case the
motion of electrons in a weak electric field is being considered. It predicts more
electrons with energies around the average energy and fewer high energy electrons in
a system as compare to the Maxwell distribution. However, the inelastic collisions
are still ignored. Druyvesteyn distribution function falls off more rapidly at high
electron kinetic energies, and it is characterized by a considerably steeper decrease of
the number of electrons in the high energy tail than that of the Maxwell distribution,
as shown in Figure 2.7 [10, 13].
The Druyvesteyn distribution function is given by [13]
−=
20
23exp)(
εεε
M
mAf ; eEl=0ε …………………………………(2.14)
where
m = electron mass
M = ion mass
e = electron charge
E = electric field
m
lνυ= = free path length of electrons (mν = effective collision frequency)
0ε = energy gained by an electron from the field over a free path length

28
Figure 2.7: Maxwellian (nM) and Druyvesteyn (nD) distribution function in energy, n(εεεε) [13].