Embed Size (px)
Citation preview
Copyright © by Holt, Rinehart and Winston. All rights reserved.
Interactive Textbook 19 Maps as Models of the Earth
SECTION
1 You Are HereMaps as Models of the Earth
Name Class Date
CHAPTER 2
After you read this section, you should be able to answer these questions:
• What is a map?
• What are latitude and longitude?
• How can you find locations on Earth?
What Is a Map?A map is a model that shows the features of an object. Most
maps that people use show the features of Earth’s surface. Some maps show all of the Earth’s surface. Other maps show only part of it. Maps can show natural features, such as rivers. They can also show features made by people, such as roads.
FINDING DIRECTIONS ON EARTHThe Earth’s shape is similar to a sphere, but the Earth
is not a true sphere. A true sphere has no top, bottom, or sides—it looks the same from all directions. In addition, a true sphere has no reference points. Reference points are certain locations that never change. They can be used to define directions.
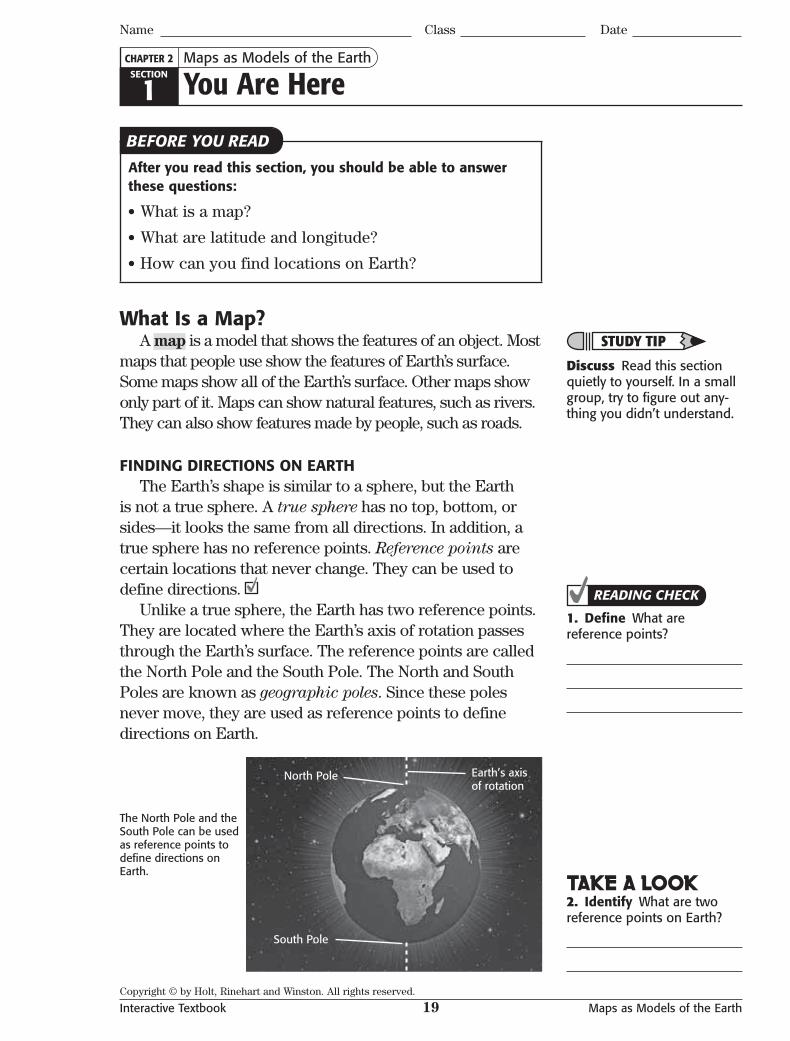
Unlike a true sphere, the Earth has two reference points. They are located where the Earth’s axis of rotation passes through the Earth’s surface. The reference points are called the North Pole and the South Pole. The North and South Poles are known as geographic poles. Since these poles never move, they are used as reference points to define directions on Earth.
The North Pole and the South Pole can be used as reference points to defi ne directions on Earth.
North Pole
South Pole
Earth’s axis of rotation
BEFORE YOU READ
STUDY TIP
Discuss Read this section quietly to yourself. In a small group, try to fi gure out any-thing you didn’t understand.
READING CHECK
1. Defi ne What are reference points?
TAKE A LOOK 2. Identify What are two reference points on Earth?
Copyright © by Holt, Rinehart and Winston. All rights reserved.
Interactive Textbook 20 Maps as Models of the Earth
SECTION 1
Name Class Date
You Are Here continued
CARDINAL DIRECTIONSA reference point alone will not help you give good
directions. You also need to describe how to get from one place to another. To do this, you can use the cardinal directions. The cardinal directions are north, south, east, and west. To use cardinal directions properly, you will need to use a compass.
USING A COMPASS TO FIND DIRECTIONSThe Earth is like a giant magnet. It has two magnetic
poles, which are located near the geographic poles. You can use the magnetic poles to help you find the cardinal directions.
A compass is a tool that uses the Earth’s natural magnetism to show direction. The needle on a compass points to the magnetic pole that is near the geographic North Pole. Therefore, you can use a compass to learn which direction is north.
TRUE NORTH AND MAGNETIC DECLINATIONThere is a difference between the location of the
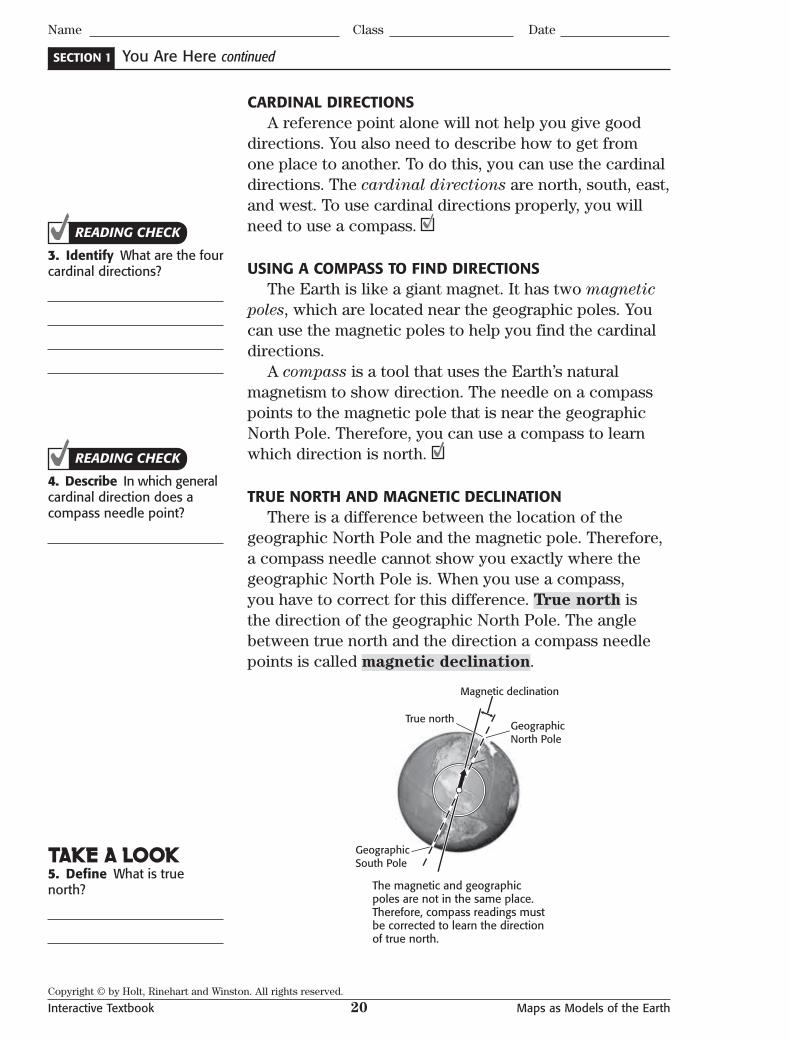
geographic North Pole and the magnetic pole. Therefore, a compass needle cannot show you exactly where the geographic North Pole is. When you use a compass, you have to correct for this difference. True north is the direction of the geographic North Pole. The angle between true north and the direction a compass needle points is called magnetic declination.
GeographicNorth Pole
True north
Magnetic declination
GeographicSouth Pole
The magnetic and geographic poles are not in the same place. Therefore, compass readings must be corrected to learn the direction of true north.
READING CHECK
3. Identify What are the four cardinal directions?
READING CHECK
4. Describe In which general cardinal direction does a compass needle point?
TAKE A LOOK 5. Defi ne What is true north?
Copyright © by Holt, Rinehart and Winston. All rights reserved.
Interactive Textbook 21 Maps as Models of the Earth
SECTION 1
Name Class Date
You Are Here continued
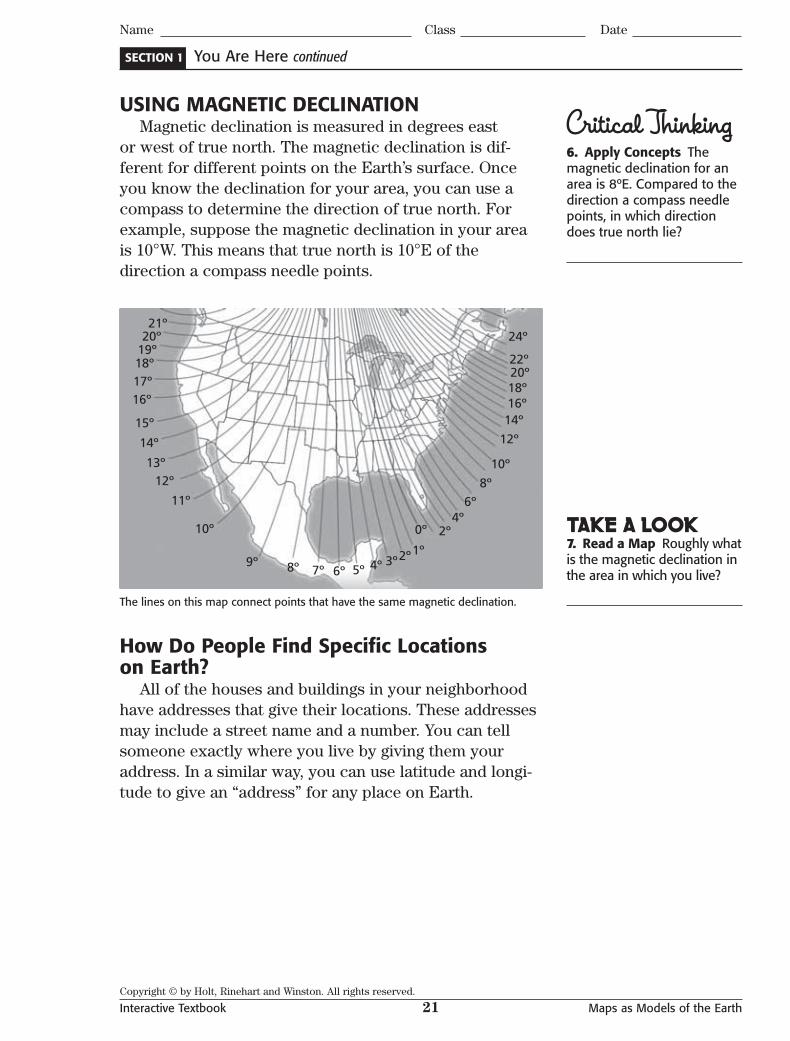
USING MAGNETIC DECLINATIONMagnetic declination is measured in degrees east
or west of true north. The magnetic declination is dif-ferent for different points on the Earth’s surface. Once you know the declination for your area, you can use a compass to determine the direction of true north. For example, suppose the magnetic declination in your area is 10°W. This means that true north is 10°E of the direction a compass needle points.
20º19º18º17º16º
15º
14º
13º12º
11º
10º
9º 8º 7º 6º 5º 4º 3º
0º
1º
2º4º
2º
6º8º
10º
12º
14º16º18º
24º
20º22º
21º
The lines on this map connect points that have the same magnetic declination.
How Do People Find Specific Locations on Earth?
All of the houses and buildings in your neighborhood have addresses that give their locations. These addresses may include a street name and a number. You can tell someone exactly where you live by giving them your address. In a similar way, you can use latitude and longi-tude to give an “address” for any place on Earth.
Critical Thinking6. Apply Concepts The magnetic declination for an area is 8ºE. Compared to the direction a compass needle points, in which direction does true north lie?
TAKE A LOOK 7. Read a Map Roughly what is the magnetic declination in the area in which you live?
Copyright © by Holt, Rinehart and Winston. All rights reserved.
Interactive Textbook 22 Maps as Models of the Earth
SECTION 1
Name Class Date
You Are Here continued
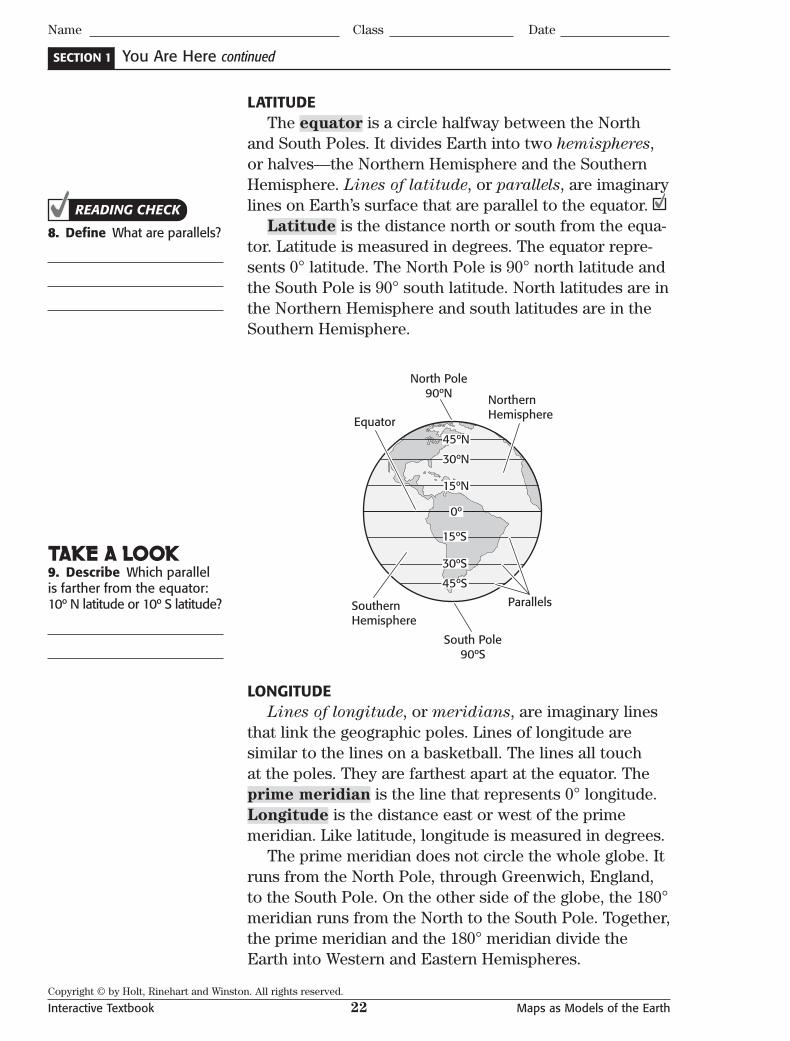
LATITUDEThe equator is a circle halfway between the North
and South Poles. It divides Earth into two hemispheres,or halves—the Northern Hemisphere and the Southern Hemisphere. Lines of latitude, or parallels, are imaginary lines on Earth’s surface that are parallel to the equator.
Latitude is the distance north or south from the equa-tor. Latitude is measured in degrees. The equator repre-sents 0° latitude. The North Pole is 90° north latitude and the South Pole is 90° south latitude. North latitudes are in the Northern Hemisphere and south latitudes are in the Southern Hemisphere.
LONGITUDELines of longitude, or meridians, are imaginary lines
that link the geographic poles. Lines of longitude are similar to the lines on a basketball. The lines all touch at the poles. They are farthest apart at the equator. The prime meridian is the line that represents 0° longitude. Longitude is the distance east or west of the prime meridian. Like latitude, longitude is measured in degrees.
The prime meridian does not circle the whole globe. It runs from the North Pole, through Greenwich, England, to the South Pole. On the other side of the globe, the 180° meridian runs from the North to the South Pole. Together, the prime meridian and the 180° meridian divide the Earth into Western and Eastern Hemispheres.
READING CHECK
8. Defi ne What are parallels?
TAKE A LOOK 9. Describe Which parallel is farther from the equator: 10º N latitude or 10º S latitude?
Copyright © by Holt, Rinehart and Winston. All rights reserved.
Interactive Textbook 23 Maps as Models of the Earth
SECTION 1
Name Class Date
You Are Here continued
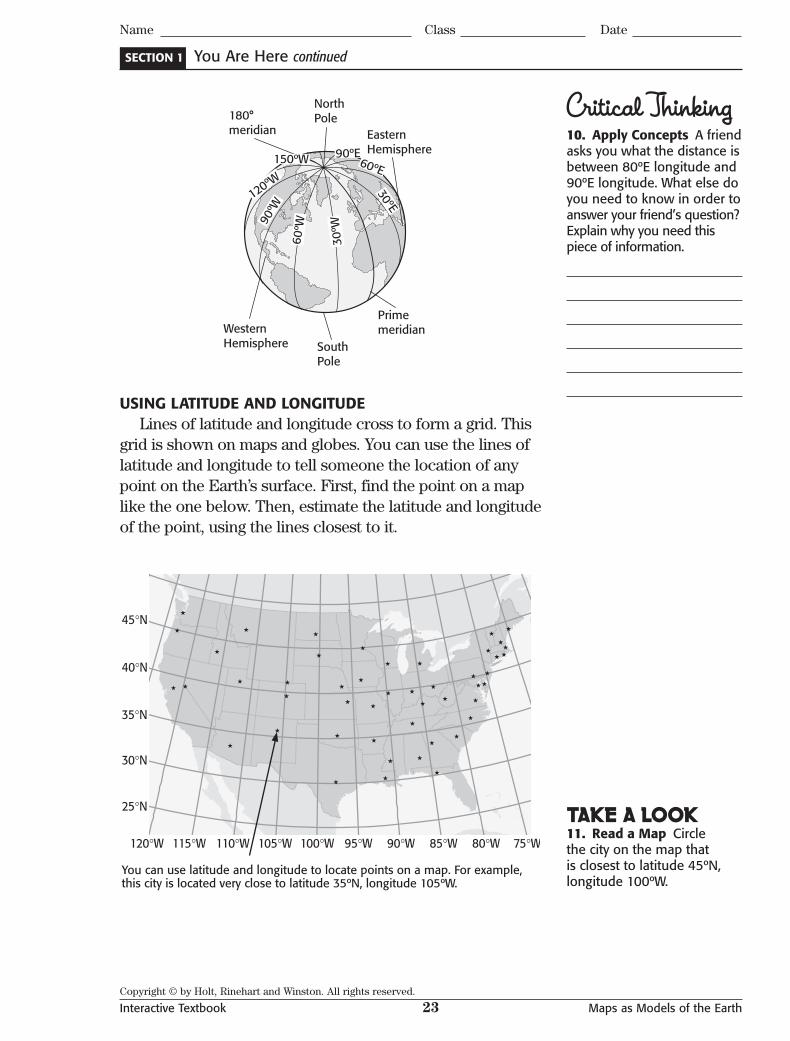
USING LATITUDE AND LONGITUDELines of latitude and longitude cross to form a grid. This
grid is shown on maps and globes. You can use the lines of latitude and longitude to tell someone the location of any point on the Earth’s surface. First, find the point on a map like the one below. Then, estimate the latitude and longitude of the point, using the lines closest to it.
45°N
40°N
35°N
30°N
25°N
115°W120°W 110°W 105°W 100°W 95°W 90°W 85°W 80°W 75°W
You can use latitude and longitude to locate points on a map. For example, this city is located very close to latitude 35ºN, longitude 105ºW.
Critical Thinking10. Apply Concepts A friend asks you what the distance is between 80ºE longitude and 90ºE longitude. What else do you need to know in order to answer your friend’s question? Explain why you need this piece of information.
TAKE A LOOK 11. Read a Map Circlethe city on the map that is closest to latitude 45ºN, longitude 100ºW.
Copyright © by Holt, Rinehart and Winston. All rights reserved.
Interactive Textbook 24 Maps as Models of the Earth
Name Class Date
SECTION VOCABULARY
equator the imaginary circle halfway between the poles that divides the Earth into the Northern and Southern Hemispheres
latitude the distance north or south from the equator; expressed in degrees
longitude the angular distance east or west from the prime meridian; expressed in degrees
magnetic declination the difference between the magnetic north and the true north
map a representation of the features of a physical body such as Earth
prime meridian the meridian, or line of longitude, that is designated as 0º longitude
true north the direction to the geographic North Pole
1. Explain How can you use a compass to find directions on Earth?
2. Compare Fill in the table below to compare latitude and longitude.
Name What it is Measured in Distance apartlatitude degrees always the same
longitude distance east or west of the prime meridian
3. Identify What is the latitude of the North Pole? What is the latitude of the South Pole?
4. Identify Where do all lines of longitude meet?
5. Describe What two lines divide the Earth into the Eastern and Western Hemispheres?
Section 1 Review
Copyright © by Holt, Rinehart and Winston. All rights reserved.
Interactive Textbook 25 Maps as Models of the Earth
SECTION
2 Mapping the Earth’s SurfaceMaps as Models of the Earth
Name Class Date
CHAPTER 2
After you read this section, you should be able to answer these questions:
• What is a map projection?
• What are four types of map projections?
• What information should every map have?
• What are four tools used by modern mapmakers?
What Happens When a Globe Becomes a Map?Because a globe is a sphere, a globe is the most accurate
model of Earth. However, a globe is too small to show many details of the Earth’s surface, such as roads and rivers. In order to show these details, we use maps.
A map is a flat model of Earth’s curved surface. Maps can show many details that globes cannot. However, moving information from a curved to a flat surface causes errors in shapes, sizes, and distances. These errors are called distortions.
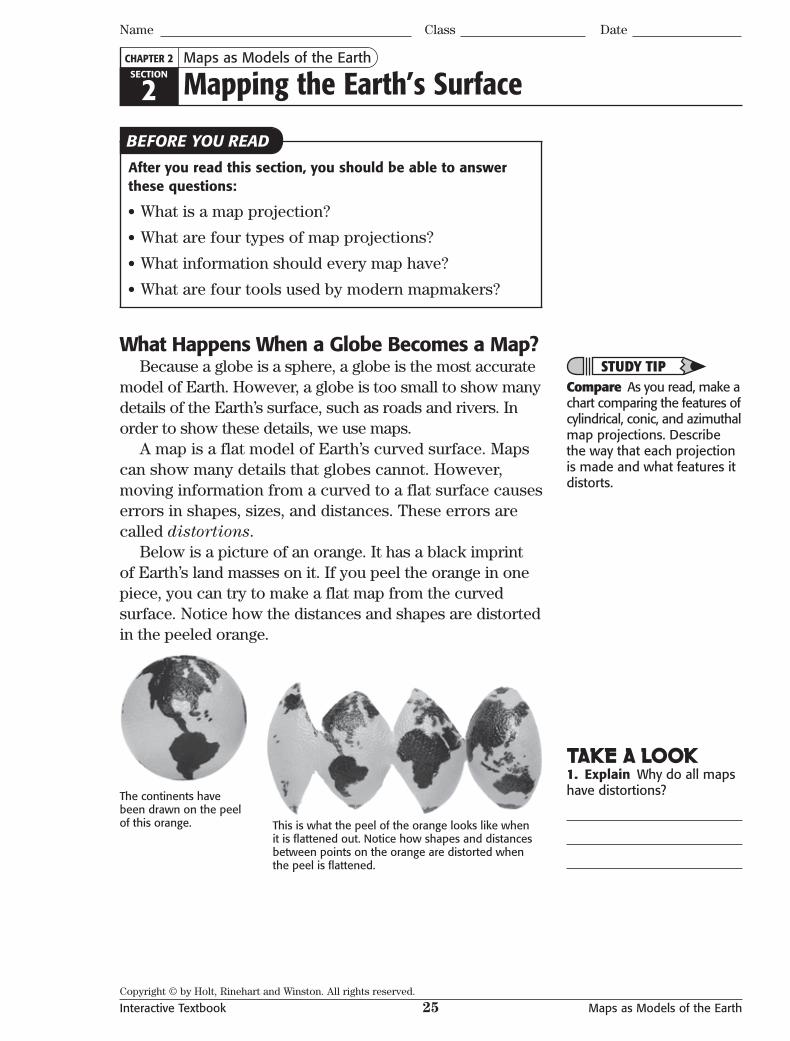
Below is a picture of an orange. It has a black imprint of Earth’s land masses on it. If you peel the orange in one piece, you can try to make a flat map from the curved surface. Notice how the distances and shapes are distorted in the peeled orange.
The continents have been drawn on the peel of this orange. This is what the peel of the orange looks like when
it is fl attened out. Notice how shapes and distances between points on the orange are distorted when the peel is fl attened.
BEFORE YOU READ
STUDY TIPCompare As you read, make a chart comparing the features of cylindrical, conic, and azimuthal map projections. Describe the way that each projection is made and what features it distorts.
TAKE A LOOK 1. Explain Why do all maps have distortions?
Copyright © by Holt, Rinehart and Winston. All rights reserved.
Interactive Textbook 26 Maps as Models of the Earth
SECTION 2
Name Class Date
Mapping the Earth’s Surface continued
What Are Map Projections?A map projection is a certain way of transferring the
curved surface of the Earth to a flat map. Mapmakers use map projections to move the image of the Earth’s curved surface onto a flat map.
To understand how map projections are made, think of a clear globe with a light inside it. If you wrap a piece of paper around the globe, the continents will make shadows on the paper. If you wrap the paper in different ways, the shadows will look different. Each way of wrap-ping the paper produces a different map projection.
There are four main kinds of map projections that mapmakers use—cylindrical, conic, azimuthal, and equal-area projections.
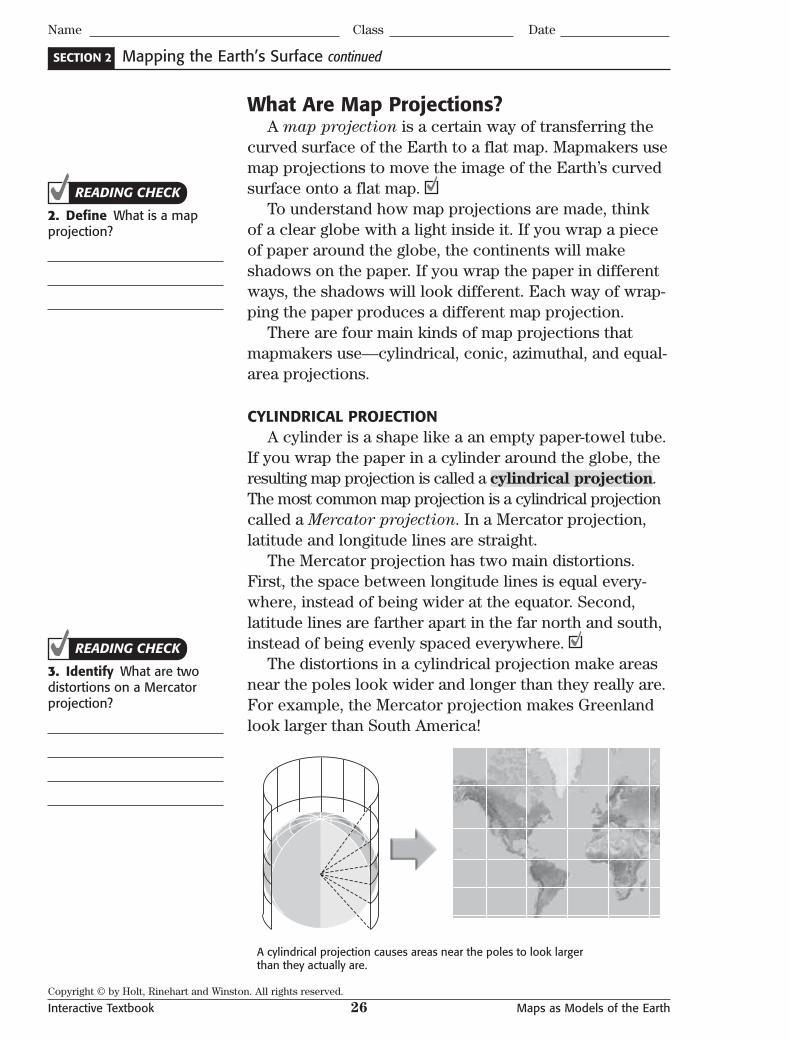
CYLINDRICAL PROJECTIONA cylinder is a shape like a an empty paper-towel tube.
If you wrap the paper in a cylinder around the globe, the resulting map projection is called a cylindrical projection.The most common map projection is a cylindrical projection called a Mercator projection. In a Mercator projection, latitude and longitude lines are straight.
The Mercator projection has two main distortions. First, the space between longitude lines is equal every-where, instead of being wider at the equator. Second, latitude lines are farther apart in the far north and south, instead of being evenly spaced everywhere.
The distortions in a cylindrical projection make areas near the poles look wider and longer than they really are. For example, the Mercator projection makes Greenland look larger than South America!
A cylindrical projection causes areas near the poles to look larger than they actually are.
READING CHECK
2. Defi ne What is a map projection?
READING CHECK
3. Identify What are two distortions on a Mercator projection?
Copyright © by Holt, Rinehart and Winston. All rights reserved.
Interactive Textbook 27 Maps as Models of the Earth
SECTION 2
Name Class Date
Mapping the Earth’s Surface continued
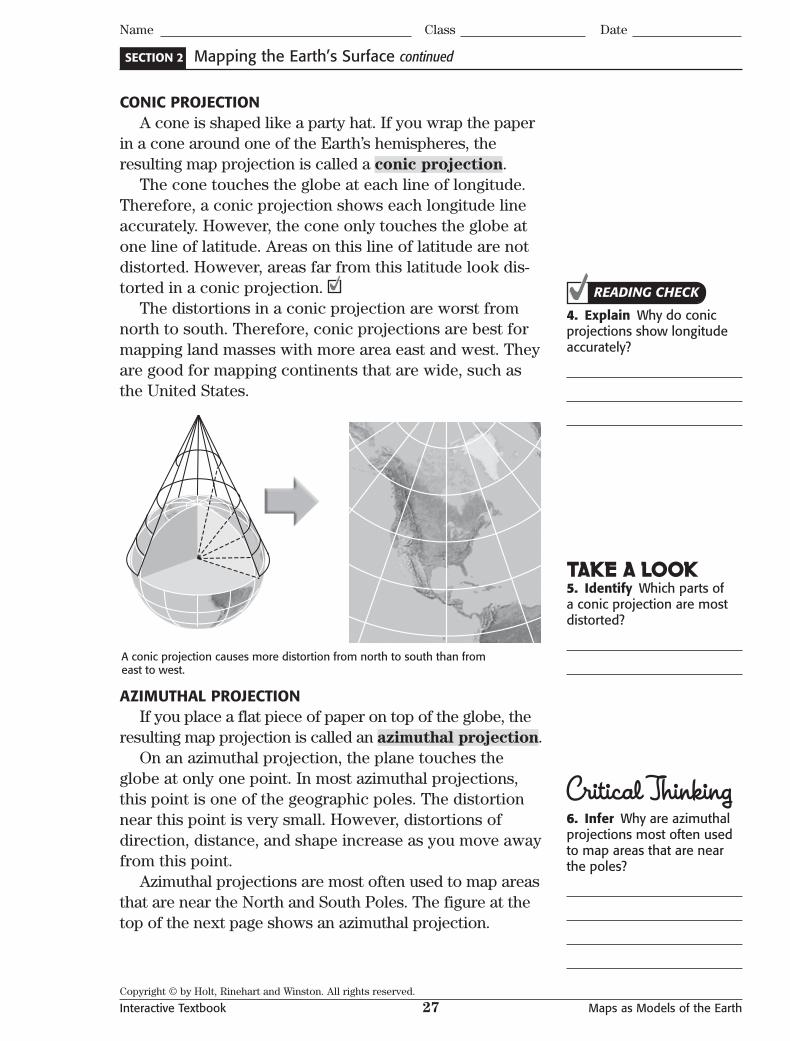
CONIC PROJECTIONA cone is shaped like a party hat. If you wrap the paper
in a cone around one of the Earth’s hemispheres, the resulting map projection is called a conic projection.
The cone touches the globe at each line of longitude. Therefore, a conic projection shows each longitude line accurately. However, the cone only touches the globe at one line of latitude. Areas on this line of latitude are not distorted. However, areas far from this latitude look dis-torted in a conic projection.
The distortions in a conic projection are worst from north to south. Therefore, conic projections are best for mapping land masses with more area east and west. They are good for mapping continents that are wide, such as the United States.
A conic projection causes more distortion from north to south than from east to west.
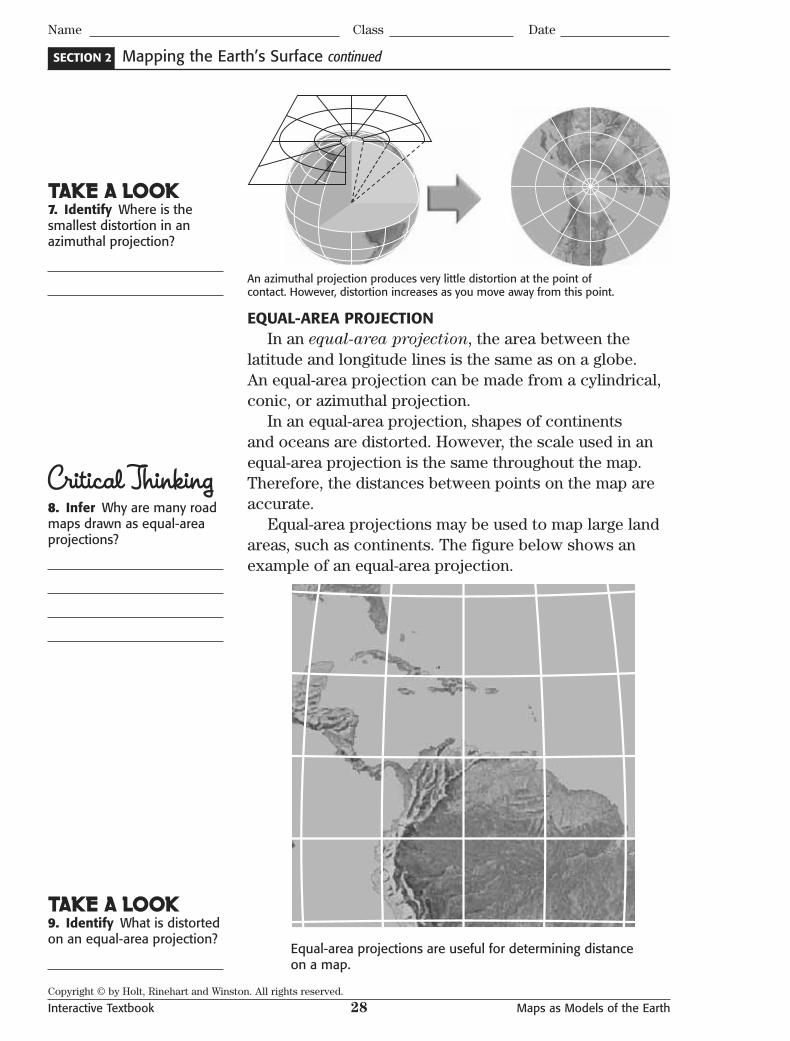
AZIMUTHAL PROJECTIONIf you place a flat piece of paper on top of the globe, the
resulting map projection is called an azimuthal projection.On an azimuthal projection, the plane touches the
globe at only one point. In most azimuthal projections, this point is one of the geographic poles. The distortion near this point is very small. However, distortions of direction, distance, and shape increase as you move away from this point.
Azimuthal projections are most often used to map areas that are near the North and South Poles. The figure at the top of the next page shows an azimuthal projection.
READING CHECK
4. Explain Why do conic projections show longitude accurately?
TAKE A LOOK 5. Identify Which parts of a conic projection are most distorted?
Critical Thinking6. Infer Why are azimuthal projections most often used to map areas that are near the poles?
Copyright © by Holt, Rinehart and Winston. All rights reserved.
Interactive Textbook 29 Maps as Models of the Earth
SECTION 2
Name Class Date
Mapping the Earth’s Surface continued
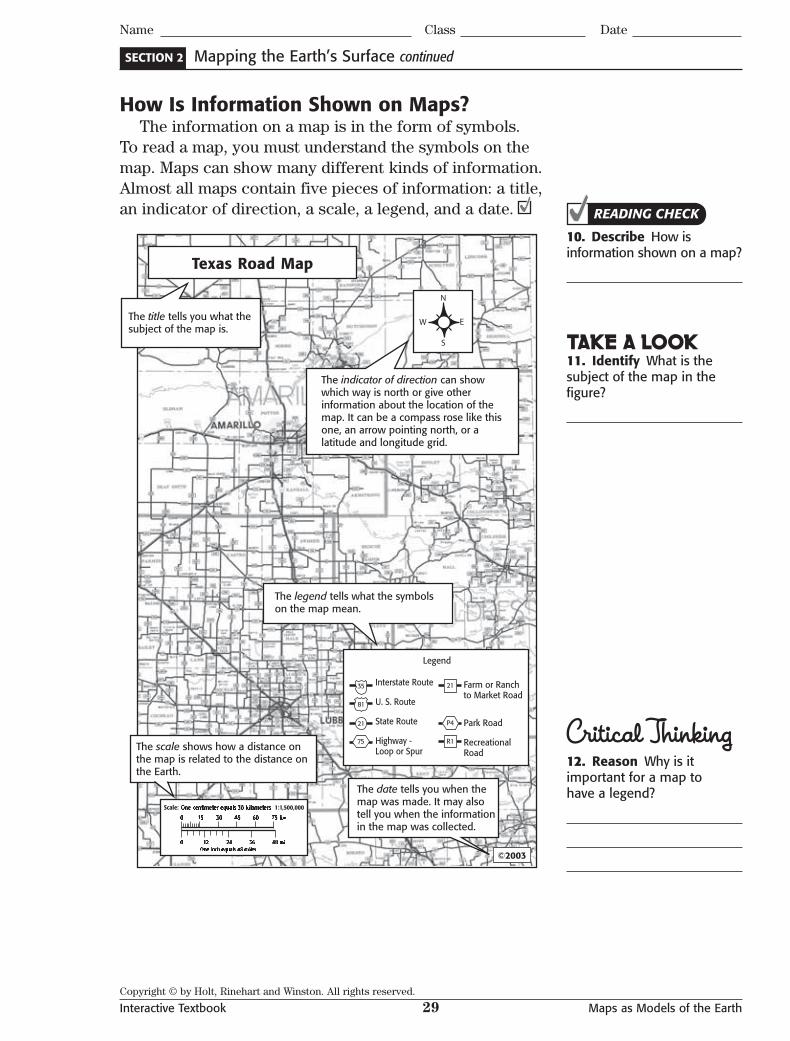
How Is Information Shown on Maps?The information on a map is in the form of symbols.
To read a map, you must understand the symbols on the map. Maps can show many different kinds of information. Almost all maps contain five pieces of information: a title, an indicator of direction, a scale, a legend, and a date.
Texas Road Map
©2003
Scale: 1:1,500,000
The title tells you what the subject of the map is.
The indicator of direction can show which way is north or give other information about the location of the map. It can be a compass rose like thisone, an arrow pointing north, or a latitude and longitude grid.
Farm or Ranchto Market Road
Park Road
RecreationalRoad
Legend
Interstate Route
U. S. Route
State Route
Highway - Loop or Spur
35
81
21
75 R1
21
P4
The legend tells what the symbols on the map mean.
The scale shows how a distance onthe map is related to the distance onthe Earth.
The date tells you when the map was made. It may also tell you when the information in the map was collected.
READING CHECK
10. Describe How is information shown on a map?
TAKE A LOOK 11. Identify What is the subject of the map in the fi gure?
Critical Thinking12. Reason Why is it important for a map to have a legend?
Copyright © by Holt, Rinehart and Winston. All rights reserved.
Interactive Textbook 30 Maps as Models of the Earth
SECTION 2
Name Class Date
Mapping the Earth’s Surface continued
How Are Maps Made?Much of the information used to make maps today
comes from remote sensing. Remote sensing is a way to gather information about an object without actually touching the object.
Today, most maps are made from photographs. Cameras on low-flying airplanes take the photographs. However, mapmakers are beginning to use new equipment that can be carried on satellites as well as airplanes.
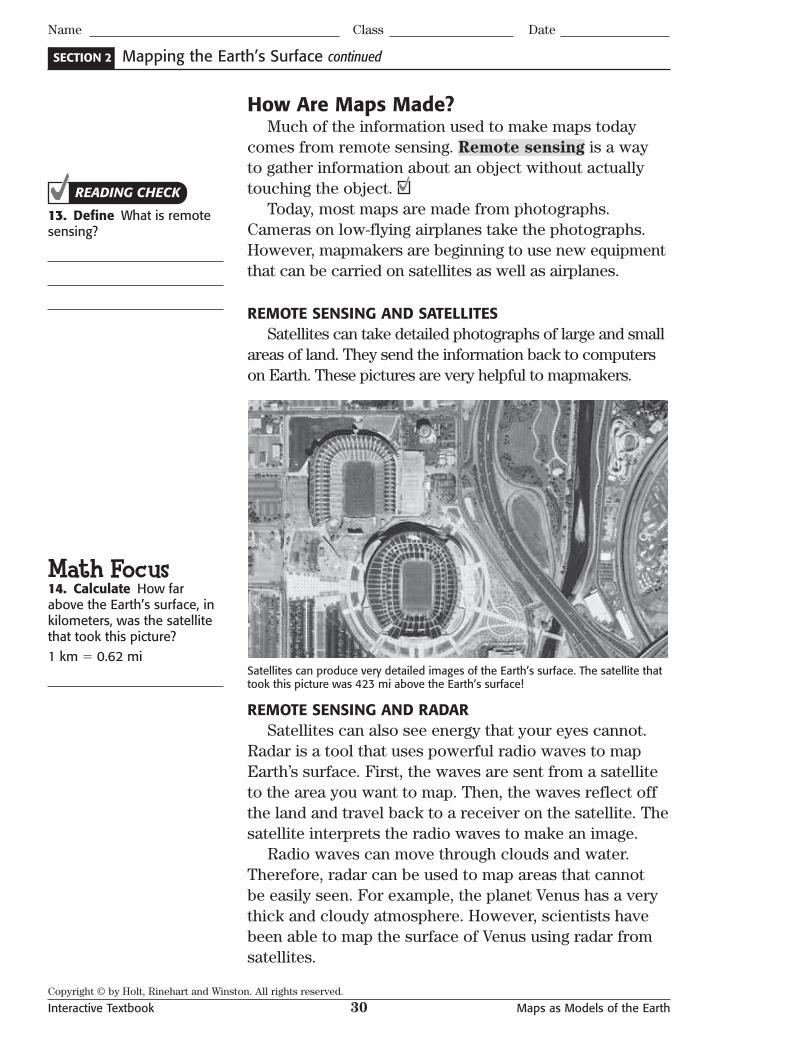
REMOTE SENSING AND SATELLITESSatellites can take detailed photographs of large and small
areas of land. They send the information back to computers on Earth. These pictures are very helpful to mapmakers.
Satellites can produce very detailed images of the Earth’s surface. The satellite that took this picture was 423 mi above the Earth’s surface!
REMOTE SENSING AND RADARSatellites can also see energy that your eyes cannot.
Radar is a tool that uses powerful radio waves to map Earth’s surface. First, the waves are sent from a satellite to the area you want to map. Then, the waves reflect off the land and travel back to a receiver on the satellite. The satellite interprets the radio waves to make an image.
Radio waves can move through clouds and water. Therefore, radar can be used to map areas that cannot be easily seen. For example, the planet Venus has a very thick and cloudy atmosphere. However, scientists have been able to map the surface of Venus using radar from satellites.
READING CHECK
13. Defi ne What is remote sensing?
Math Focus14. Calculate How far above the Earth’s surface, in kilometers, was the satellite that took this picture?1 km � 0.62 mi
Copyright © by Holt, Rinehart and Winston. All rights reserved.
Interactive Textbook 31 Maps as Models of the Earth
SECTION 2
Name Class Date
Mapping the Earth’s Surface continued
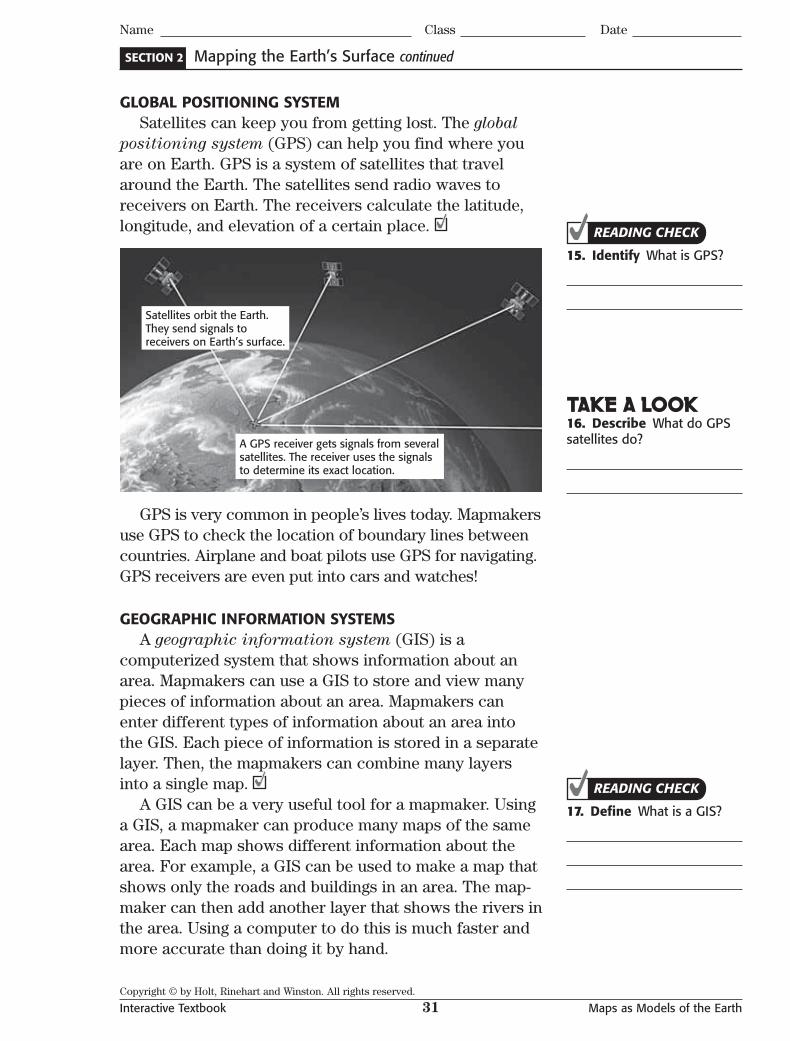
GLOBAL POSITIONING SYSTEMSatellites can keep you from getting lost. The global
positioning system (GPS) can help you find where you are on Earth. GPS is a system of satellites that travel around the Earth. The satellites send radio waves to receivers on Earth. The receivers calculate the latitude, longitude, and elevation of a certain place.
Satellites orbit the Earth. They send signals to receivers on Earth’s surface.
A GPS receiver gets signals from several satellites. The receiver uses the signals to determine its exact location.
GPS is very common in people’s lives today. Mapmakers use GPS to check the location of boundary lines between countries. Airplane and boat pilots use GPS for navigating. GPS receivers are even put into cars and watches!
GEOGRAPHIC INFORMATION SYSTEMSA geographic information system (GIS) is a
computerized system that shows information about an area. Mapmakers can use a GIS to store and view many pieces of information about an area. Mapmakers can enter different types of information about an area into the GIS. Each piece of information is stored in a separate layer. Then, the mapmakers can combine many layers into a single map.
A GIS can be a very useful tool for a mapmaker. Using a GIS, a mapmaker can produce many maps of the same area. Each map shows different information about the area. For example, a GIS can be used to make a map that shows only the roads and buildings in an area. The map-maker can then add another layer that shows the rivers in the area. Using a computer to do this is much faster and more accurate than doing it by hand.
READING CHECK
15. Identify What is GPS?
TAKE A LOOK 16. Describe What do GPS satellites do?
READING CHECK
17. Defi ne What is a GIS?
Copyright © by Holt, Rinehart and Winston. All rights reserved.
Interactive Textbook 32 Maps as Models of the Earth
Name Class Date
Section 2 Review SECTION VOCABULARY
azimuthal projection a map projection that is made by moving the surface features of the globe onto a plane
conic projection a map projection that is made by moving the surface features of the globe onto a cone
cylindrical projection a map projection that is made by moving the surface features of the globe onto a cylinder
remote sensing the process of gathering and analyzing information about an object without physically being in touch with the object
1. Compare How is a conic projection different from a cylindrical projection? How are they similar?
2. List What are five pieces of information that are found on all maps?
3. Identify Which type of map projection is most useful for showing the distances between two points on the Earth?
4. Explain Which type of map projection is often used to map the United States?
5. Describe Why is radar useful for mapping areas that are covered by clouds?
6. Identify Give three types of technology that mapmakers use to make maps.
Copyright © by Holt, Rinehart and Winston. All rights reserved.
Interactive Textbook 33 Maps as Models of the Earth
SECTION
3 Topographic MapsMaps as Models of the Earth
Name Class Date
CHAPTER 2
After you read this section, you should be able to answer these questions:
• What is a topographic map?
• How do topographic maps show the features of the Earth’s surface?
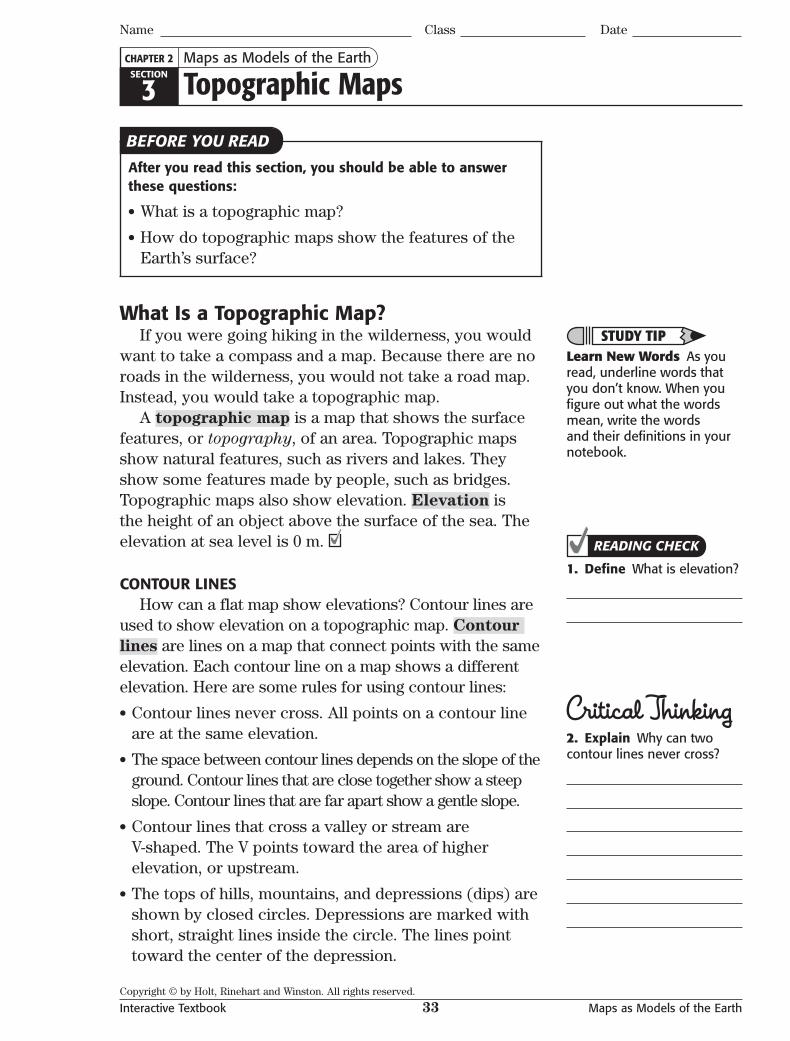
What Is a Topographic Map?If you were going hiking in the wilderness, you would
want to take a compass and a map. Because there are no roads in the wilderness, you would not take a road map. Instead, you would take a topographic map.
A topographic map is a map that shows the surface features, or topography, of an area. Topographic maps show natural features, such as rivers and lakes. They show some features made by people, such as bridges. Topographic maps also show elevation. Elevation is the height of an object above the surface of the sea. The elevation at sea level is 0 m.
CONTOUR LINESHow can a flat map show elevations? Contour lines are
used to show elevation on a topographic map. Contour
lines are lines on a map that connect points with the same elevation. Each contour line on a map shows a different elevation. Here are some rules for using contour lines:
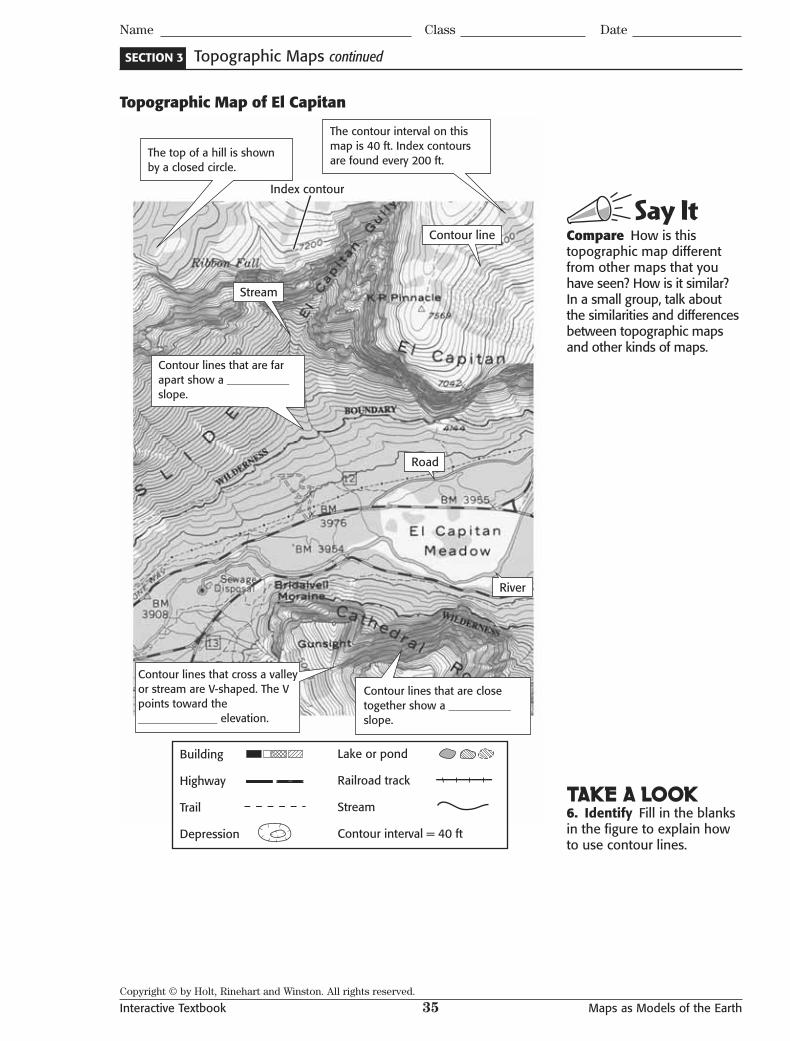
• Contour lines never cross. All points on a contour line are at the same elevation.
• The space between contour lines depends on the slope of the ground. Contour lines that are close together show a steep slope. Contour lines that are far apart show a gentle slope.
• Contour lines that cross a valley or stream are V-shaped. The V points toward the area of higher elevation, or upstream.
• The tops of hills, mountains, and depressions (dips) are shown by closed circles. Depressions are marked with short, straight lines inside the circle. The lines point toward the center of the depression.
BEFORE YOU READ
STUDY TIPLearn New Words As you read, underline words that you don’t know. When you fi gure out what the words mean, write the words and their defi nitions in your notebook.
READING CHECK
1. Defi ne What is elevation?
Critical Thinking2. Explain Why can two contour lines never cross?
Copyright © by Holt, Rinehart and Winston. All rights reserved.
Interactive Textbook 34 Maps as Models of the Earth
SECTION 3
Name Class Date
Topographic Maps continued
CONTOUR INTERVALS AND RELIEFEach contour line represents a certain elevation. The
difference in elevation between one contour line and the next is called the contour interval. For example, a map with a contour interval of 20 m has contour lines drawn at 0 m, 20 m, 40 m, and so on. The contour interval of a map is usually given in or near the map’s legend. The con-tour interval on a map is based on the relief in the area.
Relief is the difference in elevation between the high-est and lowest points in the area on the map. Mountains have high relief. They are usually mapped with large contour intervals. Plains have low relief. They are usually mapped with small contour intervals.
INDEX CONTOURSThe many contour lines on a map can make it hard to
read. An index contour is used to make reading the map easier. An index contour is a darker, heavier contour line that is labeled with an elevation. In most maps, every fifth contour line is an index contour. For example, a map with a contour interval of 20 m may have index contours at 0 m, 100 m, 200 m, and so on.
COLORSTopographic maps use colors and symbols to show
different features of Earth’s surface. Buildings, bridges, and railroads are shown by special symbols drawn in black. Contour lines are brown. Major roads are red. Bodies of water are blue. Wooded areas are shaded in green. Cities are shaded in gray or red.
Topographic maps contain a lot of information. This information can be confusing at first. However, if you practice, you will be able to read topographic maps more easily. When you look at a topographic map, ask yourself these questions to help you read the map:
• What area does the map show?
• What is the contour interval of the map?
• What is the relief of the area in the map?
• What kinds of features are shown on the map?
The map on the next page is an example of a topographic map. Try to answer the four questions above for the map on the next page.
READING CHECK
3. Defi ne What is a contour interval?
Math Focus4. Calculate A map has index contours at 250 m, 500 m, and 750 m. What is the contour interval?
READING CHECK
5. Identify How do topographic maps show information?
Copyright © by Holt, Rinehart and Winston. All rights reserved.
Interactive Textbook 36 Maps as Models of the Earth
Name Class Date
Section 3 Review SECTION VOCABULARY
contour interval the difference in elevation between one contour line and the next
contour lines lines which connect points on a map that are at the same elevation
elevation the height of an object above the surface of the sea
index contour on a map, a darker, heavier contour line that is usually every fi fth line and that indicates a change in elevation
relief the difference between the highest and lowest elevations in a given area; the variations in elevation of a land surface
topographic map a map that shows the surface features of Earth
1. Define What are contour lines?
2. Explain What is the relationship between the relief of an area and the contour interval on a map of the area?
3. Describe Complete the table to show how colors are used on topographic maps.
Feature Color on a topographic mapContour lines
blue
Major roads
Buildings and bridges
green
Cities
4. Identify Give three features that are shown on topographic maps.
5. Calculate The highest point on a topographic map is marked as 345 m. The lowest contour line is at 200 m. What is the relief of the area in the map?
6. Describe How is the top of a mountain shown on a topographic map?