Embed Size (px)
Citation preview

Chapter 2Porosity, Pore Size Distribution,Micro-structure
Mike Lawrence and Yunhong Jiang
Abstract The high porosity and microstructure of bio-aggregates are fundamentalto their physical properties. Typically they have a low density and a complex porestructure. This has two principal effects. In the first instance, low density is asso-ciated with low strength, but also with low thermal conductivity. For this reasonmost bio-aggregates are not suitable for use as structural materials, but are emi-nently suited to act as a low density filler in composite materials conferring lowthermal conductivity on the resulting bio-composite. The complex nature of theirporosity results in a material that is able to readily adsorb moisture and humidity.This results in a material that has an exceptionally high moisture buffering capacity,a characteristic that is of great interest in building materials, because it tends tostabilise the internal environment of a building, thereby resulting in a much morehealthy indoor environment. This chapter considers the range of methods that canbe used to measure porosity and to characterise the microstructure of materials ingeneral, and discusses how some of these techniques have been used onbio-aggregates. It also identifies opportunities to use novel techniques onbio-aggregates in order to improve our understanding of their porosity, pore sizedistribution, pore connectivity and microstructure, all of which are characteristicsthat are essential to the optimisation of the performance of bio-aggregates within theconstruction industry.
Keywords Porosity � Microstructure � Physisorption � Mercury IntrusionPorosimetry � Scanning Electron Microscopy � X-Ray Computed Tomography
M. Lawrence (&) � Y. JiangBRE Centre for Innovative Construction Materials, University of Bath,Bath BA2 7AY, UKe-mail: [email protected]
© RILEM 2017S. Amziane and F. Collet (eds.), Bio-aggregates Based Building Materials,RILEM State-of-the-Art Reports 23, DOI 10.1007/978-94-024-1031-0_2
39

2.1 Introduction
Porosity is a measure of the void fraction in a material. Voids can either be ‘closed’,and inaccessible or ‘open’ and connected to other voids and thence to the exterior ofthe material. The total porosity (ϕ) is defined by the ratio of the volume of voidspace (VV) to the total, or bulk volume of the material (VT):
/ ¼ VV
VT
Porosity can also be expressed as a percentage of the bulk volume of thematerial. In bio-aggregates the pores are formed during the growth phase of theplant and in the living plant they have the function of nutrient storage and trans-mission of water and nutrients from the roots to the rest of the plant. Plant stemshave a low density of between 110 and 120 kg.m−3 and a high porosity of the orderof 70–80%. The specific properties of bio-aggregates, such as low density, highporosity and the complexity of pore size and pore structure, result in a material thathas a low thermal conductivity, and which is highly absorbent, capable of absorbingup to four times its own weight in water. Once the shiv has been dried out it has ahigh moisture buffer value, conferring on it the ability to passively manage internalhumidity levels when used as a building material (Latif et al. 2015).
Porosity is a rather easy parameter to define, but certainly not so easy toquantify. The reason is that the void/space in bio-aggregates can span from fewnanometres to centimetres or larger. There is really no one method that can ade-quately cover this enormous range in scale. In addition, the porosity can be mod-ified or changed by a variety of processes during the test such as deformation,hydrothermal alteration and producing secondary or fracture porosity. Finally, thepore shape and connection structure (open and closed) have a significant effect onthe porosity results depending on the testing approach (Bismarck 2002; Brewer2014; Chundawat 2011; Collet 2008; Donato 2012; Hamdi 2015; Dougal et al.2006). The aims of this chapter is to summarize many of the available techniquesthat can be used to analyse the porosity of bio-aggregate materials. Manger et al.(1963) concluded that most of the total porosity measurements are variations onbulk volume/grain volume or bulk density/grain density approaches, and theapparent porosity measurements are made by variations of absorption methods fordifferent fluids or gases. Anovitz et al. (2015) summarized 10 methods for mea-suring the porosity and pore size distribution (PSD) used on core or crushed rockmaterials (Fig. 2.1). This shows the range of pore sizes that each method is capableof measuring. It should be kept in mind that different techniques are based ondifferent principles and have different capability for measurement. Depending onthe natural properties of bio-aggregates, there is no best approach to determine their
40 M. Lawrence and Y. Jiang

porosity. The combination of several techniques and comparing the results of porestructure from different methods may gain an insight into the complex pore systemof bio-aggregates.
2.2 Techniques Used to Measure Porosity
2.2.1 Imaging Methods
With the development of digital images and computer software, image processing isa new and convenient method which is able to determine the pore size, pore sizedistribution, porosity and microstructure of bio-aggregates. There has been muchprogress in materials science, biology, and geology regarding the application ofimage analyse. It has become an important technique for the investigation of theporosity and particle size of bio-aggregates and bio-composites (Mermut et al.2009; Ziel et al. 2008; Nimmo et al. 2004; Aydilek et al. 2002; Shen 2015). A broadrange of imaging methods are available to describe the nature of porosity inbio-aggregates materials. 2D techniques that can be used include: optical lightmicroscopy (OM), scanning electron microscopy (SEM) with energy dispersiveX-ray spectroscopy (EDX), field emission scanning electron microscopy (FESEM),
Fig. 2.1 Methods used to determine porosity and pore size distribution (PSD) (Anovitz and Cole2015)
2 Porosity, Pore Size Distribution, Micro-structure 41

focused ion beam (FIB), transmission electron microscopy (TEM). The range of 3Dtechniques available include: nuclear magnetic resonance (NMR), atomic forcemicroscopy (AFM) and X-ray tomography (Anovitz et al. 2015). Based on theimages of samples, computer image processing can be considered as an additionalmethod of sample analysis. There are a wide range of image processing softwareavailable to analyse images, including ImageJ, MATLAB, ICY, Avizo, Image Proand others (Grove et al. 2011; Yang et al. 2014). 2D image analysis allows themeasurement of parameters such as pore or particle shape, pore or particle size andsize distribution, spatial distribution of particles, and also the corresponding mea-surements for vesicles. With the use of stereology and/or 3D texture models, it ispossible to investigate the meaning of these 2D measurements in the 3D volume.The 3D image analysis provides a direct way of testing the 3D particle/pore sizemeasurements using X-ray tomography. Dougal et al. (2006) summarized thefeatures and limitations of 2D and 3D image analysis method (Fig. 2.2).
2.2.1.1 Optical Microscopy
Optical Microscopy has been used since the 17th century when it was first used byRobert Hooke to describe ‘…minute bodies made by magnifying glasses withobservations and inquiries thereupon.’ Since that time the optical microscope hasbeen refined to produce the range of modern research microscopes used in labo-ratories today.
Transmitted Light Microscopy uses light that is transmitted from a source on theopposite side of the specimen to the objective lens. Normally the light is passedthrough a condenser to focus it on the specimen in order to maximise the amount oflight available. The optimum set-up for specimen illumination and image genera-tion is known as Köhler illumination after the man who invented it. It is used formost of the optical configurations listed below. The microscope techniquesrequiring a transmitted light path include bright field, dark field, phase contrast,polarisation and differential interference contrast optics. Transmitted light micro-scopy relies on preparing samples that are sufficiently thin to allow the passage oflight. Some materials remain opaque even when ground to a thickness of 30 µm,and for this reason reflected light microscopes have been developed. The sample isoften polished to a high degree in order to allow all the features to be seen in thesame plane, and therefore remain in focus. Samples are illuminated from abovethrough the objective.
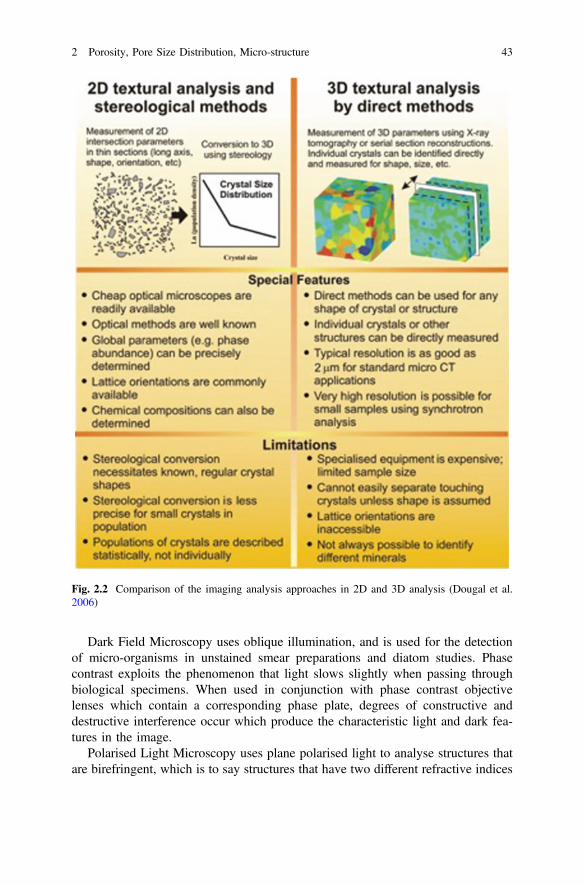
Bright Field Microscopy is the most frequently used technique where no opticalcontrast methods are used. It uses transmitted light to view a specimen that containsinherent contrast or where the specimen has been stained to improve contrast.Figure 2.3 shows a transverse section of Hemp shiv that has been set in a bluestained resin under a ×10 magnification and Fig. 2.4 shows the central section ofthe same specimen under ×40 magnification.
42 M. Lawrence and Y. Jiang
Dark Field Microscopy uses oblique illumination, and is used for the detectionof micro-organisms in unstained smear preparations and diatom studies. Phasecontrast exploits the phenomenon that light slows slightly when passing throughbiological specimens. When used in conjunction with phase contrast objectivelenses which contain a corresponding phase plate, degrees of constructive anddestructive interference occur which produce the characteristic light and dark fea-tures in the image.
Polarised Light Microscopy uses plane polarised light to analyse structures thatare birefringent, which is to say structures that have two different refractive indices
Fig. 2.2 Comparison of the imaging analysis approaches in 2D and 3D analysis (Dougal et al.2006)
2 Porosity, Pore Size Distribution, Micro-structure 43
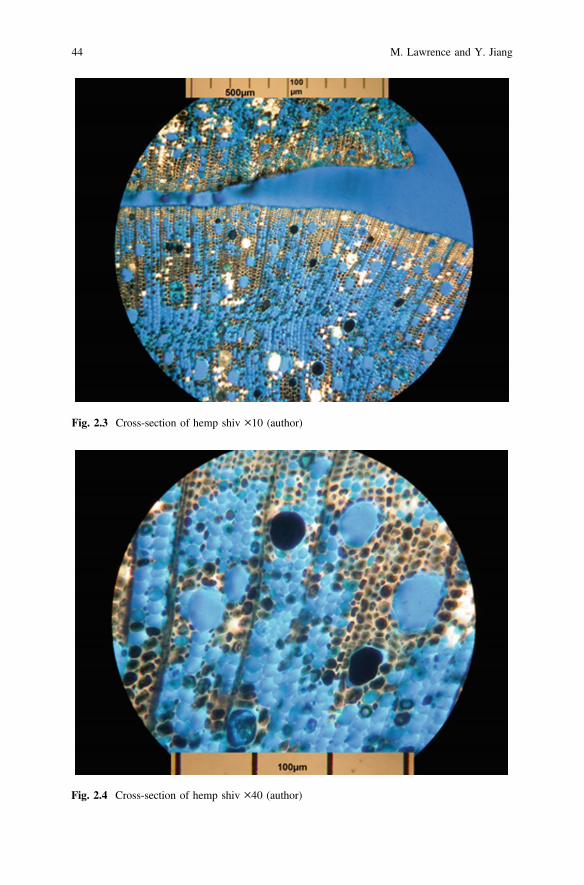
Fig. 2.3 Cross-section of hemp shiv ×10 (author)
Fig. 2.4 Cross-section of hemp shiv ×40 (author)
44 M. Lawrence and Y. Jiang
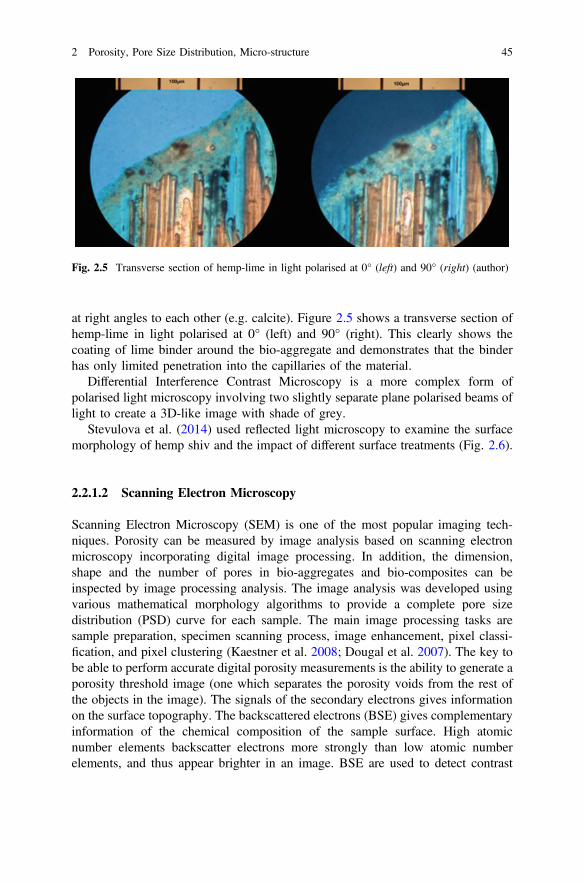
at right angles to each other (e.g. calcite). Figure 2.5 shows a transverse section ofhemp-lime in light polarised at 0° (left) and 90° (right). This clearly shows thecoating of lime binder around the bio-aggregate and demonstrates that the binderhas only limited penetration into the capillaries of the material.
Differential Interference Contrast Microscopy is a more complex form ofpolarised light microscopy involving two slightly separate plane polarised beams oflight to create a 3D-like image with shade of grey.
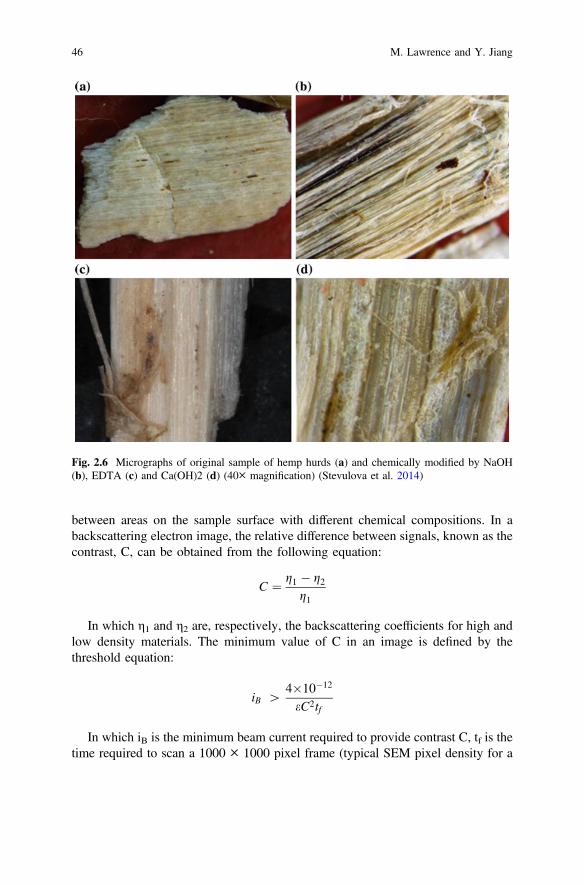
Stevulova et al. (2014) used reflected light microscopy to examine the surfacemorphology of hemp shiv and the impact of different surface treatments (Fig. 2.6).
2.2.1.2 Scanning Electron Microscopy
Scanning Electron Microscopy (SEM) is one of the most popular imaging tech-niques. Porosity can be measured by image analysis based on scanning electronmicroscopy incorporating digital image processing. In addition, the dimension,shape and the number of pores in bio-aggregates and bio-composites can beinspected by image processing analysis. The image analysis was developed usingvarious mathematical morphology algorithms to provide a complete pore sizedistribution (PSD) curve for each sample. The main image processing tasks aresample preparation, specimen scanning process, image enhancement, pixel classi-fication, and pixel clustering (Kaestner et al. 2008; Dougal et al. 2007). The key tobe able to perform accurate digital porosity measurements is the ability to generate aporosity threshold image (one which separates the porosity voids from the rest ofthe objects in the image). The signals of the secondary electrons gives informationon the surface topography. The backscattered electrons (BSE) gives complementaryinformation of the chemical composition of the sample surface. High atomicnumber elements backscatter electrons more strongly than low atomic numberelements, and thus appear brighter in an image. BSE are used to detect contrast
Fig. 2.5 Transverse section of hemp-lime in light polarised at 0° (left) and 90° (right) (author)
2 Porosity, Pore Size Distribution, Micro-structure 45
between areas on the sample surface with different chemical compositions. In abackscattering electron image, the relative difference between signals, known as thecontrast, C, can be obtained from the following equation:
C ¼ g1 � g2g1
In which η1 and η2 are, respectively, the backscattering coefficients for high andlow density materials. The minimum value of C in an image is defined by thethreshold equation:
iB [4�10�12
eC2tf
In which iB is the minimum beam current required to provide contrast C, tf is thetime required to scan a 1000 × 1000 pixel frame (typical SEM pixel density for a
Fig. 2.6 Micrographs of original sample of hemp hurds (a) and chemically modified by NaOH(b), EDTA (c) and Ca(OH)2 (d) (40× magnification) (Stevulova et al. 2014)
46 M. Lawrence and Y. Jiang
photomicrograph), and ɛ is the detector “efficiency” (ratio of signal current to beamcurrent). The ultimate resolution available with SEM is on the order of 0.5 µm(Zhao et al. 1992).
There are many factors affecting the calculated results, such as the thin sectionthickness, threshold value, and pore circularity (Anovitz et al. 2015; Marinello et al.2008). Poor quality data can arise from the introduction of noise and inadequate oroverzealous pre-processing methods, increasing user bias during thresholding. Thekind of sample preparation required of the sample depends on whether it is elec-trically conducting or not. Non-conductive samples must first be sputter coated withan ultra-thin coating of an electrically-conducting material before imaging.Otherwise, samples will tend to charge when scanned by the electron beam leadingto scanning faults and other image artifacts. The advantages of the SEM overoptical petrography are greater depth of field and resolution, and a significantlyhigher magnification range. It can provide direct and detailed structural informationincluding the shape and size of individual pore inside the bio-aggregates. Theassumptions about pore shape are not made, but rather images capture this infor-mation directly. The disadvantage of SEM is that the obtained images are exactlytwo-dimensional grey scale image. The SEM images showed partly the innerstructure of the samples and they cannot be considered completely as sections. Itunderestimates the pore radius due to only working part of the pore. However,Image-based analyses have been used to extract meaningful quantities whichcharacterize pore structure and describe several spatial characteristics of porosity.Mathematical correction techniques are necessary to estimate unbiased pore bodyand opening sizes. Sizing techniques, a two-point correlation technique, and fractalanalysis can be used to analysis the individual pore size, shape and distribution(Zhao et al. 1992).
During the past ten years, SEM image analysis has become an important tool formicroscopic studies of bio-aggregates based materials. SEM images have been usedto study aspects of bio-aggregates porosity by several researchers. Walker andPavia (2014) studied the microstructure and pore size of hemp lime concrete usingFESEM. The results showed that the morphology of hemp interface changed overtime, from predominantly needle-shape at early ages to sponge and gel types at laterages. A wide distribution of pore size was evident in all binders. Most pores rangedfrom 200 to 2000 nm. Lubelli et al. (2013) studied porosity and pore size distri-bution of a wet poultice by using a FIB-SEM with a cold stage and MIP. Theincremental and cumulative pore diameter distribution obtained using cryo-SEMimage method showed the prevalence of pore radii in the range of 100 nm. The totalpore fraction varies between 26 and 44% and the mean pore radius between 110 and160 nm. The total pore area obtained by image analysis was 44%, which is sig-nificantly smaller than the total pore volume measured by MIP (57.93%). This ismight be due to the absence of pores diameter larger than 1.2 µm in the studiedcryo-SEM images (Lubelli et al. 2013). Chundawat et al. (2011) studied the shape,size (10–1000 nm), and spatial distribution of the pores on their location within thecell wall and the cell wall volume, ranged between 0.005 and 0.05 nm2 per nm3 by
2 Porosity, Pore Size Distribution, Micro-structure 47

using TEM-image analysis. Figure 2.7 showed how water was likely incorporatedin additional hydrates resulting in weight gain (7 wt%) of the hemp-lime concreteand abundant needle shaped hydrates are growing into the pores suggesting areduction in pore size (Walker 2014).
There are a large number of papers which discuss SEM image analysisapproaches to the analysis of the pore size distribution and pore shape of soil andmembrane materials. However, there only few papers that use the SEM imageanalysis method to study porosity and pore distribution on bio-aggregates. Sassoniet al. (2014) have used SEM to visualise the microstructure of bio-aggregatecomposites (Fig. 2.8), but did not use the information to analyse the pore structureor pore size distribution.
Fig. 2.7 Hydrates in hemp lime concrete made with commercial binder (a) and in-creasedquantity of hydrates in the binder of hemp concrete saturated with water for 2 weeks (Walker et al.2014)
Fig. 2.8 Visualisation of the microstructure of low density (a and b), medium density (c and d) andhigh density (e and f) hemp shiv-magnesium oxide composites (Sassoni et al. 2014)
48 M. Lawrence and Y. Jiang
The SEM image analysis methods demonstrate the ability to quantify the natureof porosity in complex heterogeneous matrices. In the bio-aggregates, there is ahierarchy of pore types that range from micro-pore to organic meso-pore to fracturemacro-pores. For future experimental work, SEM image analysis approach will bean important technique for analysing the porosity of bio-aggregate materials.
2.2.1.3 X-Ray Computed Tomography
X-ray computed tomography (XRCT) has been used to characterize the cellularmicrostructure and porosity of bio-aggregates materials. This method can producethe non-destructive and three-dimensional images to quantify the micro-structuresuch as pore size distribution, porosity and tortuosity of the porous network. X-rayradiography physics is based on the Beer-Lambert law (Maire et al. 2001; Dougalet al. 2007; Roche et al. 2010). Pore are distinguished in X-XRCT on the basis oftheir linear attenuation coefficient, µ. This parameter depends on the electrondensity of the sample, the effective atomic number of the sample, and the energy ofthe incoming X-ray beam. XRCT comprises an X-ray source, a rotation state onwhich the object is fixed, an X-ray detector and a reconstruction software (Dougalet al. 2007). Construction of a 3D map of a specimen, several X-ray radiographs ofthe sample are recorded at different viewing angles. This imaging information isthen used in reconstruction software to recalculate the 3D map of the attenuationfrom the combination of the obtained radiographs. The Fig. 2.9 shows the stagesfrom image capture through to processing and finally to reconstructed 3D virtualtexture ready for quantification. The crucial point in applying tomography tomaterials science is the achievable spatial resolution. For a limit resolution of theorder of 8 µm, a cone-beam system can be used with a classical micro-focus X-raytube as the source. Most recent lab systems routinely achieve resolution as low as5 µm. Larger samples have a lower resolution, limited by the number of pixels. Thebest quality images in terms of signal-to-noise ratio and spatial resolution allowinghigh-resolution micro-tomography are obtained on synchrotron radiation (Maireet al. 2012).
There are several disadvantages about XRCT porosity analysis. These include:3D methods are not always applicable if samples are too large or small; it is veryexpensive and cannot distinguish touching grains of the same mineral; nor can itclearly separate different minerals with very similar properties.
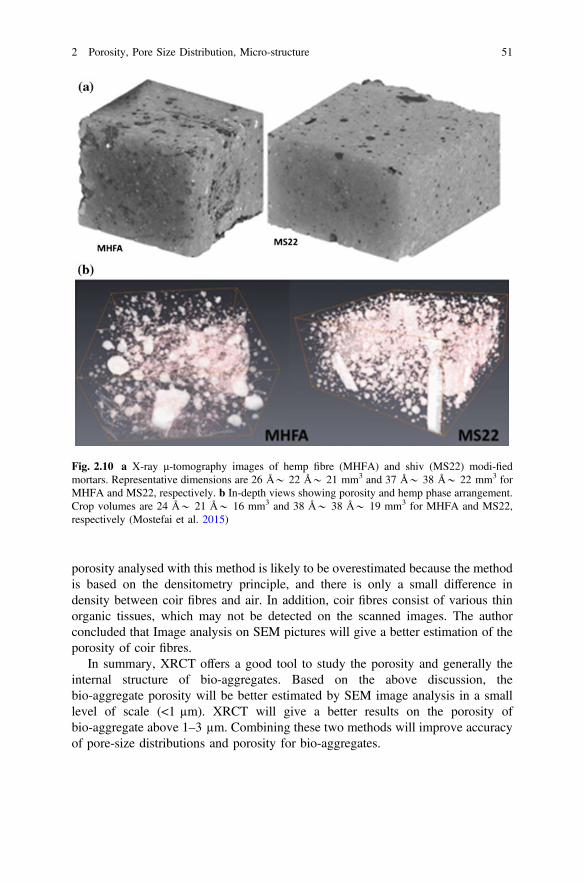
Mostefai et al. (2015) investigated microstructural effects of hemp fibre and shivaddition on modified mortars by using X-ray tomography. Results showed thatporosity level in hemp shiv modified mortar with regard to the weight content of 2wt%, is 5.08%; whereas, porosity in the case of hemp fibre modified mortar is3.54%. Both of hemp filler play a significant role in triggering the porosity content.The porosity of wood bark insulation board was studied by using XRCT
2 Porosity, Pore Size Distribution, Micro-structure 49

(Fig. 2.10). The results showed that pore size distribution is clearly influenced bythe panel density and the small pores (<1 mm2) are predominantly pores within thebark materials itself. In addition, larger pores (>1 mm2) are void due to imperfectstacking during the press process.
Pores smaller than 1 mm2 account for between 8 and 30% of the pore area (Kainet al. 2015). William et al. (2015) studied the volumetric ratios change of visible airvoids related to consolidation process in the level of macro scale by using XRCT.The results showed that the ratio of macro scale air voids to micro scale air voidschanged significantly during the consolidating process. Hamdi et al. (2015) studiedand compared the X-ray computed tomography and 2D image analysis on ligno-cellulosic fibres raw materials. The strengths and drawbacks of the applied imagingmethods on lignocellulosic materials are listed in Table 2.1.
Tran et al. (2015) studied the porosity of coir fibre by using SEM image analysisand XRCT analysis. The results from SEM methods with software Leica QWinshowed that the fibre porosity is in the range from 22 to 30% (Fig. 2.11). In reality,the lumen of each elementary fibre is not a cylinder. In this case, the volume oflumens can be underestimated when a smaller cross section is analysed. Theporosity of the coir fibres using XRCT methods, ranges from 27 to 40%. The fibre
Fig. 2.9 Measuring 3D textures using XRCT techniques. X-rays are passed through the sample toprocude a series of 2D images that are spaced close to each other (typically at resolutions of 7–30 µm). Sequential images are captured by rotating the sample or source. Using software such asBlob3D, the individual elements of the texture, such as crystals, can be sampled and quantified(Dougal et al. 2007)
50 M. Lawrence and Y. Jiang
porosity analysed with this method is likely to be overestimated because the methodis based on the densitometry principle, and there is only a small difference indensity between coir fibres and air. In addition, coir fibres consist of various thinorganic tissues, which may not be detected on the scanned images. The authorconcluded that Image analysis on SEM pictures will give a better estimation of theporosity of coir fibres.
In summary, XRCT offers a good tool to study the porosity and generally theinternal structure of bio-aggregates. Based on the above discussion, thebio-aggregate porosity will be better estimated by SEM image analysis in a smalllevel of scale (<1 µm). XRCT will give a better results on the porosity ofbio-aggregate above 1–3 µm. Combining these two methods will improve accuracyof pore-size distributions and porosity for bio-aggregates.
Fig. 2.10 a X-ray μ-tomography images of hemp fibre (MHFA) and shiv (MS22) modi-fiedmortars. Representative dimensions are 26 Å* 22 Å* 21 mm3 and 37 Å* 38 Å* 22 mm3 forMHFA and MS22, respectively. b In-depth views showing porosity and hemp phase arrangement.Crop volumes are 24 Å* 21 Å* 16 mm3 and 38 Å* 38 Å* 19 mm3 for MHFA and MS22,respectively (Mostefai et al. 2015)
2 Porosity, Pore Size Distribution, Micro-structure 51

2.2.1.4 Nuclear Magnetic Resonance
NMR Spectroscopy has been used commercially in a variety of disciplines, rangingfrom oil exploration to food technology, to examine the moisture content ofmaterials. The hydrogen atoms within the material, which is exposed to a large
Fig. 2.11 Image analysis to measure the porous area of the fibre cross-section using the softwareLeica QWin (Tran et al. 2015)
Table 2.1 Characteristics of the X-ray CT and 2D scanning methods for lignocellulosic fibre sizeestimation
Imagingtechnique
Strengths Drawbacks
X-ray CT – Suitable for the detection of smallfiber entities
– High level of detail and ability tointernally observe the structures
– Reliable fiber size estimation forregular shapes with low rates ofporosity and small amounts of largebundles
– Does not reject fiber size estimationof hollow fibers (which can befilled)
– Fibers with a length greater than themaximum 3D Spatial resolution ofX-ray microtomograph cannot beassessed
– Fibers with a diameter smaller thanthe minimum 3D Spatial resolutionof the X-ray microtograpgh cannotbe assessed
– Underestimates the fiber sizedistribution of a heterogeneous fiberelements
2Dscanning
– Reliable fiber size estimation forregular fiber shapes with low ratesof porosity and small amounts oflarge bundles
– Relatively easy implementation andhigh reproductiblity
– Exponentially overestimates thefiber size distribution ofheterogeneous fiber population witha high porosity level
– Underestimates the fiber lengthdistribution of heterogeneous fibernetwork with high rates of tortuosity
– The fibers need to be manuallyspread over the scanner surface toprevent inter-fiber contacts
Hamdi et al. (2015)
52 M. Lawrence and Y. Jiang
magnetic field, are excited by a pulse of radio waves, and subsequently relax backto their normal state releasing a characteristic signal. Measurement of the relaxationsignal (T1) allows the number of hydrogen atoms present and, with appropriatecalibration for the material, the absolute water content to be evaluated. An addi-tional feature of NMR is its ability to measure the amount of moisture in differentphysical states (i.e. chemically bound, physically bound and free liquid). Becausethe technique is tuned to excite the hydrogen nucleus, water molecules are par-ticularly responsive to the technique, however, care is needed where polymer-basedor organic materials are present as their hydrogen content may confuse results. Thetechnique requires experience and sophisticated analysis to fulfil its potential per-formance (Phillipson et al. 2007).
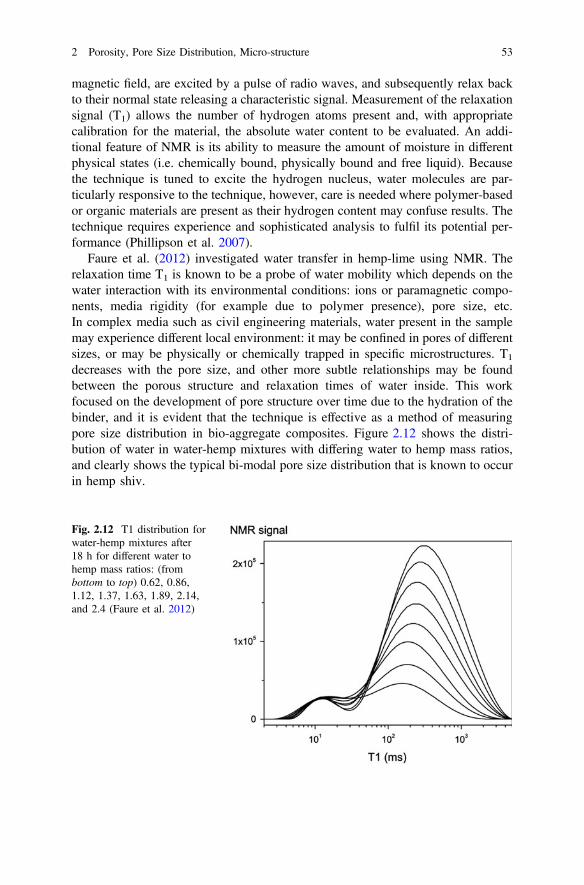
Faure et al. (2012) investigated water transfer in hemp-lime using NMR. Therelaxation time T1 is known to be a probe of water mobility which depends on thewater interaction with its environmental conditions: ions or paramagnetic compo-nents, media rigidity (for example due to polymer presence), pore size, etc.In complex media such as civil engineering materials, water present in the samplemay experience different local environment: it may be confined in pores of differentsizes, or may be physically or chemically trapped in specific microstructures. T1
decreases with the pore size, and other more subtle relationships may be foundbetween the porous structure and relaxation times of water inside. This workfocused on the development of pore structure over time due to the hydration of thebinder, and it is evident that the technique is effective as a method of measuringpore size distribution in bio-aggregate composites. Figure 2.12 shows the distri-bution of water in water-hemp mixtures with differing water to hemp mass ratios,and clearly shows the typical bi-modal pore size distribution that is known to occurin hemp shiv.
Fig. 2.12 T1 distribution forwater-hemp mixtures after18 h for different water tohemp mass ratios: (frombottom to top) 0.62, 0.86,1.12, 1.37, 1.63, 1.89, 2.14,and 2.4 (Faure et al. 2012)
2 Porosity, Pore Size Distribution, Micro-structure 53
2.2.2 Other Methods
2.2.2.1 Mercury Intrusion Porosimetry
Mercury intrusion porosimetry (MIP) is a powerful technique which can be used toexplore the structure of pores larger than about 3.5 nm. In MIP, the volume ofliquid metal that penetrates a solid is measured as a function of applied pressure.Subsequent analysis is based on the capillary law governing liquid penetration intosmall pores. Since mercury is a non-wetting liquid for most materials (its contactangle is greater than 90°), an externally imposed pressure is required to force it intothe pores of a porous solid.
The smaller the pore size, the greater the pressure required to force the mercuryinto the pore. In general, penetration data are analyzed using the Washburn equation(Washburn 1921). This relates the radius r of pores (assumed to be cylindrical) tothe imposed pressure P as follows:
P ¼ �2c cos hr
where:
γ Interfacial energy (surface tension) of mercuryθ contact angle of mercury with the material
Common values of γ and θ (which assume interfaces involving a gas or vapourphase) are 485 mJ/m2 and 140°. Whilst pores are rarely cylindrical, the Washburnequation is generally accepted as a practical method of analysing what are normallyvery complex pore systems (Lawrence 2007).
Boitryk and Pawluczuk (2014) have tested bio-composites (reed and sawdustbound with cement) using MIP in order to establish the impact of superplasticizer.Collet et al. (2008) tested hemp-lime renders and mortars using MIP. This studyfound that the pore size distributions of the composites were monomodal, withfrequency peaks at about 0.9 µm. The vast majority of the pores seen were in themeso- and macro-pore range (respectively 96 and 94% of the intruded mercuryvolume). They also identified a significant hysteresis between the intrusion andextrusion curves. This was explained in part by the ‘ink-bottle’ effect where mer-cury became trapped in pores with smaller pore openings, and partly by a differencein the contact angle between intrusion and extrusion. In some cases hysteresis canbe completely eliminated by modifying the extrusion contact angle (León 1998).It should be noted that a third cause could also be considered, associated with thecrushing of pore walls. This would result in very different extrusion curves becausethe porosity would have been changed by the high pressures involved in intrusion.
Figure 2.13 shows pore size distributions obtained by Collet (2008) and Boitryk(2014) which differ significantly. Part of the difference is likely to be due to thedifferent binders used, and potentially also due to differences in hemp shiv itself,
54 M. Lawrence and Y. Jiang

but it is evident that a more systematic study of the use of MIP to characterise thepore size distribution of bio-aggregates is required.
There do not appear to be any MIP studies of bio-aggregate on its own.
2.2.2.2 Thermoporometry
A small crystal of a liquid melts at a lower temperature than the bulk liquid, asgiven by the Gibbs-Thomson equation (Jackson and McKenna 1990). Thus if aliquid is imbibed into a porous material, and frozen, the melting temperature willprovide information on the pore-size distribution. The detection of the melting canbe done by sensing the transient heat flows during phase-changes using differentialscanning calorimetry.
For an isolated spherical solid particle of diameter x in its own liquid, theGibbs-Thomson Equation for the structural melting point depression can be written:
DTmðxÞ ¼ TmB � TmðxÞ ¼ TmB4rslHfqsx
where:
TmB Bulk Melting temperatureσsi solid-liquid interface energy (per unit area)Hf bulk enthalpy of fusion (per gram of material)ρs density of solid
Very similar equations may be applied to the growth and melting of crystals inthe confined geometry of porous systems. However the geometry term for thecrystal-liquid interface may be different, and there may be additional surface energyterms to consider, which can be written as a wetting angle term cosφ. The angle is
Fig. 2.13 Pore size distribution of hemp-lime composites using MIP. Collet (2008) left; Boitryk(2014) right
2 Porosity, Pore Size Distribution, Micro-structure 55
usually considered to be near 180°. In cylindrical pores there is some evidence thatthe freezing interface may be spherical, while the melting interface may be cylin-drical, based on preliminary measurements for the measured ratio for ΔTf/ΔTm incylindrical pores (Webber 2010).
Thus for a spherical interface between a non-wetting crystal and its own liquid,in an infinite cylindrical pore of diameter x, the structural melting point depressionis given by:
DTmðxÞ ¼ TmB � TmðxÞ ¼ �TmB4rsl cosuHfqsx
There has not been any published work which uses thermoporometry to char-acterize the pore structure of bio-based aggregates, although theoretically it shouldproduce more representative results than MIP because it is conducted at atmo-spheric pressure which makes it less likely to crush pore walls during thecharacterization.
Landry (2005) has shown that Thermoporometry can be conducted using organicliquids as a probe, and cyclohexane is suggested to be a convenient organic liquidbecause its fusion temperature is 279.7 K (6.6 °C), very close to water.Cyclohexane is hydrophobic and non polar which would present a different inter-action with the surface of the bio-aggregate that water. As a probe liquid, cyclo-hexane provides a complete baseline resolution at a 0.06 K/min scanning rate for allpore sizes. Another advantage to using hydrocarbons for thermoporometry char-acterisation of large pore materials is the larger temperature depression it offerscompared with water.
2.2.2.3 Physisorption
The term “physical adsorption” or “physisorption” refers to the phenomenon of gasmolecules adhering to a surface without the formation of a chemical bond at apressure less than the vapor pressure. The attractions between the molecules beingadsorbed and the surface are relatively weak and definitely not covalent or ionic.Some adsorption process is accompanied by absorption, which is the penetration ofthe fluid into the solid phase. It is sometimes difficult to distinguish betweenadsorption and absorption. This interaction is generally the result of a van der Waalsinteraction. On the other hand, chemical adsorption, called chemisorption, occurswhen a molecule or atom is adsorbed to a surface by forming a chemical bond.Chemisorption is limited to monolayer coverage (Sing 1985; Forrest 2012; Condon2006; Rouquerol 2014). Physical adsorption takes place on all surfaces and canforms multiple layers under proper conditions. Chemisorption, however, is highlyselective and only proceeds as long as the adsorptive can make direct contact withthe surface. It is therefore a single-layer process. The enthalpy of chemisorption is
56 M. Lawrence and Y. Jiang
often much greater than that of physical adsorption. The physical sorption energyusually not exceed 80 kJ/mole, with typical energies being considerably less due torelatively weak Van der Wall’s forces. Physically adsorbed molecules may diffusealong the surface of the adsorbent and typically are not bound to a specific locationon the surface. Being only weakly bound, physical adsorption is easily reversed.A chemical bond involves sharing of electrons between the adsorbate and theadsorbent, with typical energies up to about 600 kJ/mole for C–N bonds and800 kJ/mole for chemical bonds. Due to the bond strength, chemical adsorption isdifficult to reverse (Webb 2003; Rouquerol 2014).
For physisorption, the principle measurement performed as an adsorptionexperiment is the measurement of the adsorption isotherm. The adsorption isothermis the measurement of amount adsorbed versus adsorptive pressure at constanttemperature. The slightest change in the shape of the plotted isotherm in indicative ofa particular surface feature. Analyses of physical adsorption isotherm data reveal thetotal surface area, mesopore and micropore volume and area, total pore volume, thedistribution of pore volume and area by pore size, and surface energy distribution.This is the easiest measurement to make. Another type of measurement iscalorimetry. There are various forms of calorimetry but the most accurate methodsare very difficult to perform and only a few examples are available in the literature.There are principal methods to measure the adsorption isotherm, volumetric andgravimetric. In both methods the adsorbent is held at a constant temperature, usuallynear or at the boiling point of the adsorptive. The amount adsorbed is measure in thecase of the volumetric system by measuring the pressure change and comparing thisto the expected pressure change if the adsorbent were absent. In the case of thegravimetric measurement the amount adsorbed is indicated by the mass gain. Themost common measurement of the isotherm is volumetric method. This method hasthe advantage that it is simplest and relatively inexpensive. It has the disadvantage ofa greater uncertainty in the results. A low cost alternative to the volumetric is theflow or carrier gas system. The disadvantage of this method is that the results arevery uncertain and normally does not yield the isotherm. Generally, the gravimetricmethod is more accurate and precise, however such instrumentation is moreexpensive and requires a little more skill and patience to operation.
When a polar molecule is adsorbed on an ionic or polar surface various types ofspecific interactions may contribute to the adsorption energy. A useful generalexpression for the adsorption energy, E0, at very low surface coverage was firstproposed by Barrer (1966) in the form of the sum:
E0 = ED + ER + EP + EFl + EFQ
in which ED and ER represent the non-specific dispersion and repulsion contributionsand the terms EP, EFµ and EFQ represent, respectively, the three types of specificcontributions: the polarization, field-dipole and field gradient-quadrupole energies.The adsorbent-adsorbate interactions must be studied at very low surface coverage.It is only under these conditions that we can eliminate, or at least minimize, theadsorbate-adsorbate interactions. Calorimetry measures the temperature change as
2 Porosity, Pore Size Distribution, Micro-structure 57
the adsorption occurs. This along with a heat capacity measurements of the resultantadsorbate-adsorbent combination yields the heat of adsorption as a function ofpressure. Calorimetry is not widely used since accurate calorimetry is extremelydifficult to perform and requires a great amount of time and effort (Condon 2006).
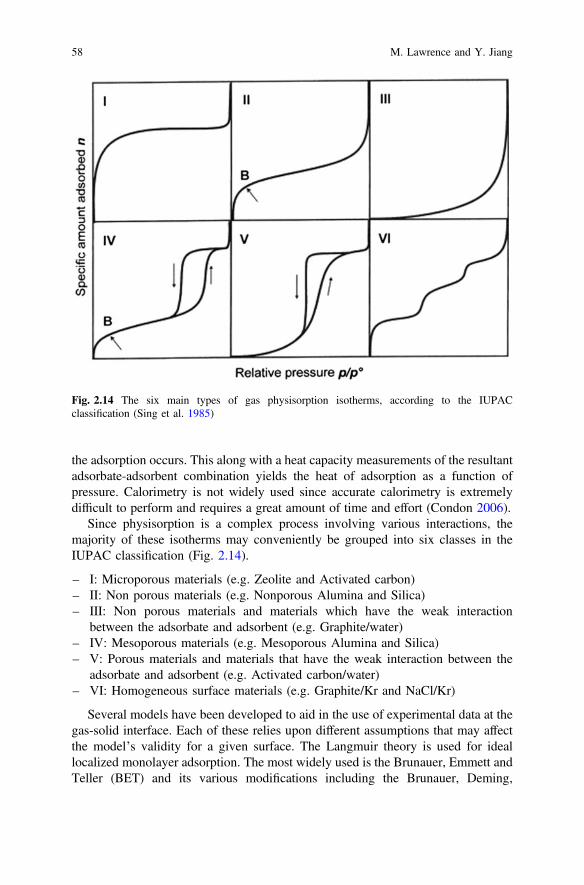
Since physisorption is a complex process involving various interactions, themajority of these isotherms may conveniently be grouped into six classes in theIUPAC classification (Fig. 2.14).
– I: Microporous materials (e.g. Zeolite and Activated carbon)– II: Non porous materials (e.g. Nonporous Alumina and Silica)– III: Non porous materials and materials which have the weak interaction
between the adsorbate and adsorbent (e.g. Graphite/water)– IV: Mesoporous materials (e.g. Mesoporous Alumina and Silica)– V: Porous materials and materials that have the weak interaction between the
adsorbate and adsorbent (e.g. Activated carbon/water)– VI: Homogeneous surface materials (e.g. Graphite/Kr and NaCl/Kr)
Several models have been developed to aid in the use of experimental data at thegas-solid interface. Each of these relies upon different assumptions that may affectthe model’s validity for a given surface. The Langmuir theory is used for ideallocalized monolayer adsorption. The most widely used is the Brunauer, Emmett andTeller (BET) and its various modifications including the Brunauer, Deming,
Fig. 2.14 The six main types of gas physisorption isotherms, according to the IUPACclassification (Sing et al. 1985)
58 M. Lawrence and Y. Jiang
Deming and Teller (BDDT). It is widely used for multilayer adsorption. Themechanisms involved in the BET model will be mainly dealt with next section. Thecalculation of the pore size distribution is performed by various methods based onthe use of the Kelvin equation. Another widely used isotherm, especially for porousmaterial, is the Dubinin-Radushkevich (DR) isotherm. Gibbs adsorption equation isto describe the adsorbed phase on available surface or in micropores. There areseveral other methods to describe the porosity, such as Barrett Joyner Halendamethod (BJH), Density functional theory method (DFT) and Alpha S method (αs)and so on (Sing 1985; Brunauer 1938; Condon 2006).
2.2.2.4 Nitrogen Adsorption and BET Analysis
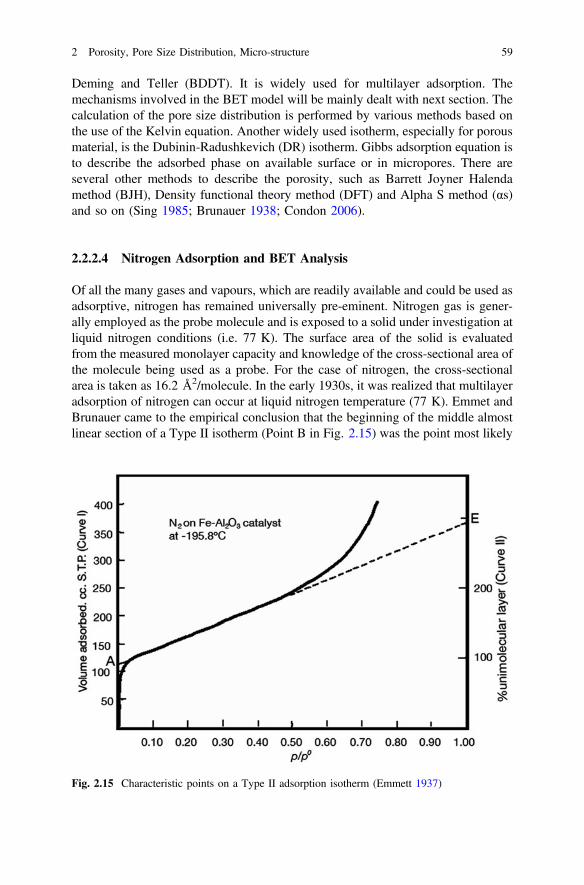
Of all the many gases and vapours, which are readily available and could be used asadsorptive, nitrogen has remained universally pre-eminent. Nitrogen gas is gener-ally employed as the probe molecule and is exposed to a solid under investigation atliquid nitrogen conditions (i.e. 77 K). The surface area of the solid is evaluatedfrom the measured monolayer capacity and knowledge of the cross-sectional area ofthe molecule being used as a probe. For the case of nitrogen, the cross-sectionalarea is taken as 16.2 Å2/molecule. In the early 1930s, it was realized that multilayeradsorption of nitrogen can occur at liquid nitrogen temperature (77 K). Emmet andBrunauer came to the empirical conclusion that the beginning of the middle almostlinear section of a Type II isotherm (Point B in Fig. 2.15) was the point most likely
Fig. 2.15 Characteristic points on a Type II adsorption isotherm (Emmett 1937)
2 Porosity, Pore Size Distribution, Micro-structure 59
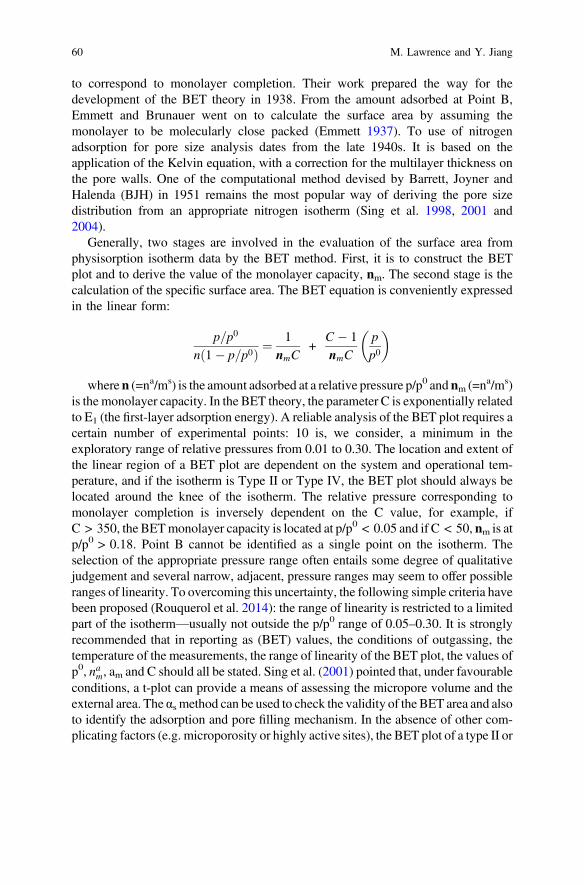
to correspond to monolayer completion. Their work prepared the way for thedevelopment of the BET theory in 1938. From the amount adsorbed at Point B,Emmett and Brunauer went on to calculate the surface area by assuming themonolayer to be molecularly close packed (Emmett 1937). To use of nitrogenadsorption for pore size analysis dates from the late 1940s. It is based on theapplication of the Kelvin equation, with a correction for the multilayer thickness onthe pore walls. One of the computational method devised by Barrett, Joyner andHalenda (BJH) in 1951 remains the most popular way of deriving the pore sizedistribution from an appropriate nitrogen isotherm (Sing et al. 1998, 2001 and2004).
Generally, two stages are involved in the evaluation of the surface area fromphysisorption isotherm data by the BET method. First, it is to construct the BETplot and to derive the value of the monolayer capacity, nm. The second stage is thecalculation of the specific surface area. The BET equation is conveniently expressedin the linear form:
p=p0
nð1� p=p0Þ ¼1
nmC+
C � 1nmC
pp0
� �
where n (=na/ms) is the amount adsorbed at a relative pressure p/p0 and nm (=na/ms)is the monolayer capacity. In the BET theory, the parameter C is exponentially relatedto E1 (the first-layer adsorption energy). A reliable analysis of the BET plot requires acertain number of experimental points: 10 is, we consider, a minimum in theexploratory range of relative pressures from 0.01 to 0.30. The location and extent ofthe linear region of a BET plot are dependent on the system and operational tem-perature, and if the isotherm is Type II or Type IV, the BET plot should always belocated around the knee of the isotherm. The relative pressure corresponding tomonolayer completion is inversely dependent on the C value, for example, ifC > 350, the BETmonolayer capacity is located at p/p0 < 0.05 and if C < 50, nm is atp/p0 > 0.18. Point B cannot be identified as a single point on the isotherm. Theselection of the appropriate pressure range often entails some degree of qualitativejudgement and several narrow, adjacent, pressure ranges may seem to offer possibleranges of linearity. To overcoming this uncertainty, the following simple criteria havebeen proposed (Rouquerol et al. 2014): the range of linearity is restricted to a limitedpart of the isotherm—usually not outside the p/p0 range of 0.05–0.30. It is stronglyrecommended that in reporting as (BET) values, the conditions of outgassing, thetemperature of the measurements, the range of linearity of the BET plot, the values ofp0, nam, am and C should all be stated. Sing et al. (2001) pointed that, under favourableconditions, a t-plot can provide a means of assessing the micropore volume and theexternal area. The αs method can be used to check the validity of the BET area and alsoto identify the adsorption and pore filling mechanism. In the absence of other com-plicating factors (e.g. microporosity or highly active sites), the BET plot of a type II or
60 M. Lawrence and Y. Jiang

type IV isotherm does appear to provide a fairly reliable assessment. It is notappropriate to apply the BET method to type III, type V or type VI isotherms. For aporous materials, or one that has an unsmooth surface, the BET surface area isgenerally appreciably larger than its non-porous analog. BET experiments are typi-cally conducted to a relative pressure, P/P0, of approximately 0.3 at 77 K, where P0 isthe saturation pressure. At relative pressures above the point at which a N2 monolayerhas formed on the solid, capillary condensation occurs within the pore structure of thematerial such that the smaller pores are filled more easily and consecutively largerpores are filled as pressure is increased. When the saturation point is approached, i.e.,P/P0 is approximately 1.0, the internal pore structure of the material contains con-densed (liquid) nitrogen. The total pore volume can be calculated by assuming that thedensity of liquid nitrogen in the pores is the same as that bulk liquid nitrogen. Nitrogensorption is suitable to characterize materials with pores with the range of *2 nm tobelow *150 nm. For materials containing larger pores, mercury porosimetry is thepreferred experimental technique and spans the pore range from 3.5 to 2000 nm.Sample preparation prior sorption analysis is a key aspect ofmaterial characterization.Caution must be used when heating some common samples because melting, dehy-dration, sintering, and decomposition are processes that can drastically alter thesurface properties of the sample.
Collet et al. (2008) studied the porosity and pore structure of hemp wool, limehemp render and hemp mortar by using BET methods with water vapour as probeagent. The results showed that the isotherms obtained are S-shaped and can beclassified as type II according to IUPAC classification. The specific surface area forhemp mortar and hemp wool were 80.82 and 88.77 m2/g, respectively. Collet et al.(2013) also showed that the isotherms of two kinds of hemp wool are classified astype II and the specific surface area is 111 m2/g for the first hemp wool. Bismarcket al. (2002) showed all natural fibres have very small specific surface areas about0.5 m2/g, which is just slightly bigger than the calculated geometric surface area(As, geo 0.38 m2/g at a fibre diameter df * 14 µm (compare SEM-micrographs)and a density of flax fibres of ρ = 1.47 g/cm3). Yin et al. (2015) compared thechanges in micropore and mesopores in the wood cell walls of sapwood andheartwood. The results showed that specific surface area of sapwood ranged from1.255 to 2.08 m2/g, but specific surface area of heartwood ranged from 0.078 to1.058 m2/g. Brewer et al. (2014) that BET surface area of the slow pyrolysisbiochars increased exponentially with pyrolysis temperature, from <1 to317 ± 16 m2/g for the wood biochars and from <1 m2/g to 387 ± 6 m2/g for thegrass biochars. BET surface area was low, <10 m2/g, for all of the intermediatepyrolysis biochars. Rachini et al. (2012) showed the specific surface areas of nat-ural, ethanol/water extracted and silane treated (at different concentrations) hempfibres were about 0.7 m2/g. Before BET characterization, the fibres (2 cm) weregrounded onto very small pieces (500 nm) using a wood grinder.
2 Porosity, Pore Size Distribution, Micro-structure 61
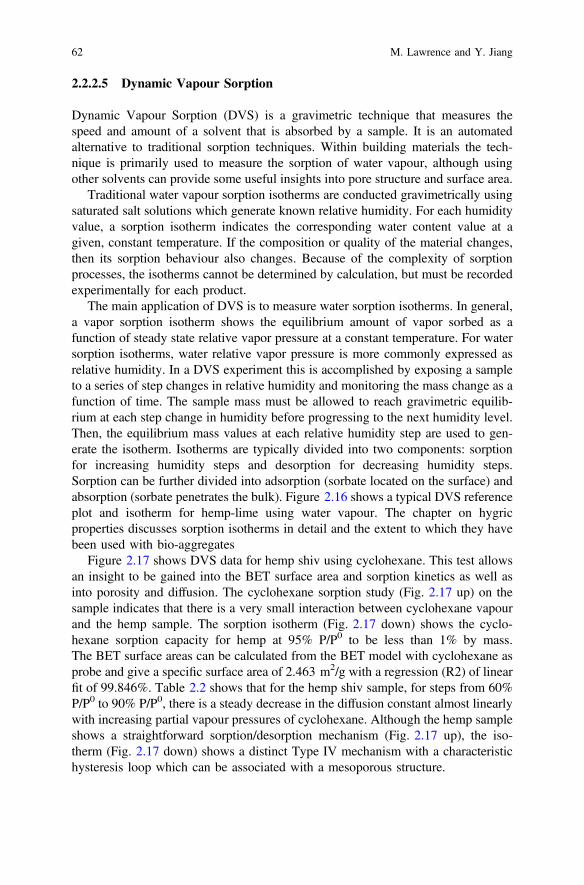
2.2.2.5 Dynamic Vapour Sorption
Dynamic Vapour Sorption (DVS) is a gravimetric technique that measures thespeed and amount of a solvent that is absorbed by a sample. It is an automatedalternative to traditional sorption techniques. Within building materials the tech-nique is primarily used to measure the sorption of water vapour, although usingother solvents can provide some useful insights into pore structure and surface area.
Traditional water vapour sorption isotherms are conducted gravimetrically usingsaturated salt solutions which generate known relative humidity. For each humidityvalue, a sorption isotherm indicates the corresponding water content value at agiven, constant temperature. If the composition or quality of the material changes,then its sorption behaviour also changes. Because of the complexity of sorptionprocesses, the isotherms cannot be determined by calculation, but must be recordedexperimentally for each product.
The main application of DVS is to measure water sorption isotherms. In general,a vapor sorption isotherm shows the equilibrium amount of vapor sorbed as afunction of steady state relative vapor pressure at a constant temperature. For watersorption isotherms, water relative vapor pressure is more commonly expressed asrelative humidity. In a DVS experiment this is accomplished by exposing a sampleto a series of step changes in relative humidity and monitoring the mass change as afunction of time. The sample mass must be allowed to reach gravimetric equilib-rium at each step change in humidity before progressing to the next humidity level.Then, the equilibrium mass values at each relative humidity step are used to gen-erate the isotherm. Isotherms are typically divided into two components: sorptionfor increasing humidity steps and desorption for decreasing humidity steps.Sorption can be further divided into adsorption (sorbate located on the surface) andabsorption (sorbate penetrates the bulk). Figure 2.16 shows a typical DVS referenceplot and isotherm for hemp-lime using water vapour. The chapter on hygricproperties discusses sorption isotherms in detail and the extent to which they havebeen used with bio-aggregates
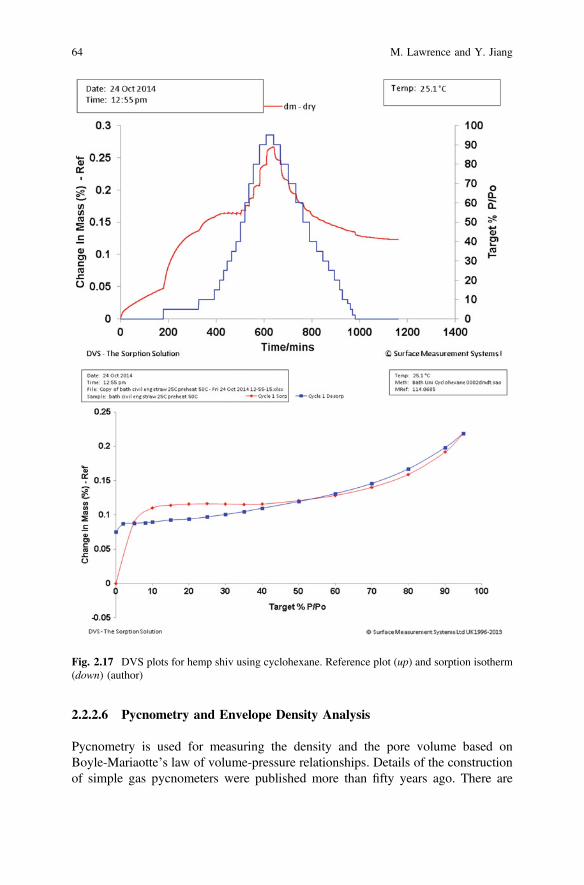
Figure 2.17 shows DVS data for hemp shiv using cyclohexane. This test allowsan insight to be gained into the BET surface area and sorption kinetics as well asinto porosity and diffusion. The cyclohexane sorption study (Fig. 2.17 up) on thesample indicates that there is a very small interaction between cyclohexane vapourand the hemp sample. The sorption isotherm (Fig. 2.17 down) shows the cyclo-hexane sorption capacity for hemp at 95% P/P0 to be less than 1% by mass.The BET surface areas can be calculated from the BET model with cyclohexane asprobe and give a specific surface area of 2.463 m2/g with a regression (R2) of linearfit of 99.846%. Table 2.2 shows that for the hemp shiv sample, for steps from 60%P/P0 to 90% P/P0, there is a steady decrease in the diffusion constant almost linearlywith increasing partial vapour pressures of cyclohexane. Although the hemp sampleshows a straightforward sorption/desorption mechanism (Fig. 2.17 up), the iso-therm (Fig. 2.17 down) shows a distinct Type IV mechanism with a characteristichysteresis loop which can be associated with a mesoporous structure.
62 M. Lawrence and Y. Jiang

Fig. 2.16 Typical DVS reference plot (up) and sorption isotherm (down) for hemp-lime (author)
2 Porosity, Pore Size Distribution, Micro-structure 63
2.2.2.6 Pycnometry and Envelope Density Analysis
Pycnometry is used for measuring the density and the pore volume based onBoyle-Mariaotte’s law of volume-pressure relationships. Details of the constructionof simple gas pycnometers were published more than fifty years ago. There are
Fig. 2.17 DVS plots for hemp shiv using cyclohexane. Reference plot (up) and sorption isotherm(down) (author)
64 M. Lawrence and Y. Jiang
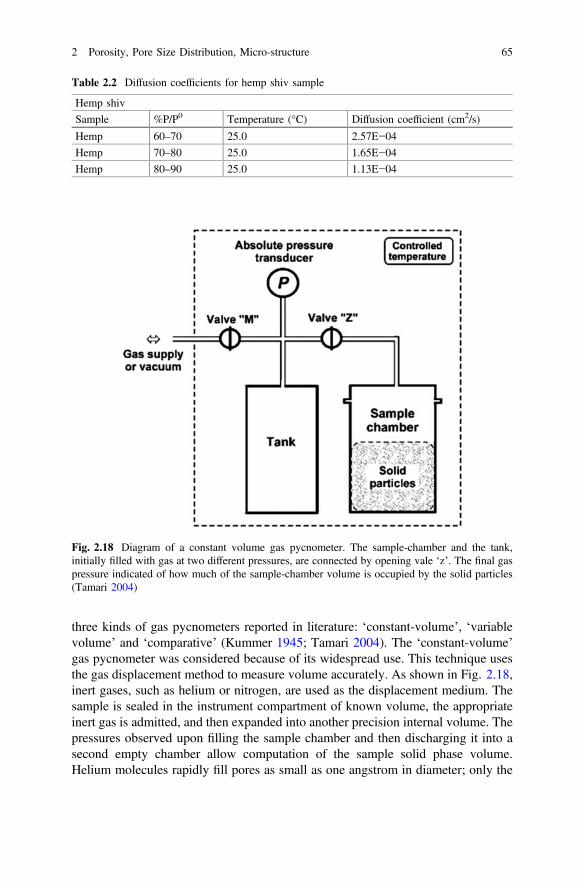
three kinds of gas pycnometers reported in literature: ‘constant-volume’, ‘variablevolume’ and ‘comparative’ (Kummer 1945; Tamari 2004). The ‘constant-volume’gas pycnometer was considered because of its widespread use. This technique usesthe gas displacement method to measure volume accurately. As shown in Fig. 2.18,inert gases, such as helium or nitrogen, are used as the displacement medium. Thesample is sealed in the instrument compartment of known volume, the appropriateinert gas is admitted, and then expanded into another precision internal volume. Thepressures observed upon filling the sample chamber and then discharging it into asecond empty chamber allow computation of the sample solid phase volume.Helium molecules rapidly fill pores as small as one angstrom in diameter; only the
Table 2.2 Diffusion coefficients for hemp shiv sample
Hemp shiv
Sample %P/P0 Temperature (°C) Diffusion coefficient (cm2/s)
Hemp 60–70 25.0 2.57E−04
Hemp 70–80 25.0 1.65E−04
Hemp 80–90 25.0 1.13E−04
Fig. 2.18 Diagram of a constant volume gas pycnometer. The sample-chamber and the tank,initially filled with gas at two different pressures, are connected by opening vale ‘z’. The final gaspressure indicated of how much of the sample-chamber volume is occupied by the solid particles(Tamari 2004)
2 Porosity, Pore Size Distribution, Micro-structure 65

solid phase of the sample displaces the gas. Dividing this volume into the sampleweight gives the gas displacement density.
This method has been widely used to determine the volume and the density ofbio-aggregates materials. Three fundamental hypotheses are made:
(1) the gas inside the pycnometer behaves ideally (i.e. its compressibility is neg-ligible and it does not adsorb on solids),
(2) the sample and the pycnometer’s components are rigid, and(3) the pycnometer is gas-tight and the expanding gas quickly reaches a static
equilibrium.
The method consists of placing a dry core (or crushed rock) of known bulkvolume (Vbulk, as determined by methods described above) in a container of knownvolume (Va). This volume is connected with another container with a knownvolume (Vb) that is evacuated. He gas is introduced into Va and the pressure (P1) setto an arbitrary value typically around 100 psi. This He gas is then released into Vb
and allowed to equilibrate throughout both chambers. The helium gas then pene-trates into the pores of the sample. During this process the pressure will decrease toa new stable level (P2). Using the ideal gas law, the volume of the pores can becalculated from
Vv ¼ Vbulk � Va � VbP2
P2 � P1
� �
It must consider a range of possible values for the filling factor (0 < φ < 1). Theporosity of granular media lies between 25 and 50% in general, which would give thetheoretical range 0.50 < φ < 0.75. However, in practice it would be difficult to fillthe pycnometer’s sample-chamber to the brim. We considered that 5–25% of thesample-chamber volume (including the tube at the sample-chamber side) might be freeof solid particles. The range 0.40 < φ < 0.70 was thus thought to be realistic for asample-chamber filled with as many solid particles as practical (Tamari 2004; Anovitz2015). This method is recognized as one of the most reliable techniques for obtainingtrue, absolute, skeletal, and apparent volume and density. This technique isnon-destructive as it uses the gas displacement method to measure volume. Inert gases,such as helium or nitrogen, are used as the displacement medium. Density calculationsusing the gas displacement method are much more accurate and reproducible than thetraditional Archimedes water displacement method (Zauer et al. (2013).
Mwaikambo et al. (2001) studied the porosity of plant fibres by helium pyc-nometry method. The results showed that the porosity of hemp fibres is 2.46% andthe porosity of Sisal and Jute are similar (10.85 and 11.36%, respectively). Zaueret al. (2013) studied porosity of wood by pycnometry method using helium andnitrogen as a displace gas. The results in Table 2.3 showed how this can lead tomisinterpretation of the cell wall density or porosity of wood determined by gaspycnometry. The results clearly showed that the sample geometry and the dimensions
66 M. Lawrence and Y. Jiang
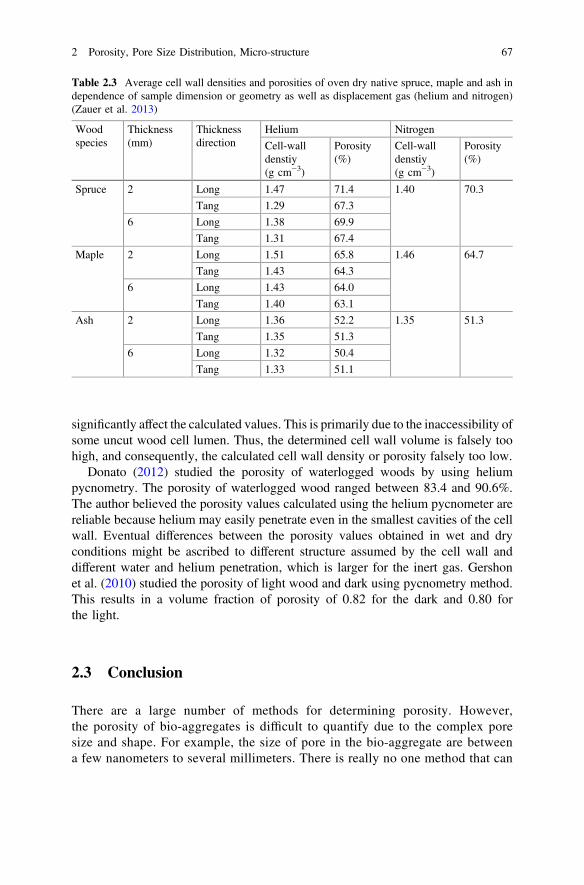
significantly affect the calculated values. This is primarily due to the inaccessibility ofsome uncut wood cell lumen. Thus, the determined cell wall volume is falsely toohigh, and consequently, the calculated cell wall density or porosity falsely too low.
Donato (2012) studied the porosity of waterlogged woods by using heliumpycnometry. The porosity of waterlogged wood ranged between 83.4 and 90.6%.The author believed the porosity values calculated using the helium pycnometer arereliable because helium may easily penetrate even in the smallest cavities of the cellwall. Eventual differences between the porosity values obtained in wet and dryconditions might be ascribed to different structure assumed by the cell wall anddifferent water and helium penetration, which is larger for the inert gas. Gershonet al. (2010) studied the porosity of light wood and dark using pycnometry method.This results in a volume fraction of porosity of 0.82 for the dark and 0.80 forthe light.
2.3 Conclusion
There are a large number of methods for determining porosity. However,the porosity of bio-aggregates is difficult to quantify due to the complex poresize and shape. For example, the size of pore in the bio-aggregate are betweena few nanometers to several millimeters. There is really no one method that can
Table 2.3 Average cell wall densities and porosities of oven dry native spruce, maple and ash independence of sample dimension or geometry as well as displacement gas (helium and nitrogen)(Zauer et al. 2013)
Woodspecies
Thickness(mm)
Thicknessdirection
Helium Nitrogen
Cell-walldenstiy(g cm−3)
Porosity(%)
Cell-walldenstiy(g cm−3)
Porosity(%)
Spruce 2 Long 1.47 71.4 1.40 70.3
Tang 1.29 67.3
6 Long 1.38 69.9
Tang 1.31 67.4
Maple 2 Long 1.51 65.8 1.46 64.7
Tang 1.43 64.3
6 Long 1.43 64.0
Tang 1.40 63.1
Ash 2 Long 1.36 52.2 1.35 51.3
Tang 1.35 51.3
6 Long 1.32 50.4
Tang 1.33 51.1
2 Porosity, Pore Size Distribution, Micro-structure 67
characterize pores in this enormous range in scale. In this chapter, the theory,advantage and disadvantage of several common methods using for determination ofporosity have been briefly described and summarised. In essence, the differenttechniques, each based on different inherent assumptions, have their own capabil-ities and advantages. A combination of several methods is most likely to give agood understanding of the size, shape and structure of pore in the bio-aggregatesmaterials.
The study of bio-aggregates is still in its infancy and their unique characteristicsdemand the development of novel methods or the adaptation of existing methods inorder to satisfactorily characterise their microstructure. There is a need for robustand comprehensive studies to be made into these materials in order that theirperformance can be satisfactorily modelled using Building Physics models toconfidently predict the performance of dwellings constructed form these materials.
References
Anovitz, L.M., Cole, D.R.: Characterization and analysis of porosity and pre structures. Rev.Mineral. Geochem. 80, 61–164 (2015)
Aydilek, A.H., ASCE, A.M., Oguz, S.H., ASCE, M., Edil, T.B.: Digital image analysis todetermine pore opening size distribution of nonwoven geotextiles. J. Comput. Civil Eng. 16(4),280–290 (2002)
Barrer, R.M.: Specificity in physical sorption. Journal of colloid interface science 21, 415–434(1966)
Bismarck, A., Askargorta, I., Agranberri, S., Jurgen, L., Thomas, W., Bernhard, S., Artemis, S.I.,Limbach, H.H.: Surface characterization of flax, hemp and cellulose fibers; surface propertiesand the water uptake behaviour. Polym. Compos. 23(5), 872–894 (2002)
Boitryk, M., Pawluczuk, E.: Properties of a lightweight cement composite with an ecologicalorganic filler. Constr. Build. Mater. 51, 97–105 (2014)
Brewer, C.E., Chuang, V.J., Masiello, C.A., Gonnermann, H., Gao, X., Dugan, B., Driver, L.E.,Panzacchi, P., Zygourakis, K., Davies, C.A.: New approaches to measuring biochar densityand porosity. Biomass Bioenergy 66, 176–185 (2014)
Brunauer, S., Emmett, P.H., Teller, E.: Adsorption of gases in multimolecular layers. J. Am.Chem. Soc. 60, 309–319 (1938)
Chundawat, S.P.S., Donohoe, B.S., Sousa, L., da Costa, E., Thomas, A., Umesh, P., Lu, F., Ralph,J., Himmel, M.E., Balan, V., Dale, B.E.: Multi-scale visualization and characterization oflignocellulosic plant cell wall deconstruction during thermochemical pretreatment. EnergyEnviron. Sci. 4, 937 (2011)
Collet, F., Bart, M., Serres, L., Miriel, J.: Porous structure and water vapour sorption ofhemp-based materials. Constr. Build. Mater. 22, 1271–1280 (2008)
Collet, F., Chamoin, J., Pretot, S., Lanos, C.: Comparison of the hygric behaviour of three hempconcretes. Energy Build. 62, 294–303 (2013)
Condon, J.B.: Surface area and porosity determinations by physisorption measurements andtheory. Elsevier, Oxford (2006)
Donato, I.D., Lazzara, G.: Porosity determination with helium pycnometry as a method tocharacterize waterlogged woods and the efficacy of the conservation treatments. Archaeometry54(5), 906–915 (2012)
68 M. Lawrence and Y. Jiang
Dougal, A., Jerram, Kent, & Adam, J.R.: An overview of modern trends in petrography: texturaland microanalysis of igneous rocks. J. Volcanol. Geoth. Res. 154, 158 (2006)
Dougal, A., Jerram, Higgins, & Micahael, D.: 3D analysis of rock textures: quantifying igneousmicrostructures. Elements 3, 239–245 (2007)
Emmett, P.H., Brunauer, S.: The use of low temperature van de Waals adsorption isotherms indetermining the surface area of iron synthetic ammonia catalysts. J. Am. Chem. Soc. 59(8),1553–1564 (1937)
Faure, P., Peter, U., Lesueur, D., Cossot, P.: Water transfers within Hemp Lime concrete followedby NMR. Cem. Concr. Res. 42, 1468–1474 (2012)
Forrest, S.C.: Physical adsorption of gases onto mesoporous silica material SBA-15. Chemistrypublications and other works (2012)
Gershon, A.L., Bruck, H.A., Xu, S., Sutton, M.A., Tiwari, V.: Multiscale mechanical andstructural characterizations of Palmetto wood for bio-inspired hierarchically structured polymercomposites. Mater. Sci. Eng. C 30, 235–244 (2010)
Grove, C., Jerram, D.A.: jPOR: an imageJ macro to quantify total optical porosity fromblue-stained thin sections. Comput. Geosci. 37, 1850–1859 (2011)
Kain, G., Johann, C.P., Marius-Catalin, B., Bernhard, P., Klaus, R., Alexander, P.: Analyzingwood bark insulation board structure using X-ray computed tomography and modelling itsthermal conductivity by means of finite difference method. J. Compos. Mater. 0(0), 1–12(2015)
Hamdi, S.E., Delisee, C., Malvestio, J., Silva, N.D., Duc, A.L., Beaugrand, J.: X-ray computedmicrotomography and 2D image analysis for morphological characterization of shortlignocellulosic fibres raw materials: a benchmark survey. Compos. A 76, 1–9 (2015)
Jackson, C.L., McKenna, G.B.: The melting behavior of organic materials confined in poroussolids. J. Chem. Phys. 93(12), 9002–9011 (1990)
Kaestner, A., Lehmann, E., Stampanoni, M.: Imaging and image processing in porous mediaresearch. Adv. Water Resour. 31(9), 1174–1187 (2008)
Kummer, F.A., Cooper, A.W.: Soil porosity determination with the air pycnometer as comparedwith the tension method. Agric. Eng. 26, 21–23 (1945)
Landry, M.R.: Thermoporometry by differential scanning calorimetry: experimental considerationsand applications. Thermochim. Acta 433, 27–50 (2005)
Latif, E., Lawrence, R., Shea, A., Walker, P.: Moisture buffer potential of experimental wallassemblies incorporating formulated hemp-lime. Build. Environ. 93(2), 199–209 (2015)
Lawrence, R.M., Mays, T.J., Rigby, S.P., Walker, P., D’Ayala, D.: Effects of carbonation on thepore structure of non-hydraulic lime mortars. Cem. Concr. Res. 37, 1059–1069 (2007)
León, C.A.L.: New perspectives in mercury porosimetry. Adv. Colloid Interf. Sci. 76–77, 341–372(1998)
Lubelli, B., de Winter, D.A.M., Post, J.A., van Hees, R.P.J., Drury, M.R.: Cryo FIB SEM and MIPstudy of porosity and pore size distribution of bentonite and kaolin at different moisturecontents. Appl. Clay Sci. 80(81), 358–365 (2013)
Maire, E.: X-ray tomography applied to the characterization of highly porous materials. Annu.Rev. Mater. Res. 42, 136–178 (2012)
Maire, E., Buffiere, J.Y., Salvo, L., Blandin, J.J., Ludwig, W., Letang, J.M.: On the application ofX-ray microtomography in the field of materials science. Adv. Eng. Mater. 3, 539–546 (2001)
Manger, G.E.: Porosity and bulk density of sedimentary rocks. Geol. Surv. Bull. 114-E (1963)Marinello, F., Bariani, P., Savio, E., Horsewell, A., De Chiffre, L.: Critical factors in SEM 3D
stereo microscopy. Measur. Sci. Technol. 19 (2008)Mermut, A.R.: Historical development in soil micromorphological imaging. J. Mountain Sci. 6(2),
107–112 (2009)Mostefai, N., Hamzaoui, R., Guessasma, S., Amadou, A.W., Nouri, H.: Microstructure and
mechanical performance of modified hemp fibre and shiv mortars: discovering the optimalformulation. Mater. Des. 84, 359–371 (2015)
2 Porosity, Pore Size Distribution, Micro-structure 69

Mwaikambo, L.Y., Ansell, M.P.: The determination of porosity and cellulose content of plantfibers by density method. J. Mater. Sci. Lett. 20, 2095–2096 (2001)
Nimmo, J.R.: Porosity and pore size distribution. Encycl. Soils Environ. 3, 2935–303 (2004)Phillipson, M.N., Baker, P.H., Davies, M., Ye, Z., McNaughtan, A., Galbraith, G.H., McLean, R.
C.: Moisture measurement in building materials: an overview of current methods and newapproaches. Build. Serv. Eng. Res. Technol. 28(4), 303–316 (2007)
Rachini, A., Le Troedec, M., Peyratout, C., Smith, A.: Chemical modification of hemp fibers bysilane coupling agents. J. Appl. Polym. Sci. 123(1), 601–610 (2012)
Roche, R.C., Abel, R.A., Johnson, K.G., Perry, C.T.: Quantification of porosity in acroporapulchra (brook 1891) using X-ray micro-computed tomography techniques. J. Exp. Mar. Biol.Ecol. 396, 1–9 (2010)
Rouquerol, F., Rouquerol, J., Sing, K.S.W., Llewellyn, P., Maurin, G.: Adsorption by Powdersand Porous Solids Principles, Methodology and Applications. Elsevier, Oxford (2014)
Sassoni, E., Manzi, S., Motori, A., Montecchi, M., Canti, M.: Novel sustainable hemp-basedcomposites for application in the building industry: physical, thermal and mechanicalcharacterization. Energy Build. 77, 219–226 (2014)
Shen, W., Wan, J., Tokunaga, T.K., Kim, Y., Li, X.: Porosity calculation, pore size distributionand mineral identification within shale rocks: application of scanning electron microscopy andenergy dispersive spectroscopy. Electron. J. Geotech. Eng. 20, 11477–11490 (2015)
Sing, K.S.W.: Reporting physisorption data for gas/solid systems with special reference to thedetermination of surface area and porosity (Recommendations 1984). Pure Appl. Chem. 57(4),603–619 (1985)
Sing, K.: Adsorption methods for the characterisation of porous materials. Adv. Colloid Interf. Sci.76–77, 3–11 (1998)
Sing, K.: The use of nitrogen adsorption for the characterisation of porous materials. Colloids Surf.A 187–188, 3–9 (2001)
Sing, K.: Characterisation of porous materials: past, present and future. Colloids Surf. A 241, 3–7(2004)
Stevulova, N., Cigasova, J., Estokova, A., Terpakova, E., Geffert, A., Kacik, F., Singovszka, E.,Holub, M.: Properties characterization of chemically modified hemp hurds. Materials 7, 8131–8150 (2014)
Tamari, S.: Optimum design of the constant volume gas pycnometer for determining the volume ofsolid particles. Meas. Sci. Technol. 15, 549–558 (2004)
Tran, L.Q.N., Minh, T.Nguyen, Fuentes, C.A., Chi, T., Truong, Vuure, Van, A.W., Verpoest, I.:Investigation of microstructure and tensile properties of porous natural coir fibre for use incomposite materials. Ind. Crops Prod. 65, 437–445 (2015)
Walker, R., Pavia, S.: Impact of Hydration on the Properties of Hemp Lime Concrete. Civilengineering research in Ireland CERAI, Belfast (2014)
Walker, R., Pavia, S., Mitchell, R.: Mechanical properties and durability of hemp-lime concretes.Constr. Build. Mater. 61, 340–348 (2014)
Washburn, E.W.: The dynamics of capillary flow. Phys. Rev. 17, 273–283 (1921)Webb, P.A.: Introduction to Chemical Adsorption Analytical Techniques and their Applications to
Catalysis. Technical publications, Micromeritics instrument corp (2003)Webber, J.B.W.: Studies of nano-structured liquids in confined geometries and at surfaces. Prog.
Nucl. Magn. Reson. Spectrosc. 56(1), 78–93 (2010)Williams, J., Lawrence, M., Walker, P.: Thermally modelling bio-composites with respect to an
orientated internal structure. Sustainable ecological engineering design for society, Leeds,17th–18th, September, 2015 (2015)
Yang, B., Wu, A., Miao, X., Liu, J.: 3D characterization and analysis of pore structure of packedore particle beds based on computed tomography images. Trans. Nonferrous Met. Soc. China24, 833–838 (2014)
Yin, J., Song, K., Lu, Y., Zhao, G., Yin, Y.: Comparison of changes in micropores and mesoporesin the wood cell walls of sapwood and heartwood. Wood Sci. Technol. 49, 987–1001 (2015)
70 M. Lawrence and Y. Jiang

Zauer, M., Pfriem, A., Wagenfuhr, A.: Toward improved understanding of the cell wall densityand porosity of wood determined by gas pycnometry. Wood Sci. Technol. 47, 1197–1211(2013)
Zhao, H., Darwin, D.: Quantitative backscattered electron analysis of cement paste. Cem. Concr.Res. 22(4), 695–706 (1992)
Ziel, R., Haus, A., Tulke, A.: Quantification of the pore size distribution (porosity profiles) inmicrofiltration membranes by SEM, TEM and computer image analysis. J. Membr. Sci. 323,241–246 (2008)
2 Porosity, Pore Size Distribution, Micro-structure 71

http://www.springer.com/978-94-024-1030-3