Embed Size (px)
Citation preview

Chapter 2
Mapping our World

Section 2.1Latitude and Longitude
Latitude
Long
itude
You will be able to . . .
•Compare and Contrast latitude and longitude.
•Describe how time zones vary.
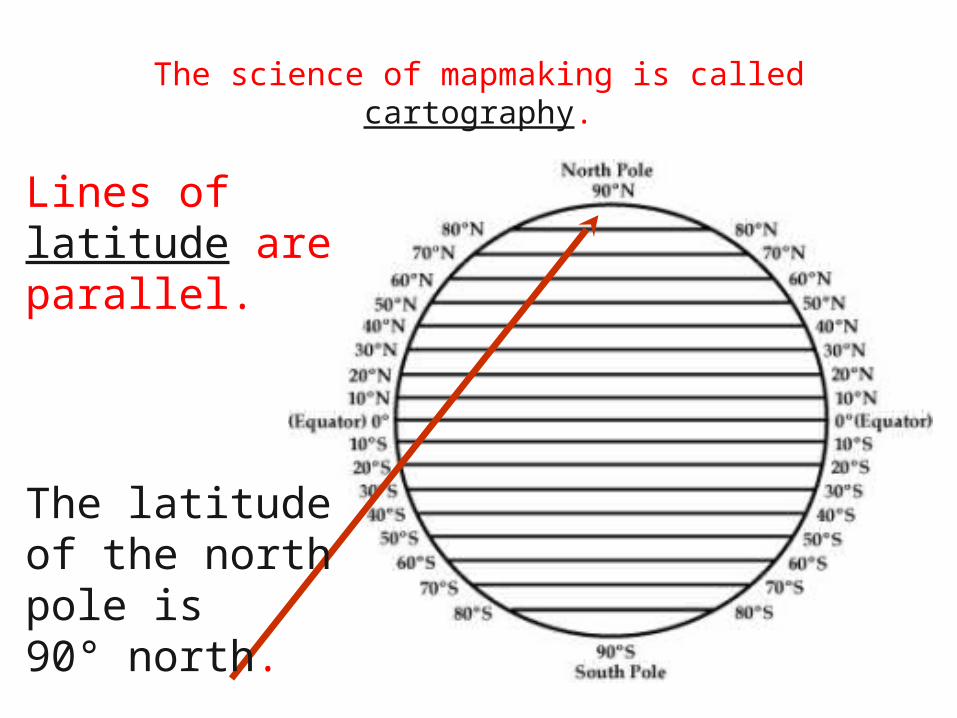
The science of mapmaking is called cartography.
Lines of latitude are parallel.
The latitude of the north pole is 90° north.

Longitude – Lines of longitude converge at the poles.
The prime meridian represents
0° longitude.
Longitude

Each degree of latitude or longitude is divided into 60 smaller units called minutes.
Minutes

Each minute of latitude or longitude is divided into 60 smaller units called seconds.
Seconds

Each degree(°) = 111 km
Each Minute(‘) = 1.85 km
And
Each Second(“) = 30.83 m
Scale
Note: works for latitude only

Earth is divided into 24 time zones.Time Zones

The International Date Line is another name for the 180° meridian.
International Date Line

Traveling West () across the International Date Line, you would advance your calendar one day.
International Date Line
West
Sept.1
Sept.2

Traveling East () across the International Date Line, you would move your calendar back one day.
International Date Line
East
Sept.1
Aug.31

Section 2.2
Types of Maps
You will be able to . . .
•Compare and Contrast different map projections.
•Analyze topographic maps.
•Describe map characteristics such as map scales and map legends.

All flat maps distort either the shapes or the areas of landmasses because Earth is a curved, three-dimensional object.
Distortion
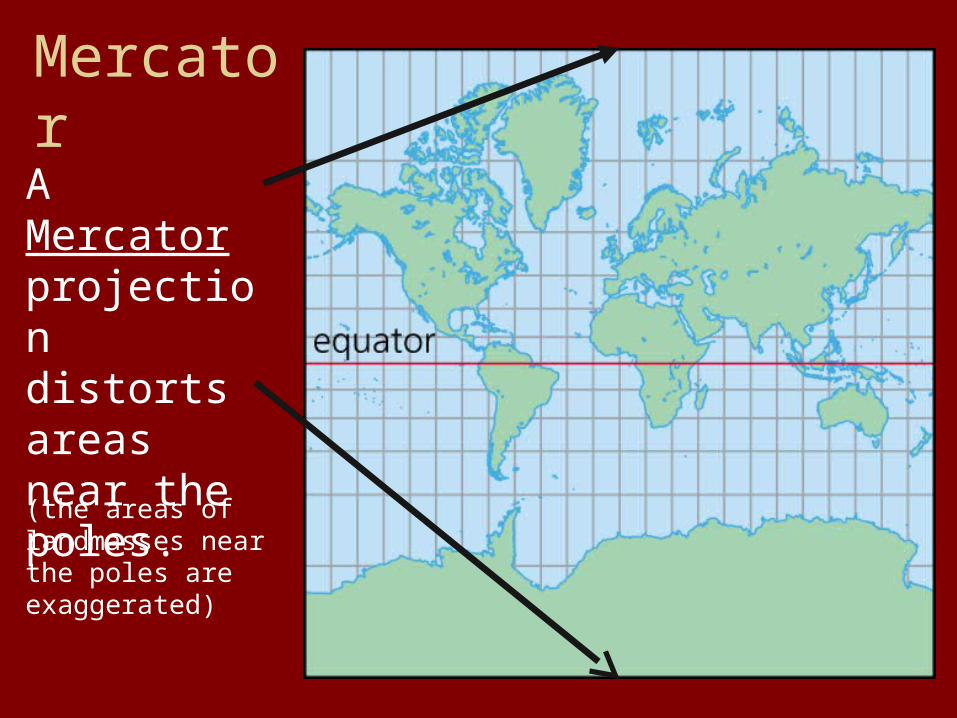
A Mercator projection distorts areas near the poles.
Mercator
(the areas of landmasses near the poles are exaggerated)

In a conic projection, there is very little distortion along one line of latitude, but the areas and shapes of landmasses near the top and bottom of the projection are distorted.
Conic

In a gnomonic projection, the direction and distance between landmasses are distorted.
Polar Gnomonic
Equatorial Gnomonic
Oblique Gnomonic
Gnomonic projection are used by navigators to plot great-circle routes.
Gnomonic

Topographic map a type of map that shows changes in elevation of Earth's surface
Topographic

Each contour line should represent one elevation. If two lines cross, it means that the point where they cross has two elevations, which is impossible.
The difference in elevation between two side-by-side contour lines is called the contour interval.
Contour Interval

Legend & ScaleA map legend
explains what the symbols on a map represent.
A graphic scale is a line broken into sections that represent units with each section representing a distance on Earth’s surface.

Section 2.3
Remote Sensing
You will be able to . . .
•Compare and Contrast different the different forms of radiation in the electromagnetic spectrum.
•Discuss how satellites and sonar are used to map Earth’s surface and its oceans.
•Describe the Global Positioning System

Light/Electromagnetic Spectrum
The frequency of an electromagnetic wave is the number of waves that pass a particular point each second.

Speed of Light
The speed of light in a vacuum is 300,000 km/s.

Remote Sensing
The process of collecting data about the Earth from above the surface.
(Generally using the electromagnetic spectrum.)

GPS - Global Positioning System allows its users to determine their exact position on Earth.
GPS

GPS
GPS satellites can relay information about all of the following:
•Direction
•Elevation
•Position

Landsat and Topex/Poseidon
Uses radar to map features on the ocean floor.
Detects energy related to the warmth of surface features.
Both Landsat satellite and Topex/Poseidon satellite collect data about Earth by remote sensing.
Landsat SatelliteTopex/Poseidon Satellite

NOVA Science Now (time-out)
Hyperlink on picture

Mapping ExerciseEarth is a circle which has 360 degrees (◦)
Each degree (◦) is divided into 60 minutes.
Each minute is divided into 60 seconds
Each degree(°) = 111 km
Each Minute(‘) = 1.85 km
And
Each Second(“) = 30.83 m

Traveling
When You Know your starting coordinates and the distance you travel (+) add
40° 45’ 16” , I travel
10’ 10” 10’ 10”
40° 55’ 16” , I travel

Distance between
When You Know your starting coordinates and ending coordinates (-) subtract
40° 45’ 16” , Start
40° 20’ 15” Stop 39° 10’ 40” stop
40° 55’ 16” , start

Conversion
When You need to convert degrees,minutes,seconds to a decimal
Generally make it a fraction over 60 and add to the number to the left.
120° 40’ 25” =

Map Exercises
http://geology.isu.edu/geostac/Field_Exercise/topomaps/exercise_1.htm