Embed Size (px)
Citation preview

22
CHAPTER 2
LITERATURE SURVEY AND CHARACTERIZATION
TOOLS AND TECHNIQUES
2.1 REVIEW OF LITERATURE
From materials point of view, the NLO materials can be broadly
classified into three different categories as, inorganic, organic and semi-
organic or metal organic materials. Inorganic and organic materials possess
their own set of advantages and disadvantages, while in semi-organic or metal
organic materials the aim is always to combine advantages of the both. All the
three types of NLO materials are briefly outlined.
2.1.1 Inorganic NLO Materials
These are covalent and ionic bulk materials where the optical
nonlinearity is a bulk effect. The phenomenon of SHG in inorganic materials
was first reported in 1961, which led to the development of recent NLO
materials such as inorganic systems, semi conductors and inorganic
photorefractive crystals. Nikogosyan 6
has carried out detailed survey of all
NLO properties of various materials. Lithium niobate (LiNbO3), Potassium
niobate (KNbO3), Barium titanate (BaTiO3), Potassium titanyl phosphate
(KTiOPO4,KTP), Potassium dihydrogen phosphate (KH2PO4,KDP),
potassium deuterium phosphate (KD*P), Ammonium dihydrogen phosphate
(NH3PO4, ADP), Lithium iodate (LiIO3), etc., and a variety of semiconductors
such as Gallium arsenide (GaAs), Cadmium sulphide (CdS), Cadmium
telluride (CdTe), Zinc germanium phosphide (ZnGeP2) and Teluride (Te),

23
Cadmium germanium arsenide (CdGeAs2) and Silver gallium selenide
(AgGaSe2) are appropriate infrared NLO materials.
β - Barium Borate (BBO) is an efficient NLO crystal for second, third
and fourth harmonic generation of Nd: YAG lasers and best NLO crystal for
fifth harmonic generations. The conversion efficiency of BBO is 70% for
SHG, 60% for THG and 50% for FHG. KTP is also well-known NLO crystal
with SHG coefficient about three times that of KDP. The inorganic NLO
materials have some advantages like highest bulk susceptibility and
compatible physical properties. On the other hand, such materials suffer from
disadvantages like absorption in the visible region, poor response time and
degradative photorefractive effects, low laser damage threshold (~10 MW
cm-2
) and poor optical transparency. Lithium niobate (LiNbO3) crystals are
one of the most investigated materials for widespread and promising
applications in nonlinear optics, e.g., for parametric amplification and second-
harmonic generation 2. LiNbO3 also shows photorefractive properties, which
are characterized by a change in its refractive index that result from an
optically induced separation of electrons and the linear electro-optic effect.
LiNbO3 crystals are attractive due to many applications such as holographic
data storage, optical information processing, phase conjugation, and
wavelength filters. Borate family complexes are excellent nonlinear optical
(NLO) materials, as they possess high chemical stability, damage threshold,
optical quality and wide range of transparency. In particular, inorganic
crystals like lithium triborate (LiB3O5, LBO), lithium tetraborate, beta barium
borate (β-BaB2O4, BBO) and Potassium pentaborate tetrahydrate (KB5) have
been widely used for NLO devices in ultra-violet laser generation. The beta
barium borate crystal was confirmed to be that of the low-temperature β-phase
by powder X-ray diffraction and second harmonic generation. Due to its large
SHG coefficient (d22 = 2.22 pm/V), wide optical transmission ranges
(190–3500 nm) and high damage threshold (about 50 times higher than that of
24
KDP), the beta barium borate as a single crystal material, has been extensively
investigated for applications in the ultraviolet region. KB5 is a desirable NLO
material, which exhibits a low angular sensitivity and hence proved to be
useful for type II second harmonic generation. The ultraviolet radiation
generated in a lithium tetraborate (Li2B4O7) crystal by Type-I walk-off
compensated sum-frequency mixing (SFM) of the commonly available Nd:
YAG laser radiation.
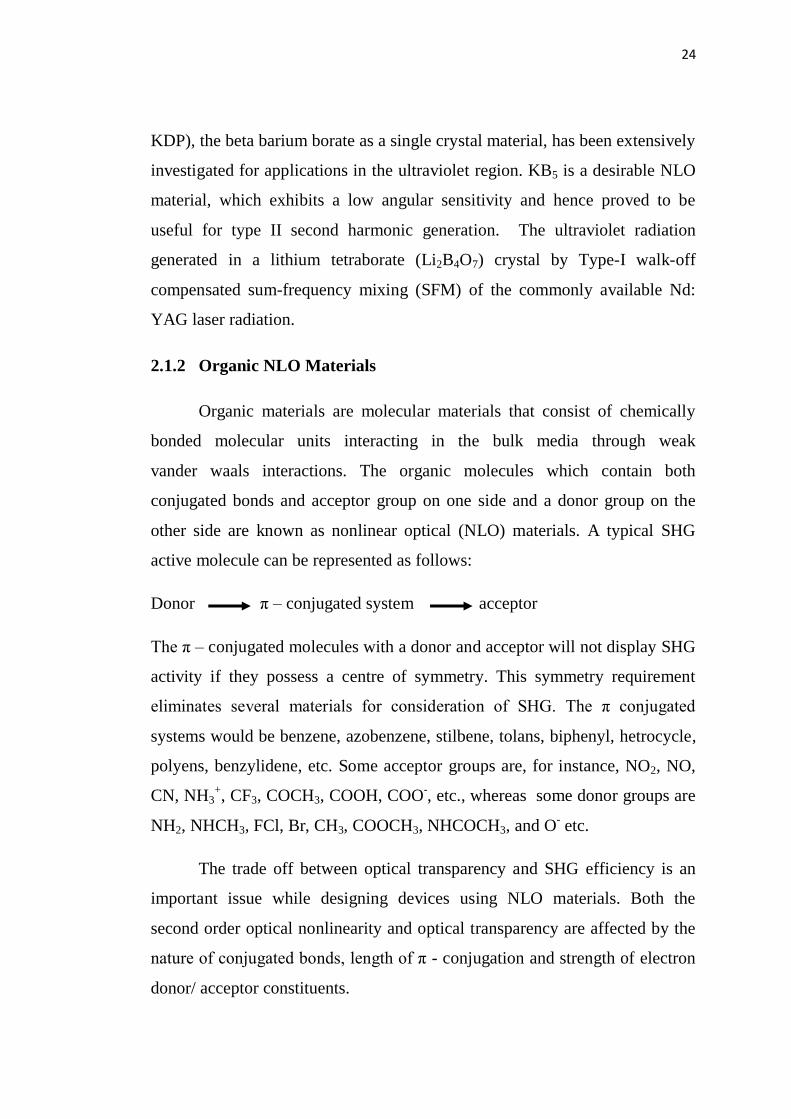
2.1.2 Organic NLO Materials
Organic materials are molecular materials that consist of chemically
bonded molecular units interacting in the bulk media through weak
vander waals interactions. The organic molecules which contain both
conjugated bonds and acceptor group on one side and a donor group on the
other side are known as nonlinear optical (NLO) materials. A typical SHG
active molecule can be represented as follows:
Donor π – conjugated system acceptor
The π – conjugated molecules with a donor and acceptor will not display SHG
activity if they possess a centre of symmetry. This symmetry requirement
eliminates several materials for consideration of SHG. The π conjugated
systems would be benzene, azobenzene, stilbene, tolans, biphenyl, hetrocycle,
polyens, benzylidene, etc. Some acceptor groups are, for instance, NO2, NO,
CN, NH3+, CF3, COCH3, COOH, COO
-, etc., whereas some donor groups are
NH2, NHCH3, FCl, Br, CH3, COOCH3, NHCOCH3, and O- etc.
The trade off between optical transparency and SHG efficiency is an
important issue while designing devices using NLO materials. Both the
second order optical nonlinearity and optical transparency are affected by the
nature of conjugated bonds, length of π - conjugation and strength of electron
donor/ acceptor constituents.

25
Nagaraja et al 7 showed that benzoyl glycine (BG), an organic
nonlinear crystal grown by slow evaporation from Dimethyl Formamide
solution has the advantages of both the organic and inorganic NLO materials
and is nondeliquescent. Owing to high nonlinear efficiency, high melting
point, good chemical stability, less sublimation problems and improved
hardness and cleavage properties (unlike other organic materials), benzoyl
glycine is found to be a promising material for NLO applications. Lakshmana
Perumal et al 8
further extended the effort in synthesizing 4-methoxy
benzaldehyde-N-methyl-4-stilbazolium tosylate (MBST), which is a
derivative of stilbazolium tosylate and a new material having high NLO
property. The Kurtz powder SHG measurements 9 on MBST showed that the
peak intensity is 17 times more than that of urea. Methyl p-hydroxybenzoate
(p-MHB) is a para-substituted aromatic compound with a molecular formula
C8H8O3. Urea has been used in an optical parametric oscillator to generate
tunable radiation throughout the visible region but intrinsic absorption and
phase matchability considerations make it unsuitable for wavelengths longer
than 1000 nm, as reported by Rosker et al 10
. The efforts made to resolve the
problems associated with urea have not been successful. The newly grown
binary UNBA crystal by Rai et al 11
is thermally and mechanically harder than
the crystal of the parent components. It is quite transparent almost in the entire
UV region and hence it can be used for producing green/blue laser light.
Amino acid crystals like L-phenylalaninium trichloroacetate (SHG
efficiency 0.65 X KDP), L-arginine maleate (SHG efficiency 1.4 X KDP),
L- citrulline oxalate, L-leucine (SHG efficiency 2 X Urea), L-phenylalaninium
maleate (SHG efficiency 1.5 X KDP), L-histidinium maleate 1.5 hydrate,
L-alanine tartrate (SHG efficiency 1.4 X KDP), Urea l-alanine acetate (SHG
efficiency ~ KDP), have been grown by slow evaporation method and
temperature lowering methods from aqueous solution by several workers 12-19
.

26
Many other organic crystals viz., m-dinitrobenzene doped urea, 2-
Amino-5-nitropyridinium-toluenesulfonate, 2-Furoic acid, L-tartaric acid, β-
napthol, E- 5- (diethylamino)-2-( ( 3,5-dinitrophylimino) methyl) phenol, 2-
Amino pyridinium trichloroacetate, and Chalcone derivative of (2E)-3-[4-
(Methylsulfanyl)phenyl]-1-(4-nitrophenyl)prop-2-en-1-one) were grown by
slow evaporation and temperature lowering methods using solvents such as
double distilled water and ethanol 20-27
.
Many organic crystals exhibiting third order NLO properties were also
reported. Benzyl-triethylammonium bis (2-thioxo-1, 3-dichiole- 4,5- dithiolato
aurate (III), 4-bromo-4‟ Chlorobenzylidene aniline, were structurally analyzed
and reported to be third order NLO active single crystals 28, 29
.
In order to retain the merits and overcome the shortcomings of organic
materials, some new classes of NLO crystals such as metal organic or
semiorganic complex crystals have been developed. The relatively strong
metal ligand bond permits the complex crystals to combine the advantages of
inorganic crystals, such as good stability, with the advantages of organic
crystals, such as high nonlinearity and molecular engineering features.
2.1.3 Semiorganic NLO Materials
Semi-organic compounds share the properties of both organic and
inorganic compounds, and organo-metallic compounds. They are organic
based materials in which the polarizable part is an organic molecule which is
stoichiometrically bonded with an inorganic ion. The π -conjugated network in
an organic system with large nonlinearity has significant absorption in the
visible region and hence for second harmonic generation (SHG) in the blue
near UV region, more transparent and less extensively delocalized organics
like urea or its analogs have been considered.

27
Recent interest is centered on metal complexes of certain organic
ligands and among them metal complexes of thiocyanate and thiourea are of
special interest owing to their large nonlinearity, high laser damage threshold,
low UV-cut off and good mechanical properties. An interesting class of semi-
organic crystals receiving wider attention in recent past is the amino acid
family which includes the analogs of L-arginine, L-histidine, L-alanine, and
L-lysine etc. Among organic crystals of NLO applications, amino acids
display specific features of interest such as, (i) molecular chirality, which
secures acentric crystallographic structures, (ii) absence of strongly
conjugated bonds leading to high transparency ranges in the visible and UV
spectral regions and (iii) zwitterionic nature of the molecule, which favours
crystal hardness. Amino acid can be used as a basis for synthesizing organic-
inorganic compounds like L-arginine phosphate and derivatives. L-arginine
phosphate monohydrate (LAP) is a new nonlinear optical (NLO) material first
introduced by Chinese material scientists in 1983 30
. LAP crystals are usually
grown from aqueous solution by the temperature lowering technique. LAP
crystals caught the attention of many researchers because of their high
nonlinearity, wide transmission range (220-1950 nm), high conversion
efficiency (38.9%) and high damage threshold. Monaco et al 30
formed LAP
and its chemical analogs from the strongly basic amino acid and various other
acids. All the compounds in this class contain an optically active carbon atom
and, therefore, all of them form acentric crystals. All the crystals are optically
biaxial and among them several give second harmonic signals greater than
quartz. It has been reported that L-arginine fluoride (LAF) possesses high
NLO coefficient next to LAP. LAF has a very strong type-I position, i.e.,
angularly insensitive compared to LAP, which makes LAF crystal attractive of
certain cascade scheme for producing third harmonic. The amount of second
harmonics generated in a powder LAF sample at 1064 nm is 5.6 times relative
to a quartz standard. The efficiency of frequency doubling of L-arginine

28
hydrofluoride (LAHF) was 39% and was larger than KDP (22%) and LAP
(33%). The growth and properties of new semiorganic nonlinear optical
crystal, tetra L-lysine alanine monohydrochloride dihydrate (TLAMHCl) has
been studied. The second harmonic generation (SHG) efficiency of
TLAMHCl was found to be 1.2 times that of KDP.
L-histidine salts can display high NLO properties due to the presence
of imidazole group in addition to amino-carboxylate. Among the L-histidine
analogs, the low temperature solution grown L-histidine tetrafluoroborate
(LHFB) is a promising NLO material and has superior NLO properties than
LAP. The SHG intensity of L-HFB crystal is five times that of the KDP.
Single crystals of L-histidinium dihydrogen orthophosphate ortho-phosphoric
acid (LHP) were grown by slow evaporation technique and its SHG efficiency
was found to be nearly 4 times that of KDP. The SHG efficiency of semi-
organic glycine nitrate (GSN) was found to be 2 times that of KDP. Glycine
forms the ferroelectric diglycine nitrate whose spectral transparency range is
from 245 to 1900 nm.
Tris (glycine) calcium (II) dichloride, bimetallic thiocyanate crystals of
Cadmium mercury thiocyanate, Zinc cadmium thiocyanate, Manganese
mercury thiocyanate, deuterated L-arginine trifluoroacetate, L-alanine
lithium chloride, L-arginine hydrochloride, L-arginine hydrofluoride, Glycine
potassium nitrate, Zinc guanidinium phosphate, Lithium sulfate monohydrate,
Thiosemicarbazide cadmium chloride monohydrate and Potassium
borosuccinate were grown by slow evaporation and unidirectional methods
and were reported to be NLO active and identified as potential candidates for
NLO applications 31-41
.
29
2.2 CHARACTERIZATION TOOLS AND TECHNIQUES
The advent of sophisticated instruments employing non-destructive
techniques has enabled the researchers to carry out spectral measurements,
structure determination and chemical analysis of new materials. The aim of
this section is to present a comprehensive description on the techniques that
are followed to characterize the crystal samples in the present research work.
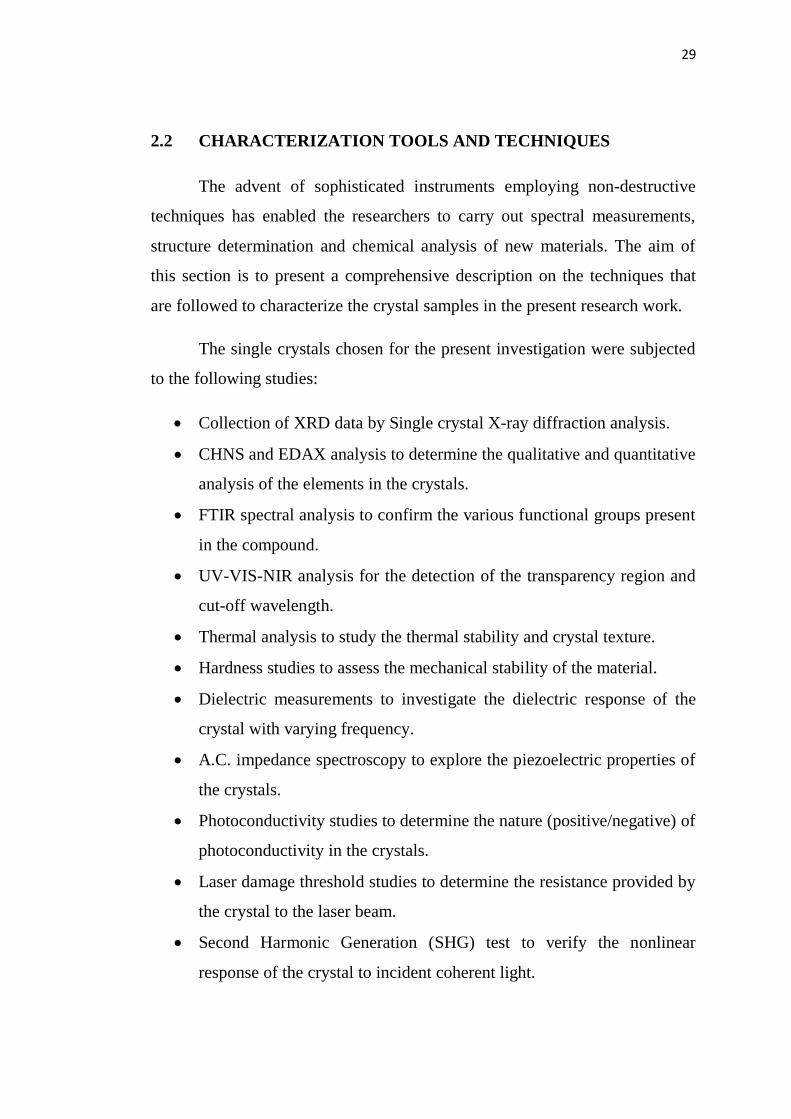
The single crystals chosen for the present investigation were subjected
to the following studies:
Collection of XRD data by Single crystal X-ray diffraction analysis.
CHNS and EDAX analysis to determine the qualitative and quantitative
analysis of the elements in the crystals.
FTIR spectral analysis to confirm the various functional groups present
in the compound.
UV-VIS-NIR analysis for the detection of the transparency region and
cut-off wavelength.
Thermal analysis to study the thermal stability and crystal texture.
Hardness studies to assess the mechanical stability of the material.
Dielectric measurements to investigate the dielectric response of the
crystal with varying frequency.
A.C. impedance spectroscopy to explore the piezoelectric properties of
the crystals.
Photoconductivity studies to determine the nature (positive/negative) of
photoconductivity in the crystals.
Laser damage threshold studies to determine the resistance provided by
the crystal to the laser beam.
Second Harmonic Generation (SHG) test to verify the nonlinear
response of the crystal to incident coherent light.

30
2.3 SINGLE CRYSTAL X-RAY DIFFRACTION ANALYSIS
Single crystal X-Ray Diffraction (Single crystal XRD) is a non-
destructive analytical technique which provides detailed information about the
molecular structure, atomic coordinates, bond lengths, bond angles, unit cell
dimensions, molecular orientation, and packing of molecules in single
crystals. Directly related is single-crystal refinement, where the data
generated from the X-ray analysis is interpreted and refined to obtain the
crystal structure. Single crystal X-ray diffractometer collects intensity data
required for structure determination. Only single crystals can be analysed.
Non-crystalline samples (amorphous) cannot be analysed. The size of the
crystal should be of the order of a few mm3.
Accurate measurements of intensities of reflections of all Miller indices
within a specified reciprocal radius (usually 25° for MoKα and 68° for CuKα)
is needed to find the structure, while unit cell parameters depend only on
direction of reflections. For single-crystal work, the specimen should be
smaller than the cross sectional diameter of the beam. Larger crystals can be
cut down to proper size and smaller crystals may be suitable if they contain
strongly diffracting elements.
The monochromatic X-rays incident on a plane of single crystal at an
angle θ is diffracted according to Braggs' relation 42
represented in equation
(2.1):
2d sin θ = n λ (2.1)
Where„d‟ is the interplanar spacing of the incident plane, „λ‟ is the wavelength
of X-rays and „n‟ is a positive integer. The intensity of the diffracted rays
depends on the arrangement and nature of atoms in the crystal. Collection of
intensities of a full set of planes in the crystal contains the complete structural
information about the molecule. Fourier transformation techniques are used to

31
determine the exact coordinates of atoms in the unit cell from this data. With
the set of X-ray diffraction data collected, unit cell parameters, space groups,
molecular structure of the crystalline solids and Miller indexing the different
faces of the crystal are possible. Space group tells us the symmetry with which
the molecules are arranged within the unit cell. All the geometrical features of
molecules (bond distance, bond angles, torsion angles between bonds,
dihedral angles between planes etc.,) may be obtained from coordinates. The
schematic representation of the single crystal XRD is shown in Figure 2.1.
Figure 2.1 Schematic of 4-Circle diffractometer, the angles between the
incident ray, the detector and the sample (http://serc.carleton.edu)
Specific applications of single-crystal diffraction include:
New mineral identification, crystal solution and refinement.
Determination of unit cell, bond-lengths, bond-angles and site-
ordering.
Characterization of cation-anion coordination.
Variations in crystal lattice with chemistry.

32
With specialized chambers, structures of high pressure and/or
temperature phases can be determined.
Determination of crystal-chemical vs. environmental control on
mineral chemistry.
Powder patterns can also be derived from single-crystals by using
specialized cameras.
In the present study, the single crystal X-ray diffraction analysis was
performed using Bruker Kappa Apex II single crystal X-ray Diffractometer,
with MoKα radiation of wavelength λ = 0.7107A° (Figure 2.2).
Figure 2.2 Instrumental set up of Bruker Kappa Apex II single
crystal X-ray Diffractometer.

33
2.4 CHNS ANALYZER
Elemental analyzer technique determines the presence of the elements
like carbon, nitrogen, hydrogen and sulphur in a given sample and gives the
result as percentage amount of these against the total weight. Most of the
organic compounds are made up of these three elements and oxygen; hence
after determining these three elements the percentage weight of oxygen can be
easily calculated.
This is an important study when it comes to a newly synthesized
compound to prove its exact composition. Solid samples weighing from less
than 1 mg up to 200 mg are packed in tin boats. The principle of the
instrumentation is that the substance under study is combusted under oxygen
stream in a furnace at high temperatures (1000 °C). In the combustion process,
carbon is converted to carbon dioxide; hydrogen to water; nitrogen to nitrogen
gas/oxides of nitrogen and sulphur to sulphur dioxide. That is, the end product
of the combustion would be mostly the oxides of the concerned elements in
the form of gases. These are then separated and carried to the detector using
inert gases helium or argon. Schematic diagram of an automatic C, H, and N
analyzer is shown in Figure 2.3.

34
Figure 2.3 Schematic diagram of an automatic C, H, and N
analyzer
The Vario EL III-Germany CHNS analyser was used in the present
study. Samples must be non-fluorinated, non-explosive, about 10-30 mg for
solid sample or 25ml for liquid sample (depending on the components).
2.5 ENERGY DISPERSIVE X-RAY ANALYSIS (EDAX)
It is a technique used for identifying the elemental composition of the
specimen. The EDAX analysis system works as an integrated feature of a
scanning electron microscope (SEM), and cannot operate on its own without
the latter. During EDAX analysis, the specimen is bombarded with an electron
beam inside the scanning electron microscope. The bombarding electrons
collide with the specimen atoms' own electrons, knocking some of them off in
the process. The EDAX spectrum is a plot of intensity of X-rays vs. energy of
the emitted X-rays. An EDAX spectrum normally displays peaks
corresponding to the energy levels for which the most X-rays have been
received. Each of these peaks is unique to an atom, and therefore corresponds

35
to a single element. The higher the intensity of peak in a spectrum, the more
concentrated is the element in the specimen.
In the present study the EDAX measurements were performed by using
JEOL Model JED – 2300 Energy Dispersive X-ray (EDAX) Microanalysis
system attached to a JEOL JSM-6390LV scanning electron microscope
(SEM) with a low vacuum resolution of 4 nm.
2.6 FOURIER TRANSFORM INFRARED SPECTROSCOPY (FTIR)
Infrared spectroscopy is a very useful technique for characterization of
materials that gives information about the composition and the structure of
molecules. IR spectra originate in transitions between two vibrational levels
of a molecule in the electronic ground state and are usually observed as
absorption spectra in the infrared region. For a molecule to present infrared
absorption bands it is needed that it has a permanent dipole moment.
The infrared spectrum can be divided into two regions, one called the
functional group region and the other the fingerprint region. The functional
group region is generally considered to range from 4000 cm-1
to 1500 cm-1
and all frequencies below 1500 cm-1
are considered characteristics of the
fingerprint region. The fingerprint region involves molecular vibrations,
usually bending motions which are characteristic of the entire molecule or
large fragments of the molecule. Thus these are used for identification of the
material. The functional group region tends to include motions, generally
stretching vibrations, which are more localised and characteristic of the typical
functional groups, found in organic molecules. While these bands are not very
useful in confirming identity, they do provide some very useful information
about the nature of the components that make up the molecule.
Fourier-transform infrared (FTIR) spectroscopy is based on the idea of
the interference of radiation between two beams to yield an interferogram.

36
The latter is a signal produced as a function of the change of path length
between the two beams. The two domains of distance and frequency are
interconvertible by the mathematical method of Fourier-transformation.
The FTIR spectrometer consists of an infrared source: globar and
mercury vapour lamp, a sample chamber with a provision for holding solids,
liquids and gases, monochromator, a detector and a recorder, which are
integrated with a computer.
An interferometer chamber comprising of KBr and Mylar beam
splitters is followed by a sample chamber and detector. The schematic
diagram of a FTIR spectrometer is shown in Figure 2.4. The spectrometer
works under vacuum condition. Solid samples are dispersed in KBr or
polyethylene pellets depending on the region of interest. Spectra are plotted
on a HP plotter and data can be printed. Three different techniques are
employed commonly in recording such spectra. For solid compounds, that are
insoluble in the usual solvents, a convenient sampling method is the Pressed
Pellet Technique. A few milligrams of the sample are ground together in an
agate or mullite mortar with about 100 times the quantity of a material (the
matrix) transparent to the infrared. The usual material is KBr, although other
compounds such as CsI, TlBr and Polyethylene are used in special
circumstances.
Some of the general uses of FTIR spectra are:
Identification of all types of organic and many types of inorganic
compounds.
Determination of functional groups in organic materials.
Determination of the molecular composition of surfaces.
Identification of chromatographic effluents.
Quantitative determination of compounds in mixtures.

37
Determination of molecular conformation (structural isomers) and
stereochemistry (geometrical isomers).
Determination of molecular orientation (polymers and solutions).
In the present investigation, the infrared spectrum of the grown crystals
was analyzed in the region between 400 and 4000 cm-1
with Perkin Elmer
FTIR spectrometer model SPECTRUM RXI with a resolution of
4 cm-1
, using KBr pellet technique.
2.7 UV–Vis-NIR SPECTROSCOPY
Ultraviolet-visible spectroscopy is also known as electronic
spectroscopy. Ultraviolet (200-400 nm) and visible (400-800 nm) absorption
spectroscopy is the measurement of the attenuation of a beam of light after it
passes through a sample or after reflection from a sample surface.
Ultraviolet and visible light are energetic enough to promote outer
(valence) electrons to higher energy levels. Valence electrons are found in
three types of electron orbitals namely „σ‟ bonding orbitals, „π‟ bonding
orbitals and non-bonding orbitals (n-lone pair electrons). Sigma „σ‟ bonding
orbitals tend to be lower in energy than „π‟ bonding orbitals, which in turn are
lower in energy than non-bonding orbitals. The unoccupied or anti bonding
orbitals (π* and σ*) are the orbitals of highest energy. An energy level
diagram showing electronic transitions is depicted in Figure 2.4. Of the six
transitions outlined, only the two lowest energy ones (n π*) and
(π π*) are achieved by the energies available in the 200 to 800 nm
spectrum. As a rule, energetically favored electron promotion will be from
the highest occupied molecular orbital (HOMO) to the lowest unoccupied
molecular orbital (LUMO) and the resulting species is called an excited state.
In particular, absorption bands results from transitions (π π*) and
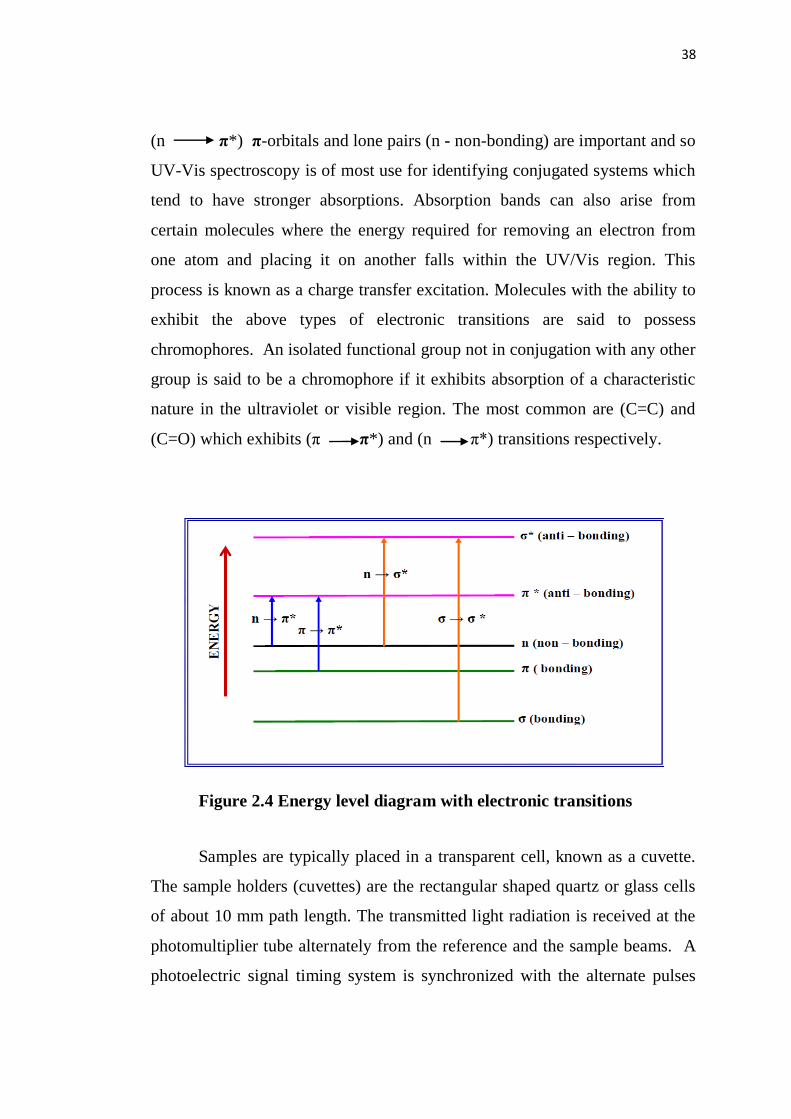
38
(n π*) π-orbitals and lone pairs (n - non-bonding) are important and so
UV-Vis spectroscopy is of most use for identifying conjugated systems which
tend to have stronger absorptions. Absorption bands can also arise from
certain molecules where the energy required for removing an electron from
one atom and placing it on another falls within the UV/Vis region. This
process is known as a charge transfer excitation. Molecules with the ability to
exhibit the above types of electronic transitions are said to possess
chromophores. An isolated functional group not in conjugation with any other
group is said to be a chromophore if it exhibits absorption of a characteristic
nature in the ultraviolet or visible region. The most common are (C=C) and
(C=O) which exhibits (π π*) and (n π*) transitions respectively.
Figure 2.4 Energy level diagram with electronic transitions
Samples are typically placed in a transparent cell, known as a cuvette.
The sample holders (cuvettes) are the rectangular shaped quartz or glass cells
of about 10 mm path length. The transmitted light radiation is received at the
photomultiplier tube alternately from the reference and the sample beams. A
photoelectric signal timing system is synchronized with the alternate pulses

39
which permits the comparison of signals from the two beams. The difference
between the two signals is recorded with the help of a motor driven pen or is
interfaced with a PC-XT and stored there for easy reference. Samples in solid
form, powder, pellets are dissolved in suitable solvents to form the contents of
the sample cell and the solvents are taken in the reference cell.
General applications of Ultraviolet Spectroscopy
Extent of conjugation in organic compounds.
Distinction between conjugated and Non-conjugated compounds.
Detection of a Chromophore in an unknown compound by comparison
of its spectrum with that of a known compound.
Identification of a chromophore (Functional Group).
Study of strain.
Study of Geometric Isomerism.
Study of Tautomerism.
In the present work, the UV-Visible spectrum was recorded by Lamda
35 model Perkin-Elmer double beam UV–Vis– NIR spectrometer in the
range from 190 nm to 1100 nm. The instrumental make of UV–Vis– NIR
spectrometer is shown in Figure 2.5.

40
Figure 2.5 Instrumental make of Lamda 35 model Perkin-Elmer double
beam UV–Vis– NIR spectrometer
2.8 THERMAL STUDIES
Thermal analysis is a very essential method to study the thermal
behaviour of materials and finds widespread applications in diverse industrial
and research fields. It is a general term, which covers a group of related
techniques in which the temperature dependence of the parameters of any
physical property of a substance is measured. Thermoanalytical methods
involve the measurement of various properties of materials subjected to
dynamically changing environments under predetermined conditions of
heating rate, temperature range and gaseous atmosphere or vacuum.
Thermoanalytical analysis incorporates the following three closely related
techniques:
Thermogravimetric analysis (TGA), which involves monitoring weight
while varying temperature.
Differential thermal analysis (DTA), which involves comparing the
precise temperature difference between a sample and an inert reference
material, while heating both.

41
Differential scanning calorimetry (DSC), similar to DTA except that
electrical energy is used to restore the cooler of the two materials to the
same temperature as the other. This allows direct measurement of
energy changes.
These techniques are useful for determining glass points, phase changes, water
of crystallization and mixtures where the components have different melting
or decomposition points.
Thermogravimetric analysis (TGA) is based on the measurement of
mass loss of material as a function of temperature. In thermogravimetry a
continuous graph of mass change against temperature is obtained when a
substance is heated at a uniform rate or kept at constant temperature. TG curve
helps in revealing the extent of purity of analytical samples and in determining
the mode of their transformations within specified range of temperature 43
.
The instrument used in thermogravimetry (TG) is called a thermobalance as
shown in Figure 2.6.
Figure 2.6 Block diagram of a Thermobalance

42
Basic components of a typical thermobalance are listed below:
Balance
Furnace - heating device.
Unit for temperature measurement and control (Programmer)
Recorder - automatic recording unit for the mass and temperature
changes
Differential thermal analysis (DTA) is a technique in which the
temperature of the substance under investigation is compared with the
temperature of a thermally inert material such as α-alumina and is recorded
with furnace temperature as the substance is heated or cooled at a
predetermined uniform rate. The schematic representation of DTA is shown in
Figure 2.7.
Differential thermal analyzer consists of following basic components:
Furnace Assembly
Sample and reference holder with temperature detector
Temperature programmer
Amplifier and recorder
Atmosphere control equipment for furnace and sample holder
The instrument measures the differential temperature of the sample as a
function of temperature or time where the temperature rises at a constant
linear rate.

43
Figure 2.7 Schematic diagram of a differential thermal analyzer (a)
complete layout (b) furnace part sharing continuous heating of sample
and standard
In differential scanning calorimetry (DSC), the initial temperatures of
the sample and the reference are kept same. The amount of heat that has to be
supplied to the sample or reference to achieve this equivalence in temperature
is constantly measured over the temperature range employed. This can be
achieved by placing separate heating devices in the sample and reference
chambers. This is in contrast to the DTA scheme, where both sample and
reference are heated by the same source. In DSC, samples for analysis,
ranging in size from 1 to 100 mg, are placed in a sealed sample container. A
wide range of heating rate (0.5 to 80°C/min) can be used. DSC instruments
are generally energy sensitive and detect heat evolution or absorption at rate

44
less than one millicalories per second. The block diagram of DSC is shown in
Figure 2.8.
Figure 2.8 Block diagram of a DSC instrument
In the present work, thermal behaviour of the grown samples was
studied by using TG/DTA 6200 simultaneous thermal analyzer between
32°C to 800°C at a heating rate of 20°C/min in nitrogen atmosphere and
Differential scanning calorimetry (DSC) was carried out at a scanning rate of
10 K/min in nitrogen atmosphere, by Perkin Elmer NETZSCH, DSC-204
equipment (Figure 2.9).

45
Figure 2.9 Instrumental make of Perkin Elmer NETZSCH, DSC-204
equipment
2.9 MICROHARDNESS STUDIES
Hardness is a physicochemical property that characterizes the state of
the material under test and gives information on some specific features of the
material such as the character of the chemical bonding. It is the resistance
which the material offers to indentation by a much harder body and may be
termed as a measure of the resistance against lattice destruction or permanent
deformation or damage.
The most popular and simplest test is the static indentation test,
wherein an indenter of specific geometry is pressed into the surface of a test
specimen under a known load. A permanent impression is retained in the
specimen after removal of the indenter. The hardness is calculated from the
area or the depth of indentation produced. The variables are the type of
indenter or load. The indenter is made up of a very hard material to prevent its
deformation by the test piece, so that it can cover materials over a wide range
of hardness. For this reason, either a hardness steel sphere or a diamond
pyramid or cone is employed. A pyramid indenter is preferred as

46
geometrically similar impressions are obtained at different loads. In this static
indentation test, the indenter is pressed perpendicularly to the surface of the
sample by means of an applied load. By measuring the cross sectional area or
depth of the indentation and knowing the applied load, empirical hardness
number may be calculated.
In the dynamic indentation test, a ball or a cone (or a number of small
spheres) is allowed to fall from a definite height and the hardness number is
obtained from the dimensions of the indentation and the energy of impact. In
this method, microindentation is made on the surface of a specimen with the
help of diamond pyramidal indenter. Smith et al 44
have proposed that a
pyramid be substituted for a ball in order to provide geometrical similitude
under different values of load. The Vickers pyramid indenter where opposite
faces contain an angle (α = 136°) is the most widely accepted pyramid
indenter (Figure 2.10).
Figure 2.10 Schematic description of Vickers Hardness Testing

47
A pyramid indenter is suited for hardness tests due to the following reasons.
The contact pressure for a pyramid indenter is independent of indent
size.
Pyramid indenters are less affected by elastic release than other
indenters.
The base of the Vickers pyramid is a square and the depth of indentation
corresponds to 1/7th
of the indentation diagonal. A diamond, in the form of a
right pyramid with a square base and an angle of 136° between opposite faces
is forced into the material subjected to a load of 1 to 100 kgf. The full load is
normally applied for 10 to 15 seconds. The two diagonals, „d1‟ and „d2‟, of the
indentation left in the surface of the material after removing the load are
measured, and their arithmetic mean „d‟ is calculated. The area of the sloping
surface of the indentation is calculated. The Vickers hardness is the quotient
obtained by dividing the kgf load by the square mm area of indentation.
The Vickers hardness number „Hv‟ of Diamond Pyramid Number
(DPN) is defined as
Hv = 2P sin (α/2) (2.2)
d2
Where „α‟ is the apex angle of the indenter (α = 136°). The Vickers hardness
number is thus calculated using the relation in equation (2.3):
Hv = 1.8544 P kg/mm2
(2.3)
d2
Where „P‟ is the applied load in kg and „d‟ is the diagonal length of the
indentation mark in mm. Standard designation of Vickers hardness is usually
given with load and duration values: 450VHN/30/20 means a 450 Vickers
hardness value measured under a load of 30kg for duration of 20 sec.

48
The data obtained for „P‟ and„d‟ can be analysed by Meyers‟ relation in
equation (2.4):
P = k1 dn (2.4)
Where „k1‟ and „n‟ are constants for the material. The constant „k1‟ is usually
referred to as the standard hardness. Meyers‟ index „n‟ which represents work
hardening capacity of the material can be determined by plotting „log P’
versus „log d’.
Combining Equations (2.3) and (2.4), we have
Hv = 1.8544 k1 dn-2
(2.5)
Hv = 1.8544 k1 (1+2/n)
P (1-2/n)
(2.6)
Hv = b P (n-2)/n
(2.7)
The above expression shows that „Hv‟ should increase with increase in
„P‟ if n > 2 and decrease with the same if n < 2. According to Onitch 45
and
Hanneman „n‟ should lie between 1 and 1.6 for softer ones.
Elastic stiffness constant „C11’ of a material can be calculated from the
Woosters‟ empirical relation as given in equation (2.8):
C11 = Hv7/4
(2.8)
If the stiffness constant C11 is high, it reveals that the binding forces are quite
strong.
In the present investigation, Microhardness studies have been carried
out on the grown crystals using a SHIMADZU HMV-2T Vickers
microhardness tester (Figure 2.11) fitted with a Vickers diamond pyramidal
indenter attached to an incident light microscope.

49
Figure 2.11 Instrumental make of SHIMADZU HMV-2T Vickers
Microhardness tester
2.10 DIELECTRIC STUDIES
One of the most important parameters widely used is the relative
dielectric constant or relative permittivity. The study of dielectric constant of a
material gives an insight into the nature of bonding in the material.
The dielectric constant is defined as the ratio of the field strength in
vacuum to that in the material for the same distribution of charge. The
dielectric constant of a substance is a property of the constituent ions. The
relative dielectric constant εr or relative permittivity is given in equation (2.9):

50
εr = ε/εo (2.9)
ε=Cd/A (2.10)
C = εr εo A/d (2.11)
Where „A’ is the area of the sample and „d‟ is the thickness of the sample. The
relative permittivity „εr‟ is usually known as permittivity. It is always greater
than unity. The capacitance „Co‟ of a parallel plate condenser having a
capacitance C in air can be given by,
C=εr Co (2.12)
εr = C/Co (2.13)
‘εr’ can be found by the measurement of capacitance. The higher the
dielectric constant, the lower the electrostatic binding and hence higher is the
lattice energy. Major contributions to the dielectric constant are from:
The extrinsic nature of the material
The electronic polarizability
The ionic polarizability
The deformation of the ions
In the present work, the dielectric conductivity studies for the crystal were
done with DIGITAL LCRZ METER, TH2816A in the range of frequencies
between 50 Hz-200 KHz at room temperature.
2.11 PHOTOCONDUCTIVITY STUDY
Photoconductivity is an important property of solids by means of which
the bulk conductivity of the sample changes due to incident radiation.
Photoconduction includes the generation and recombination of charge carriers
and their transport to the electrodes. Obviously, the thermal and hot carrier
relaxation process, charge carrier statistics, effects of electrodes, and several
mechanisms of recombination are involved in photoconduction.

51
Photo-absorption and hence photo-conduction takes place by one of the
following mechanisms:
Band-to-band transitions.
Impurity levels to band edge transitions.
Ionization of donors.
Deep level (located in the valence band) to conduction band transitions.
Dark conduction
Dark current Id, is the amount of current that flows through the material
or device when no radiation is incident on it. It changes with operating
temperature and applied voltage, and therefore these parameters should be
always mentioned. Dark current is not a constant background current but also
has fluctuations or noise. The average DC value of the current is generally
mentioned as dark current.
Negative photoconductivity
In few cases, it has been observed that when radiation of certain energy
is incident on a photoconductor, a decrease in current is observed instead of
the expected increase; this phenomenon is called “negative
photoconductivity”. The variation in the mobilities of charge carriers is
generally very small (here two-dimensional materials are excluded) and hence
can be ignored. This means that either the number of free charge carriers or
their life time is substantially reduced by incident radiation. One well-
accepted model due to Stockmann (Joshi 1990) is based on a two-level
scheme. According to this model, the forbidden band gap contains two types
of centres with energies E1 and E2. One type is located between the Fermi
level and the conduction band, while the other is situated close to the valence
band or between the Fermi level and the valence band. It is also assumed that
the first type of centres have a high capture cross section for electrons and the

52
probability of electrons being ejected to the conduction band is very low. In
short, the function of these types of centers in the presence of radiation is to
create holes (by accepting electrons from the valence band) but at the same
time not to increase the number of free electrons. The second type of centres
has a high cross-section for electrons and holes and consequently they capture
electrons from the conduction band and holes from the valence band and
recombine them. Thus, the net number of mobile charge carriers is reduced
due to incident radiation giving rise to negative photoconductivity.
In the present work, the photoconductivity study on the crystals was
carried out by using Keithley 485 Picoammeter at room temperature. The
variation of both dark current „Id’ and photocurrent „Ip’ with applied field was
analysed. The crystal sample is well-polished and surfaces are cleaned with
acetone. This is attached to a microscope slide and two electrodes of thin
copper wire (0.14cm diameter) are fixed onto the specimen at some distance
apart using silver paint. After this it is annealed at a temperature of 100°C to
perfect dryness. A DC power supply, Keithley 485 Picoammeter and the
prepared sample are connected in series. The sample is covered with a black
cloth to avoid exposure to any radiation. The current (dark) is measured. To
measure the photoconductivity, light from a 100W halogen lamp is focused
onto the sample. The current is noted for varying applied fields as before. The
experimental set-up for measuring photoconductivity is as shown in Figure
2.12 and the instrumental make is shown in Figure 2.13.

53
Figure 2.12 Experimental set-up for measuring photoconductivity
Figure 2.13 Instrumental make of Keithley 485 Picoammeter

54
2.12 A .C. IMPEDANCE SPECTROSCOPY
Most of the crystals applied in the nonlinear optics possess
piezoelectric properties. A method has been recently proposed for the
intrinsic temperature measurement and the accurate determination of the weak
linear optical absorption of the piezoelectric optical materials. In the present
work the interaction of the single-mode high-power laser radiation with
crystals is investigated by means of the radio frequency impedance
spectroscopy. The most common approach is to calculate the crystal electrical
impedance at the fixed frequency of the external voltage applied to the crystal
from the measured amplitude and the phase shift of the resulting alternating
current flowing through the crystal. The crystal complex electrical impedance
is determined in the wide radiofrequency range from 10-4
to 109 Hz. The
experimental set-up for measuring a.c. impedance is shown in Figure 2.14.
In the present work, the AC impedance was measured by employing an
Impedance analyzer, EG & G Princeton Applied Research, USA.
Figure 2.14 Block-scheme of the experimental setup for the crystal
complex electrical impedance measurements.

55
2.13 NLO TEST – KURTZ POWDER SHG METHOD
Recent interest is focused on to find the materials which have suitable
nonlinear optical properties for use as the active media in efficient second
harmonic generators, tunable parametric oscillators and broadband electro-
optic modulators. Kurtz and Perry powder technique remains an extremely
valuable tool for initial screening of materials for second harmonic generation.
Employing this technique; Kurtz 9 surveyed a very large number of
compounds.
The nonlinear optical property of the single crystals can be tested by
passing the output of Nd: YAG Quanta ray laser. The schematic of the
experimental setup used for SHG studies is shown in the Figure 2.15. A
Q-switched, mode locked Nd: YAG laser was used to generate about
6mJ/pulse at the 1064 nm fundamental radiation. This laser can be operated
in two modes. In the single shot mode the laser emits a single 8 ns pulse. In
the multi shot mode the laser produces a continuous train of 8ns pulses at a
repetition rate of 10Hz.
In the present study, a single shot mode of 8ns laser pulse with a spot
radius of 1mm was used. This experimental setup used a mirror and a 50/50
beam splitter (BS) to generate a beam with pulse energies of about 6.2 mJ. A
fundamental laser beam of 1064 nm wavelength, 8 ns pulse in depth with 10
Hz pulse rate was made to fall normally on the sample cell. The power of the
incident beam was measured using a power meter. The transmitted
fundamental wave was passed over a monochromator (Czerny Turney
Monochromator), which separates 532 nm (SHG signal) from 1064 nm and
absorbed by a CuSO4 solution. CuSO4 solution removes the 1064 nm light.
BG38 filter removes the residual 1064 nm light. The green light was detected
by a photomultiplier tube (Hammamatsu RC 109, a visible PMT) and
displayed on a storage oscilloscope (TDS 2052 B 500 MHz phosphor digital

56
oscilloscope). Potassium dihydrogen phosphate, KDP and Urea crystals were
powdered to identical size and were used as reference materials in the SHG
measurement.
Figure 2.15 Schematic experimental set up for SHG efficiency
measurement.
In the present work, the NLO property of the crystal was tested by
Kurtz powder SHG test using Q-Switched Nd: YAG laser (1064 nm) with
Quanta Ray Series as the source and Coherent Molectron Powermeter as the
photomultiplier to record the output radiation.
2.14 LASER DAMAGE THRESHOLD STUDY
An important related property of NLO crystals is the threshold for
catastrophic laser induced damage. Laser induced damage in optical materials
is a phenomenon involving interaction of high power laser radiation with
matter and various physical, chemical, mechanical, optical and other aspects
of materials come into play. It is evident that the harmonic conversion
efficiency is proportional to the power density of the fundamental beam.
Hence, a convenient way to increase the efficiency is to focus the beam into

57
the crystal. But, this often leads to breakdown of the materials,
catastrophically damaging the crystal. It is then useful to prescribe the
maximum permissible power for a particular crystal, defined as damage
threshold.
It is believed that the formation of an ionized region of dense plasma is
the first and the most important step in a damage event. In recent times, there
have been several effects to model the laser damage processes by taking the
pulse shape and duration in to account. Laser damage in general manifests
itself as a localized microscopic entity. Microscopic examination of the
damage sites created in different materials often suggests the mechanism
responsible for such a process. The damage in NLO materials like KDP and
Deuterated Potassium Phosphate (DKDP) manifests itself as micro-cavity
whose sizes are insensitive to the wavelength of the laser beam, suggesting a
wavelength independent absorption mechanism. However, the damage
mechanisms vary from material to material and hence damage studies become
important for newly discovered materials. Laser damage measurement was
carried out on the crystal at 1064 nm. The single shot surface damage
thresholds have been determined. The laser damage threshold depends on
pulse duration, focal spot geometry, sample quality, previous history of the
sample, experimental technique employed etc. Recent investigations into laser
damage in various optical materials by nanosecond pulses have shown that the
temperature reached at the damage site could be as high as 12000 K 46
. One
can expect the damage to be of thermal origin. However, one cannot rule out
other mechanisms being operative simultaneously, as the damage mechanism
is quite complex and depends on the nature of the material and various
experimental parameters.
The experimental set-up used for the measurement of laser damage of
the samples is shown in Figure 2.16. A Q-switched Nd: YAG laser

58
(Continuum USA, Model: Surelite-III) of wavelength 1064 nm and pulse
width 10 ns, TEM00 single shot mode was used. The energy of the laser pulses
was controlled by an attenuator (combination of λ / 2 plate and glan polarizer)
and delivered to the test sample located near the focus of a plano-convex lens
of focal length 30 cm. The occurrence of single pulse damage was observed
by monitoring the fall of transmitted intensity as detected by a fast PIN type Si
photodiode and traced in a digital storage oscilloscope (Tektronix: TDS
3054B). A reference pyro-electric energy meter records the energy of the
input laser pulse for which the crystal gets damaged. The laser damage
threshold was calculated using the relation in equation (2.14):
P = (E / τA) (2.14)
Where „P‟ is the Laser damage threshold in GW/cm2, „E‟ is the energy
required breaking the crystal, „τ‟ is the response time in ns and „A’ represents
the beam area.
Figure 2.16 Functional Block Diagram of the Setup used for laser
damage threshold measurement

59
2.15 CONCLUSION
The present chapter describes a brief review on literature survey of
NLO materials and the various characterization techniques to assess the
suitability of the single crystals grown by slow evaporation solution growth
method for nonlinear optical device applications. The structural
characterization and crystal system classification were carried out using single
crystal X-ray diffraction technique. The CHNS and EDAX studies were
performed to determine the qualitative and quantitative analysis of the
elements in the grown crystals. The linear and nonlinear optical spectroscopic
studies were performed to analyze the composition, identification of
functional groups and transparency window of the grown single crystals.
Since the entire thrust is with respect to NLO application, the SHG property
was estimated. In addition, the mechanical, thermal, dielectric,
photoconductivity and laser damage threshold of the grown crystals were also
investigated.