Embed Size (px)
Citation preview

Chapter 2 Funding of R&D

77
1 – Introduction At the European Summit in Barcelona (March 2002), the Heads of State or Government decided on the objective of increasing total R&D expenditure (GERD) to 3% of GDP (gross domestic product) in the EU (the “3 % objective”) by the year 2010. As an additional objective, they decided that one-third of R&D expenditure should be publicly funded, with the other two-thirds coming from the business community. This target was one of the headlines of the Lisbon Strategy from 2000. Flanders translated this objective within the Flemish context through the so-called Innovation Pact. This pact was signed in March 2003, and it contains a formal engagement by all the actors involved in the Flemish research and innovation landscape to jointly reach this 3% objective by means of complementary efforts.
In 2009, the Flemish Government and the Flemish social partners took the initiative to conclude the “Pact 2020”, which specifies and implements the broader societal objectives of the Flanders in Action (ViA) plan that was concluded in 2006. ViA was replaced in 2015 by the Visie 2050 plan (a long term strategy for Flanders). The importance of STI is reflected by the Pact 2020 target to spend 3% of GDP on R&D, in accordance with the EU 2020 Strategy. The Pact 2020 contains twenty thematic chapters with concrete targets and actions to be achieved by 2020, which are monitored on an annual basis. The specific targets include:
- innovation will be more widely and better distributed across all industries, business types and segments of society;
- an increase of turnover from new or improved products and services; - a year-on-year increase of the number of patent applications; - to be among the EU’s top-5 regions for public spending on eco-innovation.
2 - GERD In 2015, Flanders spent over 6,472 million euros on R&D (GERD). More than two-thirds of the research cost was paid by companies (the Business Enterprise Sector or BES) and almost one-third by public research institutes (PNP, GOV and HES). The R&D effort for Flanders represented almost two-thirds of the GERD for the whole of Belgium in 2015.
The R&D intensity (measured as the percentage of GERD related to GDP) of Flanders was 2.69% in 2015 (compared to 2.53% in 2012 and 2.56% in 2013 and 2.60% in 2014). Flanders ranks higher than the Netherlands, France and the EU-28 average, yet much lower than the USA, Germany, Japan, Korea and the Scandinavian top countries for the total R&D intensity of GERD in 2015.
When the total R&D intensity of the GERD (2.69% for 2015) is broken down by source of funding, 1.90% comes from private funds and 0.79% from public funds (federal, regional, community, European and international funds), which equates to 71% and 29% by private and public sectors respectively.

78
Figure 8: Evolution of total R&D spending (GERD) and the R&D intensity of the GERD in Flanders from 2009 to 2015, in million euros (current prices)
Figure 9: International comparison of the R&D intensity of GERD for 2015
Source: OECD database, Main Science and Technology Indicators
Germany: provisional and national estimate; Denmark, Sweden, France, the Netherlands and Belgium: provisional figure; USA: provisional and excludes most or all capital expenditure; Japan: based on National Accounts; EU-28 : secretariat estimate.
4,1494,641
5,0885,676 5,827 6,074
6,472
2.062.21
2.33
2.53 2.56 2.62.69
0
0.5
1
1.5
2
2.5
3
0
1,000
2,000
3,000
4,000
5,000
6,000
2009 2010 2011 2012 2013 2014 2015
GERD R&D intensity - GERD
1.13
1.95 2.01 2.052.23
2.452.69 2.79 2.87 2.9 2.96
3.263.49
4.23
0
0.5
1
1.5
2
2.5
3
3.5
4
4.5

79
Figure 10: R&D intensity broken down by sector of performance or source of funds for Flanders, 2009-2015
3 - BERD In 2015, the business enterprise sector spent 4,538 million euros on R&D activities in Flanders, measured at current prices. This is the Business Expenditure on R&D (BERD), which corresponds to a R&D intensity (BERD as a % of GDP) of 1.89%. This level represents an increase for the GERD compared to 2013 (1.77%) and 2014 (1.82%). When the total R&D intensity of the BERD is broken down by source of funding, 1.68% comes from private funds and 0.21% from public funds (2015). The share of the BERD in the GERD was 70% in 2015.
Figure 11: Evolution of the R&D spending by companies (BERD) and R&D intensity for the BERD, from 2009 to 2015, in million euros (current prices)
1.35 1.48 1.59 1.76 1.77 1.82 1.89
0.71 0.74 0.740.77 0.79 0.78 0.82.06
2.21 2.332.53 2.56 2.6 2.69
0.6 0.66 0.68 0.77 0.79
1.46 1.55 1.65 1.79 1.90
0
0.5
1
1.5
2
2.5
3
2009 2010 2011 2012 2013 2014 2015
BERD/GDP non-BERD/GDP GERD/GDP
public funding/GDP private funding/GDP
2,7183,099
3,4743,956 4,025 4,246 4,538
1.351.48
1.59
1.76 1.77 1.821.89
0.00
0.25
0.50
0.75
1.00
1.25
1.50
1.75
2.00
0
500
1000
1500
2000
2500
3000
3500
4000
4500
5000
2009 2010 2011 2012 2013 2014 2015
BERD R&D intensity - BERD

80
Figure 12: International comparison of the R&D intensity of BERD for 2015
Source: OECD database, Main Science and Technology Indicators
Denmark, France and Belgium: provisional figure; EU-28: secretariat estimate; USA: provisional and other definition
The R&D activities (expenditure) within companies in Flanders are mainly focused on the following high-tech sectors (2015): chemicals and pharmaceuticals (NACE 20-21) account for more than 41% of total BERD expenditures on R&D (based on a sample); motion picture, video and TV production, computer programmes, engineering, and technical testing and analysis activities (NACE 59-63, 71-72) account for 12.7%; information technology, electronic products, optical products and electrical equipment (NACE 26-27) account for about 12.5%; machinery and transport (NACE 28-30) account for more than 10.1% In 2015, the R&D intensity in the business sector was 1.89%. Flanders therefore ranks higher than the EU-28 average, France and the Netherlands, but lower than the Scandinavian countries, Germany, the USA and Japan.
1.11%1.25%
1.44%1.77%
1.89%1.89%1.93%
1.99%2.01%
2.29%2.58%
0.00% 0.50% 1.00% 1.50% 2.00% 2.50% 3.00%
The NetherlandsEU-28
FranceBelgiumFlandersDenmarkFinland
USAGermanySwedenJapan

81
4 - Non-BERD Globally the share of R&D spending by the public sector within total R&D spending decreased between 2009 and 2015. R&D spending by the public sector (non-BERD = GOVERD + HERD + PNP) amounted to 1,934 million euros in 2015. About 39% of this amount was spent by public research institutes (GOV) and 60% by higher education institutions (HES). There is still a slight increase in the R&D expenditure (in absolute terms) of the public sector in 2014 and 2015, while the private sector noticed a stronger increase. The R&D intensity for the public sector (non-BERD as a % of GDP) in Flanders amounted to 0.80% in 2015, a stagnation compared to 2013 and 2014 after a steady increase since 2009. When the total R&D intensity of the non-BERD is broken down by source of funds, 0.23% is funded privately and 0.58% by public funds (2015).
Figure 13: Evolution of the R&D spending by GOV, HES and PNP (non-BERD=GOVERD+HERD+PNP), from 2009 to 2015, in million euros (current prices)
The GOVERD and HERD (2015) can be broken down by different fields of science. For the GOV sector, this indicates the dominant position of engineering and technology (71.6%). For the HES sector, the most important fields of science are the medical sciences (31.6%), the natural sciences (18.2%), the social sciences (17.7%) and engineering & technology (15.1%).
2009 2010 2011 2012 2013 2014 2015PNP 9 9 10 16 15 22 22HERD 904 984 1,032 1,069 1,136 1,122 1,167GOVERD 517 549 572 635 652 684 745NON-BERD 1,430 1,542 1,614 1,720 1,803 1,828 1,934
0
200
400
600
800
1,000
1,200
1,400
1,600
1,800
2,000

82
Figure 14: Evolution of the R&D intensity for the non-BERD (GOVERD, HERD and PNP) from 2009 to 2015
For the GOVERD, the most important source of funds in 2015 was abroad (51.9%), followed by government funding (40.2%) and thirdly the companies (7.1%). For the HERD, government funding was again the most important source of funds (72.6%), followed by the companies (17.0%) and abroad (7.9%). The proportion of the HERD that is supported by (domestic) companies for 2015 ranks higher internationally than any of the EU-28 countries and is more than twice the figure for the EU-28 as a whole. Only Germany has a similar proportion. In other words, companies are both an important client and an important source of funds for the research carried out at the Flemish higher education institutions.
Figure 15: International comparison of the funding of the HERD by companies, 2015, in %.
Source: OECD database, Main Science and Technology Indicators
EU-28: secretariat estimate;Flanders: figure for domestic companies, for domestic and foreign companies (figure= 17.3%); USA: provisional, projection and most or all capital expenditure is excluded
0.45% 0.47% 0.47% 0.48% 0.50% 0.48% 0.48%
0.26% 0.26% 0.26% 0.29% 0.29% 0.29% 0.31%
0.00% 0.00% 0.00% 0.01% 0.01% 0.01% 0.01%
0.71% 0.73% 0.74%0.77% 0.79% 0.78% 0.80%
-0.05%
0.05%
0.15%
0.25%
0.35%
0.45%
0.55%
0.65%
0.75%
0.85%
2009 2010 2011 2012 2013 2014 2015
HERDgew GOVERD PNP non-BERD
17
14.112.1
7.76.4
5.34.1 3.8 3.7
2.7 2.6 1.9
02468
1012141618
83
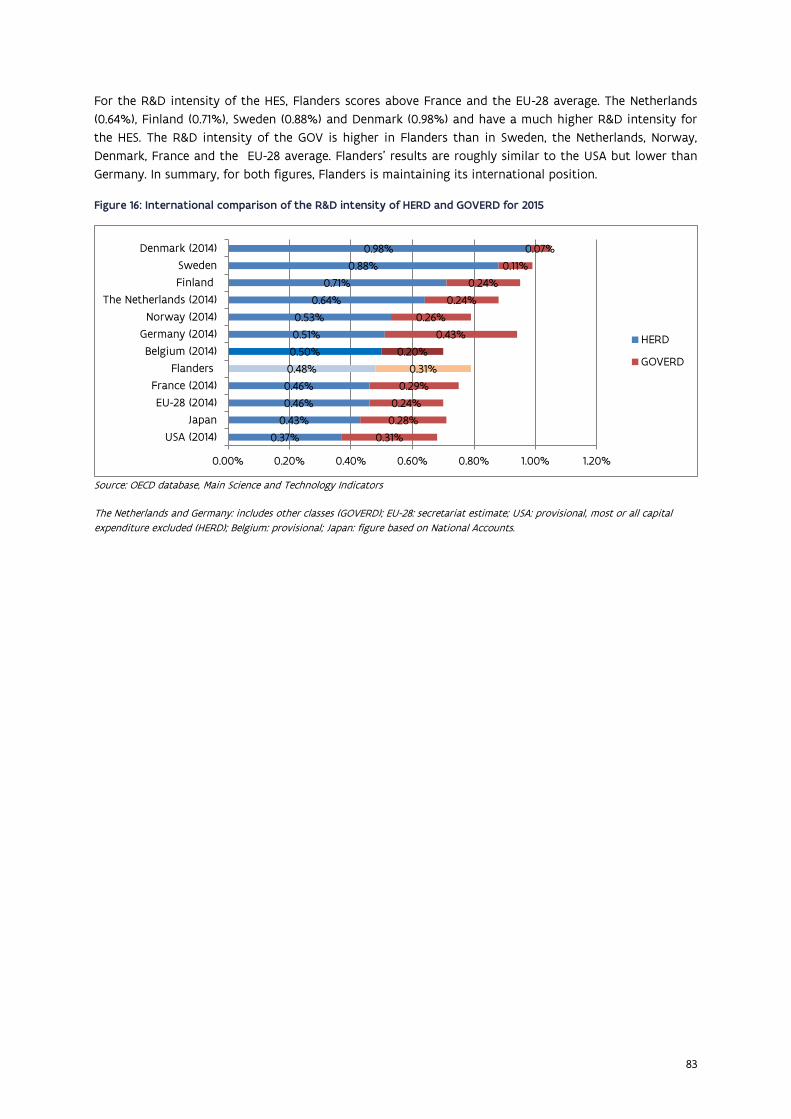
For the R&D intensity of the HES, Flanders scores above France and the EU-28 average. The Netherlands (0.64%), Finland (0.71%), Sweden (0.88%) and Denmark (0.98%) and have a much higher R&D intensity for the HES. The R&D intensity of the GOV is higher in Flanders than in Sweden, the Netherlands, Norway, Denmark, France and the EU-28 average. Flanders’ results are roughly similar to the USA but lower than Germany. In summary, for both figures, Flanders is maintaining its international position.
Figure 16: International comparison of the R&D intensity of HERD and GOVERD for 2015
Source: OECD database, Main Science and Technology Indicators
The Netherlands and Germany: includes other classes (GOVERD); EU-28: secretariat estimate; USA: provisional, most or all capital expenditure excluded (HERD); Belgium: provisional; Japan: figure based on National Accounts.
0.37%0.43%0.46%0.46%0.48%0.50%0.51%0.53%
0.64%0.71%
0.88%0.98%
0.31%0.28%0.24%
0.29%0.31%
0.20%0.43%
0.26%0.24%
0.24%0.11%
0.07%
0.00% 0.20% 0.40% 0.60% 0.80% 1.00% 1.20%
USA (2014)Japan
EU-28 (2014)France (2014)
FlandersBelgium (2014)
Germany (2014)Norway (2014)
The Netherlands (2014)FinlandSweden
Denmark (2014)
HERD
GOVERD

84
5 - GBARD This section examines in detail the R&D support received from Flanders, in particular that of the Flemish government, and compares it with that of other countries. GBARD (Government Budget Appropriations for R&D) is an indicator used by the OECD and EUROSTAT. The table below shows an international comparison of the GBARD as a percentage of GDP. The calculation method of the Flemish figure is explained further in this chapter.
It is clear that the trends for GBARD, expressed as a percentage of GDP, differ between countries. In some countries there is stagnation; in others there is even a drop over a period of several years. Figure 17 compares Flanders with selected countries. Because of the worldwide financial and economic crisis, followed by measures taken for the benefit of the economy, it is necessary to proceed with caution when comparing budgets. Comparison is therefore made for the year 2015, the most recent year with data for all the compared countries.
Table 2: International comparison of Government Budget Appropriations or Outlays for R&D (GBARD), expressed as a percentage of GDP(R)
2008 2009 2010 2011 2012 2013 2014 2015 2016 2017i
Denmark 0.86% 0.98% 0.99% 1.00% 1.00% 1.02% 1.00% 1.01% 0.95% *
Portugal 0.88% 1.00% 0.98% 1.00% 0.92% 0.93% 0.94% 0.98% 0.91% *
Finland 0.94% 1.07% 1.11% 1.05% 1.03% 0.99% 0.97% 0.96% 0.86% *
Norway 0.71% 0.85% 0.84% 0.80% 0.78% 0.81% 0.86% 0.92% 0.99% *
Germany 0.77% 0.88% 0.89% 0.88% 0.87% 0.90% 0.87% 0.87% 0.88% *
Austria 0.68% 0.75% 0.77% 0.79% 0.77% 0.80% 0.80% 0.81% 0.79% *
Sweden 0.76% 0.86% 0.84% 0.79% 0.85% 0.84% 0.83% 0.79% * *
United States 0.98% 1.14% 1.00% 0.93% 0.89% 0.79% 0.78% 0.77% 0.80% *
The Netherlands 0.72% 0.79% 0.77% 0.77% 0.72% 0.73% 0.74% 0.72% 0.72% *
Japan 0.71% 0.76% 0.74% 0.78% 0.78% 0.75% 0.75% 0.70% 0.69% *
Flanders 0.69% 0.69% 0.72% 0.69% 0.68% 0.68% 0.72% 0.66% 0.67% 0.72%
France 0.85% 0.90% 0.82% 0.82% 0.73% 0.71% 0.69% 0.65% 0.63% *
EU (28) 0.67% 0.73% 0.70% 0.68% 0.65% 0.66% 0.65% 0.64% * *
Luxemburg 0.45% 0.54% 0.56% 0.59% 0.69% 0.75% 0.71% 0.62% 0.61% *
Belgium 0.66% 0.66% 0.65% 0.63% 0.64% 0.64% 0.68% 0.62% * *
Spain 0.75% 0.81% 0.77% 0.68% 0.59% 0.55% 0.56% 0.56% * *
United Kingdom 0.59% 0.62% 0.59% 0.56% 0.54% 0.57% 0.56% 0.54% * *
Greede 0.42% 0.36% 0.30% 0.31% 0.38% 0.48% 0.44% 0.53% * *
Italy 0.61% 0.62% 0.60% 0.56% 0.55% 0.53% 0.52% 0.51% * *
Poland 0.30% 0.33% 0.36% 0.31% 0.35% 0.36% 0.43% 0.41% * *
Source: OECD database, Main Science and Technology Indicators
Flemish Government R&D funding + Flemish share of the federal funding (35.5% ESA, 56% for the rest), Belgium figure: Commissie Federale Samenwerking, CFS/STAT: final budget Flanders + provisional budget other authorities).

85
Figure 17: International comparison of Government Budget Appropriations or Outlays for R&D (GBARD) 2015, expressed as a percentage of GDP(R)
Source: OECD database, Main Science and Technology Indicators
0
0.002
0.004
0.006
0.008
0.01
0.012
Defence civil

86
6 - Estimate calculation method for publicly financed R&D intensity (1% objective) For the period after 2011, no R&D survey data by sector is yet available. A cautious estimate is being made of the growth path necessary to reach the 1% objective (the publicly financed share of the above mentioned 3% objective) by 2020. Consequently, for the present purpose, as in previous EWI Budget Browsers, a calculation is included to approximate the results of the most recent years.
The combined efforts of the government are calculated by elaborating different variants.
1. The own efforts of the Flemish Government
This is the Flemish GBARD in the strict sense, funded by the Flemish Government only.
2. The efforts of the Flemish Government + the Flemish share of federal government R&D funding
In Flanders, R&D activities are also funded by federal government R&D funds. When this share received from the federal government is added to the Flemish GBARD in the strict sense (1), a GBARD is obtained for Flanders that is probably closer to reality. This variant is consequently the most suitable for an international comparison of the GBARD. When calculating Flanders’ share of federal government funding, the following formula is used: 35.5% of the funding from the European Space Agency (source: VARIO) and 56% for the remainder of the total federal R&D funding.
3. The efforts of the Flemish Government + the Flemish share of federal government R&D funding + the Flemish return from the funds of the EU Framework Programs for Research and Technological Development
In another variant, the Flemish return from the EU Framework Programs for Research and Technological Development can also be added, since this too represents R&D activities funded publicly. However, the result of this calculation can no longer be considered as GBARD, but is actually a third variant that can be used for calculating the publicly financed share of the R&D intensity.
The results of this calculation are given in the table below. The figure for 2017, initial budget (i), is estimated at 0.78% of GDP(R).

Table 3: Evolution of the R&D budget and R&D intensity
Budget in million euro 2008 2009 2010 2011 2012 2013 2014 2015 2016 2017i
Flemish Government (1) 1 121.43 1 130.07 1 224.02 1 227.58 1 236.01 1 243.50 1 397.77 1 298.43 1 394.71 1 565.19
Flemish Gov. + Flemish share of federal gov. (2) 1 403.28 1 390.34 1 506.83 1 511.54 1 533.79 1 544.56 1 693.07 1 595.62 1 671.04 1 847.04
Flemish Gov. + federal share + EU-FP (3) 1 563.28 1 550.34 1 666.83 1 671.54 1 693.79 1 704.56 1 853.07 1 755.62 1 831.04 2 007.04
BBPR (million euro) (4) 204 546.5 201 215.6 210 001.3 218 480.0 224 665,0 227 964.4 233 919.7 240 627.5 247 837.7 256 176.2
Public R&D intensity as % of GDP(R) (1% objective) 2008 2009 2010 2011 2012 2013 2014 2015 2016 2017i
Flemish Government (1) 0.55% 0.56% 0.58% 0.56% 0.55% 0.55% 0.60% 0.54% 0.56% 0.61%
Flemish Gov. + Flemish share of federal gov. (2) 0.69% 0.69% 0.72% 0.69% 0.68% 0.68% 0.72% 0.68% 0.67% 0.72%
Flemish Gov. + federal share + EU-FP (3) 0.76% 0.77% 0.79% 0.77% 0.75% 0.75% 0.79% 0.72% 0.74% 0.78%
(1) Flemish Government budget for R&D: final budgets 2009-2016; initial budget 2017. (2) Flemish share in the federal government R&D funds: ESA distribution key at 35.5% for Flanders (source: VARIO) and the remainder of federal government R&D funds estimated at 56% for Flanders. federal government R&D funds: source: CFS/STAT; for 2016 and 2017i the initial budget of 2016 was used. (3) estimated return based on final results of the Flemish return for the Seventh Framework Programme (publication in preparation). Sources: eCorda data, reworked by EWI. (4) GDP(R): Gross Domestic Product by Region. Source: 2009-2015 NBB; 2016-2017 Hermreg - Research Centre of the Flemish Government (Studiedienst van de Vlaamse Regering), July 2017.
88
7 - The EU Framework Programme for Research and Innovation - Horizon 2020 Introduction
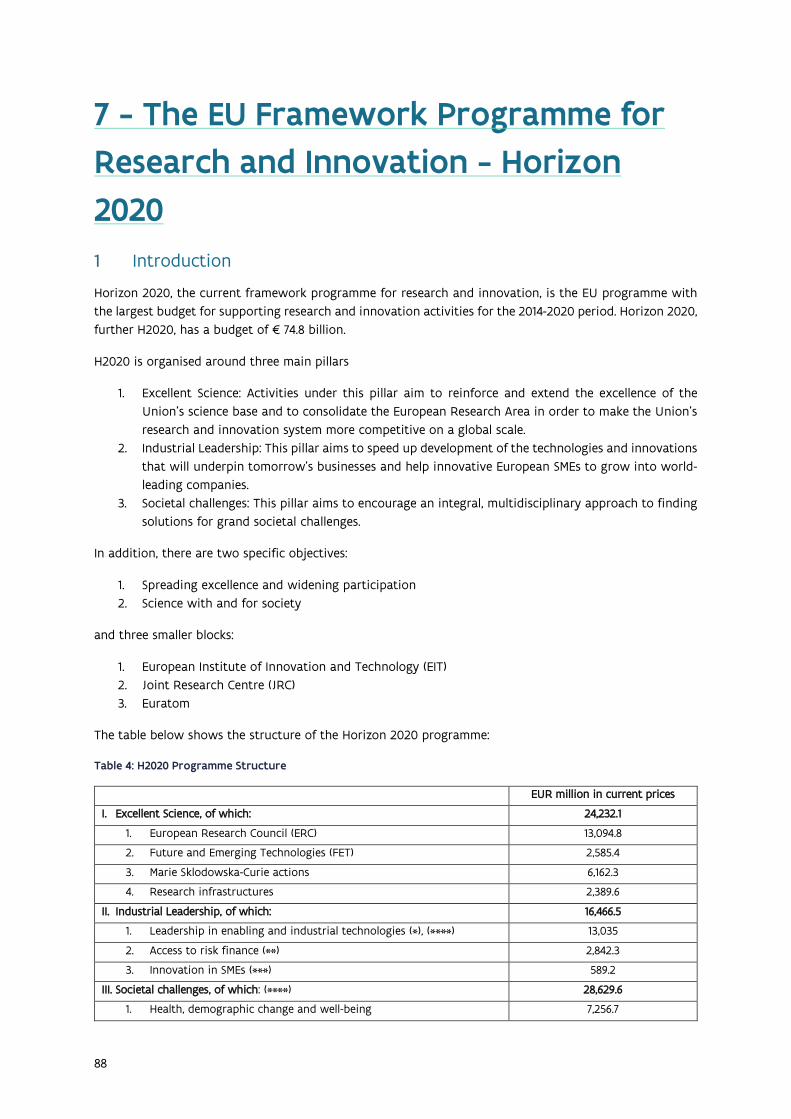
Horizon 2020, the current framework programme for research and innovation, is the EU programme with the largest budget for supporting research and innovation activities for the 2014-2020 period. Horizon 2020, further H2020, has a budget of € 74.8 billion.
H2020 is organised around three main pillars
1. Excellent Science: Activities under this pillar aim to reinforce and extend the excellence of the Union’s science base and to consolidate the European Research Area in order to make the Union’s research and innovation system more competitive on a global scale.
2. Industrial Leadership: This pillar aims to speed up development of the technologies and innovations that will underpin tomorrow's businesses and help innovative European SMEs to grow into world-leading companies.
3. Societal challenges: This pillar aims to encourage an integral, multidisciplinary approach to finding solutions for grand societal challenges.
In addition, there are two specific objectives:
1. Spreading excellence and widening participation 2. Science with and for society
and three smaller blocks:
1. European Institute of Innovation and Technology (EIT) 2. Joint Research Centre (JRC) 3. Euratom
The table below shows the structure of the Horizon 2020 programme:
Table 4: H2020 Programme Structure
EUR million in current prices
I. Excellent Science, of which: 24,232.1
1. European Research Council (ERC) 13,094.8
2. Future and Emerging Technologies (FET) 2,585.4
3. Marie Sklodowska-Curie actions 6,162.3
4. Research infrastructures 2,389.6
II. Industrial Leadership, of which: 16,466.5
1. Leadership in enabling and industrial technologies (*), (****) 13,035
2. Access to risk finance (**) 2,842.3
3. Innovation in SMEs (***) 589.2
III. Societal challenges, of which: (****) 28,629.6
1. Health, demographic change and well-being 7,256.7

89
2. Food security, sustainable agriculture and forestry, marine, maritime and inland water research, and the bioeconomy
3,707.7
3. Secure, clean and efficient energy 5,688.1
4. Smart, green and integrated transport 6,149.4
5. Climate action, environment, resource efficiency and raw materials 2,956.5
6. Europe in a changing world – Inclusive, innovative and reflective societies
1,258.5
7. Secure societies – Protecting freedom and security of Europe and its citizens
1,612.7
IV. Spreading excellence and widening participation 816.5
V. Science with and for society 444.9
VI. Non-nuclear direct actions of the Joint Research Centre (JRC) 1,855.7
VII. The European Institute of Innovation and Technology (EIT) 2,383
TOTAL 74,828.3 (*) Including EUR 7,423 million for Information and Communication Technologies (ICT) of which EUR 1,549 million for photonics and micro-and nanoelectronics, EUR 3,741 million for nanotechnologies, advanced materials and advanced manufacturing and processing, EUR 501 million for biotechnology and EUR 1,403 million for space. As a result, EUR 5,792 million will be available to support Key Enabling Technologies.
(**) Around EUR 994 million of this amount may go towards the implementation of Strategic Energy Technology Plan (SET Plan) projects. Around one third of this may go to SMEs. (***) Within the target of allocating a minimum of 20% of the total combined budgets for the specific objective “Leadership in enabling and industrial technologies” and the priority “Societal challenges” for SMEs, a minimum of 5% of those combined budgets will be initially allocated to the dedicated SME instrument. A minimum of 7% of the total budgets of the specific objective “Leadership in enabling and industrial technologies” and the priority “Societal challenges” will be allocated to the dedicated SME instrument averaged over the duration of Horizon 2020. (****) The Fast Track to Innovation (FTI) pilot actions will be funded from the specific objective “Leadership in enabling and industrial technologies” and from the relevant specific objectives of the priority “Societal challenges”. A sufficient number of projects will be launched in order to allow a full evaluation of the FTI pilot.
The data used in the present section were taken from the database that the European Commission makes available via the electronic platform e-CORDA. The release date of the data is 28 February 2017, when about 32% of the available budget over the total period has been allocated.
Participation by Flanders
Flanders participates 1,268 times in 977 projects in H2020 . This equates to a total participation funding for Flanders of 630.6 million euros. Flanders is responsible for the major part of the total Belgian number of participations, projects and coordinators, as well as the largest share of the participation grants.
The total Flemish participation funding represents 2.67% of the total funding received from the European Commission for participating in H2020.
Marie Curie (MSCA), ICT and FOOD are at present the three thematic priorities with the highest number of participations from knowledge actors in Flanders.
As shown in table 5, the Flemish participation was most successful (in terms of financial return) in the thematic priorities ADVMAT, ICT, ADVMANU, FOOD and MSCA.
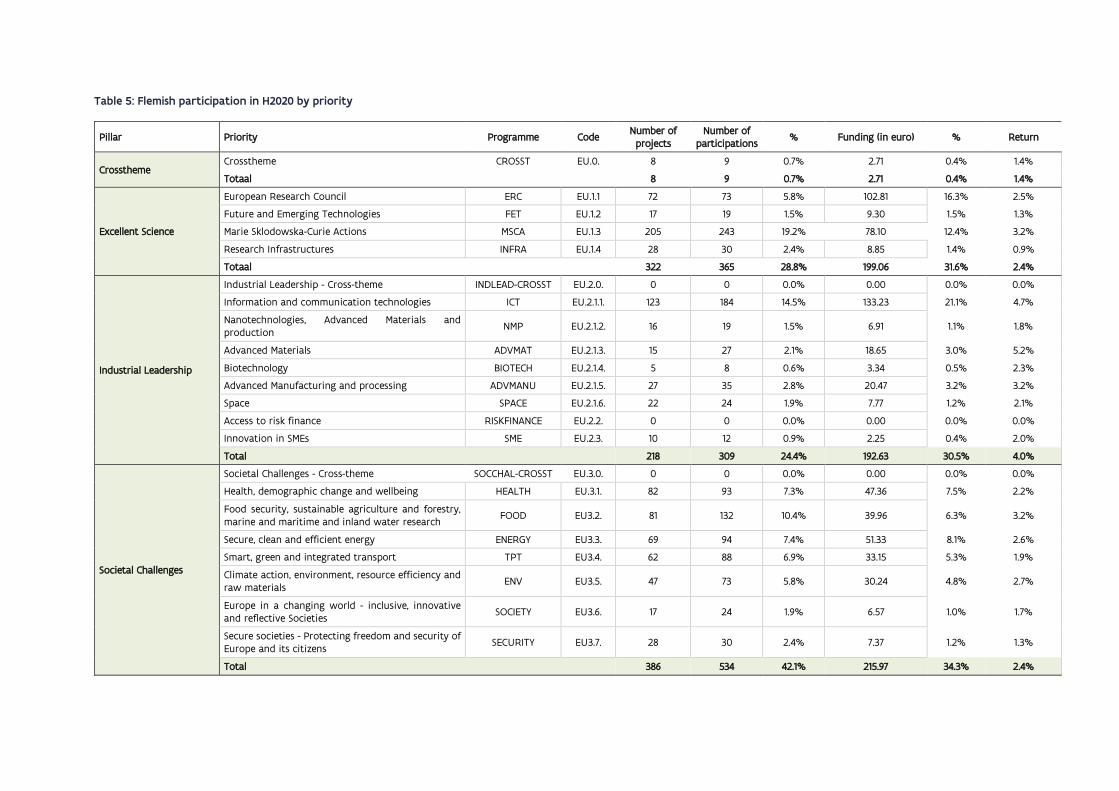
Table 5: Flemish participation in H2020 by priority
Pillar Priority Programme Code Number of projects
Number of participations % Funding (in euro) % Return
Crosstheme Crosstheme CROSST EU.0. 8 9 0.7% 2.71 0.4% 1.4%
Totaal 8 9 0.7% 2.71 0.4% 1.4%
Excellent Science
European Research Council ERC EU.1.1 72 73 5.8% 102.81 16.3% 2.5%
Future and Emerging Technologies FET EU.1.2 17 19 1.5% 9.30 1.5% 1.3%
Marie Sklodowska-Curie Actions MSCA EU.1.3 205 243 19.2% 78.10 12.4% 3.2%
Research Infrastructures INFRA EU.1.4 28 30 2.4% 8.85 1.4% 0.9%
Totaal 322 365 28.8% 199.06 31.6% 2.4%
Industrial Leadership
Industrial Leadership - Cross-theme INDLEAD-CROSST EU.2.0. 0 0 0.0% 0.00 0.0% 0.0%
Information and communication technologies ICT EU.2.1.1. 123 184 14.5% 133.23 21.1% 4.7%
Nanotechnologies, Advanced Materials and production NMP EU.2.1.2. 16 19 1.5% 6.91 1.1% 1.8%
Advanced Materials ADVMAT EU.2.1.3. 15 27 2.1% 18.65 3.0% 5.2%
Biotechnology BIOTECH EU.2.1.4. 5 8 0.6% 3.34 0.5% 2.3%
Advanced Manufacturing and processing ADVMANU EU.2.1.5. 27 35 2.8% 20.47 3.2% 3.2%
Space SPACE EU.2.1.6. 22 24 1.9% 7.77 1.2% 2.1%
Access to risk finance RISKFINANCE EU.2.2. 0 0 0.0% 0.00 0.0% 0.0%
Innovation in SMEs SME EU.2.3. 10 12 0.9% 2.25 0.4% 2.0%
Total 218 309 24.4% 192.63 30.5% 4.0%
Societal Challenges
Societal Challenges - Cross-theme SOCCHAL-CROSST EU.3.0. 0 0 0.0% 0.00 0.0% 0.0%
Health, demographic change and wellbeing HEALTH EU.3.1. 82 93 7.3% 47.36 7.5% 2.2%
Food security, sustainable agriculture and forestry, marine and maritime and inland water research FOOD EU3.2. 81 132 10.4% 39.96 6.3% 3.2%
Secure, clean and efficient energy ENERGY EU3.3. 69 94 7.4% 51.33 8.1% 2.6%
Smart, green and integrated transport TPT EU3.4. 62 88 6.9% 33.15 5.3% 1.9%
Climate action, environment, resource efficiency and raw materials ENV EU3.5. 47 73 5.8% 30.24 4.8% 2.7%
Europe in a changing world - inclusive, innovative and reflective Societies SOCIETY EU3.6. 17 24 1.9% 6.57 1.0% 1.7%
Secure societies - Protecting freedom and security of Europe and its citizens SECURITY EU3.7. 28 30 2.4% 7.37 1.2% 1.3%
Total 386 534 42.1% 215.97 34.3% 2.4%

Spreading excellence and widening participation
Spreading excellence and widening participation - Cross-theme SEAWP-CROSST EU.4.0. 0 0 0.0% 0.00 0.0% 0.0%
Teaming of excellent research institutions and low performing RDI regions WIDESPREAD EU.4.a 1 1 0.1% 0.07 0.0% 0.0%
Twinning of research institutions TWINING EU.4.b 9 9 0.7% 1.79 0.3% 2.7%
ERA chairs ERA EU.4.c 0 0 0.0% 0.00 0.0% 0.0%
Supporting access to international networks INTNET EU.4.e 0 0 0.0% 0.00 0.0% 0.0%
Transnational networks of National Contact Points NCPNET EU.4.f 0 0 0.0% 0.00 0.0% 0.0%
Total 10 10 0.8% 1.86 0.3% 0.5%
Science with and for society
Science with and for Society - Cross-theme SWAFS EU.5.0. 0 0 0.0% 0.00 0.0% 0.0%
Make scientific and technological careers attractive for young people CAREER EU.5.a. 1 1 0.1% 0.24 0.0% 0.8%
Promote gender equality in research and innovation GENDEREQ EU.5.b 1 1 0.1% 0.19 0.0% 0.0%
Integrate society in science and innovation INEGSOC EU.5.c 2 2 0.2% 0.32 0.1% 0.8%
Encourage citizens to engage in science SCIENCE EU.5.d 0 0 0.0% 0.00 0.0% 0.0% Develop the accessibility and the use of the results of publicly-funded research RESACCESS EU.5.e 0 0 0.0% 0.00 0.0% 0.0%
Develop the governance for the advancement of responsible research and innovation GOV EU.5.f 3 3 0.2% 1.35 0.2% 2.9%
Improve knowledge on science communication KNOWLEDGE EU.5.h 0 0 0.0% 0.00 0.0% 0.0%
Total 7 7 0.6% 2.09 0.3% 1.4%
EURATOM Euratom EURATOM 26 34 2.7% 16.25 2.6% 2.6%
TOTAL 977 1,268 100.0% 630.57 100.0% 2.67%

92
Benchmark for Flanders The performance of Flanders in Horizon 2020 is examined by dividing its funding by the Gross Domestic Product and ranking the result with those of other participating countries. Figure 18 shows that Flanders performs well with a ranking in fourth place, behind Greece, Belgium and the Netherlands, but performing better than the Scandinavian countries, Finland, Denmark and Sweden.
Figure 18: Benchmark for the Flemish participation in H2020: funding / GDP
0 200 400 600 800 1,000 1,200 1,400 1,600 1,800 2,000
PolandSwitzerland
Czech RepublicFrance
ItalyNorway
GermanyUnited Kingdom
IrelandSwedenAustria
SpainPortugalFinland
DenmarkFlanders
The NetherlandsBelgiumGreece
Funding (in thousand of euros) / GDP (in billions of euros))

93
Top participating organizations
The higher education sector (HES) is provisionally the main Flemish beneficiary of H2020, accounting for about 39% of the return received by Flanders. The research centres receive almost 32% of the Flemish return, and the companies about 22%.
The top-3 participating institutions in Flanders in H2020 are as yet KU Leuven, UGent and Imec, which jointly represented almost a third of the total EU FP contributions to Flemish grant holders.
Figure 19: Top-10 universities (HES) in an international ranking, sorted by number of participations and funding (in millions of euros)
0.0
25.0
50.0
75.0
100.0
125.0
150.0
0
50
100
150
200
250
The
chan
cello
r, m
aste
rs a
nd s
chol
ars
ofth
e U
nive
rsity
of C
ambr
idge
The
chan
cello
r, m
aste
rs a
nd s
chol
ars
ofth
e U
nive
rsity
of O
xfor
d
Uni
vers
ity c
olle
ge L
ondo
n
Kobe
nhav
ns U
nive
rsite
t
Impe
rial c
olle
ge o
f sci
ence
, tec
hnol
ogy
and
med
icin
e
Kath
olie
ke U
nive
rsite
it Le
uven
Tech
nisc
he U
nive
rsite
it D
elft
The
Uni
vers
ity o
f Edi
nbur
gh
Eidg
enoe
ssis
che
tech
nisc
he h
ochs
chul
eZu
rich
Danm
arks
tek
nisk
e U
nive
rsite
t
Fund
ing
(in m
illio
ns o
f eur
os)
Num
ber o
f par
ticip
atio
ns
Number of participations Funding (in millions of euros)

94
8 - EU Regional Policy Fund (ESIF) and R&D&I support For the past period 2007-2013, the Flemish Region was entitled to receive support from the EU regional funds within the framework of the Objective 2 and Objective 3 programmes. These (cohesion) budgets are considerably lower than the (competition-based) support that is directed to research actors and origins from the Framework Programme for Research and Technological Development / Horizon2020 programme. In 2015, the last projects of this period 2007-2013 came to an end.
Under the Objective 2 programme (ERDF-Flanders), a total budget of 200 million euros was available between 2007 and 2013, divided equally among four main priorities. The first of these was “Knowledge and Innovation”. Subtracting the budget for coordination costs, the total available R&D&I budget for Flanders reached 48.5 million euros (of which about 30 million euro for “strictly” R&D), which is an average of about 8 million euros per year. This amount was complemented by almost 95 million euros from Flemish partners (Flemish Government, provinces, municipalities, private partners, non-profit organisations).
Under the Objective 3 programme (ERDF-Interreg) for European Territorial Cooperation, Flanders was entitled to receive 118.6 million euros, yet it did receive in total 190.3 million euros for 440 international projects in total on knowledge economy and innovation, environment and energy, connectivity and transport, sustainable cities and communities. About 23% of the total amount was oriented at innovation (43.8 million euros). Complemented with the Flemish co-funding, total amount of all projects reached 415 million euros (95.5 million euros for research and innovation).
The programmes in which R&D and innovation was involved were Interreg IV A (Euregio Meuse-Rhine, Grensregio Vlaanderen – Nederland (Border region Flanders – The Netherlands, Two Seas), Interreg IV B (Northsea Region, Northwest-Europe), Interreg IV C, and the supporting programmes (such as ESPON). In the STI-domain, (knowledge) institutes from Flanders participated into various Interreg-projects such as Food2Market, InnoFun (Funding of Innovation), TANDEM, ECO-LASERFACT, GCS, SCINNOPOLI (“Scanning Innovation Policy Impact”), and SPIDER (“Supporting Public Service Innovation using Design in European Regions”). The EWI Department took part in a supporting interregional project, AMCER (“Advanced Monitoring and Coordination of R&D policies at European level”, within ESPON).
A number of major Interreg-projects are worth mentioning:
- BioBase Europe (allocation of 21.8 million euros): a project for the construction of a pilot plant (for research) and training facilities for bio-based activities, which aim to speed up the development of a sustainable bio-based economy in Europe. It is the first facility of its kind in Europe that will use renewable resources for industrial biotechnology on such a scale. The actors involved are the Ghent Bio-energy Valley, UGent, Stad Gent, Biopark Terneuzen (Zeeuws-Vlaanderen, the Netherlands), and various other stakeholders;
- NanoSensEU (allocation of € 1.6 million): a project that intends to develop a universal measure surface for the detection of biomolecules; to develop and use biosensors; and also to set up a knowledge cluster on biosensors (various specialities). The Flemish partners involved are UHasselt, IMOMEC (Imec vzw) and KU Leuven;
- Hydrogen Region Flanders - South Netherlands (allocation of 14.1 million euros): a project that focuses on the sustainable generation of hydrogen in the fields of education, production, infrastructure and “early markets” (demonstration projects). The Flemish participants are Imec, UGent, several university colleges and various other stakeholders.

95
- Organext: a project that brings together twelve partners from business, policy and knowledge centres from the Euregio Maas-Rhine, Eindhoven and Leuven, with expertise in the domain of nanotechnology, new materials, organic solar cells and economic valorisation. The Flemish partners are UHasselt and IMOMEC.
Summarized, during the period 2007-2013, the total ERDF budget allocated to research and innovation potential in Flanders was almost 93 million euros (of which 49 million euros from ERDF Flanders and 43.8 million euros from ERDF Interreg). Considering a working period of 6 years, the ERDF support for R&D&I reached 15.5 million euros annually. Hence in 2007-2013 the average EU budget for R&D&I that origins from the FP7 on RTD was over 10 times higher per annum than that from the ERDF.
Total EU support in 2007-2013 for R&D and innovation was about 175 million euros annually (160 million euros from FP for RTD + 15 million euros from ERDF), which was complemented by the CIP with a budget / a set of guaranties for projects on innovation.
December 2014, the European Commission approved the Flanders’ ERDF Operational Programme 2014-2020. Total available budget for Flanders from the ESIF (the new EU Regional Fund in 2014-2020) reaches 345.5 million euros. Within the objective “Investing in growth and jobs” (ERDF Flanders), there is 173.5 million euros available, and for territorial collaboration (ERDF Interreg Flanders) another 172 million euros. The total budget Flanders is entitled to, is lower than in the previous period of 2007-2013.
Nevertheless, the budget that Flanders has earmarked for research, development and innovation has risen due to a larger relative part of R&D&I in the total available budget. For ERDF Flanders, it is assumed that 50% of total in Objective 2 and 3 (173.5 million euro) will be earmarked for innovation, being 86.75 million euro (for a period of 7 years). Per annum this results in 12.4 million euro. For ERDF Interreg, it is assumed that 65% of total available budget will be earmarked for innovative projects, being 111.8 million euro (for 7 years). Per annum this results in 16 million euro. Hence, total ERDF (Flanders+ Interreg) budget from the EU towards innovation is just over 28 million euro per annum. No R&D budget is stemming from this source, so this has no influence on the available public R&D-budget for Flemish actors. The amount per annum is almost double of what was available from ERDF in 2007-2013, but it still represents less than 1% of all public R&D&I budget in Flanders. The increase of the relative R&D&I part in total ERDF budget demonstrates nevertheless that Flanders attaches great importance and commits itself to the change towards a knowledge-based economy and society.
An ex-ante condition that the Commission imposed, is the elaboration of a smart specialisation strategy (S3). Hence, Flanders has submitted in its ERDF Operational Plan 2014-2020, 8 specialisation domains or strategic cluster domains, based on the experience of the RIS3 Platform and responding to current policy developments. Details are listed on page 71.
The Interreg programmes that Flanders takes part in during the 2014-2020 period, are identical to those in the previous planning period (e.g. Euregio Meuse-Rhine, Flanders – The Netherlands, 2 Seas, North West Europe, North Sea, etc.). In 2015, the first calls have been lauched. An example of (new) Interreg cooperation in 2014-2020 is the WaterstofNet 2.0 (Hydrogen Network 2.0) project within the Interreg V A border region “Flanders - the Netherlands” programme.. The investment is worth 14 million euro, of which 6 million euro from ERDF-Interreg, and 0.375 million euro cofounding from Flanders. This is a continuation of the project “Hydrogen Region Flanders - South Netherlands” of the 2007-2013 Interreg IV A programme. The Hydrogen Network 2.0 will focus on further adaptations of the technology specifically for logistics and mobility and the sustainable generation of hydrogen via renewable energy sources. Another projects of the Flanders – the Netherlands ERDF-Interreg cooperation is CrossRoads2 that focuses on cross-sectoral and cross-technological innovations in domains such as chemistry and materials, agro-food, life sciences & health, clean technology and bio-based economy. It will offer financial support to 50 sustainable and cross-border innovation projects. Total budget is 19 million euro, of which 8 million euro from ERDF-Interreg and 0.491

96
million euro cofunding from Flanders. Finally, Link2Innovate and Crosscare both stimulate innovation among SME’s and represent in total 12.3 million euro (of which 5.9 million euro from ERDF-Interreg). In Link2Innovate, technological start-up companies are supported that are active in key enabling technologies such as micro and nano electronics, photonics, and advanced manufacturing, while Crosscare is a matchmaker in care.