Embed Size (px)
Citation preview
Chapter 2 Chemical Sub-sector
2.1 Detailed Enterprise Survey
Case Study C-01 Vinh Phu Battery-Cell Company C-01
Case Study C-02 Lam Thao Fertilizers & Chemicals C-29
Case Study C-03 The Southern Fertilizer Company / Long Thanh Superphosphates Plant
C-57
Case Study C-04 Viet Nam Pesticide Company / THANH SON Factory
C-75
2.2 Simplified Enterprise Study
Case Study C-05 Ha Bac Nitrogenous Fertilizer and Chemical Company
C-105
Case Study C-06 Trang Kenh Chemical & Calcium Carbide Company
C-113
Case Study C-07 Viet Tri Chemicals Company
C-121
Case Study C-08 Sao Vang Rubber Company / HA NOI Factory
C-129
Case Study C-09 Van Dien Sintering Superphosphate and Chemical Company
C-137
Case Study C-10 LEVER HASO JV Company C-145
Case Study C-11 Hai Phong Tia Sang Battery Company C-153
Case Study C-12 Ha Noi Battery Company C-161
Case Study C-13 LIX Detergent Company / HCMC Factory C-171
Case Study C-14 The Southern Rubber Industry Company C-179
Case Study C-15 Southern Chemical Company / TAN BINH Chemical Factory
C-187
Case Study C-16 Southern Basic Chemicals Company/ BIEN HOA Chemical Factory
C-197
Case Study C-17 Industrial Gas and Welding Electrode Company / BIEN HOA Factory
C-205
Case Study C-18 Tay Ninh Rubber Company C-215
Case Study C-19 TICO Detergent Power Company / BINH DUONG Factory
C-225
Case Study C-20 Da Nang Chemical Industry Company C-233
Case Study C-21 Da Nang Rubber Company C-239

C-1
CASE STUDY C-01
Vinh Phu Battery - Cell Company
Survey Date: November 23, 1999
March 6,7,8,14 2000
1. General
1.1 Profile
Vinh Phu Battery - Cell Company is one of the national companies under
VINACHEM, Ministry of Industry. The company profile is summarized in Table 1.
The structure of the company is shown in Figure 1, and its layout is shown in
Figure 2.
Table 1 Company Profile
Company Name: Vinh Phu Battery-Cell Company Ownership: State owned
Address: Lam Thao- Phu Tho
Director: Mr. Hoang Quoc Vinh
Established: 1965 Began Operation: 1979 for batteries, 1995 for dry cells Corporate Capital: Number of Employees: 502, including 100 in sales offices and also including 14
engineers Main Products: Batteries, Dry Cells
1.2 Status of Business
The main products of Vinh Phu Battery - Cell Company are various kinds of
batteries and dry cells. The number of employees is around 500, including 100
employees who work outside the company selling their products through out the
country. 14 engineers are also included in this figure, and they have is only one
person in charge of environment and safety. The history of the factory is as follows:
1965 The company was established. The Vietnam-US war forced
postponement of the implementation of factory construction.
1975 The battery production plant was actually constructed at a former
Army base location.
1978 The battery case production facility was constructed. Both buildings for
battery and battery case production were designed and constructed
using Chinese technology.

C-2
1979 The full product line for the battery operation was completed.
1995 The dry cell production facility was constructed using Taiwanese
equipment.
The market for batteries and dry cells is a little bit weak at present because of
imported products from China with competitive prices and good quality. The
production capacity and actual production for the year 1998 for their main product
is shown in Table 2. The actual consumption of raw materials, utilities and
additives in the year of 1998 are also shown in Table 2.
1.2.1 Production
The main product, batteries are produced at a capacity of 60,000kwh/y and the
facility for their new product, dry cells, is designed to produce 8,000,000/y.
1.2.2 Debt
1.5 billion US$ of bank debt
Table 2 Production Amount(1998) and Designed Capacity
Product Unit Production Designed Capacity Batteries KVA 51,000 60,000 Dry Cell (R20) Pieces 4,000,000 10,000,000 Dry Cell (R6) Pieces 2,000,000 8,000,000
Figure 1 Organizational Chart of the Company
Director
Vice director
Technical
Technical
Dept. QC Dept.
Vice Director
Business
Electrode Unit
Casing Unit
Pb Recycling Unit
Dry Cell Unit
Mechanical Unit
Material Planning Dept.
Financial-accounting Dept.
Warehouse for Material

C-3
2. Production Technology
2.1 Process
The production technologies used for batteries and dry cells were mainly
developed and established by the company.
The production line consists of 4 functions (shown in table 3) and the
circumstances on their production technology are shown in Table 4.
Table 3 Production Line
Name Function 1 Electrode Unit Electrode Production & Battery Assembling 2 Casing Production Unit Produce Battery Casing 3 Synthesis Unit Recycling & Lead Alloy Production,
Assembling Domestic Batteries 4 Cell Production Unit Manufacture Zinc Casing,
Production & Assembling of Cell R20 and R6
Electrode Production Unit
Assembling
Battery Casing
Mechanical Unit
Office
Pb
Recycling
Plant
Storage
Storage
Dry Cell Production Unit
Figure 2 Factory Layout

C-4
Table 4 Production Technology
Production Chain Technology
Licenser Year of Production
Date of Installation
Specification
Electrode Production China 1975 10/1978 Frame casting, Surface treatment, Finishing, Drying & Cutting & Assembling 32 leaves/min.
Ebonite Casing Production
China 1975 10/1978 Material mixing, Refining
Plastic Casing Production
China 1994 5/1995 Standard resin, Drying, and Product finishing
Cell R20 & R6 Production (paper based)
China 1995 1996 Zn casing product, Mixing, Assembling, Carbon rod pitching, Bottom filling, and Paper filling, Packaging Productivity: 100 cells/min.
Cell R20 Production (without paper cover & threading)
1996 1998 Zn casing, Filling, Assembling, and Packaging Productivity: 100 cells/min.
Figure 3 shows electrode production and its assembly process based on data
provided by the company, Figure 4 presents the ebonite battery case production
process. Figure 5 shows the N-Pb-Sb recycling system, and Figure 6 shows the dry
cell production process.
The company states that they do not utilize a continuous production process,
but instead that the opt to use intermittent production.

C-5
Figure 3 Electrode Production and Assembly Process
Pb Alloy Electrode
Frame
Casting
Surface
Treatment
Pb Powder
Grinding
Ball
Casting
Pb
Electrode Drying Pb-Silicagen Mixture
Finishing Neutralization &
Dissolved Pb Recover
Wastewater Pond Cutting
Binding
Produce Battery with
Plastic Casing Produce Battery with
Ebonite Casing
Install Indurating Layer
Install into
Casing Casing
Cover
Cover Installation
Inspection
Glue
Preparation
Cover Glueing
Plastic Stopper
Install Stopper
& Handle
Install Indurating Layer
Install into
Casing
Casing Cover
Drilling
Plastic
Casing
Cover
Inspection
Binding & Inspection
Cover Glueing & Inspection
Pre-Storage
& Inspection

C-6
Coal Slag
Waste
Figure 5 N-Pb-Sb Recycling Process
Figure 4 Ebonite Battery Case Production Process
Processing
Raw Materials
Grinding & Drying
Raw Material
Residue
Rubber Casing
Material Mixing
Rubber Refinery Compressed Air Cooling Water
Laminate Rubber Into Sheets
Introduce Casing Indurating Layer
Production of
Plastic Cover & Stopper
Spoiled Products
Rubber Processing Steam Cover Drilling
Assembling Inspection & Storage
Pb Residue Mixing Additive
Refinery Brick Production Screened Slag
Recycled Pb (2-3% Sb) Pb Slag COC Refinery
Alloy Production
Casting of Alloy Stick
(4-5% Sb)
Inspection
Storage
Casting of Frame
Auxiliary Parts
Ball Casting &
Pb Powder Production

C-7
(*)Shaded Areas are used only for R20 production
Figure 6 Dry Cell(R6、R20)Production Process
Zn Sheet
Preparation
Polishing
Zn Casing
Preparation
Edge Cutting
Raw Material
Paper Installation
Bottom Layer
Installation
Electro-solution
Preparation
Powder Mixing
Powder
Preparation
Install Positive Charge Powder
Middle Layer Installation
Install Carbon Rod Carbon Rod
Treatment &
Inspection Upper Layer Installation
Pouring of Binding Glue Binding Glue
Preparation
Install Cu Hat
Edging
Channel making
enclosing
Leave product for 7 days
Cell Bottom Preparation
Inspection
Side Covering
Cell Casing
Packaging
Bottom
Insulation Layer
Installation
Plastic Layer
Installation
Electric Insulating
Layer Installation
Install Iron Cover

C-8
2.2 Industrial Water Source
The company indicates that productivity, including the quality of the products,
equipment, employee’s health, the quality of wastewater, is closely related to the
industrial water quality. ① Supply from Lam the Thao Superphosphate &
Chemical Co. ② 2 Deep wells water, ③4excavated wells water has been used as
industrial water, however due to the end of the contract, ① has been stopped
since August 1999.
Table 5 shows the specification of the industrial water used in the electrode
and dry cell production process. In order to ensure the quality of water used in
processing, they have set up ion exchanger machines at both processes.
Table 5 Specification for processing water used in the electrode and dry cell
production process
Parameter Specification Parameter Specification Color none pH 7 Resistability (Ω) ≧ 30,000 Ion (Fe,Ca, Mg, Cl) none
2.3 The Quality of Industrial Water(taken on March 7, 2000)
The result of the measurements using simple instruments is shown in Table 6.
The samples were taken at the same time as the measurement, and they were
analyzed by CECO , Table 7 shows the results.
As stated before, they do have ion exchange machines in electrode and dry cell
units in order to secure enough amount and quality of processing water used for
each unit, necessary amount of the water is 20m3/d. However, both machines have
some problems that are shown in Table 6 and Table 7.
Table 6 Quality Change
Electrode production Dry cell production Parameter Unit No. of table Before
treatment After
treatment Before
treatment After
treatment 6 4.58 5.8 7.02 3.64 pH 7 4.59 5.84 7.02 3.64 6 0.26 0.29 0.26 0.54 Conductivity ms/cm 7 0.26 0.29 0.26 0.54
① The pH level before and after treatment is almost the same, but in all cases the
after treatment level is farther out of the specification range.
② Conductivity level is not improved through treatment.
C-9
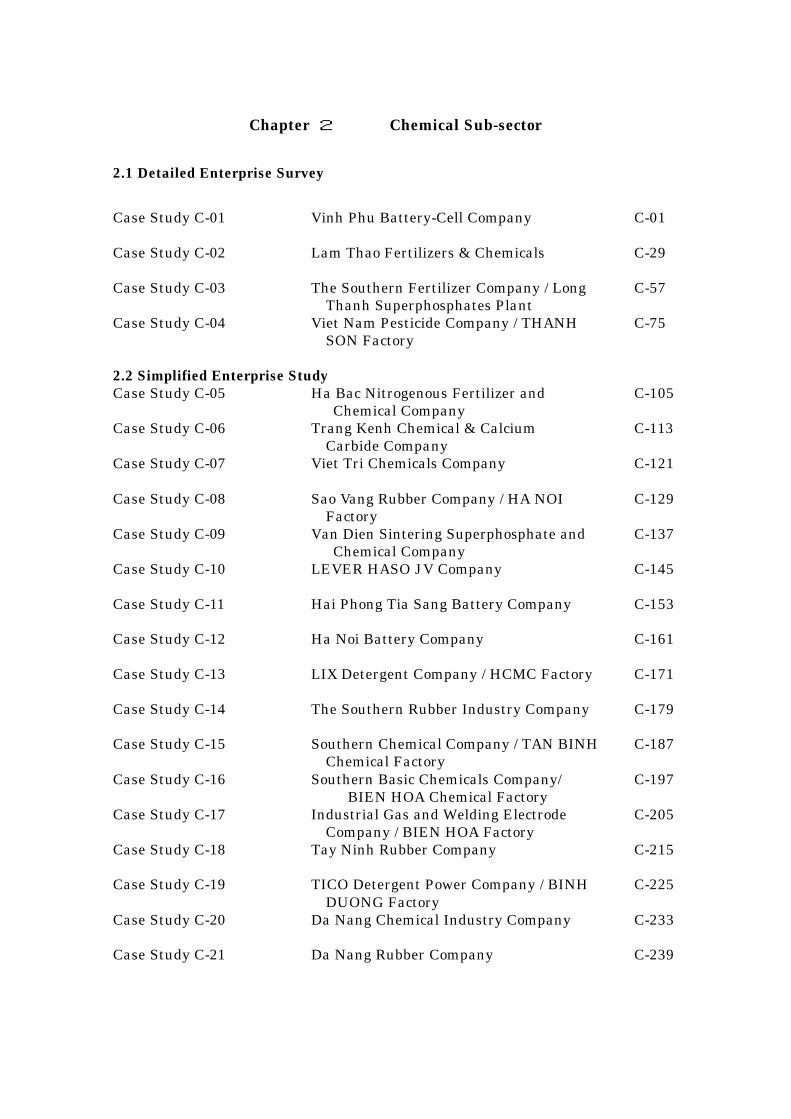
This means that the method they use to operate the ion exchange machine or
their choice of ion exchange resin is inappropriate.
Table 7 Industrial Water Quality analyzed by CECO
Sampling Point 1 2 3 4 5 Item Unit
Time 10:37 10:51 11:17 11:08 11:00 Temp. ℃ 22 22 22.2 24 22 pH 6.62 6.8 4.55 5.62 4.59 Conductivity ms/cm 0.22 0.16 0.26 0.11 0.26 Turbidity NTU 21 11 212 5 0 Oil content mg/l 0.31 0.36 0.017 0.25 0.023 BOD5 mg/l 6 5 2.7 3 3 COD mg/l 12 11.2 8 8 7.2 DO mg/l 5.8 4.1 3.2 4.4 3.3 SS mg/l 22 14 1 8 4 SO4 mg/l 78 33 126 29 126 T-nitrogen mg/l 11 12.4 1.83 2.5 1.9 CN mg/l 0.001 0.001 0.001 0.001 0.01 Phenol mg/l 0.005 0.003 0.004 0.007 0.003 Residual Cl mg/l 0.17 0.1 0.03 0.04 0.01 Pb mg/l 0.0024 0.001 0.0005 0.0025 0.003 Ni mg/l 0.02 0.016 0.012 0.0025 0.001 Cd mg/l 0.0006 0.0004 0.0001 0.0004 0.0012 Mn mg/l 0.4 0.2 0.8 0.3 0.47 Zn mg/l 0.24 0.07 0.1 0.2 0.31 Color Pt-Co 38 8 0 24 3 Fe mg/l 0.65 1.26 1.42 0.98 0.41 PO43- mg/l 0.01 0.18 0.015 0.09 0.16 Ca2+ mg/l 18.4 16.8 20 17.32 20 Mg2+ mg/l 7.1 5.83 3.16 2.68 3.88 CO32- mg/l 2.2 1.3 0.8 1.12 0.1 Cl- mg/l 8.75 14.2 19.5 15.4 12.4
Sampling Point 6 7 8 9 Item Unit
Time 11:43 11:52 13:20 13:50 Temp. ℃ 22 20.5 21 23.4 pH 6.85 7.02 3.64 5.84 Conductivity ms/cm 0.27 0.26 0.54 0.29 Turbidity NTU 2 2 4 0 Oil content mg/l 0.01 0.17 0.08 0.12 BOD5 mg/l 4 3 9 4 COD mg/l 16.4 7.2 20.8 9.6 DO mg/l 5 5.7 6 3.3 SS mg/l 4 5 2 1

C-10
Sampling Point 6 7 8 9 Item Unit
SO4 mg/l 51 53 2 106 T-nitrogen mg/l 1.45 2.1 2.4 1.8 CN mg/l 0.00 0.014 0.001 0.001 Phenol mg/l 0.001 0.004 0.0033 0.003 Residual Cl mg/l 0.02 0.04 0.06 0.02 Pb mg/l 0.0005 0.0006 0.0004 0.0023 Ni mg/l <0.001 0.01 0.008 <0.01 Cd mg/l 0.001 0.0003 0.0003 0.0002 Mn mg/l 0.38 0.52 0.55 0.1 Zn mg/l 0.24 0.41 0.44 0.16 Color Pt-Co 17 16 8 4 Fe mg/l 0.15 0.32 0.3 0.4 PO43- mg/l 0.83 0.19 0.28 0.1 Ca2+ mg/l 22 31.2 18 0.8 Mg2+ mg/l 4.04 9.72 4.37 1.46 CO32- mg/l 0.08 0.0 0.0 0.0 Cl- mg/l 7.32 5.33 113.6 10.6
Table 8 shows the operating condition of the excavated well pump when the
measurements and samples were taken.
Table 8 The Operating Condition of the Water Pump(excavated Well)
No.1 No.2 No.3 No.4 Operation status
Not in operation
Not in operation
In operation In operation
Operation frequency per day
Twice Twice Once
Operating hours
1-2hrs. 1-2hrs. 2hrs. 3-4hrs.
2.4 Industrial Water Secure Plan
① Considering the quality and cost, the company has made plans to stop using
water from the excavated well. The price of the excavated well water is much more
expensive than the water from the Lam Thao Superphosphate & Chemical Co.
(1,000 VND/m3)
② From q quality prospective, instead of using excavated well water, water from
deep well should be given priority for utilization. There is an existing deep well,
located outside of the factory site, with a depth of 95m. This deep well is not able to

C-11
provide enough water to meet their needs. The other well, located inside the factory
has a depth of more than 100 m, and is also not able to cover the amount of water
they need. The company is now constructing a new deep well and they are now
looking for a suitable location.
③ Another option could be receiving water supply from Lam Thao Superphosphate
& Chemical Co. However, the quality of their water is less than the quality of deep
well water.
The transition of industrial Water is shown in Table 9, based on the data received
wfrom the company.
Table 9 Industrial Water Transition
1998 1999 Future Plan Battery Production (KVA) 40,000 32,000 60,000 Dry Cell Production (Pieces) 7,000,000 7,000,000 Water from Lam Thao Superphosphate & Chemical Co. (m3/y)
68,176 18,421
Water from excavated wells (4 wells) (m3/y) 48,000 48,000 Water from deep wells (m3/y) 33,450 Total (m3/y) 116,176 99,871 200,000
The total amount of water required is 120,000m3/y at the rate of 55,000KWH/y
production. The number of days operated is 330d/y. The following countermeasures
are suggested:
① Necessary equipment : Centralized sedimentation tank→an ion exchange
machine→neutralization tank
② Modify the plumbing system in the factory
③ Improve the plumbing ; replace the plumbing from the Lam Thao
Superphosphate & Chemical Co. (2km x 4B)
2.5 Countermeasures for sulfur vapors in the electrode lead production process
In this process, a certain amount of sulfur disappears while the lead
rods are placed in sulfuric acid for a 3 month time period.
① The existing absorption system is now stopped, however, blowers are
placed in 2 rooms, one has 5 blowers and the other has 9 of them, and
each blowers has the same capacity, 8m3/sec.(5kw. Its duct is made
of PVC. The lid of the charging tank is also made of PVC.
② We recommended that the shape of the lid be changed and that the aisles

C-12
surrounding the tank be enlarged in order to reduce the amount of water
use for washing the floor around the tank.
In order to get a good idea of the condition of the working environment in the
room, we requested CECO to make analysis, using a unit mg/m3 、of the density of
sulfuric acid. Samples are taken 1.5m above the floor. The results of this analysis
are shown in table 10.
Table 10 Sulfuric acid concentration(Working environment)(March 10,2000)
Sampling Point 1 2 3 Item Unit
Time 14:45 15:00 15:15 Height M 1.5 1.5 1.5 H2SO4 mg/m3 0.432 0.863 0.254
Remarks:
Sample No.1: Battery Production (middle position)
Sample No.2: Battery Production (end position)
Sample No.3: Electrode lead casting section (cast machine position)
2.6 Wastewater source
The amount of detrimental wastewater including heavy metals is 12-50m3/d.
We counted three sources of wastewater.
① Lead powder preparation unit : Cooling water for the lead crushing process, and
washing water for the cyclone and floors. This water is mixed and discharged
through neutralization and sedimentation.
② Electrode production unit : Sulfuric solution spills over onto the floor because of
gas generation during lead electrode preparation which takes 3 months. Washing
water for the floor and lead electrodes are mixed and discharged to the wastewater
pond after neutralization.
③ Dry cell production unit : Wastewater in the dry cell unit is discharged directly
to the rice fields without any treatment.
The neutralization treatment utilizes lime, but there are no stirring devices.
Neutralization and sedimentation ponds are made of concrete.
There are some different kinds of species of fish in the ponds which are used for
checking the quality of industrial wastewater. We were informed that the
industrial wastewater includes some toxic compounds like ammonia, sulfuric acid,
Pb, zinc and etc.

C-13
Periodical checks on the wastewater have been performed once a year by
CECO because the company has no quality control department and facilities.
Actually, wastewater treatment is not performed at all for the purpose of
environmental conservation.
① Lead powder production process:Cooking water from the lead grinding
process and washing water for cyclones and floors is mixed. After the
wastewater goes through a setting tank and a neutralization process, it is
drained into rice fields.
② Electrode production process: While lead electrodes soak for 3
months in sulfuric acid, gas is generated. Since the gas causes sulfuric water
to spill on the floor, floor washing is essential. Washing water for the floor
and lead electrodes are one source of the hazardous wastewater. These two
kinds of washing water are mixed and neutralized before being drain to a
pond on the factory ground.
③ Dry cell production process:Wastewater from the dry cell production
process is drained into rice fields without any treatment.
Lime is used as a neutralizer, however, no special agitation is used in the
process. Neutralization and sedimentation tanks are made of concrete. Other
wastewater from the silica-gel and battery case production process in addition to
those stated before are mixed and drained into an excavated pond without
treatment. Chart 7 shows the wastewater system and the points where samples
were taken.
Wastewater measurement is implemented once a year by CECO(Chemical
Engineering Corporation)because the company doesn’t have the equipment to take
measurements. Another simple measurement is implemented at the sample points
1、4、5、and 6 by using pH indicate paper every week. In addition to these
measurements, an inspection is done by DOSTE, Phu Tho Province, once a year.
3. Management
3.1 General
ISO9000 and ISO14000 have not been applied in this company yet. The factory
of this company is not so well managed from the view point of cleanliness of the
working place and environmental aspects. However, top management has a concept
and is considering what must be done by the company to improve these conditions.
They explained that the site is supposed to be maintained to be clean to a level
where there is no garbage in sight. The company is also putting that effort into

C-14
growing tall and short trees, just like “a Factory in the Forest”.
3.2 Unit Consumption of Raw Materials and Utilities
Table 11 shows the unit requirements of raw materials and utilities in the year
1998 provided by the company.
Table 11 Unit for raw materials and utilities(1998)
Material Consumption (Tons/day) Pure Lead (99.99%) 1.500 Lead Alloy (5%Sb) 1.643 H2SO4 (98%) 1.180 Natural Rubber 0.176 Sulfur Powder 0.053 BaSO4 0.006 Coal (6x8) 0.618 Lime Powder 0.002 Bitumen 0.033 Carbon Powder 0.160 Zinc 0.610 Carbon Rod 0.153 Electricity (KW) 8,660 Natural Manganese 0.617 Electrolyzed Manganese 0.401
⑧ ② ① ⑦
③ ④
To the rice field⑩
To the pond
⑥
To the rice field⑨
⑤
Well Water
Figure 7 Water System
Electrode Unit Neutralization Tank Pond Pond
Pb Powder Unit Sedimentation Tank Neutralization Tank
Dry Cell Unit
Silica-Gel & Battery Case
Production Unit

C-15
3.3 Environmental condition
Table 12 shows the equipment and exhaust density conditions. The present
state of solid waste is shown in Table 13, and supply and wastewater conditions are
shown in Table 14-17. All the charts were made based on data provided by the
company.
3.3.1 Present condition of the atmospheric pollution
Table 12 shows the density of CO2, SO2, and NO2, and the location of where
those gases are emitted.
Table 12 Air Pollution Conditions
Emission (mg/m3) Facility Material used
Waste Designed Actual
Height of emission point (m)
Electrode frame casting facility
Pb alloy CO SO2 NO2
40 0.5 0.4
0.417 0.562 0.073
12 12 12
Electrode finishing facility
D2, H2SO4 CO SO2 NO2
30 20 5
0.148 0.428 0.036
13.5 13.5 13.5
Rubber processing
CO SO2 NO2
30 20 5
0.253 0.218 0.047
12 12 12
Cell production facility
NH4Cl, Mn, C powder, Graphite, Bitumen
CO SO2 NO2
30 20 5
0.186 0.236 0.053
5 5 5
Pb powder grinding facility
Pb Dust 6 0.327 13.5
3.3.2 Present condition of Solid Waste
Table 13 Present Solid waste condition
Facility Waste Discharged amount (kg/d)
Discharged from
Treatment & usage
Pb alloy production
(Sb+Pb)
Coal residue 50 Collected Brick making
Rubber parts processing
Rubber 5 Collected Recycling
Old battery recovery
Casing, Insulation
10 Collected Treatment & Recycling
C-16
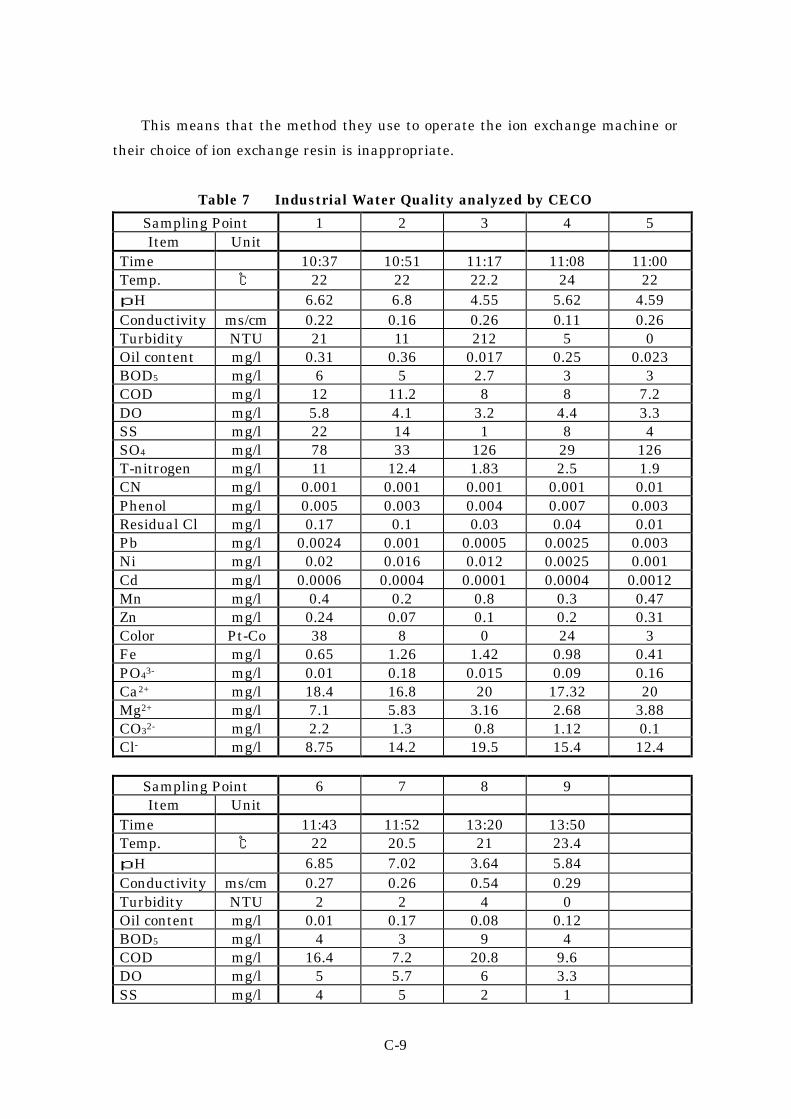
3.3.3 Present condition of supply and wastewater
Table14 Present Supply Water Conditions
Source of water -Piped water from the Lam Thao Superphosphate Co. -Underground water in the company area -Surface water in the company area
Percentage of supply water Pipe & underground water account for 70% Volume of water intake -Summer: 300m3/d
-Winter: 250m3/d Water consumption -Process water: 12m3/d
-Domestic water: 40m3/d -Industrial cleaning water: 3-5m3/d -Cooling water: 170-180m3/d
Table 15 Present Wastewater Conditions
Production unit Discharge process Discharge flow Contaminants level
Pb powder production & electrode surface treatment units
-Cyclone treatment -Floor washing
5-7m3/d pH=6.2 SO4=56 NH3=0.36
Electrode finishing -Making finishing solution -Floor washing
3-5m3/d
pH=5.3 SO4=110 NH3=1.39 Pb=0.083
Table 16 Distinctive Waster Water features
Waste stream Parameter Unit Stream 1 Stream 2 Stream 3
Vietnam standard
5945-1995 Temp. ℃ 31.5 31.6 30.8 40 pH 6.7 5.3 6.2 5.5-9 DO mg/l 4.5 5.6 TSS mg/l 6.05 7.0 5.0 100 TDS mg/l 240 90 120 Conductivity ms/cm 0.29 0.17 0.23 Turbidity NTU 11 19 25 Sulfate SO4 mg/l 50 110 56 NH3 mg/l 0.55 1.39 0.63 1 Sulfate mg/l 0.013 0.015 0.013 0.5 Zn mg/l 0.02 0.2 0.2 2 Mn mg/l 0.3 0.4 0.7 1 Fe mg/l 0.13 0.9 1.04 5 BOD5 mg/l 24 30 18 50 COD mg/l 64 72 48 100 Pb mg/l 0 0.038 0.033 0.05

C-17
Table 17 Current Wastewater Route Conditions
Industrial wastewater -Drained to sedimentation tank, passes through treatment tank then joins with the storm water drainage into a biopond. Continuous discharge -Cooling water flow to recovery/circulating tank
Treatment facility -One sedimentation system -Two pH adjustment tanks
4. Industrial Wastewater Treatment and Discharge
4.1 Wastewater quality
Table 18 shows the points where the samples are taken, and the contents of the
sample points.
Table 18 Sampling points and Detail of samples
Sampling points Detail of samples 1 Wastewater in the Neutralization Tank of electrode unit 2 Wastewater from Electrode Unit before the neutralization 3 Wastewater from the Sedimentation Tank of Pb Powder Unit
before neutralization 4 Wastewater in the Neutralization Tank after Sedimentation 5 Wastewater from Battery product unit drain into rice fields 6 Wastewater from Dry Cell Unit drain into a little excavated
pond 7 Waste water from the pond 8 Well Water 9 Wastewater from Silica-Gel and Battery Case Unit drain into
rice fields 10 Wastewater from the rice field where water comes from Pb
powder grinding unit 11 Water from a stream lower the rice field(upper the factory)
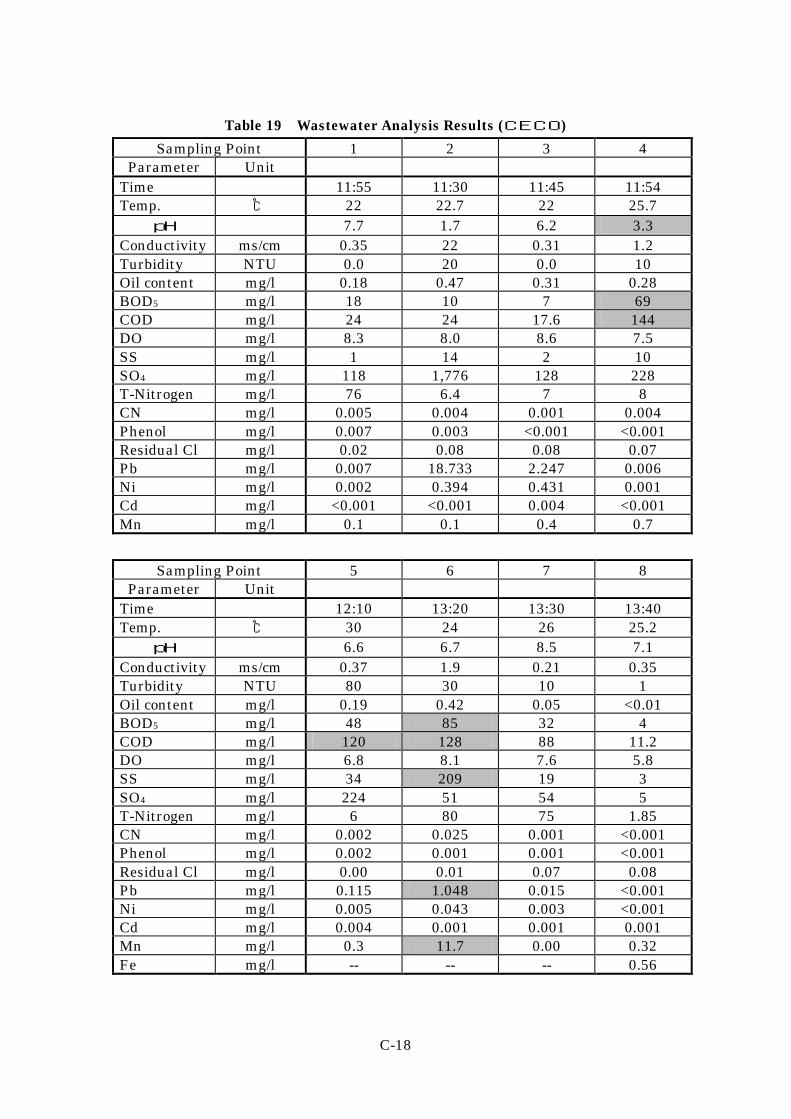
4.1.1 The results of the Nov/23/1999 measurements
The results of the samples analyzed by CECO are shown in Table 19.
C-18
Table 19 Wastewater Analysis Results (CECO)
Sampling Point 1 2 3 4 Parameter Unit
Time 11:55 11:30 11:45 11:54 Temp. ℃ 22 22.7 22 25.7
pH 7.7 1.7 6.2 3.3 Conductivity ms/cm 0.35 22 0.31 1.2 Turbidity NTU 0.0 20 0.0 10 Oil content mg/l 0.18 0.47 0.31 0.28 BOD5 mg/l 18 10 7 69 COD mg/l 24 24 17.6 144 DO mg/l 8.3 8.0 8.6 7.5 SS mg/l 1 14 2 10 SO4 mg/l 118 1,776 128 228 T-Nitrogen mg/l 76 6.4 7 8 CN mg/l 0.005 0.004 0.001 0.004 Phenol mg/l 0.007 0.003 <0.001 <0.001 Residual Cl mg/l 0.02 0.08 0.08 0.07 Pb mg/l 0.007 18.733 2.247 0.006 Ni mg/l 0.002 0.394 0.431 0.001 Cd mg/l <0.001 <0.001 0.004 <0.001 Mn mg/l 0.1 0.1 0.4 0.7
Sampling Point 5 6 7 8 Parameter Unit
Time 12:10 13:20 13:30 13:40 Temp. ℃ 30 24 26 25.2
pH 6.6 6.7 8.5 7.1 Conductivity ms/cm 0.37 1.9 0.21 0.35 Turbidity NTU 80 30 10 1 Oil content mg/l 0.19 0.42 0.05 <0.01 BOD5 mg/l 48 85 32 4 COD mg/l 120 128 88 11.2 DO mg/l 6.8 8.1 7.6 5.8 SS mg/l 34 209 19 3 SO4 mg/l 224 51 54 5 T-Nitrogen mg/l 6 80 75 1.85 CN mg/l 0.002 0.025 0.001 <0.001 Phenol mg/l 0.002 0.001 0.001 <0.001 Residual Cl mg/l 0.00 0.01 0.07 0.08 Pb mg/l 0.115 1.048 0.015 <0.001 Ni mg/l 0.005 0.043 0.003 <0.001 Cd mg/l 0.004 0.001 0.001 0.001 Mn mg/l 0.3 11.7 0.00 0.32 Fe mg/l -- -- -- 0.56

C-19
4.1.2 The results of the March 8th, 2000 measurements.
The analysis of these samples, carried out by CECO is shown in Table 20.
The sampling points numbers are the same as the numbers sampled on
November 23rd 1999. However, sample 8 has been excluded because it was already
discussed on page 2 and 3. Sampling points numbered 9 through 11 are newly
measured this time, and the location of each of these sampling points is out side of
the factory. Oil was observed at sample number 6 and 9.
Table 20 The Results of Wastewater Analysis (CECO)
Sampling Point 1 2 3 4 5 TCVN Parameter Unit
Time 10:20 10:25 10:32 10:39 10:45 Temp. ℃ 21 21 20 21 29 40 pH 6.71 1.61 6.08 6.95 7 5.5-9 Conductivity mS/cm 0.29 41 0.3 0.27 0.28 Turbidity NTU 9 78 12 1 10 Oil content mg/l 0.16 13.9 0 10 0.37 BOD5 mg/l 17 18.5 27 20 6 50 COD mg/l 56 56 80 48 16 100 DO mg/l 4.9 4.2 5.1 5.3 4.1 SS mg/l 10 394 96 8 11 100 SO4 mg/l 74 1,168 68 66 47 T-nitrogen mg/l 6.2 7.5 6.2 7.6 5.6 60 CN mg/l 0.001 0.036 0.0 0.0 0.0 0.1 Phenol mg/l 0.008 0.001 0.0010 0.0016 0.001 0.05 Residual Cl mg/l 0.07 0.5 0.07 0.05 0.04 2 Pb mg/l 0.0386 0.508 2.87 0.004 0.172 0.5 Ni mg/l <0.01 <0.01 0.52 0.0015 0.004 1 Cd mg/l 0.007 0.0082 0.006 0.001 0.003 0.02 Mn mg/l 0.3 0.1 0.1 0.1 5.5 1 Zn mg/l 0.63 1.76 0.3 <0.01 <0.01 2 Fe mg/l 0.72 8.47 1.53 0.50 0.62 5
Sampling Point 6 7 9 10 11 Parameter Unit
Time 11:02 10:55 11:25 11:32 11:40 Temp. ℃ 20 21 23 23 22 pH 6.7 8.29 7.52 7 6.71 Conductivity mS/cm 0.85 0.24 0.29 0.3 0.32 Turbidity NTU 51 20 38 27 27 Oil content mg/l 0.32 0.2 0.26 0.33 0.4 BOD5 mg/l 22 25 42 22 17 COD mg/l 64 72 96 48 40

C-20
Sampling Point 6 7 9 10 11 Parameter Unit
DO mg/l 1.2 7.3 5.8 5.1 4.5 SS mg/l 166 23 67 24 57 SO4 mg/l 75 64 86 63 126 T-nitrogen mg/l 36.9 3.12 3.50 4.5 6 CN mg/l 0.021 0.001 0.006 0.001 0.001 Phenol mg/l 0.01 0.021 0.014 0.001 0.01 Residual Cl mg/l 0.25 0.13 0.2 0.15 0.13 Pb mg/l 0.0183 0.002 0.01 0.008 0.0492 Ni mg/l 0.6 <0.01 0.005 0.01 Cd mg/l 0.0036 0.0086 0.0001 0.0082 Mn mg/l <0.1 0.1 0.1 0.7 Zn mg/l 7.16 0.23 1.79 0.32 Fe mg/l 1.95 0.3 0.28 0.12
4.2 Regulation Standards for Industrial Wastewater
According to the standards shown in Table 20, the following comments can be
made about wastewater drained out side of the factory, sample 4 and 5 in the
results shown in table 19 and 20.
< Sample No.4 >
① In table 20, the pH value is 3.3 which is out of the 5.5 – 9 range. However, in
Table 22, the value is 6.95 which is in range.
② BOD5 and COD exceed the standard value in table 20. However, in Table 22,
each value meets the standards.
③ Oil content value is 10, which is way out of range of the standard value 1.
< Sample No.5 >
① COD exceeds the standard value in Table 20. However, in Table 22, the value is
16 which complies with the standards.
② The Mn value exceeds the standard value.
The following comparison is made between water quality in the pond, sample 6
and 7, and standards shown in Table 20:
< Sample No.6 >
① BOD5 and COD exceed the standard value in Table 19 and 20. However, each
value has been dropped to the standard.
② SS exceeds the standard value in both Table 19 and 20.
③ Pb content , 1.048, and Mn content, 11.7, exceed the standard value of 0.5 for Pb

C-21
and 1 for Mn in Table 19. However, these values comply with the standard in
Table 20.
④ The Zinc value , 7.16, exceeds the standard value, which is 2 in Table 20.
<Sample No.7>
None of the values in Table 19 and 20 exceeds the standards.
It should be concluded, from what has been shown above, that since the
company does not utilize a continuous production process, but instead opts to use
intermittent production, the value of the wastewater measurements will be
different depending on what kind of process is being implemented at the time data
is taken.
Thus wastewater management which suits each particular situation is
required.
Wastewater out side of the factory site, the values of the wastewater samples
taken from the rice field, sample points 9 and 10, the samples taken from the
stream, and sample point 11 have been compared to the standards and analyzed as
follows:
<Sample No.9 location> Down stream of sample point #5 where water is discharged
from the battery case production process.
No values exceed the standard values.
<Sample No.10 location> Down stream of sample point #4 where water is
discharged from the lead powder production process.
No values exceed the standard values.
<Sample No. 11> Down stream from the rice field
No values exceed the standard values.
Thus, there are no values that exceed the standard values for B rank wastewater
in Table 23. However, some values exceed the standard values for A rank
wastewater is regulated as domestic use water.
<Sample No.9>
① The measurement for BOD5, 42, and COD, 96, exceed the standard values
which are 20 for BOD5, and 50 for COD.
② The value of Phenol, 0.014, exceeds the standard value, 0.001, for Phenol.
<Sample No.10>
① The BOD5 measurement , 22, exceeds the standard value, 20 for BOD5.
② The Zinc measurement, 1.79, exceeds the standard value, 1, for Zinc.

C-22
<Sample No.11>
①The Mn value, 0.7, exceeds the standard value, 0.2 for Mn.
5. Recommended Countermeasures for Improvement and associated cost
5.1 Countermeasures for production technology
5.1.1 Secure the water supply source
Industrial water quality is closely related to product quality, equipment,
employee’s health, and wastewater quality according to the company, as was
mentioned in 2.2. There are three sources of industrial water:
① Supplied from the Lam Thao Superphosphate & Chemical Co., ② Deep
well water and ③water from four excavated Wells, has been used as industrial
water. However, due to the expiration of the contract, ①has not been utilized since
August 1999.
As was stated in 2.4, the priority given to sources of industrial water and the
reasons for prioritization are as follows:
(1) Taken quality and cost into consideration, the company is planning to stop
using water from the excavated well. The cost of the excavated well water is much
more expensive than the price of the water supplied from the Lam Thao
Superphospate & Chemical Co. (1,000 VND/m3)
(2) From a quality prospective, instead of using excavated well water, water
from deep wells should be given priority for utilization. There is an existing deep
well, located outside of the factory, that has a depth of 95m. However this deep well
is not able to provide enough water to meet their needs. The other well, located
inside the factory, has a depth of more than 100m, and is also not able to cover the
amount of water they require. The company is now considering drilling a new, deep
well and they are now looking for a suitable location.
(3) Another possible option for the company to consider would be receiving its
water supply from the Lam Thao Superphosphate & Chemical Co.. However, the
quality of their water is less than the quality of deep well water.
In some way, they need to secure enough industrial water to sustain full
capacity operation and this is estimated to be about 200,000m3/y for the full
operation that will be required in the future.
5.1.2 Pre-treatment of industrial water and renewal of the water system
In order to provide high quality industrial water, it is necessary to install a
pretreatment system, such as sedimentation and filtering. In addition, their

C-23
water system, that has a lot of leakage needs to be renewed.
5.2 Countermeasure for management technology
5.2.1 Set up ion exchange machine and renovate existing water supply equipment
Pure water is essential for electrode and dry cell production. There are ion
exchange machines in each production line to purify the water. However, as was
stated in 2.3, those machines are inappropriate and sufficient treatment does not
take place. Therefore, a new ion exchange machines or water purifying system is
required and also the water system for the pure water coming from the new
machine to the product lines needs to be renewed.
5.2.2 Countermeasures for sulfuric vapor steam at the electrode production
process
As was stated in 2.5, electrodes need to be soaked in sulfuric acid for a while to
charge before they are assembled as parts of wet cells. In this soaking process, gas
is emitted. A ventilation system has been installed, but it is not functioning
properly. The working environment in the factory is very bad, and sometimes it is
hard for employees to breathe inside of this room.
Therefore, in concern for the employee’s health, the ventilation system has to
be renovated.
5.3 Countermeasure for wastewater treatment
As was explained on before,
① In the wastewater drained to rice fields around the factory, (taken from sample
point 4 and 5.) Since the pH, SS, BOD5, COD, lead, Mn values exceed the standard
value, countermeasure must be taken as soon as possible. The countermeasures
should be focused on installing a sedimentation tank, condensation and separation
among treatments, and also initiating biotechnological treatment in order to meet
the standard values.
② In order to get rid of lead and Mn from wastewater, the pH value has to be on
the alkaline side, and they are needed to be settled out as an insoluble salt in an
water. It is crucial to properly manage the pH value of wastewater. The operation
of the neutralization tank has to be improved.
The reasons why wastewater from the factory does not satisfy the standards at
times are because the treatment used for the wastewater is not sufficient and the
production lines are not operated continuously at all the times. In order to fix the

C-24
situation, the wastewater treatment system has to be developed and improved.
5.4 Estimation of costs for countermeasures
The estimated cost for these countermeasures, which experts from the
Ministry of Industry, survey members, and the company already discussed, has
been calculated by the company, and is shown in Table 21.
There are two choices for the industrial water source issue. The proposal in which a
new well could be created costs 3,347 million VND. The other possibility that would
be to buy water from the Lam Thao Superphosphate Co. costs 3,390 million VND.
These figures are reflected in Table 21.

C-25
Tab
le 2
1
Est
imat
ion
Cos
ts f
or C
oun
term
easu
re
M
illi
on V
ND
No
App
lica
tion
Poi
nt
Cou
nte
rmea
sure
s C
ost
1 S
upp
lyin
g w
ater
sys
tem
T
wo
alte
rnat
ives
:
1. U
pgra
din
g th
e ex
isti
ng
pipe
lin
e fr
om L
am T
hao
Su
perp
hos
phat
es c
ompa
ny.
2. P
repa
rati
on o
f n
ew d
eep
wel
l sys
tem
②
1,3
10
1,
267
2 S
upp
lyin
g w
ater
pre
-tre
atm
ent
se
dim
enta
tion
an
d fi
ltra
tion
②
260
3 W
ater
pip
e li
ne
to a
ll w
orks
hop
s R
evam
pin
g an
d u
pgra
din
g ①
443
4 F
urt
her
tre
atm
ent
for
proc
ess
wat
er
Inst
alla
tion
of
furt
her
tre
atm
ent
un
it t
o pr
odu
ce p
ure
wat
er s
upp
lyin
g to
Bat
tery
an
d ce
lls
prod
uct
ion
(20
m3 /
d)
②
1
80
5 P
ure
wat
er s
upp
lyin
g
Rev
ampi
ng
and
upg
radi
ng
①
5
0
6 F
orm
atio
n u
nit
U
pgra
din
g an
d re
vam
pin
g th
e H
2SO
4 va
por
suck
ing
syst
em(1
4 u
nit
s) in
clu
din
g pi
pin
g an
d co
nst
ruct
ion
①
36
0
7 W
aste
wat
er t
reat
men
t N
eutr
aliz
atio
n in
clu
din
g pH
con
trol
sys
tem
,
sedi
men
tati
on p
onds
, ch
ann
els,
pip
ing
③
45
7
8 C
onst
ruct
ion
an
d er
ecti
on
③
330
Tot
al(d
epen
ds o
n a
lter
nat
ives
ch
osen
) 3.
347 or
3.39
0
Rem
ark
s:①
Pro
cess
Im
prov
emen
t (C
P);
②In
trod
uct
ion
of
New
Fac
ilit
y (C
P)
;③E
OP
C-26
6 Recommended Countermeasures for Improvement
6.1 Short-term Countermeasures
6.1.1
Determine which choice should be made in order to secure the industrial water
supply as soon as possible.
6.1.2
After making this determination, start working on the countermeasures
stated in Section 5.
6.1.3
Regarding SS, BOD5 and COD values, these value need to be studied to
determine the cause and to know the possibility of installing and adopting
coagulation/separation type treatment or biological treatment.
6.1.4
Wastewater discharged from electrode production unit and Pb powder
production unit should be decreased by dividing the wastewater line and by
limiting the area washed when floors are cleaned.
6.1.5
Normal wastewater should be separated from abnormal, or dirty wastewater.
6.1.6
Introduce improvement changes such as the 5S activity, especially to improve
the environment around the dry-cell unit.
6.1.7
Improve the quality of factory management by introducing statistical methods.
6.2 Mid-term and long -term Countermeasures
6.2.1
Introduce improved technology for the production system and environmental
countermeasures from developed countries. An example of this would be to seek
cooperation from a producer.
6.3 Schedule
Figure 8 shows industrial pollution prevention schedule. The company is
obligated to carry out the measures following the schedule.

C-27
Pro
ject
/Act
ivit
y 20
00
2001
20
02
2003
20
04
2005
M
an
age
men
t (1
) A
pply
ing
5S, ‘
Kai
zen
’ act
ivit
y (2
) A
pply
ing
stat
isti
cal
met
hod
in
da
ta
trea
tmen
t (3
) A
pply
ing
ISO
9000
(4
) A
pply
ing
ISO
1400
0
Pro
cess
Im
pro
vem
ent
(CP
) (1
) U
pgra
din
g w
ater
pip
e li
ne
(2)
Pu
re w
ater
su
pply
ing
(3)
H2S
O4
vapo
r
Intr
odu
ctio
n o
f N
ew F
acil
ity
(CP
) (1
) D
ecid
ing
the
supp
ly w
ater
sou
rce
(2)
Su
pply
wat
er s
yste
m
Str
engt
hen
ing
EO
P
(1)
Was
tew
ater
tre
atm
ent
Fig
ure
8
Act
ion
Pla
n (
2000
to
2005
)

C-28

C-29
CASE STUDY C-02
Lam Thao Superphosphate & Chemicals Company
Survey Dates: November 24, 1999
March 9-10, 13-14, 2000
1. General
1.1 Profile
Lam Thao Superphosphate & Chemical Company is one of the state-owned
companies under VINACHEM, of the Ministry of Industry. The company profile is
shown in Table 1, and the layout is shown in Figure 1.
Table 1 Company Profile
Company Name: Lam Thao Superphosphate & Chemical Company
Ownership: State owned
Address: Lam Thao- Phu Tho Province
Director: Mr. Nguyen Quoc Lap
Established: 1962
Corporate Capital:
Number of Employees: 3,900 including 252 engineers
Main Products: NPK, Superphosphates, H2SO4, Na2SiF6
The company was established in 1962 and production began at the same time.
The enterprise produces sulfuric acid, single superphosphate, NPK fertilizer and
Na2SiF6. The capacity of production has evolved and changed as follows:
1962 1998 2001
sulfuric acid 40,000t/y 200,000t/y 240,000t/y
superphosphate, 100,000t/y 595,000t/y 750,000t/y
NPK fertilizer ‐ 90,000t/y 150,000t/y
New plant investment is 58 billion VND, 40% lower than surveyed. (The
pay-out period is ten years) Technology was developed autonomously by the
company, the equipment layout comes from Poland, automated machinery is from
Japan (Yokokawa Electric), and the design was developed by CECO. Construction
work is set to begin in April 2000 for this new, enlarged design and be completed
around the end of the year. Production is scheduled to start in the first part of
2001.

C-30
Roa
d
Mai
n G
ate
O2 P
lan
t
Mec
han
ical
Wor
ksh
op
No.
2 S
upe
rph
osph
ate
Pla
nt
No.
1 S
upe
rph
osph
ate
Pla
nt
No1
. H2S
O4
Pla
nt
No.
2 H
2SO
4 P
lan
t
Off
ice
Fig
ure
1
Fac
tory
Lay
out
Det
erge
nt
Pla
nt
Lab
orat
ory
Cen
ter
Boi
ler
Pow
er S
tati
on

C-31
1.2 Status of Business
1.2.1 Production
The expected demand for their products is very bright and more production
capacity is needed for the future. However, prices of the products have not changed
recently. When comparing the production graph below to production capacity
shown above it can be seen that they are operating roughly at full capacity.
At present there is only 1 production line for H2SO4, and another line is
expected to be installed for expansion of production capacity. Total production of
their main products has grown almost 7 times in the past 37 years. Consumption
of coal is 10,000 t/y and electricity is 6,000,000 kw/y.
Annual production and revenues are shown in Table 2
Table 2 Annual Production and Revenues in 1998
1998 1999 Product Production (Tons) Revenue
(million VND) Production (Tons)
H2SO4 199,920 Internal Use 125,000 Single Superphosphate
593,600 365,160 638,000
NPK 85,171 85,171 125,000
1.2.2 Debt
Documents received from the company indicate that they hold minor debt with
commercials banks, but 35,880 million VND in debt with the National Bank.
2. Production Technology
2.1 Process
Production technology used for their products, H2SO4 and single
superphosphate fertilizer, was introduced from Russia. Production capacity was
expanded several times due to improvements and modifications of facilities.
However, there is no support from Russia at present. Annual maintenance takes 15
days.
2.1.1 Sulfuric Acid
Pyrite made in Phu Tho Province (Sulfur Content: 33%) and sulfur are the raw
materials used for H2SO4 production (Purity : 99.5%). There are two trains, one
utilizes a fluidized bed (installed in 1985) with 2 kinds of raw materials and

C-32
another train uses only sulfur as a raw material (installed in 1995). The former
process has a gas purification unit and the latter doesn't. Production of 100%
H2SO4 from the former train was 122,960 tons and the latter was 76,960 tons in
1998. At the sulfuric acid plant surveyed, a double contact method has not been
adopted. However, they are planning to adopt this method in the newly
constructed plant. The conversion effectiveness of the reaction machine surveyed is
98.8% on average, and the effectiveness for sulfur is over 99.5%.
Since 1998 they have been working at lowering the utilization rate of pyrite
and by the end of 2001 they are planning to stop using it altogether. They have a
heat boiler with a capacity of 21t/h (vapor pressure: 25 atm) but, at present, they
are not utilizing the vapor. However, they would like to utilize it for drying, etc. in
the future. Figure 2 shows production process on both systems according to the
data provided by the company.
2.1.2. Single Superphosphate
The technology in use is a drying method and there were 2 trains of roughly
the same scale installed in 1962. Superphosphate fertilizer is produced by using
apatite from Lao Cai Province as a raw material. Types, quality and consumption
of apatite are shown in Table 3.
Table 3 Quality of Apatite and Consumption in 1999
Apatite P2O5 Content (%) Moisture Content (%) Amount Used (1999)
Natural Apatite 33 12 255,000 Tons Flotated Apatite 33 15 180,000 Tons
19 % is made up of P205 in their product for both trains, of which 87% is water
soluble P2O5 which can be used as a fertilizer. The content of F is 2%
2.2 Sources of Wastewater
400m3/h of industrial wastewater is draining into the Kouga River, and in
addition to this, 120m3/h of wastewater generated from the washing process for
dust coming out of the superphosphate production process is draining into nearby
fields. Concerning wastewater analysis, pH is analyzed everyday, and COD, BOD5,
PO4, SO4, Cl, Oil, Conductivity, SS, TDS, and Turbidity are analyzed once every 2-3
months. The system graph of wastewater, confirmed on November 24, 1999, is the
same as it appears in Figure 4. However, during the third field survey, upon
re-confirmation of wastewater usage, the following misunderstandings became

C-33
evident.
No.1 H2SO4 Plant No.2 H2SO4 Plant
1200m3/h
Water Discharge to the Red River Water from the Red River 400m3/h 2500m3/h including Superphosphate Production including Superphoshate Production
Figure 2 H2SO 4 Production flow chart
120m3/h
Wastewater to
the rice field
Water from the Red River
Wastewater to the Red River
Figure 3 Super phosphate Production Flow Chart
Combustion
Gas
Purification
Contact
Absorption
Product (100%) 122,960t
Material Processing
Combustion
Contact
Absorption
Product (100%) 76,960t
Circulation
Lake
Coal
2,459.2t
Pyrite
407,869t
Sulfur
27,472t
Sulfur
18,138t
Material Processing
Coal
12,005.7t
Apatite
408,395t
Material Processing
Product Storage
Single Superphosphate
16.5% P2O5
593,600t
Sedimentation Tank
Preparation H2SO4
192,889t

C-34
① In the sampling that took place on November 24, 1999 in the second field
survey, the location of survey point No. 7 (refer to Figure 4) was incorrect, and
correctly should have been No.2, the exit to the Sulfur Plant (refer to Figure 5).
Every morning at 8:00 A.M., Fe2O3 bunched up at the lower part of the thickener is
blown in order to discharge it. However 2% of this includes sulfuric acid. Following
this, it was thought that during the second field survey, that it was receiving some
effect from the blowing.
② Furthermore, in the gas refining process of the same production process, there
are a total of four moist-type, electric filters, and during lunch time every week,
two hours are dedicated to cleaning one of these filters. Washing wastewater
generated here (pumping ability 36-60m3/h) includes 4%-5% sulfur.
We received this explanation from the company. So one of the sampling points that
was used for sampling was in fact unsuitable for the purposes of this survey. At
that point, we confirmed the wastewater system graph and made a decision on the
sampling point. The result of this decision is exactly as it appears in Figure 5.
From the Red River
⑥
Domestic Use ⑦ ②
⑤ 150-160m3/h ③ 120m3/h
To the Rice Field
④ 240-250m3/h
① ⑧
To the Red River ⑨
Figure 4 Water System
Sedimentation Tank
No.1 & No.2
Superphosphate
Filtration Tank
Neutralization
Circulation Lake
Neutralization Sedimentation
No.1 H2SO4 No.2 H2SO4

C-35
3. Management
3.1 General
Present environmental concerns of the company are gas emissions and
wastewater discharge. Emissions of SO2, SO3 and HF gases have been decreased
through technological improvements that have been made from the beginning of
production. Also, sulfur dust from pyrites has been reduced by process
improvement, and a P2O5 recovery system for apatite was installed in the factory.
According to the materials submitted by the company, a project for industrial
waste is in process and is supported technically and financially by the Government
of Japan, the Government of Viet Nam, MOSTE and DOSTE. The 3 objectives of
this project are as follows:
1) Assessment on industrial waste and environmental conditions of the Company
2) Establishing countermeasures for such industrial waste
① Countermeasures for large, solid waste
② Countermeasures for waste gases (SO2, SO3 ,SiF4).
③ Countermeasures for and recovery of dust
3) Establishing a system for wastewater containing HFand HF gas in the
Single Superphosphate production unit

C-36
from the Red River
⑨
Domestic Use
① ⑦
②
④
⑥
B ③ A ⑧ To the Rice Field ⑤
⑩
To the Red River
(Note) The area surrounded by dotted lines shows the Superposphate plant, the
only plant where apatite is partially recycled.
Table 5 Water System and Sampling Points
3.1.1 Current Condition and Countermeasures for Waste Gas
The emission conditions of waste gases SO2、SO3、SiF4 are summarized in Table
4.
Materials provided by the company describe the countermeasures for the
above gases as follows;
Sedimentation Pond
(2 trains, parallel Use)
No.1 H2SO4 No.2 H2SO4 No.2
Superphosphate
Filtration Unit
Thickener Neutralization
Sedimentation
Lime Solution
Preparation
Sedimentation Pond
Circulation Lake
Neutralization
No.1
Superphosphate
Neutralization Sedimentation

C-37
① Countermeasures for SO2
There are two emission points in the factory which exceed the SO2 standard
value regulated in Viet Nam. A few options for possible countermeasures
include absorption through the use of a Na2SO4 solution, absorption by NH3
and neutralization by Ca (OH) 2.
② Countermeasures for SO3
The emission level is close to the regulated value, and the countermeasure
suggested is to improve absorption efficiency by revamping the facilities.
③ Countermeasures for SiF4
The emission from the No.1 train extremely exceeds the regulated value.
Absorption is very difficult because SiO2 covers the surfaces of the absorption
column and lowers the efficiency. In order to solve this problem, a new
technology needs to be applied in the future.
Table 4 Emission Conditions of SO 2, SO 3, SiF 4
Discharge Volume (kg/h)
Facility Material Use
Waste
Designed Actual
Discharge Height (m)
Acid Plant No.1 Contact Tower Absorption Tower
SO2 SO3
SO2 SO3
133 6,527
99.9 13,054
60 60
Acid Plant No.2 Contact Tower Absorption Tower
SO2 SO3
SO2 SO3
196 12.25
245 24.5
100 100
Superphosphate No.1 F Absorption
SiF4
SiF4
3.6
9.72
60
Superphosphate No.2 F Absorption
SiF4
SiF4
1.08
0.36
60
3.1.2 Current Condition and Countermeasures for Solid Waste
The condition of solid waste is summarized in Table 5.
Table 5 Condition of Solid Waste
Facility Waste Amount Discharge Type Treatment Status
Acid Production No.1 Fe2O3 70 t/d Continuous Sell & Store Apatite Drying Coal Slag Continuous Brick Making Dust Treatment Apatite
Powder 30,000 t/y Continuous Superphosphat
e Production

C-38
Facility Waste Amount Discharge Type Treatment Status
Domestic Domestic Waste
400 t/y Periodically Collect & Bury
The main solid waste generated by the company includes slugs of ferric oxide
and coal, and apatite dust. However, most of the portion of ferric oxide is utilized
for the production of cement and the rest is stored in the factory. In 2001, raw
material utilized will be changed to sulfur only and the problem should be solved.
3.1.3 Current Conditions of Wastewater and Suggested Countermeasures
Required water is supplied and used from the Red River at 2,500m3/h, 500m3/h
for domestic use and 2,000m3/h for industrial use. Current conditions of
wastewater are shown in Table 6.
Table 6 Current Condition of Wastewater
Waste Stream
Unit Production Discharge Destination
Flow Contaminant
1 Acid Production Red River 400 m3/h Residue, pH 2 Acid Production Circulating 1,200 m3/h Nil 3 Superphosphate
Production Pond 400 m3/h Apatite
Residue
Stream No.2 is used for cooling water and the total volume of the water is
12,000m3/h, which comes from the Red River. The quality of water in Stream No.1
and No.3 are shown in Table 7 and the drainage conditions are described in Table
8.
Countermeasures for wastewater problems are described as follows:
1) Wastewater is discharged into the Red River at about 400m3/h and contains
various pollutants.
①For wastewater discharged from the acid production plant: Treatment should be
performed before being sent to the central wastewater treatment facility. This
facility was originally installed to be the last treatment before final discharge to
the Red River because the water contains solid substances such as ferric oxide and
silica. The company is planning to replace the existing facilities.

C-39
② For Wastewater discharged from the absorption unit of HF in the
superphosphate production unit: SiF4 is used for production of Na2SiF6 and the
process discharges wastewater containing HCl into the river. This is the main
source of pollution in the wastewater in the company.
2) For rain water: It should be accumulated in a circulation pond for further
utilization.
3) Domestic wastewater comes from the shower room and the kitchen room, but
only the kitchen water has an adverse environmental impact. Biological treatment
could be considered as a possible treatment for this water.
Table 7 Quality of Wastewater
Parameter Unit Waste Stream 1 Waste Stream 2 pH 5 6.5 Conductivity ms/cm 1.7 0.24 SS mg/l 160 950 TDS mg/l 830 124 Turbidity NTU 95 77 COD mg/l 108 39 BOD5 mg/l 76 26 PO4 mg/l 7.2 2.6 SO4 mg/l 690 58 Cl mg/l 0.7 4.8 Oil mg/l 2.7 1.8
Table 8 Drainage Conditions
A) Different Types of Discharged Water B) Industrial Wastewater System - Separated industrial wastewater: 400m3/h - Industrial wastewater combined with storm water: nil - Industrial wastewater combined with domestic water: 400m3/h
- Circulating pond to minimize the volume of discharge
- (Working continuously) - On-site treatment at the Fluorine gas absorption unit of the Superphosphate production line (Batch Operation) - On-site treatment of wash acid from the acid production Unit No.1 (Batch Operation) – Treatment efficiency: Treatment will be more effective using automated operations in order to meet the allowable standard.
C-40
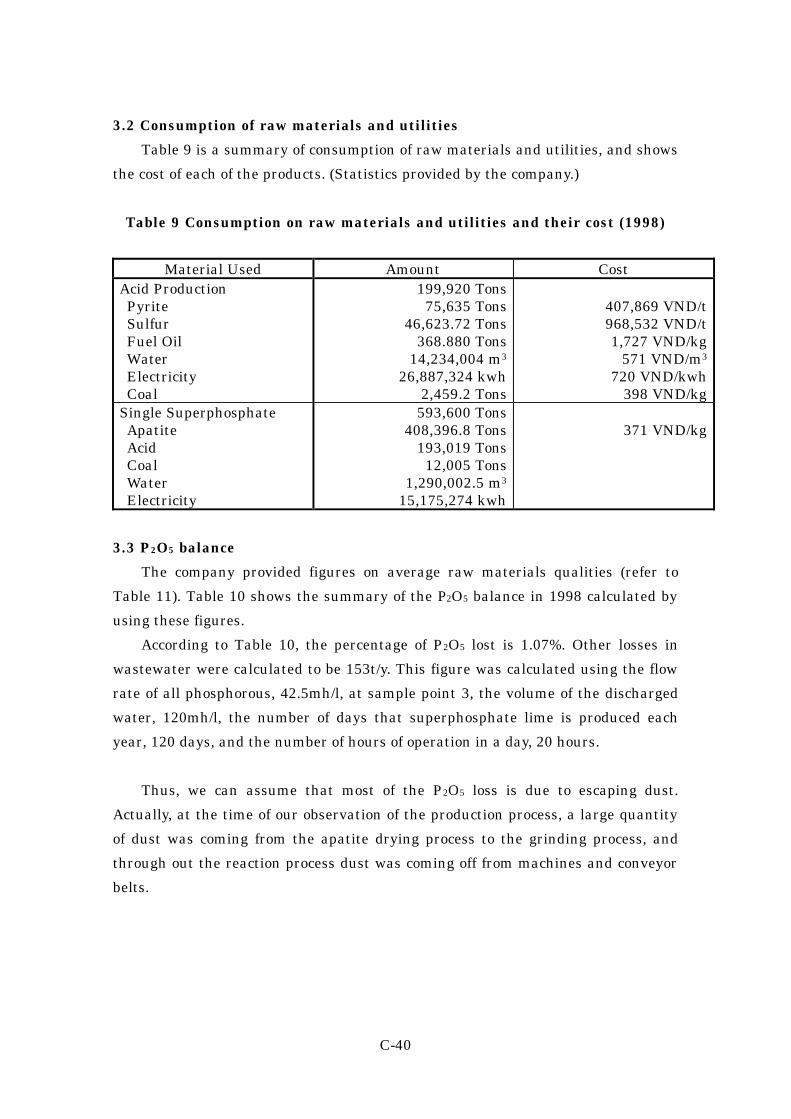
3.2 Consumption of raw materials and utilities
Table 9 is a summary of consumption of raw materials and utilities, and shows
the cost of each of the products. (Statistics provided by the company.)
Table 9 Consumption on raw materials and utilities and their cost (1998)
Material Used Amount Cost Acid Production Pyrite Sulfur Fuel Oil Water Electricity Coal
199,920 Tons 75,635 Tons
46,623.72 Tons 368.880 Tons
14,234,004 m3 26,887,324 kwh
2,459.2 Tons
407,869 VND/t 968,532 VND/t 1,727 VND/kg
571 VND/m3 720 VND/kwh
398 VND/kg Single Superphosphate Apatite Acid Coal Water Electricity
593,600 Tons 408,396.8 Tons
193,019 Tons 12,005 Tons
1,290,002.5 m3 15,175,274 kwh
371 VND/kg
3.3 P 2O 5 balance
The company provided figures on average raw materials qualities (refer to
Table 11). Table 10 shows the summary of the P2O5 balance in 1998 calculated by
using these figures.
According to Table 10, the percentage of P2O5 lost is 1.07%. Other losses in
wastewater were calculated to be 153t/y. This figure was calculated using the flow
rate of all phosphorous, 42.5mh/l, at sample point 3, the volume of the discharged
water, 120mh/l, the number of days that superphosphate lime is produced each
year, 120 days, and the number of hours of operation in a day, 20 hours.
Thus, we can assume that most of the P2O5 loss is due to escaping dust.
Actually, at the time of our observation of the production process, a large quantity
of dust was coming from the apatite drying process to the grinding process, and
through out the reaction process dust was coming off from machines and conveyor
belts.

C-41
Table 10 Results of the trial calculation of the P 2O 5 balance
Item Consumption & Production in 1998
Premises P2O5
Apatite Natural Flotated
408,397t/y 248,241t/y 160,156t/y
P2O5:33% (dry base) Moisture:12% Moisture:15%
117,012t/y 72,089t/y 44,923t/y
Superphosphate 593,600t/y P2O5:19.5% (wet base)
115,752t/y
P2O5 Balance -- -- 1,260t/y
Table 11 Apatite Quality
Parameter Natural Apatite ( February 2000)
Floating Apatite
P2O5 % (dry base) 32.3-33 35.53 SiO2 % 10.87-12.3 Fe2O3 % 2.2 MgO % 2.2-2.4 CaO % 42.3-42.4 F % 2.0-2.2 Al2O3 % 4.4-4.8
In order to double check these figures, raw material samples, product samples,
and sludge samples from the sedimentation tank samples were collected on March
10, 2000. These were sent to CECO for analysis. The results of this analysis are
shown in Table 12.
Table 12 Results of composite analysis (CECO)
Sample Item Unit
Apatite (Natural)
Apatite (Flotated)
Superphosphate (Product)
Settled Sludge
Time 12:20 12:20 12:06 12:30 P2O5 % 29.28 27.62 20.85 0.16 Al2O3 % 0.453 0.302 0.351 0.302 Fe2O3 % 1.77 1.42 1.03 0.15 MgO % 3.0 3.0 2.0 0.8 CaO % 42.0 42.0 28.0 27.4 Pb % 0.0217 0.075 0.0188 0.0058 Cr % 2.25 x 10⁻³ 1.75 x 10⁻³ 1.25 x 10⁻³ <10-3 Cd % <10-4 <10-4 4 x 10⁻⁴ <10-4 Mn % 0.468 0.202 0.128 0.005 Ni % 4 x 10⁻³ 3 x 10⁻³ 2 x 10⁻³ <10-3 As % 9.91 x 10⁻⁴ 8.28 x 10⁻⁴ 8.29 x 10⁻⁴ 1.76 x 10⁻⁴ Zn % 0.0131 0.058 0.082 0.069

C-42
3.4 Fluorine material balance
Fluorine balance in 1998 was calculated under the same conditions as the
preceding section. Supposing that the content of fluorine in apatite is 2.0%(dry
base), the amount of fluorine in apatite comes to 7,092t/y. Because of the fact that
the company didn’t produce any Na2SiF6 in 1998, and their product,
superphosphate lime, contains only half the amount of fluorine, it means that
3,546t/y of fluorine escapes and is lost to the air or the discharged water.
From the results of a trial calculation, we can conclude that most of the lost
Fluorine, 33t/y, escapes into the air. This number was calculated using the
following figures: ①Fluorine content at sample points #3 is 15.75mg/l and at #4 is
13.25mg/l in Table 15. The volume of water at sampling point #3 is 120m3/h, and
at sampling point #4 is 240m3/h.②The number of operating days per year, and the
number of hours in operation each day of the superphosphate production unit.
4. Industrial Wastewater and its Treatment
4.1 Wastewater quality
4.1.1 Samples taken on November 24th,1999
Figure 13 shows sample points and details. The results of wastewater quality
measured by a simple analysis equipment is shown in table 14.
Table 13 Sampling points and the detail of samples
Sampling point Sample 1 Recycled water from the No.2 Sulfur Plant 2 Blank test (service water) 3 Wastewater from the No.1 and No.2 Superphosphate plant
tank discharge point(drained into the rice field) 4 Wastewater from the discharge point for the neutralization
tank of the No.1 and No. 2 Superphosphate plants 5 Wastewater from the discharge point of the neutralization tank
of the No. 1 Sulfur plant 6 Water from the discharge point of the irrigation water
precipitation tank 7 Wastewater from the No. 1 sulfur plant (before neutralization) 8 Drainage water into the Koga River 9 Water from the Koga River 2 km downstream of the discharge
point
Figure 14 shows the results of the water quality analysis of samples
simultaneously taken and measured by CECO with a simple analyzing device.

C-43
However, concerning the Blank Test for purified water, there were no samples
taken by CECO for analysis. Following this, in CECO’s analysis report for
sampling points 3 and above, these have been listed one by one, but in order to link
them with Table 14, here in Table 13, we have adopted the use of sampling point
numbers.
Table 14 Water Quality Analysis Results(CECO)
Sampling Point 1 2 3 4 5 Parameter Unit
Time 13:20 13:35 13:45 13:50 Temp. ℃ 33 34 39 35 pH 8.3 8.1 11.9 9 Conductivity ms/cm 0.23 0.3 5.0 0.37 Turbidity NTU 180 230 2,370 139 Oil content mg/l 0.4 0.42 0.44 0.35 BOD5 mg/l 20.7 29 21.6 18 COD mg/l 52 74.6 68 67 DO mg/l 4.8 4.9 4.3 4.0 SS mg/l 159 270 2,575 181 T-Nitrogen mg/l 28 57.6 57.6 6.4 CN mg/l 0.001 0.000 0.000 0.014 Phenol mg/l 0.005 0.001 0.005 0.003 Residual Cl mg/l 0.00 0.00 0.3 0.09 SO4 mg/l 47 74 24 76 Mn mg/l 0.20 0.00 32.2 0.00 Fe mg/l 1.09 2.17 25.68 12.84 F mg/l 4.15 15.75 13.25 0.07 T-P mg/l 12.1 42.5 52.29 0.07
Sampling Point 6 7 8 9 Parameter Unit
Time 14:10 13:23 14:40 15:00 Temp. ℃ 25 37 31 24 pH 8.4 2.5 2.6 7.2 Conductivity ms/cm 0.21 4.4 3.1 0.2 Turbidity NTU 300 232 241 432 Oil content mg/l 0.01 0.32 0.37 0.01 BOD5 mg/l 13 21.8 54 16 COD mg/l 26 86.7 96 35 DO mg/l 7.4 0.1 4.5 6.0 SS mg/l 386 437.5 310 660 T-Nitrogen mg/l 5.75 6.5 19.8 7.5 CN mg/l 0.00 0.035 0.038 0.000 Phenol mg/l 0.005 0.007 0.005 0.005

C-44
Sampling Point 6 7 8 9 Parameter Unit
Residual Cl mg/l 0.00 0.12 0.2 0.07 SO4 mg/l 6 536 152 11 Mn mg/l 0.12 0.00 0.8 0.2 Fe mg/l 2.8 34.08 3.12 5.84 F mg/l 0.06 0.07 2.43 0.37 T-P mg/l 0.09 0.14 5.86 0.48
4.1.2 Samples taken on March 10, 2000
The sampling point numbers used this time (refer to Figure 5) and the content
of the samples have been put together and organized with old sampling point
numbers (refer to Figure 4) and their differences in Table 15. Also, the volume of
the water at each of the sampling points used this time is shown in Table 16.
Table 15 Differences Between Past and Present Sampling Points
Sampling point No.’s used this
time
Sampling point No.’s used last
time
Differences between past and present
1 No.2 H2SO4 discharge point 2 1 Cooling circulation line(the content of the
samples are the same) 3 5 No.1 H2SO4 discharge point 4 No.1 Fertilizer wastewater at the discharge
point before neutralization 5 No.1 Fertilizer wastewater after
neutralization 6 3 Dust treatment water at the discharge point
of the precipitation tank for No.1 & No.2 Fertilizer before drainage into rice fields
7 Wastewater discharge point for No.2 Fertilizer (before treatment)
8 4 No.2 Fertilizer wastewater after treatment 9 6 Last time, in the end, samples were taken at
the intake point of the precipitation tank. This time samples were taken at the pump discharge point at the precipitation tank exit.
10 8 Drainage exit for general wastewater drained into the Koga River
A 7 Last time what we intended to be No.2 H2SO4 actually turned out to be No.1 H2SO4. H2SO4.This time we only measured with a “Checker.”
B Lime Solution Preparation

C-45
Sample point A and B were only measured with a simple analyzing device
Table 16 Water Volume at the Sampling Points
Sampling Point Numbers Water Volume ③ 150-160m3/h A 180m3/week ⑧ 120m3/h ⑥ 180m3/h ⑤ 120m3/h
Cyclone wastewater of the No.2 Superphosphate Plant 120m3/h Cyclone wastewater of the No.1 Superphosphate Plant 120m3/h
Return from the precipitation take of the No.1 Superphosphate Plant
60m3/h
Moreover, according to the explanation by the company, the intake entrance
for domestic wastewater is 5km upstream of the paper manufacturing plant. The
intake volume is 500m3/h and the factory irrigation water intake volume does not
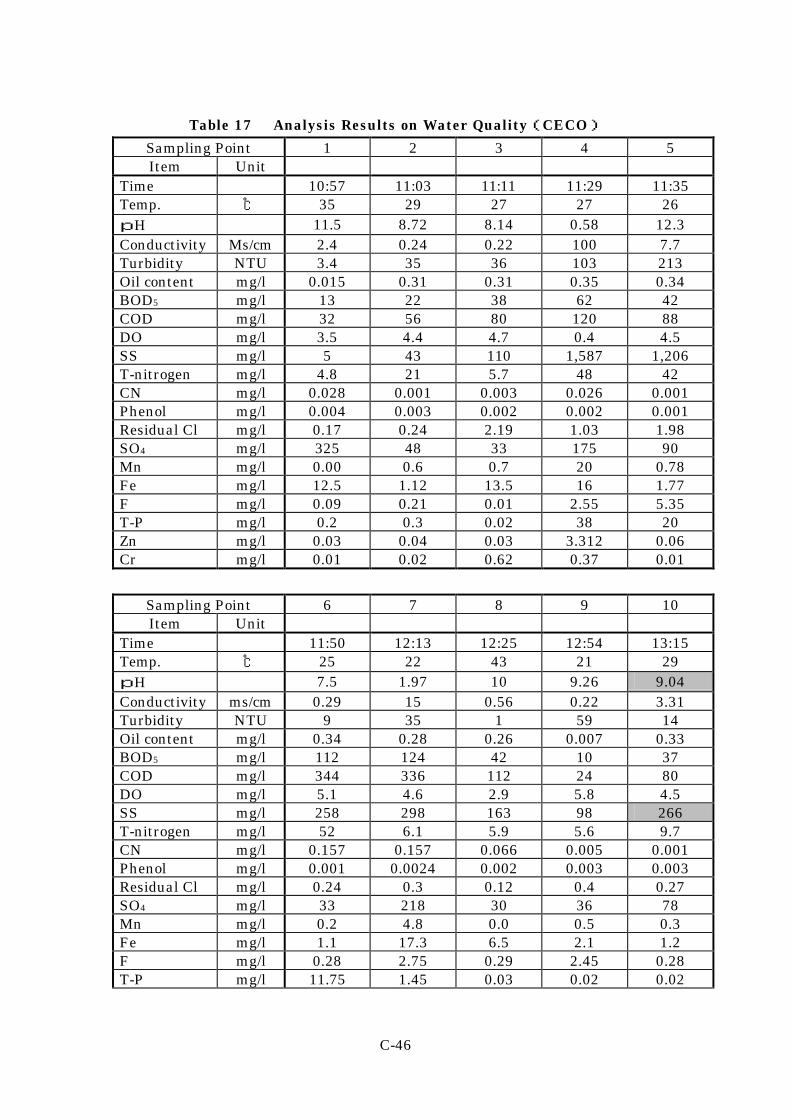
exceed 2,000 m3/h. The results of measurements taken this time with a simple
analyzing device, and the results of the sampling done at the same time by CECO
are shown in Table 17. Moreover, at the time the samples were taken, the above
mentioned “purging,” as well as cleaning of the wet-type, electric filter was not
taking place.
At the time of the second field survey, we did not receive any information on
the thickener “blow” for the No.2 H2SO4 and information on the cleaning of the
moist electric filter. However, when we compare the results from the new No.1 to
the old No. 7 and the new No. 10 to the old No. 8, it can be supposed that the
cleaning of the moist electric filter was not taking place. Also, during the second
field survey, we thought that we had measured after the precipitation treatment of
irrigated wastewater. However, in actuality, we found we had measured before the
precipitation treatment.
C-46
Table 17 Analysis Results on Water Quality(CECO)
Sampling Point 1 2 3 4 5 Item Unit
Time 10:57 11:03 11:11 11:29 11:35 Temp. ℃ 35 29 27 27 26 pH 11.5 8.72 8.14 0.58 12.3 Conductivity Ms/cm 2.4 0.24 0.22 100 7.7 Turbidity NTU 3.4 35 36 103 213 Oil content mg/l 0.015 0.31 0.31 0.35 0.34 BOD5 mg/l 13 22 38 62 42 COD mg/l 32 56 80 120 88 DO mg/l 3.5 4.4 4.7 0.4 4.5 SS mg/l 5 43 110 1,587 1,206 T-nitrogen mg/l 4.8 21 5.7 48 42 CN mg/l 0.028 0.001 0.003 0.026 0.001 Phenol mg/l 0.004 0.003 0.002 0.002 0.001 Residual Cl mg/l 0.17 0.24 2.19 1.03 1.98 SO4 mg/l 325 48 33 175 90 Mn mg/l 0.00 0.6 0.7 20 0.78 Fe mg/l 12.5 1.12 13.5 16 1.77 F mg/l 0.09 0.21 0.01 2.55 5.35 T-P mg/l 0.2 0.3 0.02 38 20 Zn mg/l 0.03 0.04 0.03 3.312 0.06 Cr mg/l 0.01 0.02 0.62 0.37 0.01
Sampling Point 6 7 8 9 10 Item Unit
Time 11:50 12:13 12:25 12:54 13:15 Temp. ℃ 25 22 43 21 29 pH 7.5 1.97 10 9.26 9.04 Conductivity ms/cm 0.29 15 0.56 0.22 3.31 Turbidity NTU 9 35 1 59 14 Oil content mg/l 0.34 0.28 0.26 0.007 0.33 BOD5 mg/l 112 124 42 10 37 COD mg/l 344 336 112 24 80 DO mg/l 5.1 4.6 2.9 5.8 4.5 SS mg/l 258 298 163 98 266 T-nitrogen mg/l 52 6.1 5.9 5.6 9.7 CN mg/l 0.157 0.157 0.066 0.005 0.001 Phenol mg/l 0.001 0.0024 0.002 0.003 0.003 Residual Cl mg/l 0.24 0.3 0.12 0.4 0.27 SO4 mg/l 33 218 30 36 78 Mn mg/l 0.2 4.8 0.0 0.5 0.3 Fe mg/l 1.1 17.3 6.5 2.1 1.2 F mg/l 0.28 2.75 0.29 2.45 0.28 T-P mg/l 11.75 1.45 0.03 0.02 0.02

C-47
Sampling Point 6 7 8 9 10 Item Unit
Zn mg/l 0.25 0.09 0.00 0.0 0.1 Cr mg/l 0.00 0.11 0.02 0.02 0.001
4.2 Regulation Standards for Industrial Wastewater
We have added Table 18 in order to compare the wastewater quality in public
water areas (In Table 14 sampling point No.8 and in Table 17 sampling point No.
10), included in the water quality analysis results in Table 14 (samples taken on
November 24, 1999) and Table 17 (samples taken on March 10, 2000), with
Vietnam’s industrial wastewater standards (Rank B).
We heard from the company that, “At the time the industrial wastewater
standards were set, B rank seemed to be most applicable for our existing factories.
However, for the newly constructed factory and the factory’s new facilities, A rank
is more applicable.” As a result of this, and for reference, the A rank standard price
is also added next to it in Table 18.
Table 18 Industrial Wastewater Discharge Standards
Wastewater Discharge Standard
Wastewater Discharge Standard
Parameter Unit
A B
Parameter Unit
A B Temp. ℃ 40 40 Mn mg/l 0.2 1
pH 6-9 5.5-9 Ni mg/l 0.2 1 BOD5 mg/l 20 50 Organic P mg/l 0.2 0.5 COD mg/l 50 100 Fe mg/l 1 5 SS mg/l 50 100 Sn mg/l 1
Mineral Oil
mg/l ND 1 Hg mg/l 0.005 0.005
Organic Oil
mg/l 5 10 T-Nitrogen mg/l 30 60
As mg/l 0.05 0.1 T-P mg/l 4 6 Cd mg/l 0.01 0.02 F
Compounds mg/l 1 2
Residual Cl
mg/l 1 2 Phenol mg/l 0.001 0.05
Cr(Ⅵ) mg/l 0.05 0.1 S Compounds
mg/l 0.2 0.5
Cr(Ⅲ) mg/l 0.2 1 CN mg/l 0.05 0.1 Zn mg/l 1 2 Pb mg/l 0.1 0.5
C-48
Wastewater Discharge Standard
Wastewater Discharge Standard
Parameter Unit
A B
Parameter Unit
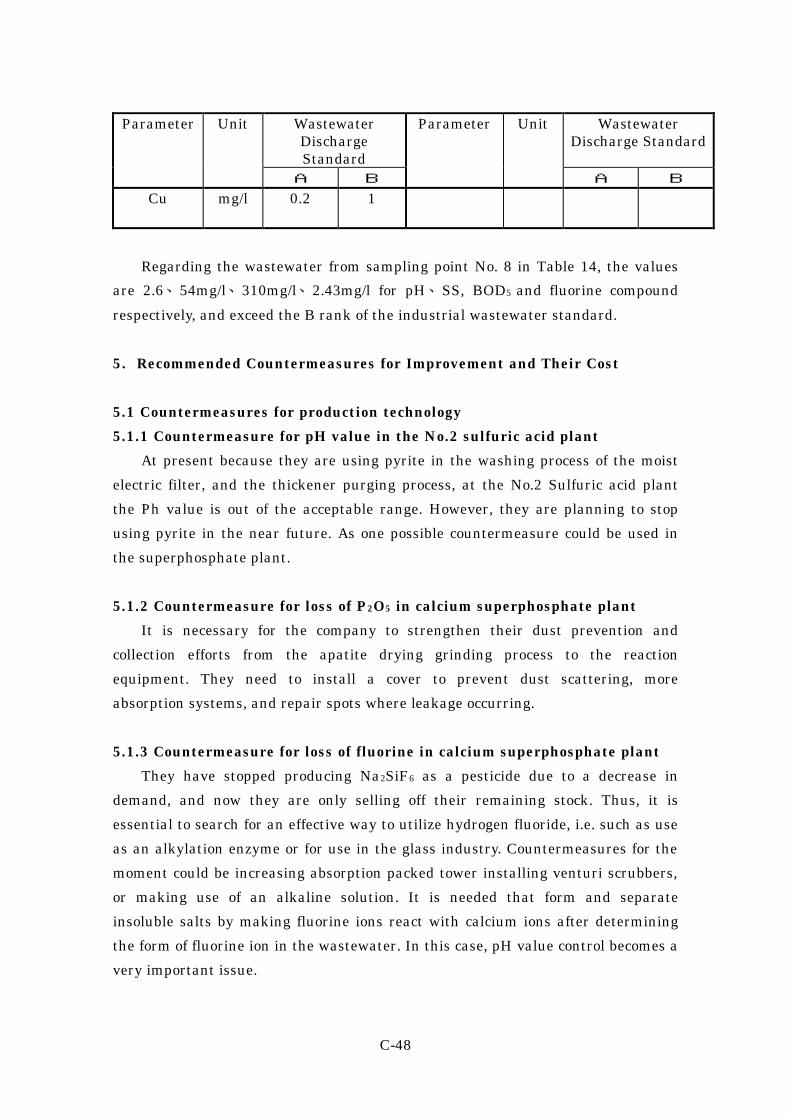
A B Cu mg/l 0.2 1
Regarding the wastewater from sampling point No. 8 in Table 14, the values
are 2.6、54mg/l、310mg/l、2.43mg/l for pH、SS, BOD5 and fluorine compound
respectively, and exceed the B rank of the industrial wastewater standard.
5. Recommended Countermeasures for Improvement and Their Cost
5.1 Countermeasures for production technology
5.1.1 Countermeasure for pH value in the No.2 sulfuric acid plant
At present because they are using pyrite in the washing process of the moist
electric filter, and the thickener purging process, at the No.2 Sulfuric acid plant
the Ph value is out of the acceptable range. However, they are planning to stop
using pyrite in the near future. As one possible countermeasure could be used in
the superphosphate plant.
5.1.2 Countermeasure for loss of P 2O 5 in calcium superphosphate plant
It is necessary for the company to strengthen their dust prevention and
collection efforts from the apatite drying grinding process to the reaction
equipment. They need to install a cover to prevent dust scattering, more
absorption systems, and repair spots where leakage occurring.
5.1.3 Countermeasure for loss of fluorine in calcium superphosphate plant
They have stopped producing Na2SiF6 as a pesticide due to a decrease in
demand, and now they are only selling off their remaining stock. Thus, it is
essential to search for an effective way to utilize hydrogen fluoride, i.e. such as use
as an alkylation enzyme or for use in the glass industry. Countermeasures for the
moment could be increasing absorption packed tower installing venturi scrubbers,
or making use of an alkaline solution. It is needed that form and separate
insoluble salts by making fluorine ions react with calcium ions after determining
the form of fluorine ion in the wastewater. In this case, pH value control becomes a
very important issue.

C-49
5.2 Countermeasures for management technology
As stated in 5.1, wastewater pH control has to be improved.
5.3 Countermeasure for wastewater treatment
Taking countermeasures explained in above will lead to improved wastewater
treatment.
5.4 Estimate for countermeasures
We requested an estimation from the company for the cost of countermeasures
in part 3 which experts from MOI, members of survey team, and the company
representatives discussed and summarized. Table 19 shows the estimate
submitted by the company via MOI. The total estimation for these
countermeasures is 15,040 million VND, and the estimate categorized by
investment classification shown in Table 19.

C-50
Tab
le 1
9
Est
imat
ion
Cos
ts f
or C
oun
term
easu
res (
Mil
lion
VN
D)
I. S
up
erp
hos
ph
ates
pla
nt
No.
2
No
App
lica
tion
poi
nt
Cou
nte
rmea
sure
s C
ost
1 H
amm
er m
ill
Rep
lace
men
t of
mat
eria
l to
impr
ove
life
tim
e, c
losi
ng
syst
em
①
20
0 2
Flo
tate
d or
e co
nve
yer
afte
r dr
yin
g C
lose
d h
ood
and
suck
ing
syst
em
②
20
0 3
Un
derg
rou
nd
con
veye
r af
ter
ham
mer
mil
l C
lose
d sy
stem
, in
stal
lati
on o
f dry
an
d w
et c
yclo
nes
, su
ckin
g sy
stem
for
dust
re
cove
r
②
50
0
4
Cyc
lon
e sy
stem
for
fou
r dr
yin
g sy
stem
s E
ngi
nee
rin
g, m
anu
fact
uri
ng
and
erec
tion
of
oth
er d
ry a
nd
wet
inte
grat
ed
cycl
one
syst
em f
or t
he
4 dr
yers
②
400
5 B
low
ers
and
pipi
ng
for
the
4 dr
yin
g sy
stem
s -
Upg
radi
ng
of b
low
ers
for
the
4 dr
yers
to
impr
ove
effi
cien
cy
- L
eaka
ge t
reat
men
t ①
800
①
80
0 6
Dis
char
ged
poin
t af
ter
drie
d fl
otat
ed o
re c
onve
yer
H
ood
syst
em
②
15
0
7 B
all d
ryer
sys
tem
No.
I
Lea
kage
tre
atm
ent,
pip
ing
repl
acem
ent
①
20
0 8
Du
st r
ecov
erin
g cy
clon
e sy
stem
fr
om b
all m
ill N
o. 1
A
ddit
ion
of
inte
grat
ed c
yclo
ne
for
impr
ovem
ent
of e
ffic
ien
cy
①
20
0
9 B
low
ers
and
pipi
ng
of b
all m
ill
syst
em N
o. 1
U
pgra
din
g bl
ower
s, L
eaka
ge t
reat
men
t, P
ipe
repl
acem
ent
①
50
0
10
R/M
rec
eivi
ng
poin
t of
No.
1 ba
ll
mil
l fe
ed f
un
nel
fro
m c
onve
yer
No.
13
Hoo
d sy
stem
, clo
sed
syst
em f
or t
he
feed
fu
nn
el
②
15
0
11
R/M
rec
eivi
ng
poin
t of
con
veye
r N
o. 1
3 fr
om c
onve
yer
No.
12
Clo
sed
syst
em
②
15
0
12
Bal
l mil
l No.
2
Lea
kage
tre
atm
ent,
upg
radi
ng
pipe
lin
es
①
20
0 13
D
ust
rec
over
ing
syst
em a
fter
bal
l m
ill N
o. 2
A
ddit
ion
of i
nte
grat
ed c
yclo
ne
syst
em t
o im
prov
e du
st r
ecov
erin
g ef
fici
ency
①
200
14
Blo
wer
s fo
r ba
ll m
ill N
o. 2
U
pgra
din
g th
e bl
ower
s sy
stem
①
500
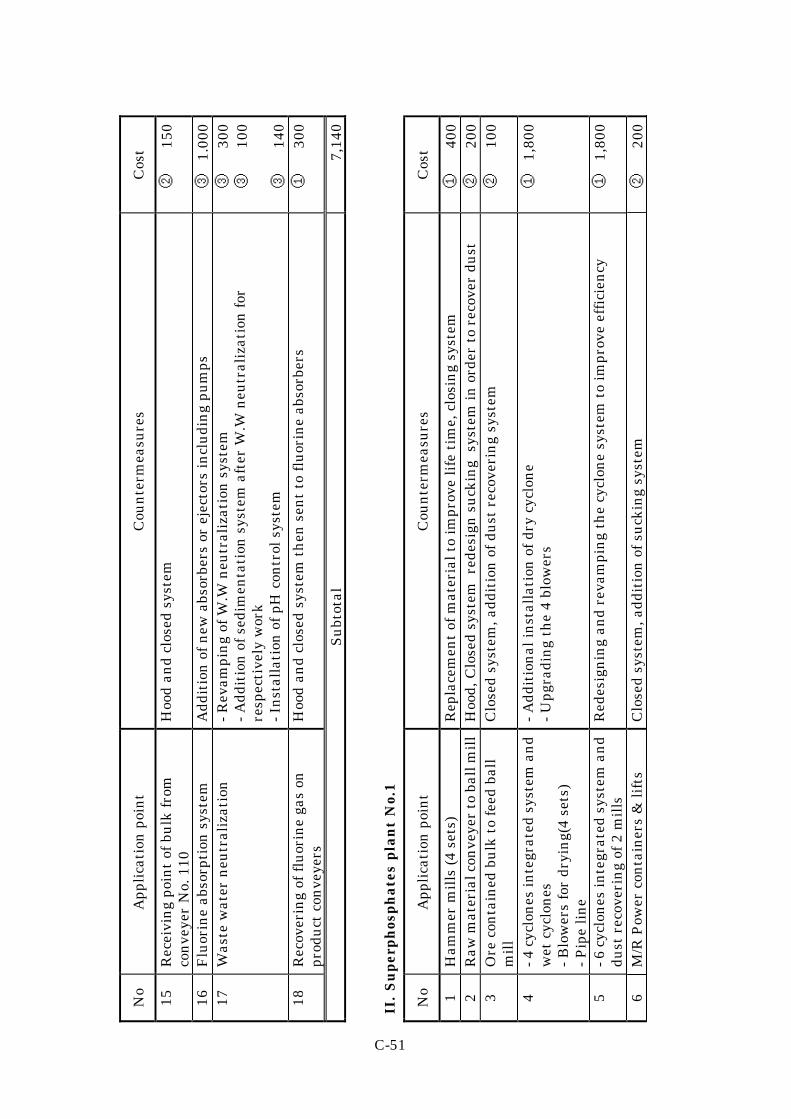
C-51
No
App
lica
tion
poi
nt
Cou
nte
rmea
sure
s C
ost
15
Rec
eivi
ng
poin
t of
bu
lk f
rom
co
nve
yer
No.
110
H
ood
and
clos
ed s
yste
m
②
15
0
16
Flu
orin
e ab
sorp
tion
sys
tem
A
ddit
ion
of
new
abs
orbe
rs o
r ej
ecto
rs in
clu
din
g pu
mps
③
1.
000
17
Was
te w
ater
neu
tral
izat
ion
-
Rev
ampi
ng
of W
.W n
eutr
aliz
atio
n s
yste
m
- A
ddit
ion
of
sedi
men
tati
on s
yste
m a
fter
W.W
neu
tral
izat
ion
for
re
spec
tive
ly w
ork
- In
stal
lati
on o
f pH
con
trol
sys
tem
③
300
③
10
0 ③
140
18
Rec
over
ing
of f
luor
ine
gas
on
prod
uct
con
veye
rs
Hoo
d an
d cl
osed
sys
tem
th
en s
ent
to f
luor
ine
abso
rber
s ①
300
Su
btot
al
7,14
0
II.
Su
per
ph
osp
hat
es p
lan
t N
o.1
No
App
lica
tion
poi
nt
Cou
nte
rmea
sure
s C
ost
1 H
amm
er m
ills
(4
sets
) R
epla
cem
ent
of m
ater
ial t
o im
prov
e li
fe t
ime,
clo
sin
g sy
stem
①
400
2 R
aw m
ater
ial c
onve
yer
to b
all m
ill
Hoo
d, C
lose
d sy
stem
red
esig
n s
uck
ing
sys
tem
in o
rder
to
reco
ver
dust
②
200
3 O
re c
onta
ined
bu
lk t
o fe
ed b
all
mil
l C
lose
d sy
stem
, add
itio
n o
f du
st r
ecov
erin
g sy
stem
②
100
4 - 4
cyc
lon
es in
tegr
ated
sys
tem
an
d w
et c
yclo
nes
-
Blo
wer
s fo
r dr
yin
g(4
sets
) -
Pip
e li
ne
- A
ddit
ion
al in
stal
lati
on o
f dr
y cy
clon
e -
Upg
radi
ng
the
4 bl
ower
s ①
1,
800
5 - 6
cyc
lon
es in
tegr
ated
sys
tem
an
d du
st r
ecov
erin
g of
2 m
ills
R
edes
ign
ing
and
reva
mpi
ng
the
cycl
one
syst
em t
o im
prov
e ef
fici
ency
①
1,
800
6 M
/R P
ower
con
tain
ers
& li
fts
Clo
sed
syst
em, a
ddit
ion
of
suck
ing
syst
em
②
20
0

C-52
No
App
lica
tion
poi
nt
Cou
nte
rmea
sure
s C
ost
7 T
he
pipi
ng
for
con
veyi
ng
pow
der
to t
he
form
atio
n c
ham
ber
Hoo
d an
d cl
osed
sys
tem
②
200
8 T
he
pipi
ng
for
M/R
fee
din
g H
ood,
clo
sed
syst
em
②
20
0 9
Hig
h p
ress
ure
blo
wer
s an
d pr
oces
s pi
pe f
or b
all m
ill
Clo
sed
syst
em a
nd
repl
acem
ent
of p
ipe
lin
e ①
100
10
R/M
rec
eivi
ng
poin
t of
con
veye
r fr
om s
crew
400
h
ood
and
clos
ed s
yste
m
②
20
0
11
Bal
l mil
l sys
tem
R
epla
cem
ent
of m
ater
ial t
o im
prov
e li
fe t
ime,
clo
sin
g sy
stem
①
400
12
Flu
orin
e ab
sorp
tion
sys
tem
A
ddit
ion
of
new
abs
orbe
rs o
r ej
ecto
rs
③
20
0 13
F
luor
ine
gas
suck
ing
Blo
wer
R
epla
cem
ent
of n
ew a
ppro
pria
te b
low
er
③
20
0 14
C
ircu
lati
on p
um
p
Add
itio
n o
f n
ew a
bsor
ptio
n p
um
p an
d n
ew s
pray
ers
③
10
0 15
H
2SiF
6 n
eutr
aliz
atio
n s
yste
m
- R
evam
pin
g ex
isti
ng
faci
liti
es
- In
stal
lati
on o
f n
ew s
edim
enta
tion
pon
d
- pH
au
tom
atic
con
trol
sys
tem
for
W.W
-
Inst
alla
tion
of
alar
m s
yste
m
③
15
0 ③
200
③
10
0 ③
50
16
Rec
over
ing
of f
luor
ine
gas
on
prod
uct
con
veye
rs
Hoo
d an
d cl
osed
sys
tem
th
en s
ent
to f
luor
ine
abso
rber
s ①
300
17
Dis
char
ge p
oin
ts o
f li
fts
Hoo
d an
d cl
osed
sys
tem
②
200
Su
btot
al
7,10
0

C-53
III.
H2S
O4 p
lan
t N
o. 2
No
App
lica
tion
poi
nt
Cou
nte
rmea
sure
s C
ost
1 P
erio
dica
l dis
char
ge p
oin
ts o
f hig
h
pH W
.W
- In
stal
lati
on o
f co
nta
iner
-
Pu
mp
and
pipi
ng
syst
em
③
200
③
6
00
Su
btot
al
800
Tot
al
15,0
40
Rem
ark
s:①
Pro
cess
Im
prov
emen
t (C
P)
;②In
trod
uct
ion
of
New
Fac
ilit
y (C
P)
;③E
OP

C-54
6. Suggestions for industrial pollution prevention
6.1 Short-term countermeasures
6.1.1 Keep the inside of the factory clean through the introduction of some
improvement activities like 5S.
6.1.2 In order to introduce cleaner production, the management needs to have
discussion and debate, not only with people in the production section, but also
other sections as well. Management needs to take the lead in changing employee
attitudes toward operating methods and the importance of maintenance.
6.1.3 Establish statistical process systems for collecting and analyzing data.
6.1.4 Exchange information with domestic companies in the same industry to
improve international competitiveness.
6.1.5 Since the value of SS and BOD5 in wastewater exceeds the standard, they
need to take countermeasures to fix this problem as soon as possible. They need to
examine the applicability of separation or utilization of biological treatment, after
verifying the cause and discharge conditions of SS and BOD5.
6.1.6 In order to improve sedimentation, the flow rate of wastewater in the
drainage canal need to be reduced.
6.1.7 Utilize steam collected at sulfuric acid plant effectively.
6.2 Mid-term countermeasures
6.2.1 Apply for ISO9000 in the near future.
6.3 Action plans
Figure 6 shows the action plan for industrial pollution prevention measures.
The company is expected to follow the schedule and take countermeasures for
improvement.

C-55
Pro
ject
/Act
ivit
y 20
00
2001
20
02
2003
20
04
2005
1
. M
an
age
men
t (1
) A
pply
ing
5S,
‘Kai
zen
’ ac
tivi
ty t
o w
hol
e co
mpa
ny
(2)
App
lyin
g st
atis
tica
l m
eth
od
in
data
tr
eatm
ent
(3)
Hav
ing
inte
rnal
tec
hn
ical
mee
tin
gs i
n
the
com
pan
y (4
) E
stab
lish
ing
a co
oper
ativ
e sy
stem
am
ong
com
pan
ies
hav
ing
sam
e pr
odu
ctio
n
lin
es
(5)
App
lyin
g IS
O 9
000
(6)
App
lyin
g IS
O14
000
2.P
roce
ss I
mp
rove
men
t (C
P)
(1)
Upg
radi
ng
exis
tin
g sy
stem
for
bot
h
Su
perp
hos
phat
e pl
ant
3.In
trod
uct
ion
of
New
Fac
ilit
y (C
P)
(1)
Clo
sed
syst
em
for
both
S
upe
rph
ospa
te
plan
t
4.S
tren
gth
enin
g E
OP
(1
) F
luor
ine
abso
rpti
on s
yste
m f
or b
oth
S
upe
rph
osph
ate
plan
t (2
) W
aste
wat
er n
eutr
aliz
atio
n s
yste
m f
or b
oth
Su
perp
hos
phat
e pl
ant
(3)
No.
2 H
2SO
4 pl
ant
- S
endi
ng
syst
em f
or h
igh
pH
was
tew
ater
to
su
perp
hos
phat
e pl
ant
Fig
ure
6
Act
ion
Pla
n (
2000
to
2005
)

C-56
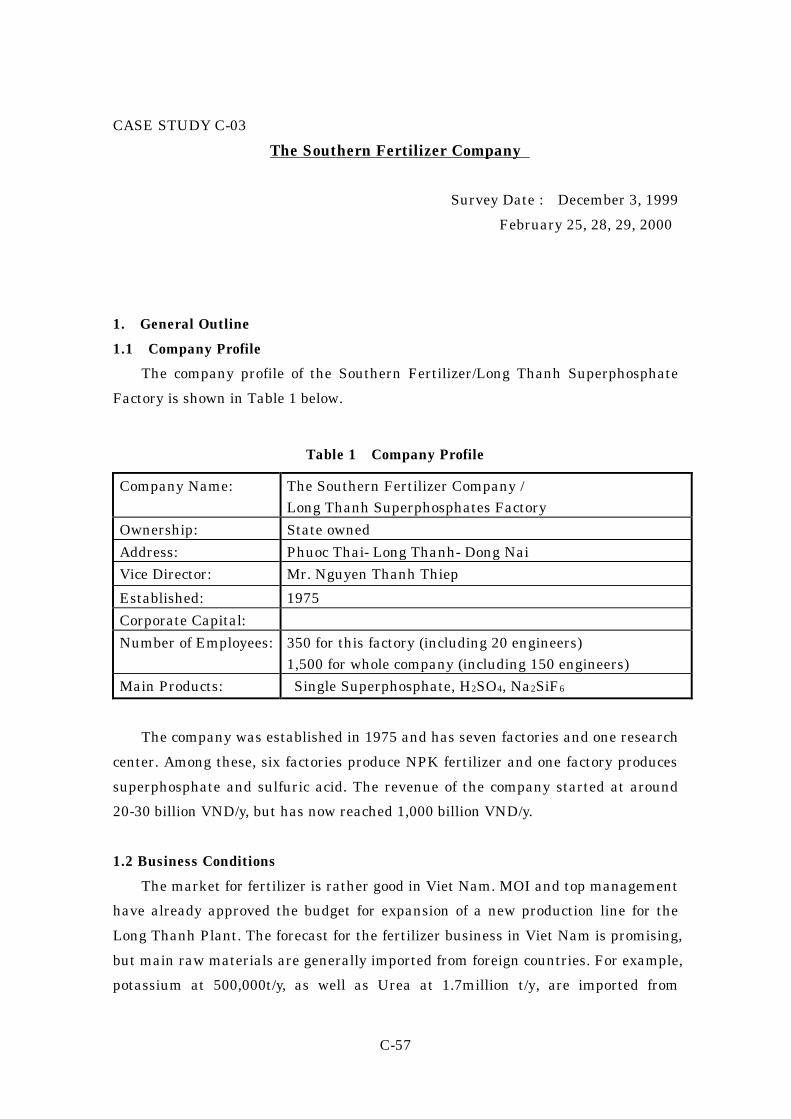
C-57
CASE STUDY C-03
The Southern Fertilizer Company
Survey Date : December 3, 1999
February 25, 28, 29, 2000
1. General Outline
1.1 Company Profile
The company profile of the Southern Fertilizer/Long Thanh Superphosphate
Factory is shown in Table 1 below.
Table 1 Company Profile
Company Name: The Southern Fertilizer Company / Long Thanh Superphosphates Factory
Ownership: State owned
Address: Phuoc Thai- Long Thanh- Dong Nai
Vice Director: Mr. Nguyen Thanh Thiep
Established: 1975
Corporate Capital:
Number of Employees: 350 for this factory (including 20 engineers) 1,500 for whole company (including 150 engineers)
Main Products: Single Superphosphate, H2SO4, Na2SiF6
The company was established in 1975 and has seven factories and one research
center. Among these, six factories produce NPK fertilizer and one factory produces
superphosphate and sulfuric acid. The revenue of the company started at around
20-30 billion VND/y, but has now reached 1,000 billion VND/y.
1.2 Business Conditions
The market for fertilizer is rather good in Viet Nam. MOI and top management
have already approved the budget for expansion of a new production line for the
Long Thanh Plant. The forecast for the fertilizer business in Viet Nam is promising,
but main raw materials are generally imported from foreign countries. For example,
potassium at 500,000t/y, as well as Urea at 1.7million t/y, are imported from

C-58
Canada. Sulfur and DAP at 600,000t/y are also imported from foreign countries. In
the past, even NPK was imported, but now the production capacity of NPK
fertilizer has reached very high levels in Viet Nam. Sulfur is imported from Canada
for the raw materials needed for sulfuric acid. The company has no sulfur recovery
system for exhaust gas.
The Southern Fertilizer company is involved in the following joint venture
factories:
1. A JV with Nissho Iwai Corp. and Central Glass Co., Ltd. ( 30 % of the shares
are held by the Southern Fertilizer Co.,) : NPK fertilizer 300,000t/y.
2. A JV with Mitsui Chemical Corporation ( 70% of the shares are held by the
company ) : NPK fertilizer 500,000t/y.
3. A JV with a Korean company : DOP, PVC ( 300,000t/y ).
(1) Production
The superphosphate plant was installed in 1988 and a full production line was
completed in 1991. The capacity of the main products are as follows:
Superphosphate in 1 plant ; 100,000 t/y
Sulfuric acid in 2 plants ; 40,000 t/y
Future projects related to production expansion are as follows:
One superphosphate plant with a capacity of 200,000 t/y has been designed by
CECO, and a Taiwanese engineering company has been ordered to oversee the
construction of the plant, which is estimated to begin in September, 2000.
The company is also, planning for a new sulfuric acid plant. The plant will
adopt it’s technology from a Taiwanese Company and it have a capacity of 40,000
t/y. Design work for the plant, which will take six months, was scheduled to be
completed by June, 2000. However, because of procedural difficulties that hindered
the start of the project, the completion of the design work will take between 1-2
months longer than expected. Construction of the plant itself will take 12 months
and is scheduled for completion around July or August in 2001.

C-59
Actual annual production and revenues are shown in Table 2.
Table 2 Actual Production and Annual Revenue in 1998
Product Capacity Production Revenue (x1000VND) Single Superphosphate 100,000 t 100,063 t 85,762,848 Sulfuric Acid 40,000 t 35,196 t 5,654,719
(2) Debt
2. Production Technology
2.1 Process
(1) General
The production technology and facilities of the existing plant in this factory
utilize domestic technology and the company commented that the level of this
technology is rather old. As for environmental preservation technology, the new
process they have for the removal of SO2 in exhaust gas has brought about a
decrease, from 1,600mg/m3 to 500mg/m3, in the SO2 level in the exhaust gas and
also, helped decrease energy use in the sulfur plant by 20%.
(2) Sulfuric Acid Production Technology
Figure 1, which shows the sulfuric acid production process, was made following
the documents we received from the company.
As can be readily realized by observing Figure 1, the company is utilizing
imported sulfur (recovered sulfur-99.45% purity) from Canada as a raw material.
Following this, in cases where they are using pyrite as a raw material, because
there are no different gas refining processes, no wastewater, and no solid waste
either, it can be assumed that there are not many major problems. In addition, the
oxidation rate of SO2 to SO3 is 98%, the absorption rate for sulfuric acid is 99.9%,
and the conversion rate from sulfur to sulfuric acid is between 98.3% to 98.6%.
Moreover, the company is not adopting the double contact method for the
conversion machine that converts SO2 to SO3, and in addition, they do not
have sulfur recovery equipment.

C-60
11,755 t
V2O5 Catalyst
To Superphosphate Production
Figure 1 Sulfuric Acid Production Process
(3) Superphosphate Production Technology
Figure 2, the superphosphate production process, was constructed following
documents received from the company. The company uses apatite made in Lao Cai
Province, which is situated close to the national border with China, as a raw
material. From the production region it is carried by railway to Hyphon, then from
there it is transported by ship. One “lot” is between 5-10 tons per ship, and apatite
is loaded at about a one ship per month pace. Because of this fact, the company
carries out quality checks. The results of these checks, which were indicated in the
documents we received from the company, are listed in Table 3.
SO2 → SO3 Converter
SO3 → H2SO4 Water
Product Cooling Cooling
Water Pond
Mixing & Cooling
H2SO4
(98%)
H2SO4
(76%)
Solid S
Liquid S Combustion
Waste Gas
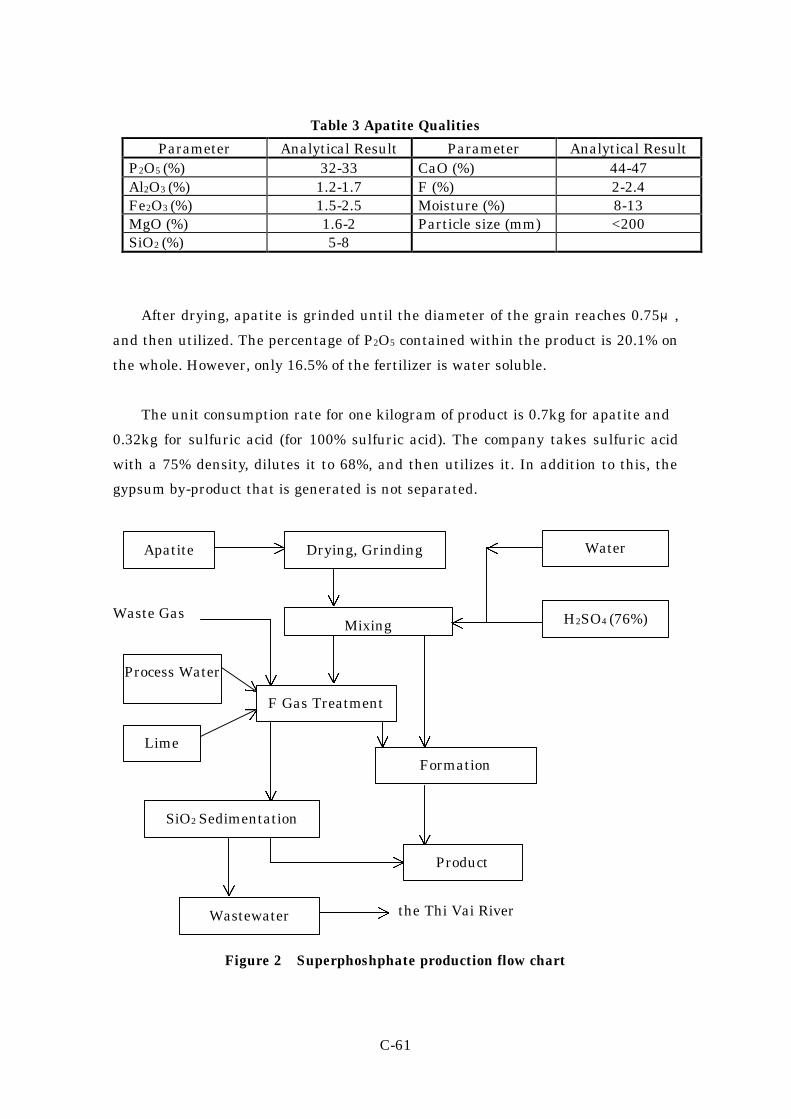
C-61
Table 3 Apatite Qualities
Parameter Analytical Result Parameter Analytical Result P2O5 (%) 32-33 CaO (%) 44-47 Al2O3 (%) 1.2-1.7 F (%) 2-2.4 Fe2O3 (%) 1.5-2.5 Moisture (%) 8-13 MgO (%) 1.6-2 Particle size (mm) <200 SiO2 (%) 5-8
After drying, apatite is grinded until the diameter of the grain reaches 0.75μ,
and then utilized. The percentage of P2O5 contained within the product is 20.1% on
the whole. However, only 16.5% of the fertilizer is water soluble.
The unit consumption rate for one kilogram of product is 0.7kg for apatite and
0.32kg for sulfuric acid (for 100% sulfuric acid). The company takes sulfuric acid
with a 75% density, dilutes it to 68%, and then utilizes it. In addition to this, the
gypsum by-product that is generated is not separated.
Waste Gas
the Thi Vai River
Figure 2 Superphoshphate production flow chart
Apatite Drying, Grinding
Mixing H2SO4 (76%)
Water
F Gas Treatment
Process Water
Lime
Formation
Product
Wastewater
SiO2 Sedimentation

C-62
2.2 Wastewater Sources
Environmental pollution is one of the problems facing the entire region around
the company. Even at this company there are three important environmental
pollution problems. These problems are listed below:
(1) Wastewater from two different kinds of factories.
(2) SO2 and SO3 exhaust gas.
(3) Dust generated in the apatite grinding process.
Recently, from 1997 through 1998, MOI and MOSTE made investments in dust
collecting equipment for superphosphate plants. However, because of various
problems such as corroding equipment, these machines are not operating effectively.
In the case of superphosphates, wet, cyclone-type dust collecting equipment is
thought to be the only type of equipment that is valid for use.
The SO2 removal facilities developed by the Viet Nam Polytechnique
University use a Mg(OH)2 solution for absorption, and sulfur is recovered and sent
to a sulfuric acid plant. However, the project is not complete at present because of
financial problems.
For industrial wastewater, only the superphosphate fertilizer plant discharges
wastewater at a volume of 15 m3/hr. Two sulfuric acid plants do not discharge
wastewater. Recycled cooling water, at a volume of 500m3/hr, flows through a
cooling water pond that has a capacity of 6,000m3. The wastewater from the
superphosphate plant is treated in a sedimentation pond and, depending on the
case, is occasionally neutralized with calcium hydroxide.
However, they have no continuous neutralization treatment equipment and
there are cases where very acidic wastewater with a pH of around 2.0 is discharged
into the Thi Vai River. We were told that wastewater analysis for pH only are
performed every day. However, the results of the pH measurements have seemingly
not been put to good use.
Supply water is drawn from a deep well in the factory for industrial and
domestic use.
The irrigation wastewater system and sampling points are shown in Figure 3.

C-63
Well Water
③
15m3/h ⑤
④
15m3/h ②
①
40m3/h
⑥
Wastewater from other 2 companies
To the Thi Vai River
Figure 3 Irrigation Wastewater System and Sampling Points
3. Management
3.1 General
From a general observation, the management of the factory seems rather good
because the factory site, facilities and equipment are well maintained.
3.2 Raw Material and Utility Consumption
Raw material consumption and utility consumption in 1998 are shown in Table
4.
3.3 P205 Balance
If a trial calculation of P2O5 loss in 1998 is made using the total production of
apatite in 1998, shown in Table 2, and the total consumption of apatite in 1998,
shown in Table 4, the result are the figures shown in Table 5, and the loss rate
comes to 10.3%.
Superphosphate Plant
(Washing Water) Sedimentation Tank
H2SO4 Plant
(Cooling Water) Pond
Domestic Use

C-64
Table 4 Raw Material and Utility Consumption in 1998
Material Used Amount Cost Single Superphosphate Apatite (32%) H2SO4 (100%) Steel Ball CaO Industrial Water Commercial Water Fuel Oil Electricity
0.7 t
0.3218 t 0.15 kg
3kg 0.65 m3 0.6 m3 9.35 l/t 28 kwh
614,760 VND/t 540,625 VND/t 12,000 VND/t 630 VND/kg
1,600 VND/l 770 VND/kwh
Sulfuric Acid Sulfur Water Filter Agent Catalyst CaO Diesel Oil Electricity Na2CO3 Industrial Water Additional Water for Circulating Water System Soft Water
0.334 t 0.06 kg 0.15 l 1 kg
0.45 kg 85 kwh 0.3 kg 1.8 m3 30 m3
1.5 m3
1,040 VND/kg 19.050 VND/kg 82,000 VND/l 630 VND/kg
3,800 VND/kg 770 VND/kwh 2,300 VND/kg
8,000 VND/m3
Table 5 Trial Calculation of P2O5 Loss
Item Amount of P2O5 Production (t/y) 100,063 -- Superphosphate P2O5 Content (%) 20.1 20,113t/y Consumption (t/y) 70,044 -- Apataite P2O5 Content(%) 32 22,414t/y
Loss of P2O5 -- -- 2,301.4t/y
Phosphate lost in wastewater is calculated following the analysis results in
Table 8.
The premise for the trial calculation is just as it appears in Table 6.
Table 6 Premise for the Trial Calculation of P2O5 Loss Item Premise Note
Volume of wastewater 15m3/h See Fig.3 Operation hours per day 16h/d Operation days per year 330d/y T-P content 114mg/l See Table 9
(Sampling Point 4) Molecular weight of P2O5 142
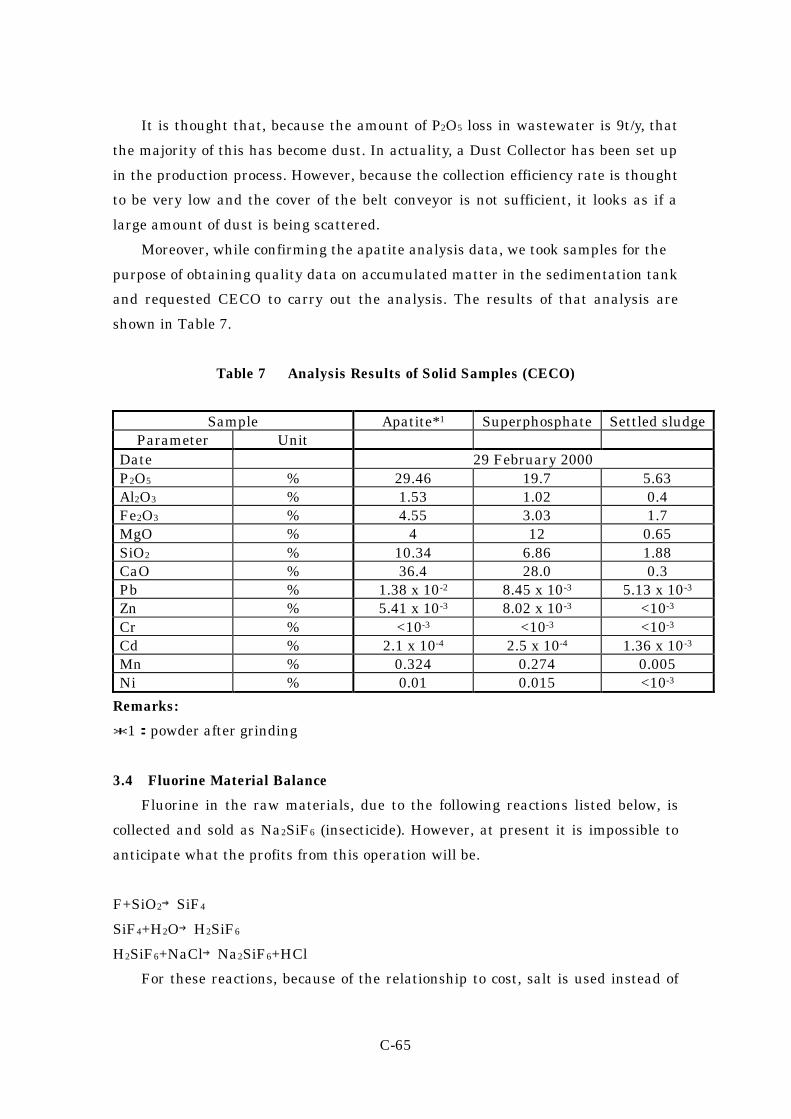
C-65
It is thought that, because the amount of P2O5 loss in wastewater is 9t/y, that
the majority of this has become dust. In actuality, a Dust Collector has been set up
in the production process. However, because the collection efficiency rate is thought
to be very low and the cover of the belt conveyor is not sufficient, it looks as if a
large amount of dust is being scattered.
Moreover, while confirming the apatite analysis data, we took samples for the
purpose of obtaining quality data on accumulated matter in the sedimentation tank
and requested CECO to carry out the analysis. The results of that analysis are
shown in Table 7.
Table 7 Analysis Results of Solid Samples (CECO)
Sample Apatite*1 Superphosphate Settled sludge Parameter Unit
Date 29 February 2000 P2O5 % 29.46 19.7 5.63 Al2O3 % 1.53 1.02 0.4 Fe2O3 % 4.55 3.03 1.7 MgO % 4 12 0.65 SiO2 % 10.34 6.86 1.88 CaO % 36.4 28.0 0.3 Pb % 1.38 x 10⁻² 8.45 x 10⁻³ 5.13 x 10⁻³ Zn % 5.41 x 10⁻³ 8.02 x 10⁻³ <10-3 Cr % <10-3 <10-3 <10-3 Cd % 2.1 x 10⁻⁴ 2.5 x 10⁻⁴ 1.36 x 10⁻³ Mn % 0.324 0.274 0.005 Ni % 0.01 0.015 <10-3
Remarks:
*1:powder after grinding
3.4 Fluorine Material Balance
Fluorine in the raw materials, due to the following reactions listed below, is
collected and sold as Na2SiF6 (insecticide). However, at present it is impossible to
anticipate what the profits from this operation will be.
F+SiO2→SiF4
SiF4+H2O→H2SiF6
H2SiF6+NaCl→Na2SiF6+HCl
For these reactions, because of the relationship to cost, salt is used instead of

C-66
caustic soda and a hydrochloric acid by-product is produced as a result.
Making a trial calculation of fluorine balance in 1998 using the composition of
fluorine in apatite, 2%, and the volume of fluorine in wastewater (Table 9-Sampling
Point No. 4), 15.72mg/l, the following figures results:
The composition of fluorine in apatite: 1,400 kg/y
The composition of fluorine in the wastewater: 1,243 kg/y
From these results it can be supposed that the majority of the fluorine is
leaking into the wastewater.
4. Industrial Wastewater Treatment and Discharge
4.1 Wastewater Qualities
4.1.1 Samples taken on December 3, 1999
Sampling point numbers and the content of samples are shown in Table 8. The
results of measurements taken with a simple analyzing device are shown in Table
9, and the analysis results of the water qualities of the samples taken
simultaneously by CECO are shown in Table 9.
Table 8 Sampling Points and Content of Samples
Sampling Point Sample Content
1
Cooling water (taken from the pond) (the day before sampling, because of some kind of trouble, the pH level was low. Because of this we took another sample at ②)
2
Cooling water (Taken from the water channel that sends water from the process to the pond)
3 Well-water 4 Precipitation Tank Discharge Point 5
Wash water at the discharge point from the process exhaust gas washing process
6
(Precipitation tank intake wastewater) Drained water into the Thi Vai River (Taken at the drainage point in to the Thi Vai River)

C-67
Table 9 Water Quality Analysis Results (CECO)
Sampling Point 1 2 3 Parameter Unit
Time 11:15 11:25 Temp. ℃ 37 34.5 pH 3.6 6.3 Conductivity mS/㎝ 2.94 0.24 Turbidity NTU 16 4 Oil content mg/l 3 <0.01 BOD5 mg/l 16 5 COD mg/l 32 8.6 DO mg/l 5.2 7.0 SS mg/l 43 15 T-nitrogen mg/l 4.37 3.1 CN mg/l 0.093 <0.001 Phenol mg/l 0.002 0.001 Residual Cl mg/l 0.08 0.68 SO4 mg/l 118.4 25 T-P mg/l 42.2 0.07 Fe mg/l 2.37 7.8 F mg/l 3.7 0.009
Sampling Point 4 5 6 Parameter Unit
Time 11:30 11:45 12:04 Temp. ℃ 31 33 31.5 pH 2.3 1.4 2.7 Conductivity mS/cm 17.17 65.5 4.5 Turbidity NTU 590 2,320 68 Oil content mg/l 1.3 1.5 0.9 BOD5 mg/l 18 69 144 COD mg/l 24 132 316 DO mg/l 6.2 5.2 5.4 SS mg/l 467 5,128 255 T-nitrogen mg/l 14.51 8.58 6.24 CN mg/l 0.018 0.017 0.028 Phenol mg/l 0.01 0.005 0.001 Residual Cl mg/l 0.00 0.05 0.04 SO4 mg/l 110 328 146 T-P mg/l 114 119 64 Fe mg/l 7.65 8.91 8.2 F mg/l 15.72 16.07 3.72
Ther was some samall trouble at the plant on the day before we visited and pH
control was inappropriate, so pH value at sampling point No.1 is very low.
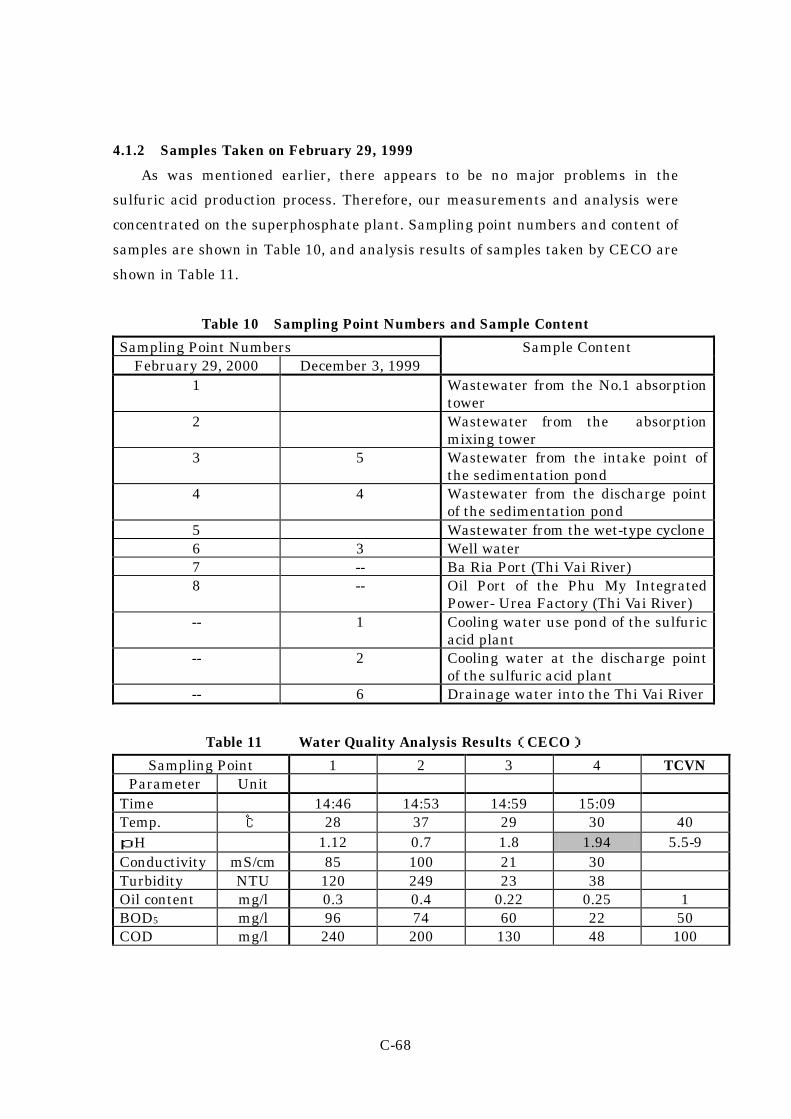
C-68
4.1.2 Samples Taken on February 29, 1999
As was mentioned earlier, there appears to be no major problems in the
sulfuric acid production process. Therefore, our measurements and analysis were
concentrated on the superphosphate plant. Sampling point numbers and content of
samples are shown in Table 10, and analysis results of samples taken by CECO are
shown in Table 11.
Table 10 Sampling Point Numbers and Sample Content
Sampling Point Numbers February 29, 2000 December 3, 1999
Sample Content
1 Wastewater from the No.1 absorption tower
2 Wastewater from the absorption mixing tower
3 5 Wastewater from the intake point of the sedimentation pond
4 4 Wastewater from the discharge point of the sedimentation pond
5 Wastewater from the wet-type cyclone 6 3 Well water 7 -- Ba Ria Port (Thi Vai River) 8 -- Oil Port of the Phu My Integrated
Power- Urea Factory (Thi Vai River) -- 1 Cooling water use pond of the sulfuric
acid plant -- 2 Cooling water at the discharge point
of the sulfuric acid plant -- 6 Drainage water into the Thi Vai River
Table 11 Water Quality Analysis Results(CECO)
Sampling Point 1 2 3 4 TCVN Parameter Unit
Time 14:46 14:53 14:59 15:09 Temp. ℃ 28 37 29 30 40 pH 1.12 0.7 1.8 1.94 5.5-9 Conductivity mS/cm 85 100 21 30 Turbidity NTU 120 249 23 38 Oil content mg/l 0.3 0.4 0.22 0.25 1 BOD5 mg/l 96 74 60 22 50 COD mg/l 240 200 130 48 100

C-69
Sampling Point 1 2 3 4 TCVN Parameter Unit
DO mg/l 4.7 0.7 4.1 3.7 SS mg/l 567 810 123 30 100 T-nitrogen mg/l 3.2 3.0 3.0 3.5 60 CN mg/l 0.31 0.069 0.001 0.001 0.1 Phenol mg/l 0.02 0.02 0.025 0.025 0.05 Residual Cl mg/l 0.25 1.21 0.09 0.1 2 SO4 mg/l 925 950 250 200 T-P mg/l 0.92 0.38 0.32 1.58 6 Fe mg/l 9.12 7.52 6.75 5.16 5 F mg/l 7.375 4.875 5.875 6.25 2
Sampling Point 5 6 7 8 Parameter Unit
Time 13:18 15:31 16:20 16:55 Temp. ℃ 33 27 29.8 29.3 pH 3.89 4.75 7.2 7.34 Conductivity mS/cm 2.7 0.1 0.35 0.47 Turbidity NTU 22 0 15 9 Oil content mg/l 0.3 0.00 0.1 0.14 BOD5 mg/l 370 9 140 124 COD mg/l 1,120 19.6 276 264 DO mg/l 4.4 5 4.7 4.5 SS mg/l 478 2 10 13 T-nitrogen mg/l 3.5 2.6 5.9 8.6 CN mg/l 0.012 <0.001 0.001 0.002 Phenol mg/l 0.03 0.001 <0.001 0.001 Residual Cl mg/l 0.37 0.10 0.07 0.08 SO4 mg/l 425 1 240 112 T-P mg/l 2.56 0.01 0.03 0.04 Fe mg/l 7.3 4.7 0.21 0.14 F mg/l 4.75 0.06 1.65 4.5
4.2 Industrial Wastewater Standards
Vietnam industrial wastewater standards (B rank) are shown in Table 12.
When the standard numbers are compared with numbers of the measurements of
analysis results taken at sampling point number 4, shown in Table 10, on
December 3, 1999, as well as the measurements of the analysis results taken on
February 29, 2000 at sampling point number 4, shown in Table 12, just as they
have been shaded in the tables:
① In the analysis results for Table 9, pH, SS, total phosphates, iron, as well as the

C-70
density of fluorine compounds are exceeding the standard values.
② In the analysis results for Table 11, pH, fluorine compounds, as well as iron
density, are exceeding the standard values, and SS, as well as total phosphate
density, are satisfying the standards.
5. Countermeasures for Improvement and there Estimated Costs
5.1 Production Technology Improvement Policy
(1) Sulfuric Acid Plant Improvement Policy
It appears as if there are no major problem areas that need to be improved.
(2) Improvement Policy for P2O5 Loss at the Superphosphate Plant
As was mentioned earlier in Section 3.3, due to the low collecting efficiency
rate of the Dust Collector and the insufficiency of the cover on one portion of the
conveyor belt, a significant amount of phosphate is leaking out. Because of this,
and according to a trial calculation, a 10% loss is anticipated. Following this, a
thorough dust prevention policy, improvement of operating methods, and thorough
conservation are required.
(3) Improvement of Fluorine Loss in the Superphosphate Plant
As was mentioned earlier in Section 3.4, there has been a depression in the
amount of Na2SiF6 produced as an insecticide, and almost all of the fluorine is
being lost. Because of this, the amount of absorption water going to the absorption
tower, and the number of spray nozzles in use need to be increased. At the same
time, in the long run, they must find a valid use for hydrogen fluoride, other than
as an insecticide.
Short-term improvement measures that can be raised at this time include,
establishing an absorption tower and a ventury scrubber facility, as well as
utilizing alkaline solution as an absorbent . After elucidating the nature of the
fluorine ion in the wastewater, and because of the reaction that occurs when it is
made to react with calcium ion, it is necessary for them to generate and separate
insoluble salt. In this case as well, pH control will become an important factor.
5.2 Improvement in Management Technology
The company needs to adopt improvement activities such as 5S activities, hold

C-71
company wide meetings at fixed intervals regarding technical problems and the
like, execute statistical control of data, as well as make other improvements. At the
same time, in order to increase international competitiveness, it is also necessary
for them to have periodic information exchanges with domestic companies in the
same industry and execute mutual inspections.
Because of the fact that the pH level is especially low in the well water, which
is the source of the irrigation water, it is assumed that it is necessary for the
irrigation water to be treated.
5.3 Wastewater Treatment Improvement
As was mentioned earlier in Section 4.2, because it is exceeding the
wastewater standards for numerous items, wastewater control needs to be
strengthened for water volume, water quality, the drainage canal, and the like. In
order to execute pH control and operation control of the sedimentation tank, and
carry-out periodic removal of accumulated matter in the sedimentation tank, it is
necessary for them to make improvements in equipment control, and construct a
new sedimentation tank.
5.4 An Estimation of Countermeasure Costs
In order to execute the above listed three improvement items, which came
about as a result of discussions between experts from the Ministry of Industry,
survey team members, as well as the company, we requested an estimated
calculation of the outline of the costs from the company. This outline was delivered
via the Ministry of Industry to the survey team members and is shown in Table 12.
The general, total cost of these countermeasures is 10,000,000,000 VND.

C-72
Tab
le 1
3
Est
imat
ion
Cos
ts f
or C
oun
term
easu
es
Mil
lion
VN
D
No
App
lica
tion
Poi
nt
Cou
nte
rmea
sure
s C
ost
1 W
ell w
ater
for
all
pu
rpos
es
Inst
alla
tion
of
a n
ew t
reat
men
t sy
stem
to
deal
wit
h
acid
ic s
itu
atio
n
③
1,50
0
2 D
ust
leak
age
from
wh
ole
Su
perp
hos
phat
es o
pera
tion
lin
e.
Hoo
d, c
lose
d sy
stem
for
pip
ing,
dry
er, m
ill,
cycl
one,
con
veye
rs, b
low
ers.
.. to
rec
over
raw
mat
eria
l in
th
e fo
rm
of d
ust
. Th
e lo
st e
stim
atio
n o
f R
/M is
aro
un
d 4-
7%
②
1,00
0
3 F
luor
ine
abso
rpti
on s
yste
m
Rev
ampi
ng
and
upg
radi
ng
equ
ipm
ent
to im
prov
e
prod
uct
ivit
y an
d fl
uor
ine
abso
rpti
on e
ffic
ien
cy
③
2,00
0
4 W
aste
wat
er
Inst
alla
tion
of
new
W/w
tre
atm
ent
③
1,50
0
5 M
ain
equ
ipm
ent
Upg
radi
ng
equ
ipm
ent
con
side
red
as a
ppli
cati
on o
f
Cle
aner
pro
duct
ion
to
impr
ovem
ent
envi
ron
men
tal
situ
atio
n
①
2,00
0
6 S
tore
hou
ses
Exp
ansi
on a
nd
upg
radi
ng
of s
tore
hou
se
③
2,00
0
Tot
al
10,0
00
Rem
ark
s:①
Pro
cess
Im
prov
emen
t (C
P);
②In
trod
uct
ion
of
New
Fac
ilit
y (C
P)
;③E
OP
C-73
6. Recommendations for Pollution Prevention
6.1 Short-term Countermeasures
(1) With top management as the initiating force, activities like 5S and other
improvement activities need to be implemented.
(2) Carry-out data control using statistical methods.
(3) Hold periodic, company-wide meetings concerning technical problems and the
like.
(4) In order to increase international competitiveness, execute periodic information
exchange sessions and mutual inspections with domestic companies in the same
industry.
(5) In order to avoid corrosion of machines made of carbon steel in the sulfuric acid
plant, the pH problem in the re-cooling water pond needs to be improved
immediately.
6.2 Mid-term Countermeasures
(1) Install a pond in front of the sedimentation tank for neutralization treatment,
and at the same time, it would be desirable for them to execute suitable
environmental control by continuously measuring pH values.
(2) After installing wastewater treatment facilities, in order to effectively remove
heavy metals from the sedimentation tank, improvement in operations is also
necessary. It is especially important to maintain and control pH values at the most
suitable level.
(3) In the near future, it would be desirable for the company to obtain the ISO 9000
qualification. In order to do this, production equipment and the inside of the
factory must be organized and cleaning must be thoroughly carried out. At the
same time, it is necessary that document system organization for production data,
product quality data and the like be carried out.
6.3 Action Plan
The action plan concerning industrial pollution prevention policies is shown in
Figure 4. It is expected that the company will follow this schedule and execute
these improvement measures.

C-74
Pro
ject
/Act
ivit
y 20
00
2001
20
02
2003
20
04
2005
1
. M
an
age
men
t (1
) A
pply
ing
5S, “
Kai
zen
” to
wh
ole
com
pan
y (2
) A
pply
ing
stat
isti
cal
trea
tmen
t sy
stem
to
all
data
tre
atm
ent
syst
ems
(3)
Hav
ing
inte
rnal
te
chn
ical
m
eeti
ngs
in
th
e co
mpa
ny
(4)
Est
abli
shin
g a
coop
erat
ive
syst
em
amon
g co
mpa
nie
s h
avin
g sa
me
prod
uct
ion
li
nes
(5
) A
pply
ing
ISO
9000
(6
) A
pply
ing
ISO
1400
0
2.P
roce
ss I
mp
rove
men
t (C
P)
(1)
Upg
radi
ng
mai
n e
quip
men
t
3.In
trod
uct
ion
Of
New
Fac
ilit
y (C
P)
(1)
Cou
nte
rmea
sure
s fo
r du
st le
akag
e in
su
perp
hos
phat
e pl
ant
4.S
tren
gth
enin
g E
OP
(1
) In
stal
lati
on o
f n
ew t
reat
men
t sy
stem
for
w
ell w
ater
(2
) F
luor
ine
abso
rpti
on
syst
em
in
supe
rph
osph
ate
plan
t (3
) In
stal
lati
on n
ew w
aste
wat
er s
yste
m
(4)
Exp
ansi
on a
nd
upg
radi
ng
of s
tore
hou
se
Fig
ure
4
Act
ion
Pla
n (
2000
to
2005
)
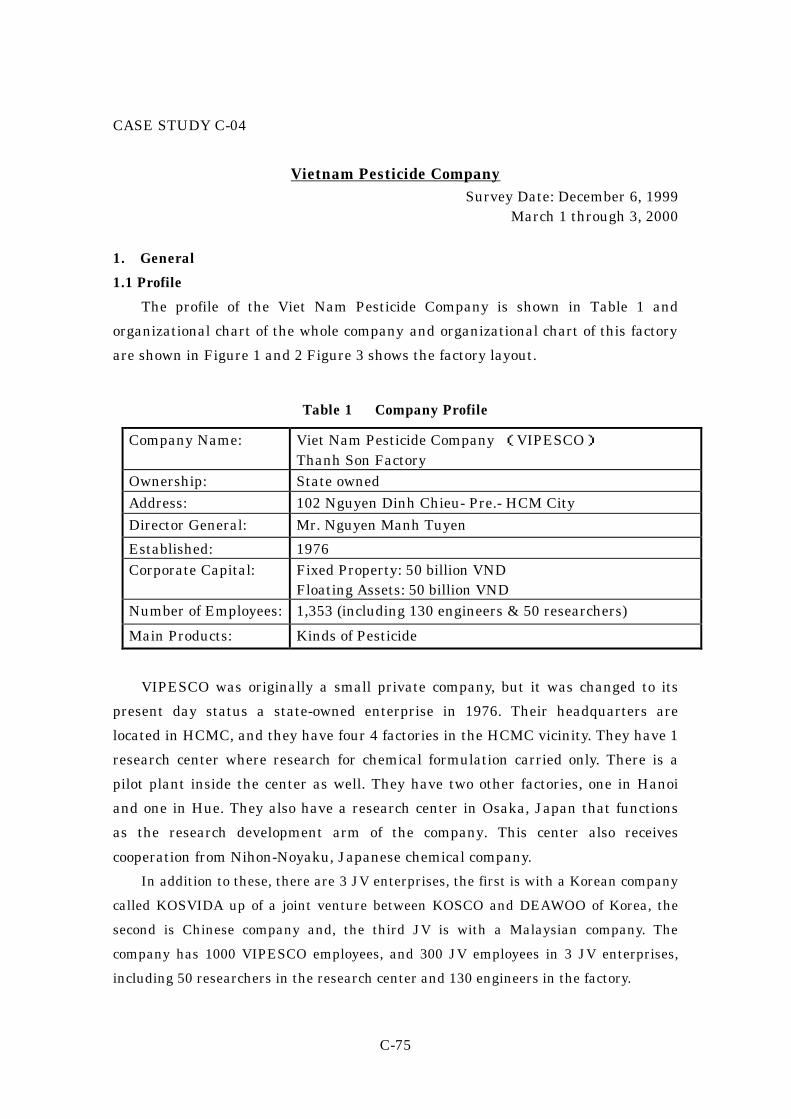
C-75
CASE STUDY C-04
Vietnam Pesticide Company Survey Date: December 6, 1999
March 1 through 3, 2000 1. General
1.1 Profile
The profile of the Viet Nam Pesticide Company is shown in Table 1 and
organizational chart of the whole company and organizational chart of this factory
are shown in Figure 1 and 2 Figure 3 shows the factory layout.
Table 1 Company Profile
Company Name: Viet Nam Pesticide Company (VIPESCO) Thanh Son Factory
Ownership: State owned Address: 102 Nguyen Dinh Chieu- Pre.- HCM City
Director General: Mr. Nguyen Manh Tuyen
Established: 1976 Corporate Capital: Fixed Property: 50 billion VND
Floating Assets: 50 billion VND Number of Employees: 1,353 (including 130 engineers & 50 researchers)
Main Products: Kinds of Pesticide
VIPESCO was originally a small private company, but it was changed to its
present day status a state-owned enterprise in 1976. Their headquarters are
located in HCMC, and they have four 4 factories in the HCMC vicinity. They have 1
research center where research for chemical formulation carried only. There is a
pilot plant inside the center as well. They have two other factories, one in Hanoi
and one in Hue. They also have a research center in Osaka, Japan that functions
as the research development arm of the company. This center also receives
cooperation from Nihon-Noyaku, Japanese chemical company.
In addition to these, there are 3 JV enterprises, the first is with a Korean company
called KOSVIDA up of a joint venture between KOSCO and DEAWOO of Korea, the
second is Chinese company and, the third JV is with a Malaysian company. The
company has 1000 VIPESCO employees, and 300 JV employees in 3 JV enterprises,
including 50 researchers in the research center and 130 engineers in the factory.

C-76
BO
M,
JV
Com
pan
y
Hea
d,
Sec
uri
ty &
Saf
ety
Gro
up
Ass
ista
nt
G. D
irec
tor
MG
R.,
Pla
nn
ing
&
Sal
es D
ept.
Dep
uty
G. D
irec
tor
(Pro
duct
ion
)
MG
R.,
En
v.
Con
trol
Dep
t.
MG
R.,
Per
son
nel
Dep
t.
MG
R.,
Adm
inis
trat
ion
Dep
t.
Dir
ecto
r,
VIP
ES
CO
Bra
nch
1
(Ha
Noi
)
Dir
ecto
r,
VIP
ES
CO
Bra
nch
2
(Hu
e)
Dir
ecto
r,
VIP
ES
CO
Bra
nch
3
(Th
anh
Son
)
Dir
ecto
r,
Pes
tici
de
Res
earc
h &
Pro
duct
ion
Cen
ter
Dir
ecto
r,
Bin
h T
rieu
Pes
tici
de
Fac
tory
Dir
ecto
r,
Tan
Th
uan
Pes
tici
de
Fac
tory
MG
R.,
Exp
ort-
Impo
rt
Dep
t.
MG
R.,
Fin
ance
&
Acc
oun
tin
g
Dep
t.
MG
R.,
QC
Dep
t.
Dep
uty
G. D
irec
tor
(Tra
din
g)
Dep
uty
G. D
irec
tor
(Per
son
nel
/Adm
inis
trat
ion
)
BO
M,
Join
t-S
tock
Com
pan
y
Rem
arks
: QC
: Qu
alit
y C
ontr
ol; E
nv.
: En
viro
nm
ent;
MG
R: M
anag
er
図1
会社
の組
織図
Fig
ure
1 E
nter
pris
e O
rgan
izat
ion
Cha
rt

C-77
Man
agem
ent
Rep
rese
nta
tive
Hea
lth
care
Off
icer
A
ccou
nta
nt
Ass
ista
nt
Lea
der,
Ele
ctri
cal-
Mec
han
ical
Tea
m
Vic
e D
irec
tor
(Pro
duct
ion
Pla
nn
ing/
Fac
tory
Pla
nn
ing
Hea
d
QC
Off
icer
,
Bra
nch
3
Fac
tory
Lab
or
Hea
d
Vic
e D
irec
tor
(Mac
hin
ery,
En
viro
nm
ent,
Saf
ety)
Gu
ard
Lea
der
MC
E E
ngi
nee
r
Mat
eria
l
Acc
oun
t
Mat
eria
l Off
icer
Bra
nch
3
Dri
ver
San
itar
y
Off
icer
Gu
ard
Acc
oun
tan
t
Mec
han
ical
Wor
ker
Ele
ctri
cal
Wor
ker
A
Lab
or &
Adm
inis
trat
ion
Ass
ista
nt
Dir
ecto
r
War
ehou
se
Kee
per
Lea
der,
San
d
Lea
der,
BA
M
Lea
der,
FU
RA
DA
N
Lea
der,
EC
Tea
m
Lea
der,
WP
Lea
der,
Tra
nsp
orta
tion
Lea
der,
Pac
kagi
ng
Wor
ker
Wor
ker
Wor
ker
Wor
ker
Wor
ker
Wor
ker
Wor
ker
A
Fig
ure
2
F
acto
ry
Rem
arks
:
QC
: Qu
alit
y C
ontr
ol
MC
E; M
ech
anic
al-C
hem
ical
-En
viro
nm
enta
l
EC
: Em
uls
ific
able
Con
cen
trat
e
WP
: Wet
tabl
e P
ower

C-78
CA
RB
OF
UR
AN
Pla
nt
(Dom
esti
c)
Pro
duct
War
ehou
se
KO
SV
IDA
Wat
er P
ond
Mat
eria
l
War
ehou
se
BA
M P
lan
t
(Pow
der)
Oil
Em
uls
ion
Pla
nt
(Liq
uid
Pes
tici
de)
For
est
Lan
d
Indu
stri
al W
aste
wat
er t
o T
reat
men
t (E
xpor
t)
CA
RB
OF
UR
AN
Pla
nt
Was
twat
er P
ond
Ric
e F
ield
KO
SV
IDA
(JV
Com
pan
y)
Res
iden
ce
Fig
ure
3
F
acto
ry L
ayou
t
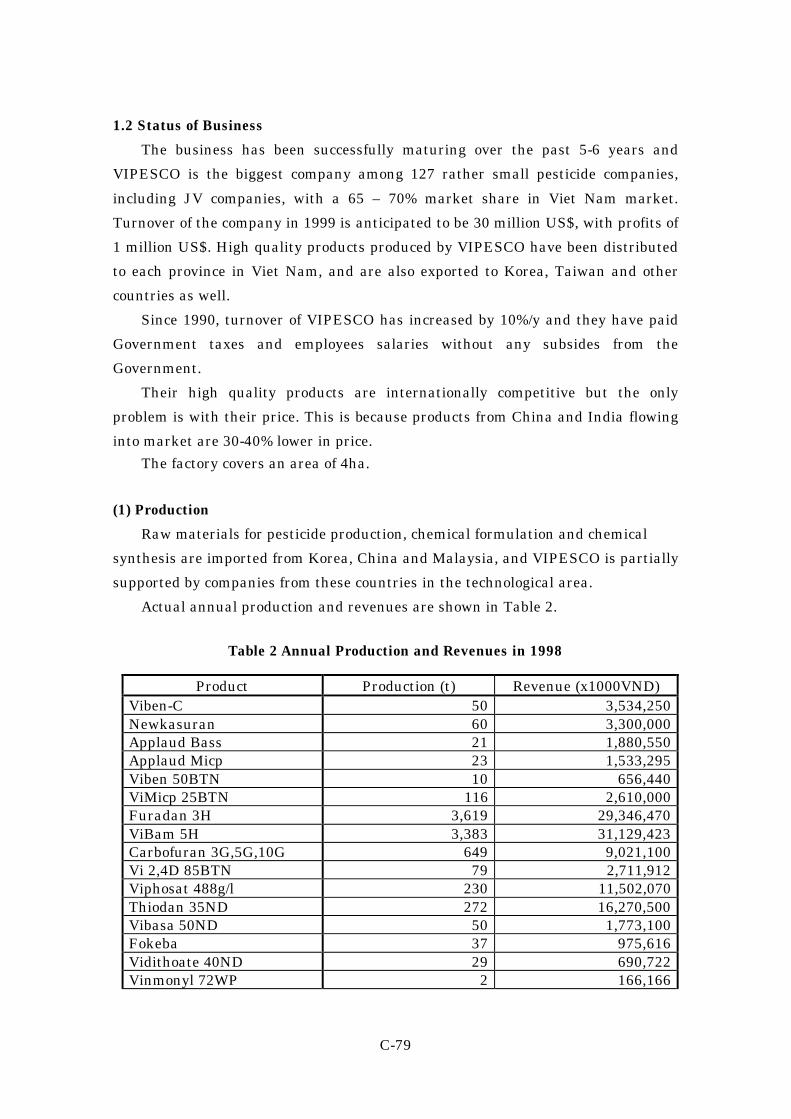
C-79
1.2 Status of Business
The business has been successfully maturing over the past 5-6 years and
VIPESCO is the biggest company among 127 rather small pesticide companies,
including JV companies, with a 65 – 70% market share in Viet Nam market.
Turnover of the company in 1999 is anticipated to be 30 million US$, with profits of
1 million US$. High quality products produced by VIPESCO have been distributed
to each province in Viet Nam, and are also exported to Korea, Taiwan and other
countries as well.
Since 1990, turnover of VIPESCO has increased by 10%/y and they have paid
Government taxes and employees salaries without any subsides from the
Government.
Their high quality products are internationally competitive but the only
problem is with their price. This is because products from China and India flowing
into market are 30-40% lower in price.
The factory covers an area of 4ha.
(1) Production
Raw materials for pesticide production, chemical formulation and chemical
synthesis are imported from Korea, China and Malaysia, and VIPESCO is partially
supported by companies from these countries in the technological area.
Actual annual production and revenues are shown in Table 2.
Table 2 Annual Production and Revenues in 1998
Product Production (t) Revenue (x1000VND)
Viben-C 50 3,534,250 Newkasuran 60 3,300,000 Applaud Bass 21 1,880,550 Applaud Micp 23 1,533,295 Viben 50BTN 10 656,440 ViMicp 25BTN 116 2,610,000 Furadan 3H 3,619 29,346,470 ViBam 5H 3,383 31,129,423 Carbofuran 3G,5G,10G 649 9,021,100 Vi 2,4D 85BTN 79 2,711,912 Viphosat 488g/l 230 11,502,070 Thiodan 35ND 272 16,270,500 Vibasa 50ND 50 1,773,100 Fokeba 37 975,616 Vidithoate 40ND 29 690,722 Vinmonyl 72WP 2 166,166
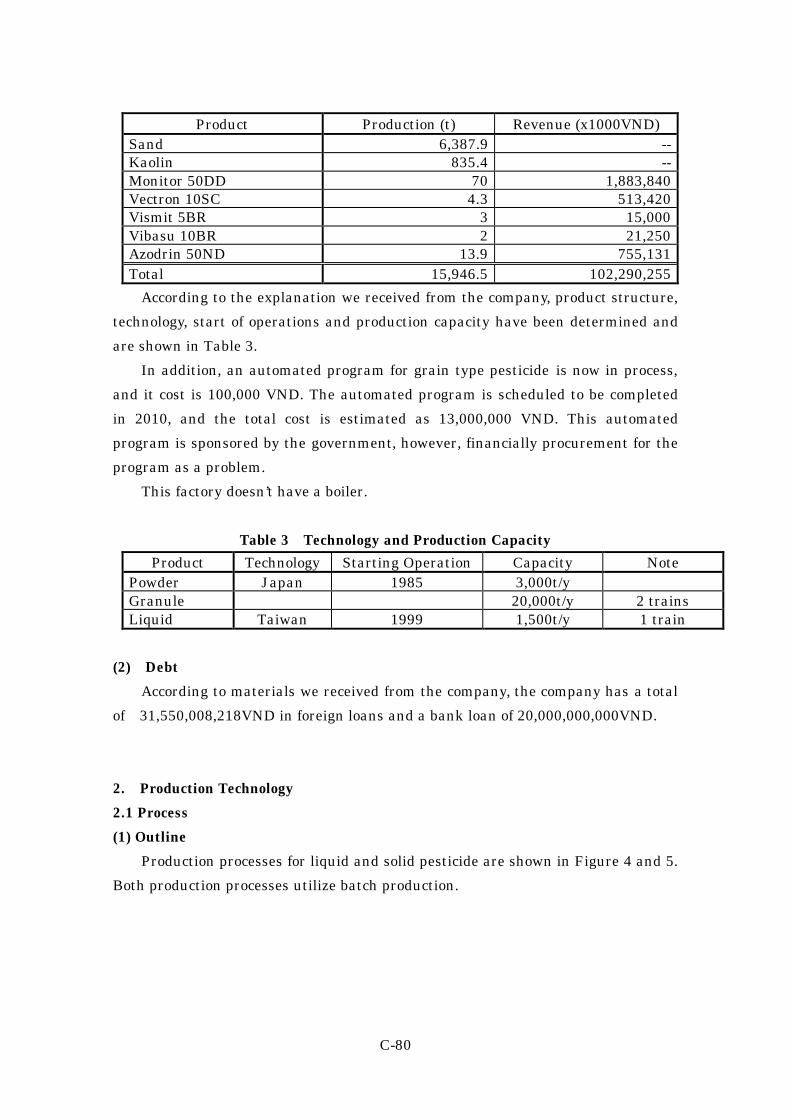
C-80
Product Production (t) Revenue (x1000VND) Sand 6,387.9 -- Kaolin 835.4 -- Monitor 50DD 70 1,883,840 Vectron 10SC 4.3 513,420 Vismit 5BR 3 15,000 Vibasu 10BR 2 21,250 Azodrin 50ND 13.9 755,131 Total 15,946.5 102,290,255
According to the explanation we received from the company, product structure,
technology, start of operations and production capacity have been determined and
are shown in Table 3.
In addition, an automated program for grain type pesticide is now in process,
and it cost is 100,000 VND. The automated program is scheduled to be completed
in 2010, and the total cost is estimated as 13,000,000 VND. This automated
program is sponsored by the government, however, financially procurement for the
program as a problem.
This factory doesn’t have a boiler.
Table 3 Technology and Production Capacity
Product Technology Starting Operation Capacity Note Powder Japan 1985 3,000t/y Granule 20,000t/y 2 trains Liquid Taiwan 1999 1,500t/y 1 train
(2) Debt
According to materials we received from the company, the company has a total
of 31,550,008,218VND in foreign loans and a bank loan of 20,000,000,000VND.
2. Production Technology
2.1 Process
(1) Outline
Production processes for liquid and solid pesticide are shown in Figure 4 and 5.
Both production processes utilize batch production.

C-81
Figure 4 Liquid Pesticide Production Process
Process Water
15m3/d
Figure 5 Solid Pesticide Production Process
Industrial Wastewater
15m3/d
Process Water
5m3/d
To KOSVIDA
Sand
2% NaOH Solution
Mixing Granulation
Drying, Screening
Packaging
Product
Wastewater
Wastewater Treatment
Adhesive Agent
Gas Scrubbing Tower
Activated Substance Additives
Dust Filter
Toxic Gas
Solvent Additive
Preparation
Product
Gas Washing Tower
2% NaOH Solution
Bottling
To the environment Wastewater Treatment ( KOSVIDA )
Activated
Substance

C-82
(2) Raw materials leakage and Countermeasures for foul odors
We examined in detail of their carbofuran facility for export production as a
representative example of all facilities. If we observe closely, leakage of raw
materials carbofuran, grain products and other products occur in 13 parts of the
process, such as the rotating part of granulating or drying machines, transport use
conveyor belts in used all processes, the packing process and the like. However,
most of the leaked materials are collected in a drum and spills on the floors are
cleaned with a vacuum cleaner and collected at the end of each shift. Floors are
washed with water once every 2 or 3 months. The loss rate in the beginning use
was 4 to 5 %, but is gradually decreased to the rate of 0.2% at present. Thus,
because we believe that this is a big problem, we don’t see any problems in raw
materials or products loss, besides the foul odors in process. Regarding the foul
odor, there are many open areas in the processes, like where raw materials are
added, and it is crucial to seal and close all the processes.
Some oil leakage was also found.
2.2 Wastewater resources
Wastewater from this factory is categorized into 2 parts, wash wastewater from
machine and floor washing, and exhaust gas wash water that contains 2% caustic
soda solution NaOH from the grain type pesticide production process.
As the use of mercury, cadmium, chrome as pesticides is banned by the law,
only manganese, zinc, lead need to be concerned with as far as heavy metals go for
the wastewater issue. The ministry of Agriculture carried out analysis on these
heavy metals and the company received proof from the ministry that these heavy
metals in the wastewater is very low.
Wastewater is sent to the nearby KOSVIDA facility and goes through activated
sludge process at a rate of 3~5m3/6 month. The pH rate of circulating water only is
checked regularly and when necessary, caustic soda is added and the water is
neutralized.

C-83
City Water
②
①
③
④
⑤
⑥
Figure 6 Water System
Since they doubled the production capacity at DOSVIDA, the activated sludge
process now full operation. The company autonomously undertook treatment
experiment activated sludge has been done, and the experiment results of this has
been disclosed.
At present, the capacity of the activated sludge process equipment in
KOSVIDA is 300m3/d, and the composed of the wastewater mixing, pH adjustment,
aeration, activated sludge treatment, sedimentation and thickener processes. The
wastewater from this factory is treated along with wastewater from KOSVIDA
with this equipment.
Treated wastewater drains into the Dong Nai River, which is one of the
tributaries of the Sai Gon River. Moreover, since the Sai Gon River is badly
contaminated with domestic and industrial wastewater, Ho Chi Min City prefers
that water from river not be used for domestic or industrial purposes. The amount
of wastewater from the dust washing process for three grain type products is
5m3/batch, 15m3/batch from the caustic soda washing process for the three grain
To the Dong Nai River
4-5m3/6month
15m3/6month
3-5m3/6month
4m3/6month
BAM Production
(Granule)
Storage Tank
Storage Tank
Storage Tank
Storage Tank
Carbofuran Production
(Granule)
for Domestic Use
Carbofuran Production
(Granule)
for Export
Liquid Product
Wastewater Treatment Facility
( KOSVIDA )

C-84
type products, as well as 15m3/batch is from the wastewater of liquid product
equipment and floor washing. The water system and sampling points areas
shown in Figure 6.
3. Management
3.1 General
Basically the management condition of the factory seems to be satisfactory and
the factory, facilities and equipment are maintained in a good, clean condition.
The company obtained the ISO9002 certificate in Dec.1999 and has already made
an application for ISO14000.
There are four problems concerning the environment and they are as follows:
(1) Dust from powder chemical products: A bug filter was installed to help protect
workers’ health.
(2) Wastewater which contains carbamate compounds: The company utilized 3
kinds of treatment utilized, a chemical type treatment, a large sedimentation
pond and biological treatment which makes use of activated sludge.
(3) A large number of toxic chemicals; Treatment is very difficult and further
investment is necessary.
(4) Foul smelling chemicals
In order to avoid environmental problems, they are in the middle of conducting
a feasibility study on the possibility of constructing a new factory in the new
industrial zone south of HCMC land moving all their HCMC area factories and
research center into it. The plan has received the approval of MOI. However, it is
estimated it will require a 10 million US$ investment, 300 hectares of land and a 6
month moving period. Another problem they are facing are expensive land rental
fees in HCMC.
3.2 Unit Consumption of Raw materials and Utility
The consumption amount of raw materials and utilities in 1998, which has
provided by the company, is shown in Table 4 and 5.

C-85
Table 4 Raw Materials Consumption (1998)
Material Used Consumption (tons) Cost (mill. VND) Activated Substance 926.00 Solvent 247.00 Sand 12,721.70 Kaolin 1,769.00 Additives 112.30 Water 36,838 Fuel Oil 87.05 Electricity (kwh) 345.800 Total 89,422.255

C-86
Tab
le5
Unit
Consu
mpti
on o
f R
aw M
ateri
als
and U
tilit
ies
and R
eve
nues
Pro
duct
Pro
duct
ion
Tota
lTota
lA
ctiv
ated
Solv
ent
San
dKao
linA
dditiv
esW
ater
FO
Ele
ctrici
tyC
ost
Rev
enue
(*1)
Sub
stan
ce(*
2)( t
)( t
)( t
)( t
)( t
)( t
)( t
)( t
)( kw
h )
(mill
. V
ND
)(m
ill. V
ND
)1
Vib
en- C
5028
.514
.57
3,1
10.5
53,5
34.2
52
New
Kas
uran
6017
.333
.19.
63,0
29.8
03,3
00.0
03
App
laud
Bas
s21
6.4
9.3
1,4
41.8
01,8
80.5
54
App
laud
Mip
c23
6.2
4.6
1,2
99.5
01,5
33.3
05
Vib
en 5
0BTN
105.
33.
71
605.
9665
6.44
6V
iMip
c 25
BTN
116
30.9
17.5
2,4
10.9
32,6
10.0
07
Fur
adan
3H
3,6
19.0
014
5.1
3,4
65.0
010
.13
26,2
19.6
029,3
46.4
78
ViB
am 5
H3,3
83.0
020
234
2,2
65.0
088
28.
810,5
44.8
013,1
29.4
29
Car
bofu
ran
3G,5
G,1
0G64
942
.90.
48,5
66.8
09,0
21.1
010
Vi 2,
4D 8
5BTN
7979
603.
80.
322,5
39.3
82,7
11.9
111
Vip
hosa
t 48
8g/l
230
153.
423
53
8,9
80.1
211,5
02.0
712
Thi
oda
n 35
ND
272
94.5
154.
323
.214,5
27.5
216,2
79.5
013
Vib
asa
50N
D50
26.3
20.2
3.5
1,6
32.9
51,7
73.1
014
Foke
ba37
9.3
1.8
742.
9694
5.61
615
Vid
itho
ate
40N
D29
12.1
14.6
2.3
734.
391
690.
722
16V
imony
l 72
WP
22.
10.
30.
214
3.32
816
6.16
617
San
d6,3
87.9
06,3
87.9
076
.695
,800
18Kao
lin83
5.4
835.
420
,000
19M
oni
tor
50D
D70
5020
1,7
43.4
91,8
83.8
420
Vectr
on 1
0SC
4.3
4.3
390.
1648
513.
4221
Vis
umit 5
BR
30.
215
.852
15
22V
ibas
a 10
BR
210
21.2
221
.25
23A
zoridi
n 50
Nd
13.9
926
3.9
0.1
721.
146
755.
131
Tota
l15
946.
518
51.8
247
1272
1.7
1769
112.
336838
87.0
5115800
89,4
22.2
6102,2
69.2
6R
emar
ks:
*1:
Pro
duct
ion
am
oun
ts o
f sa
nd
and
Lao
lin
are
incl
ude
d in
tot
al p
rodu
ctio
n.
*2:
Tot
al w
ater
con
sum
ptio
n is
incl
ude
d do
mes
tic
wat
er c
onsu
mpt
ion
.
Mat
eria
l U
sed
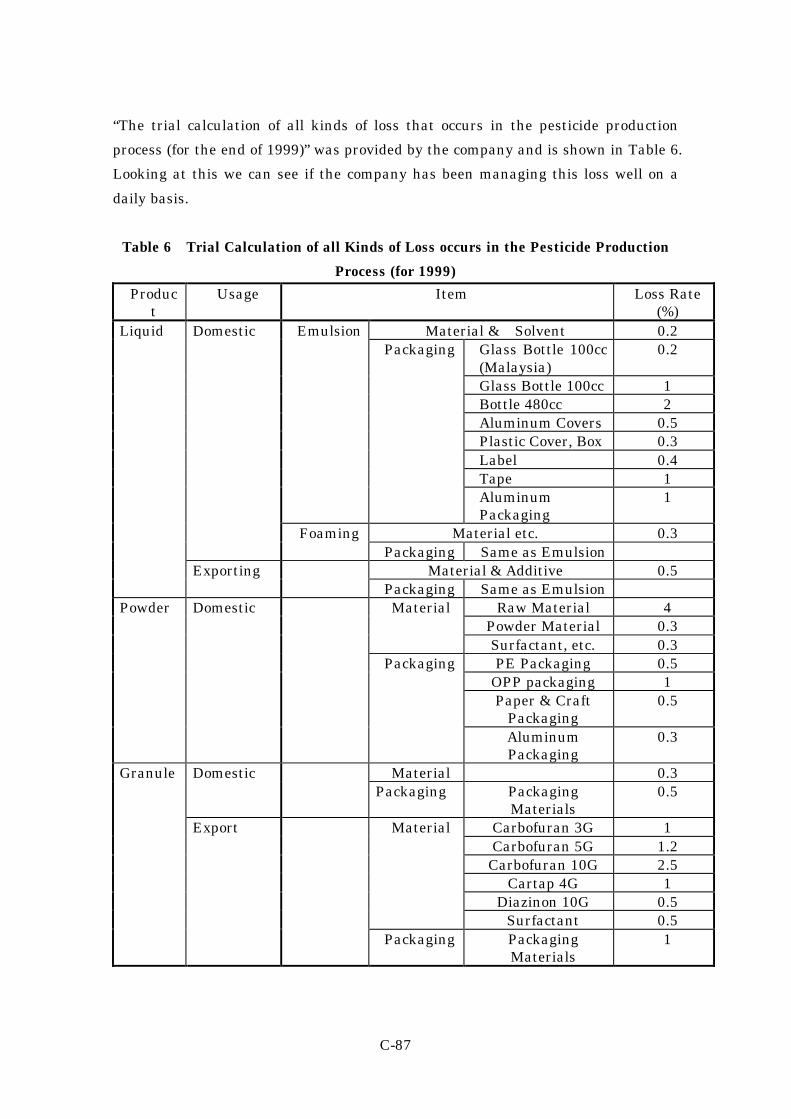
C-87
“The trial calculation of all kinds of loss that occurs in the pesticide production
process (for the end of 1999)” was provided by the company and is shown in Table 6.
Looking at this we can see if the company has been managing this loss well on a
daily basis.
Table 6 Trial Calculation of all Kinds of Loss occurs in the Pesticide Production
Process (for 1999)
Product
Usage Item Loss Rate (%)
Material & Solvent 0.2 Glass Bottle 100cc (Malaysia)
0.2
Glass Bottle 100cc 1 Bottle 480cc 2 Aluminum Covers 0.5 Plastic Cover, Box 0.3 Label 0.4 Tape 1
Emulsion Packaging
Aluminum Packaging
1
Material etc. 0.3
Domestic
Foaming Packaging Same as Emulsion
Material & Additive 0.5
Liquid
Exporting Packaging Same as Emulsion
Raw Material 4 Powder Material 0.3
Material
Surfactant, etc. 0.3 PE Packaging 0.5
OPP packaging 1 Paper & Craft
Packaging 0.5
Powder Domestic
Packaging
Aluminum Packaging
0.3
Material 0.3 Domestic Packaging Packaging
Materials 0.5
Carbofuran 3G 1 Carbofuran 5G 1.2
Carbofuran 10G 2.5 Cartap 4G 1
Diazinon 10G 0.5
Material
Surfactant 0.5
Granule
Export
Packaging Packaging Materials
1
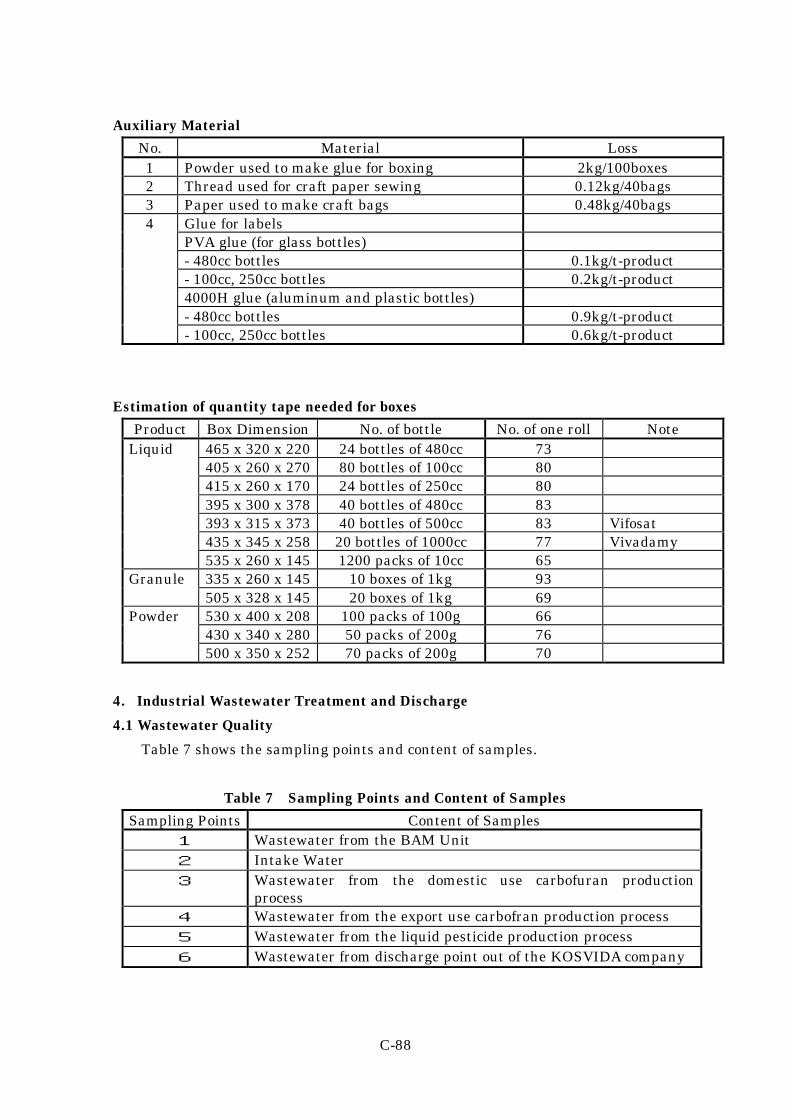
C-88
Auxiliary Material
No. Material Loss 1 Powder used to make glue for boxing 2kg/100boxes 2 Thread used for craft paper sewing 0.12kg/40bags 3 Paper used to make craft bags 0.48kg/40bags
Glue for labels PVA glue (for glass bottles) - 480cc bottles 0.1kg/t-product - 100cc, 250cc bottles 0.2kg/t-product 4000H glue (aluminum and plastic bottles) - 480cc bottles 0.9kg/t-product
4
- 100cc, 250cc bottles 0.6kg/t-product
Estimation of quantity tape needed for boxes
Product Box Dimension No. of bottle No. of one roll Note 465 x 320 x 220 24 bottles of 480cc 73 405 x 260 x 270 80 bottles of 100cc 80 415 x 260 x 170 24 bottles of 250cc 80 395 x 300 x 378 40 bottles of 480cc 83 393 x 315 x 373 40 bottles of 500cc 83 Vifosat 435 x 345 x 258 20 bottles of 1000cc 77 Vivadamy
Liquid
535 x 260 x 145 1200 packs of 10cc 65 335 x 260 x 145 10 boxes of 1kg 93 Granule 505 x 328 x 145 20 boxes of 1kg 69 530 x 400 x 208 100 packs of 100g 66 430 x 340 x 280 50 packs of 200g 76
Powder
500 x 350 x 252 70 packs of 200g 70
4. Industrial Wastewater Treatment and Discharge
4.1 Wastewater Quality
Table 7 shows the sampling points and content of samples.
Table 7 Sampling Points and Content of Samples
Sampling Points Content of Samples 1 Wastewater from the BAM Unit 2 Intake Water 3 Wastewater from the domestic use carbofuran production
process 4 Wastewater from the export use carbofran production process 5 Wastewater from the liquid pesticide production process 6 Wastewater from discharge point out of the KOSVIDA company

C-89
(1) Samples taken on Dec.6,1999
Analysis done by CECO on samples which were taken simultaneously to these
measurements is shown in Table 8.
The reasons have not been determined yet, but we can see the following
peculiar results:
①Sample 1 has a brownish-white color, sample 3 is black, and sample 4 is slightly
brown in color ②conductivity and concentration of salt is high.
Table 8 Water quality analysis results(CECO)
Sampling Point 1 2 3 Parameter Unit
Time 11:15 11:20 11:25 Temp. ℃ 26.5 27 27 pH 8.8 7.2 6.3 Conductivity mS/㎝ 5.5 0.15 18.25 Turbidity NTU 1,112 6 392 Oil content mg/l 0.21 <0.01 0.32 BOD5 mg/l 405 4 795 COD mg/l 680 8 1,680 DO mg/l 4.5 5.8 5.6 SS mg/l 3,960 1 1,620 T-nitrogen mg/l 43.37 0.68 68.02 CN mg/l 0.613 <0.001 0.386 Phenol mg/l 0.012 <0.001 0.54 Residual Cl mg/l 12.25 0.02 4.38 SO4 mg/l 1,150 5 4,000 Fe mg/l 30.63 0.05 10.75 Cr(Ⅵ) mg/l 3.37 0.001 1.0 Cu mg/l 18.75 0.01 7.625 Cd mg/l <0.001 <0.001 <0.001 Hg mg/l 0.018 <0.001 <0.001 Zn mg/l 15.77 <0.001 4.07
Sampling Point 4 5 6 Parameter Unit
Time 11:35 11:40 12:03 Temp. ℃ 26.5 26.5 31 pH 8.8 8.9 7.1 Conductivity mS/㎝ 1.56 0.59 15.39 Turbidity NTU 26 31 40 Oil content mg/l 0.25 0.37 0.19 BOD5 mg/l 162 160 193

C-90
Sampling Point 4 5 6 Parameter Unit
COD mg/l 360 360 320 DO mg/l 6.5 4.2 5.6 SS mg/l 137 160 59 T-nitrogen mg/l 8.58 34.01 12.5 CN mg/l 0.01 0.016 0.003 Phenol mg/l 0.045 0.007 0.003 Residual Cl mg/l 0.86 0.24 0.13 SO4 mg/l 164 64 131.2 Fe mg/l 1.06 0.65 0.52 Cr(Ⅵ) mg/l 0.43 0.08 0.01 Cu mg/l 1.15 0.25 0.09 Cd mg/l <0.001 <0.001 <0.001 Hg mg/l <0.001 <0.001 <0.001 Zn mg/l 1.11 <0.001 <0.001
(2) Samples taken on March. 3, 2000
Table 9 shows the results of analysis done by CECO on sample which were
taken simultaneously to the simple measurement.
The reasons are not clear yet, but we can see the following two peculiar results:
①sample 1 has yellowish-brown color, sample 3 has blackish-brown color, and
sample 4 also has a blackish-brown color.
Table 9 Water Quality Analysis Results(CECO)
Sampling Point 1 2 3 Parameter Unit
Time 9:30 9:37 9:44 Temp. ℃ 26 27 31 pH 8.61 6.7 10.3 Conductivity mS/cm 3.3 0.12 2.3 Turbidity NTU 1,324 0.0 856 Oil content mg/l 0.42 <0.01 0.45 BOD5 mg/l 602 4 659 COD mg/l 1,080 8.8 1,400 DO mg/l 2.8 4.7 2.1 SS mg/l 1,490 0.0 600 T-nitrogen mg/l 31.5 1.6 71 CN mg/l 0.196 <0.001 0.0096 Phenol mg/l 0.05 0.001 0.4 Residual Cl mg/l 5.64 1.54 2.19 SO4 mg/l 925 19 1,175 Fe mg/l 22.85 0.12 8.67 Cr mg/l 1.22 0.00 0.55

C-91
Sampling Point 1 2 3 Parameter Unit
Cu mg/l 8.58 0.00 3.2 Cd mg/l 0.0034 <0.001 0.0017 Hg mg/l 0.008 <0.001 <0.001 Zn mg/l 2.76 0.008 2.92
Sampling Point 4 5 Parameter Unit
Time 9:50 10:00 Temp. ℃ 27 28 pH 8.88 9.02 Conductivity mS/cm 1.5 0.64 Turbidity NTU 233 68 Oil content mg/l 0.25 0.29 BOD5 mg/l 211 172 COD mg/l 440 320 DO mg/l 4.6 3 SS mg/l 105 433 T-nitrogen mg/l 6.5 11.5 CN mg/l 0.019 0.016 Phenol mg/l 0.05 0.04 Residual Cl mg/l 0.87 0.4 SO4 mg/l 150 100 Fe mg/l 1.81 1.08 Cr mg/l 0.54 0.18 Cu mg/l 1.09 0.55 Cd mg/l 0.006 <0.001 Hg mg/l <0.001 <0.001 Zn mg/l 0.55 0.07
4.2 Industrial Wastewater Standards
Table 10 shows industrial wastewater standards (rank B) which apply to the
factory.
Table 10 Industrial Wastewater Standards(Rank B)
Parameter Unit Wastewater Discharge Standard
(B)
Parameter Unit Wastewater Discharge Standard
(B) Temp. ℃ 40 Mn mg/l 1
pH 5.5-9 Ni mg/l 1 BOD5 mg/l 50 Organic P mg/l 0.5 COD mg/l 100 Fe mg/l 5 SS mg/l 100 Sn mg/l 1
Mineral Oil mg/l 1 Hg mg/l 0.005
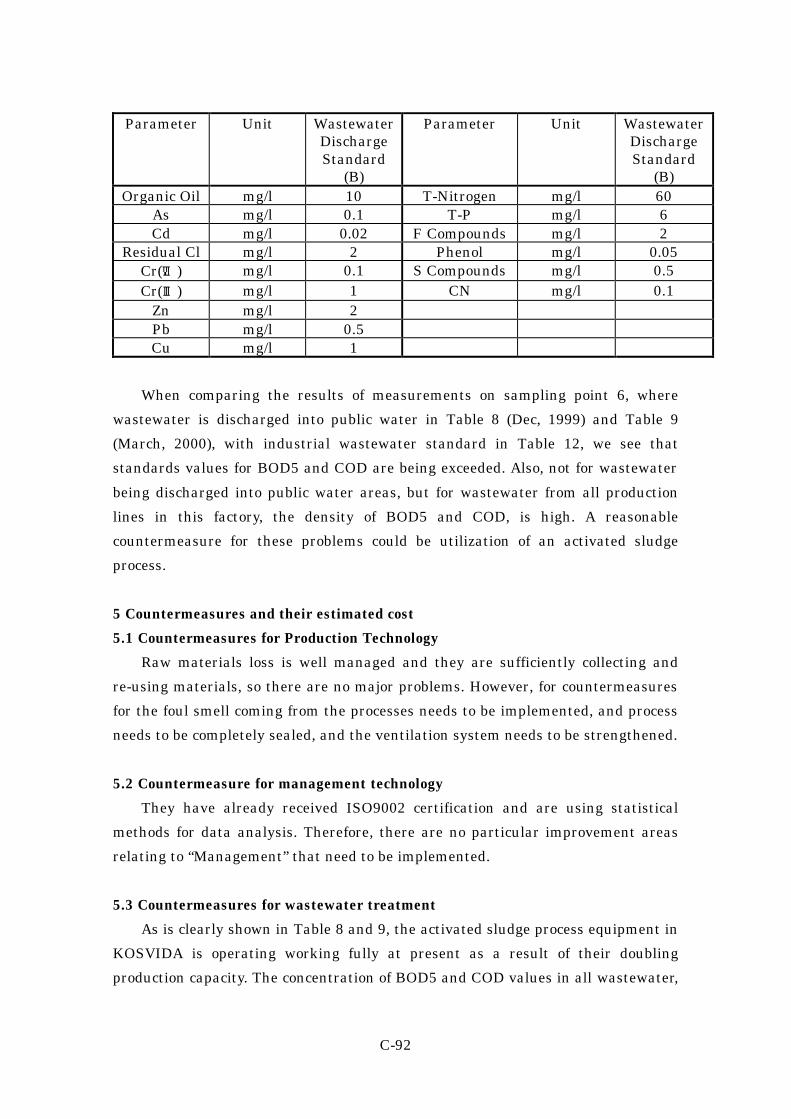
C-92
Parameter Unit Wastewater Discharge Standard
(B)
Parameter Unit Wastewater Discharge Standard
(B) Organic Oil mg/l 10 T-Nitrogen mg/l 60
As mg/l 0.1 T-P mg/l 6 Cd mg/l 0.02 F Compounds mg/l 2
Residual Cl mg/l 2 Phenol mg/l 0.05 Cr(Ⅵ) mg/l 0.1 S Compounds mg/l 0.5 Cr(Ⅲ) mg/l 1 CN mg/l 0.1
Zn mg/l 2 Pb mg/l 0.5 Cu mg/l 1
When comparing the results of measurements on sampling point 6, where
wastewater is discharged into public water in Table 8 (Dec, 1999) and Table 9
(March, 2000), with industrial wastewater standard in Table 12, we see that
standards values for BOD5 and COD are being exceeded. Also, not for wastewater
being discharged into public water areas, but for wastewater from all production
lines in this factory, the density of BOD5 and COD, is high. A reasonable
countermeasure for these problems could be utilization of an activated sludge
process.
5 Countermeasures and their estimated cost
5.1 Countermeasures for Production Technology
Raw materials loss is well managed and they are sufficiently collecting and
re-using materials, so there are no major problems. However, for countermeasures
for the foul smell coming from the processes needs to be implemented, and process
needs to be completely sealed, and the ventilation system needs to be strengthened.
5.2 Countermeasure for management technology
They have already received ISO9002 certification and are using statistical
methods for data analysis. Therefore, there are no particular improvement areas
relating to “Management” that need to be implemented.
5.3 Countermeasures for wastewater treatment
As is clearly shown in Table 8 and 9, the activated sludge process equipment in
KOSVIDA is operating working fully at present as a result of their doubling
production capacity. The concentration of BOD5 and COD values in all wastewater,

C-93
which is used as an index for organic pollutant, is high. New activated sludge
process equipment needs to be installed, and they are already examining this issue.
5.4 Estimation of Cost for countermeasures
Table 11 shows the estimated cost for countermeasures which specialists from
MOI, survey team members, and the company discussed. The company provided us
with this information via MOI. The total estimated cost is 18.8 billion VND.
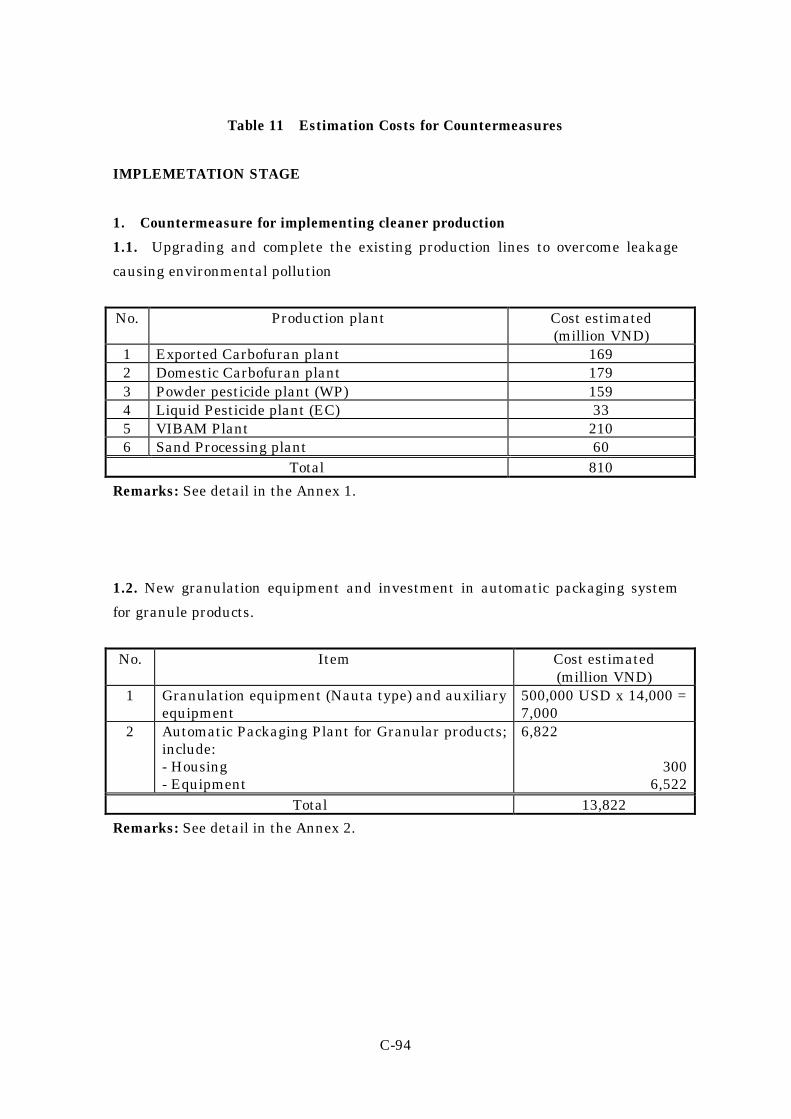
C-94
Table 11 Estimation Costs for Countermeasures
IMPLEMETATION STAGE
1. Countermeasure for implementing cleaner production
1.1. Upgrading and complete the existing production lines to overcome leakage
causing environmental pollution
No. Production plant Cost estimated (million VND)
1 Exported Carbofuran plant 169 2 Domestic Carbofuran plant 179 3 Powder pesticide plant (WP) 159 4 Liquid Pesticide plant (EC) 33 5 VIBAM Plant 210 6 Sand Processing plant 60
Total 810
Remarks: See detail in the Annex 1.
1.2. New granulation equipment and investment in automatic packaging system
for granule products.
No. Item Cost estimated (million VND)
1 Granulation equipment (Nauta type) and auxiliary equipment
500,000 USD x 14,000 = 7,000
2 Automatic Packaging Plant for Granular products; include: - Housing - Equipment
6,822
300 6,522
Total 13,822
Remarks: See detail in the Annex 2.
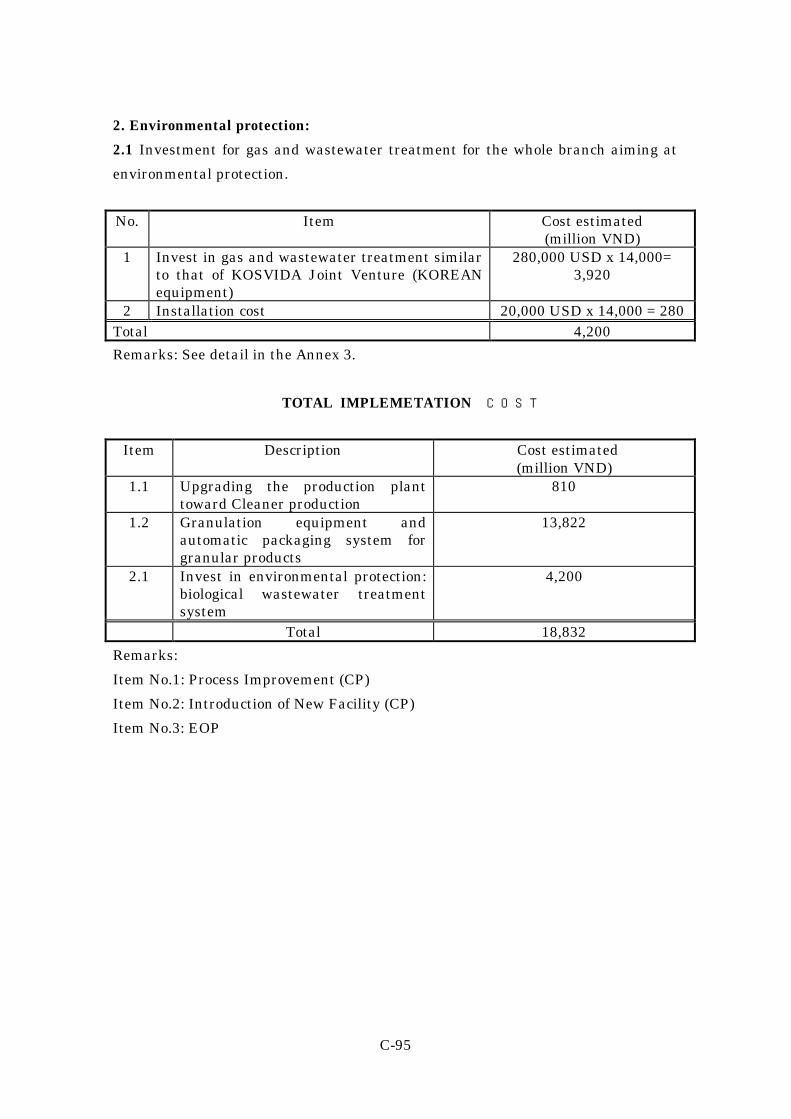
C-95
2. Environmental protection:
2.1 Investment for gas and wastewater treatment for the whole branch aiming at
environmental protection.
No. Item Cost estimated (million VND)
1 Invest in gas and wastewater treatment similar to that of KOSVIDA Joint Venture (KOREAN equipment)
280,000 USD x 14,000= 3,920
2 Installation cost 20,000 USD x 14,000 = 280 Total 4,200
Remarks: See detail in the Annex 3.
TOTAL IMPLEMETATION COST
Item Description Cost estimated (million VND)
1.1 Upgrading the production plant toward Cleaner production
810
1.2 Granulation equipment and automatic packaging system for granular products
13,822
2.1 Invest in environmental protection: biological wastewater treatment system
4,200
Total 18,832
Remarks:
Item No.1: Process Improvement (CP)
Item No.2: Introduction of New Facility (CP)
Item No.3: EOP

C-96
An
nex
1
Upg
radi
ng
prod
uct
ion
pla
nts
E
XP
OR
TIN
G C
AR
BO
FU
RA
N P
LA
NT
N
o.
Pro
blem
to
be s
olve
d C
oun
term
easu
re
Cos
t es
tim
ated
(m
illi
on V
ND
) N
otes
1 M
ater
ial l
eaka
ge in
th
e fe
edin
g ar
ea
Use
clo
se o
pera
tin
g sy
stem
20
2 M
ater
ial l
eaka
ge b
efor
e m
ixer
C
lose
d bo
x an
d su
cker
4
3
Lea
kage
of
the
inte
rmed
iate
pro
duct
aft
er m
ixer
E
ncl
osed
box
an
d su
cker
10
4 L
eaka
ge o
f se
mi p
rodu
ct a
nd
oil a
t th
e bo
ttom
lift
1
En
clos
ed b
ox
10
5
Lea
kage
of
sem
i pr
odu
ct a
nd
oil
alon
g th
e bo
dy o
f
lift
1
Rep
lace
join
t an
d ti
ghte
nin
g 10
6 L
eaka
ge o
f se
mi
prod
uct
an
d oi
l at
th
e be
gin
nin
g of
th
e co
nve
yor
bell
C
lose
sys
tem
, su
cker
an
d oi
l rec
eive
r 5
7 L
eaka
ge
of
sem
i pr
odu
ct
at
the
mid
dle
of
the
con
veyo
r be
ll
Clo
se s
yste
m f
or p
rodu
ct r
ecov
ery
5
8 L
eaka
ge o
f se
mi p
rodu
ct a
nd
oil j
ust
bef
ore
drye
r C
lose
sys
tem
, su
cker
, an
d oi
l rec
eive
r 5
9
Lea
kage
of
prod
uct
an
d oi
l at
the
bott
om o
f li
ft 2
E
ncl
osed
box
5
10
L
eaka
ge o
f th
e pr
odu
ct a
t th
e to
p of
lif
t 2
C
lose
sys
tem
an
d su
cker
5
11
L
eaka
ge o
f pr
odu
ct a
t th
e sc
reen
er
Clo
se s
yste
m a
nd
suck
er
20
12
L
eaka
ge o
f pr
odu
ct a
fter
th
e sc
reen
er
Clo
se s
yste
m a
nd
suck
er
20
13
L
eaka
ge a
t th
e pa
ckag
ing
area
C
lose
sys
tem
or
pack
agin
g m
ach
ine
50
T
otal
16
9

C-97
An
nex
1
Upg
radi
ng
prod
uct
ion
pla
nts
D
OM
ET
IC F
UR
AD
AN
PL
AN
T
No.
P
robl
em t
o be
sol
ved
Cou
nte
rmea
sure
C
ost
esti
mat
ed
(mil
lion
VN
D)
Not
es
1 M
ater
ial l
eaka
ge in
th
e fe
edin
g ar
ea
Use
clo
se o
pera
tin
g sy
stem
20
2 M
ater
ial l
eaka
ge b
efor
e m
ixer
C
lose
d bo
x an
d su
cker
4
3
Lea
kage
of
the
inte
rmed
iate
pro
duct
aft
er m
ixer
E
ncl
osed
box
an
d su
cker
20
4 L
eaka
ge o
f se
mi p
rodu
ct a
nd
oil a
t th
e bo
ttom
lift
1
En
clos
ed b
ox
10
5
Lea
kage
of
sem
i pr
odu
ct a
nd
oil
alon
g th
e bo
dy o
f
lift
1
Rep
lace
join
t an
d ti
ghte
nin
g 10
6 L
eaka
ge o
f se
mi
prod
uct
an
d oi
l at
th
e be
gin
nin
g of
th
e co
nve
yor
bell
C
lose
sys
tem
, su
cker
an
d oi
l rec
eive
r 5
7 L
eaka
ge
of
sem
i pr
odu
ct
at
the
mid
dle
of
the
con
veyo
r be
ll
Clo
se s
yste
m f
or p
rodu
ct r
ecov
ery
5
8 L
eaka
ge o
f se
mi p
rodu
ct a
nd
oil j
ust
bef
ore
drye
r C
lose
sys
tem
, su
cker
, an
d oi
l rec
eive
r 5
9
Lea
kage
of
prod
uct
an
d oi
l at
the
bott
om o
f li
ft 2
E
ncl
osed
box
5
10
L
eaka
ge o
f th
e pr
odu
ct a
t th
e to
p of
lif
t 2
C
lose
sys
tem
an
d su
cker
5
11
L
eaka
ge o
f pr
odu
ct a
t th
e sc
reen
er
Clo
se s
yste
m a
nd
suck
er
20
12
L
eaka
ge o
f pr
odu
ct a
fter
th
e sc
reen
er
Clo
se s
yste
m a
nd
suck
er
20
13
L
eaka
ge a
t th
e pa
ckag
ing
area
C
lose
sys
tem
or
pack
agin
g m
ach
ine
50
T
otal
17
9

C-98
An
nex
1
Upg
radi
ng
prod
uct
ion
pla
nts
P
OW
DE
R
PE
ST
ICID
E P
LA
NT
(W
P)
N
o.
Pro
blem
to
be s
olve
d C
oun
term
easu
re
Cos
t es
tim
ated
(m
illi
on V
ND
) N
otes
1 O
pen
m
ater
ial
tran
spor
t fa
cili
ty,
dust
an
d sm
ell
gen
erat
ed i
n t
he
tran
spor
tin
g pr
oces
s an
d f
eedi
ng
oper
atio
n
En
clos
e th
e tr
ansp
ort
faci
lity
, ad
diti
onal
su
cker
for
fee
din
g ar
ea
3
2 L
eaka
ge a
t ro
tati
ng
join
ts o
f th
e R
ibbo
n m
ixer
an
d li
ft
Clo
sed
box
, re
plac
e th
e sp
are
part
s an
d pa
ckin
g 10
3 S
mel
l ge
ner
atin
g fr
om t
he
vess
el b
ody
of t
he
Su
per
Mic
ron
Mil
l
Rep
lace
th
e ve
ssel
, en
clos
e th
e le
akag
e po
int
120
4 L
eaka
ge
and
smel
l at
th
e jo
ints
an
d so
ft
pipe
(r
otat
ing
valv
e, v
ibra
tion
, etc
.) E
ncl
ose,
re
plac
e pa
ckin
g th
at
can
w
ith
stan
d vi
brat
ion
10
5 L
eaka
ge a
t th
e D
ust
fil
ter
SP
36
Rep
airi
ng
8
6 D
ust
ge
ner
ated
at
th
e pr
odu
ct
effl
uen
t po
int
(to
pack
agin
g ar
ea)
C
lose
sys
tem
, su
cker
an
d oi
l rec
eive
r 8
Tot
al
159

C-99
An
nex
1
Upg
radi
ng
prod
uct
ion
pla
nts
L
IQU
ID P
RO
DU
CT
PL
AN
T (
EC
) N
o.
Pro
blem
to
be s
olve
d C
oun
term
easu
re
Cos
t es
tim
ated
(m
illi
on V
ND
) N
otes
1 S
mel
l gen
erat
ed a
s th
e pr
odu
ct is
tra
nsf
erre
d in
th
e bo
ttle
s fr
om b
ottl
ing
area
to
capp
ing
area
Add
itio
nal
su
cker
3
2 G
as a
nd
prod
uct
leak
age
at t
he
pum
ps t
hat
use
d to
fe
ed m
ater
ial a
nd
tran
sfer
pro
duct
to
con
tain
er o
f th
e st
irri
ng
vess
el g
rou
p
Rep
lace
th
e pu
mp,
rep
lace
pac
kin
g m
ater
ial o
f th
e jo
ints
wit
h s
olve
nt
resi
stan
ce m
ater
ial
30
Tot
al
33
V
IBA
M P
LA
NT
N
o.
Pro
blem
to
be s
olve
d C
oun
term
easu
re
Cos
t es
tim
ated
(m
illi
on V
ND
) N
otes
1 D
ust
gen
erat
ion
at
the
feed
ing
area
for
san
d an
d ka
olin
C
han
ge t
he
feed
ing
syst
em (
lift
, bu
nke
r w
ith
load
cel
l, et
c.)
120
2 D
ust
gen
erat
ion
at
the
outl
et u
nde
r m
ixin
g ve
ssel
A
ddit
ion
al
suck
ing
syst
em,
incr
ease
su
ckin
g ca
paci
ty,
pres
sure
, in
stal
l du
st
cove
r
10
3 D
ust
gen
erat
ion
at
the
scre
enin
g pr
oces
s E
ncl
ose
the
scre
enin
g sy
stem
, u
pgra
din
g th
e su
ckin
g sy
stem
10
4 D
ust
gen
erat
ion
at
the
prod
uct
ou
tlet
in
to p
rodu
ct
con
tain
er a
nd
at t
he
pac
kagi
ng
area
E
ncl
osin
g th
e ou
tlet
sy
stem
, im
prov
e pa
ckag
ing
proc
ess,
use
au
tom
atic
w
eigh
tin
g, in
stal
l su
ckin
g sy
stem
70
Tot
al
210

C-100
An
nex
1
Upg
radi
ng
prod
uct
ion
pla
nts
S
AN
D P
RO
CE
SS
ING
PL
AN
T
No.
P
robl
em t
o be
sol
ved
Cou
nte
rmea
sure
C
ost
esti
mat
ed
(mil
lion
VN
D)
Not
es
1 2 3 4 5 6
Du
st in
mat
eria
l fee
din
g ar
ea
Du
st in
th
e sc
reen
ing
area
D
ust
at
the
tran
siti
on p
oin
t fr
om t
he
lift
to
the
dr
yin
g m
ach
ine
Lea
kage
fro
m t
he
Join
t pa
rts
Lea
kage
fro
m t
he
body
of
the
cen
trif
uge
pu
mp
Lea
kage
at
prod
uct
ou
tlet
Upg
radi
ng
th
e eq
uip
men
t an
d th
e
suck
ing
syst
em in
th
e pl
ant
60
Tot
al
60
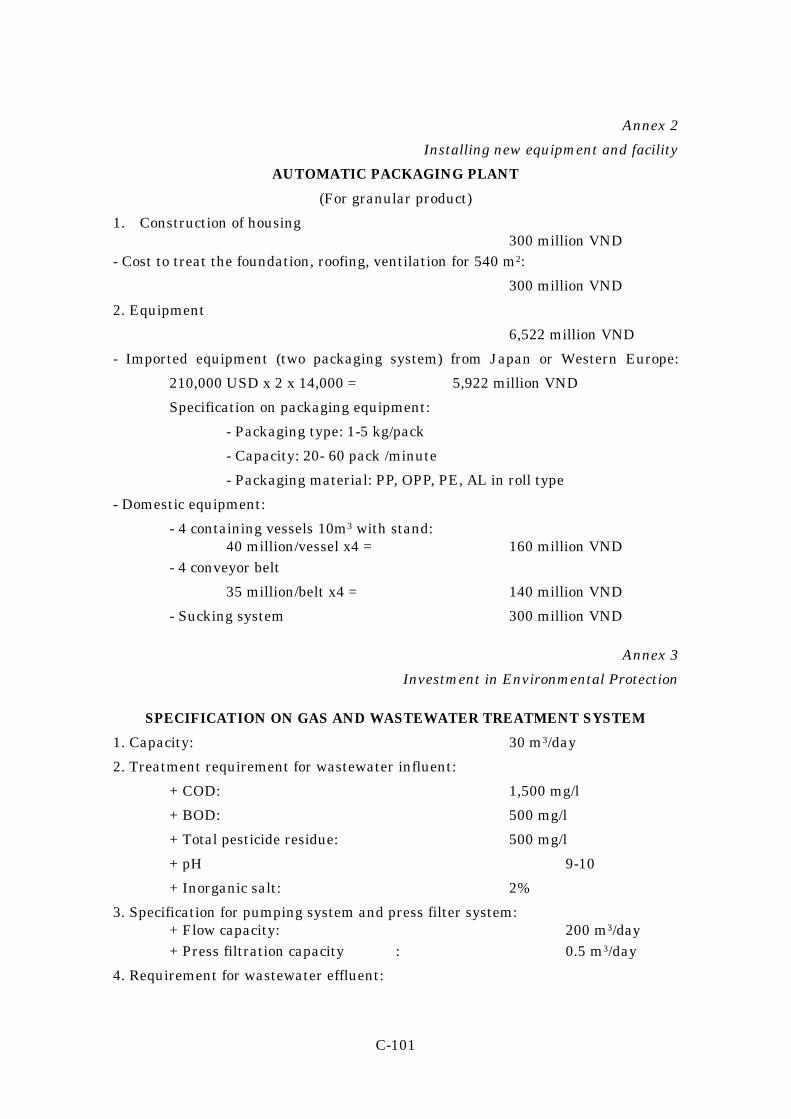
C-101
Annex 2
Installing new equipment and facility
AUTOMATIC PACKAGING PLANT
(For granular product)
1. Construction of housing 300 million VND - Cost to treat the foundation, roofing, ventilation for 540 m2:
300 million VND
2. Equipment
6,522 million VND
- Imported equipment (two packaging system) from Japan or Western Europe:
210,000 USD x 2 x 14,000 = 5,922 million VND
Specification on packaging equipment:
- Packaging type: 1-5 kg/pack
- Capacity: 20- 60 pack /minute
- Packaging material: PP, OPP, PE, AL in roll type
- Domestic equipment:
- 4 containing vessels 10m3 with stand: 40 million/vessel x4 = 160 million VND - 4 conveyor belt
35 million/belt x4 = 140 million VND
- Sucking system 300 million VND
Annex 3
Investment in Environmental Protection
SPECIFICATION ON GAS AND WASTEWATER TREATMENT SYSTEM
1. Capacity: 30 m3/day
2. Treatment requirement for wastewater influent:
+ COD: 1,500 mg/l
+ BOD: 500 mg/l
+ Total pesticide residue: 500 mg/l
+ pH 9-10
+ Inorganic salt: 2%
3. Specification for pumping system and press filter system: + Flow capacity: 200 m3/day + Press filtration capacity : 0.5 m3/day
4. Requirement for wastewater effluent:

C-102
+ Meet standard level B according to TCVN 5945 - 1985.

C-103
6. Proposals for Pollution Prevention
6.1 Short Term Countermeasures
Conduct more frequent, autonomous, periodical checks on wastewater to
strengthen environmental management. (At present, there is an inspection of
wastewater by the authorities every 6 months.)
6.2 Mid and Long Term Countermeasures
After obtaining the ISO9000 certificate, the company should prepare an
application for ISO 14000. In order to do so, they need to enforce cleaning and
organization inside of the factory, and consolidate and organize environmentally
related documents.
6.3 Action Plan
Figure 7 shows the action plan for industrial pollution prevention measures.
The company is expected to follow the schedule and take the necessary
improvements.

C-104
Pro
ject
/Act
ivit
y 20
00
2001
20
02
2003
20
04
2005
1
. M
an
age
men
t (1
) G
etti
ng
the
cert
ific
ate
for
ISO
1400
0
2.
Pro
cess
Im
pro
vem
ent
(CP
) (1
) U
pgra
din
g al
l pro
duct
ion
lin
es
3.
Intr
odu
ctio
n o
f N
ew F
acil
ity
(CP
) (1
)Gra
nu
lati
on e
quip
men
t &
au
tom
atic
pack
age
syst
em f
or g
ran
ula
r pr
odu
cts
4.
Str
engt
hen
ing
EO
P
(1)I
nst
alla
tion
of
acti
vate
d sl
udg
e sy
stem
Fig
ure
7
Act
ion
Pla
n (
2000
to
2005
)

C-105
CASE STUDY C-05
Ha Bac Nitrozennous Fertilizer and Chemical Company Survey Date : November 19, 1999
1. General
1.1 Profile
Ha Bac Fertilizer & Chemical Company belongs to VINACHEM(Viet Nam
Chemical Corporation) . The factory profile is summarized in Table 1.
Table 1 Company Profile
Company Name: Ha Bac Nitrogenous Fertilizer & Chemical Company
Ownership: State-owned
Address: Bac Giang Town- Bac Giang Province
Director: Mr. Hoang Van Tien
Established: 1960
Corporate Capital:
Number of Employees: 2,960 including 300 engineers
Main Products: Urea fertilizer, Liq. Ammonia, Electric Power
Production for nitrogen, oxygen, liquefied ammonia and electricity started in
1965 and urea in 1975.
1.2 Status of Business
(1) Production
Ammonia is consumed in the company and also sold to others. Craft paper is
exported to Taiwan to be used in the manufacturing of bills. Liquefied gases such
as nitrogen, oxygen, CO2, and dry ice and calcium carbonate are produced in the
factory. Bottled water, alcoholic beverages such as wine and champagne are
produced in their subsidiary company. The market for urea fertilizer and its
derivatives are very weak at present because of low prices, and the operation load
of the production plant is very low compared with its nominal capacity. The only
place that is maintaining a high operation rate is the electrical power generation
plant. The company also sells electricity to the state-owned electricity company.
There are 3 electricity generation plants, each having 6,000kwh capacity steam
turbines, and 5 boiler plants, each of which have a 35t/h capacity feed with coal
granules. The pressure of the steam is 35 atm. The production capacity of the main
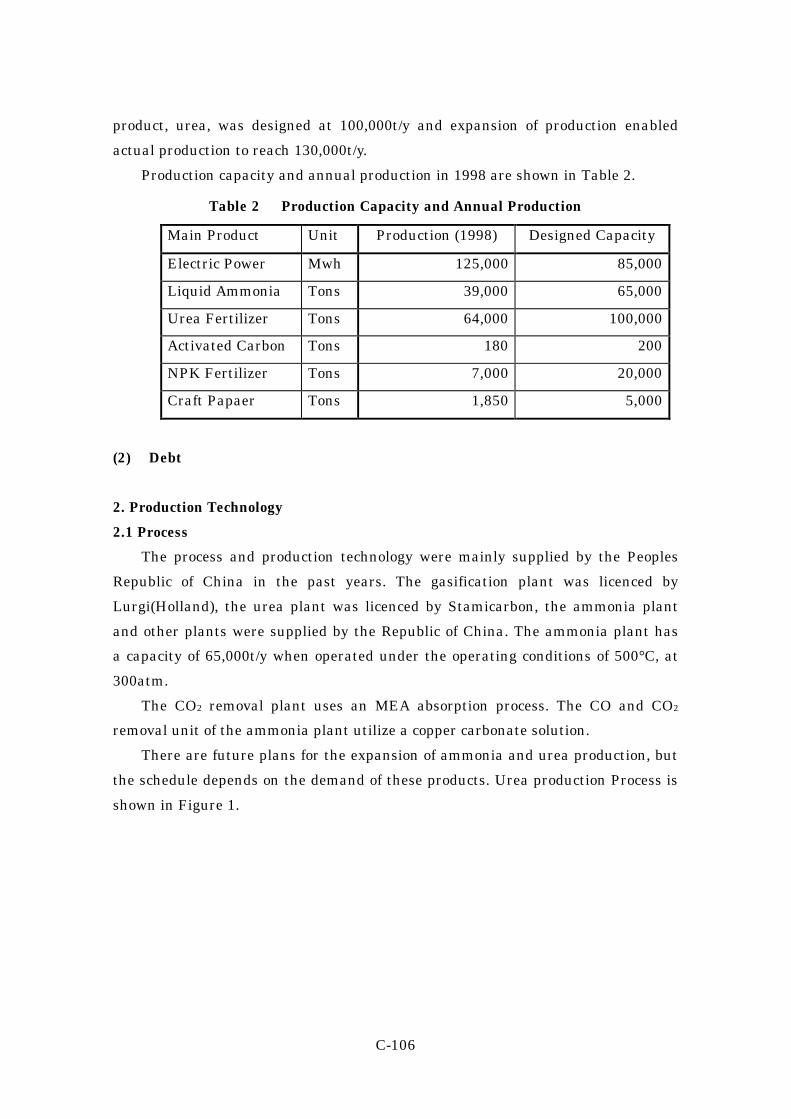
C-106
product, urea, was designed at 100,000t/y and expansion of production enabled
actual production to reach 130,000t/y.
Production capacity and annual production in 1998 are shown in Table 2.
Table 2 Production Capacity and Annual Production
Main Product Unit Production (1998) Designed Capacity
Electric Power Mwh 125,000 85,000
Liquid Ammonia Tons 39,000 65,000
Urea Fertilizer Tons 64,000 100,000
Activated Carbon Tons 180 200
NPK Fertilizer Tons 7,000 20,000
Craft Papaer Tons 1,850 5,000
(2) Debt
2. Production Technology
2.1 Process
The process and production technology were mainly supplied by the Peoples
Republic of China in the past years. The gasification plant was licenced by
Lurgi(Holland), the urea plant was licenced by Stamicarbon, the ammonia plant
and other plants were supplied by the Republic of China. The ammonia plant has
a capacity of 65,000t/y when operated under the operating conditions of 500°C, at
300atm.
The CO2 removal plant uses an MEA absorption process. The CO and CO2
removal unit of the ammonia plant utilize a copper carbonate solution.
There are future plans for the expansion of ammonia and urea production, but
the schedule depends on the demand of these products. Urea production Process is
shown in Figure 1.

C-107
Coal
Water
300 atm
Figure 1 Urea Production Process
2.2 Wastewater Source
Industrial water is drawn in from the Thuong river and the intake of water is
installed almost 1 km upstream of the factory and its outlet for waster water.
Though the nominal volume of industrial water is designed at 12,000 m3/hr,
present intake stays only at 8,000m3/hr because of the low production rate. The
present total volume of wastewater is around 7,500 to 8,000 m3/hr, including
4,000m3/hr from the urea plant which contains ammonium and shows a high pH
value. The main pollution of the wastewater comes from the exhaust of the gas
purification plant and its wastewater of 100m3/h contains cyanide ions, chlorine
ions and sulfur. Three big ponds for sedimentation have been installed and follow
one water channel with 100,000m3 capacity.
Water system and balance are shown in Figure 2.
20atm 20atm
H2,N2
CO2 compress
Compressor NH3 synthesis
H2S removal
Gasification
Urea
synthesis
Seed formation
NH3 storage Purification
Thermal
Power
Transform
Air
Coal

C-108
Thuong River
Steam
(35 atm
125t/h)
Soft Water 60m3/h
Irrigation Channel
Thuong River
Figure 2 Water System and Water Balance
3. Management
3.1 General
ISO 9000 and ISO 14000 are not applied in this company yet, but the latter is
now under the program in INEST. The factory of this company is well managed,
maintaining a clean site with no garbage in sight and has trees growing all around
it just like a factory in a forest.
3.2 Unit Consumption of Raw Materials
Unit consumption of raw materials for each product, additives and utilities
with annual consumption in 1998 are shown in Table 3.
Water Pumping Station
7,500m3/h
Power Generator
5,500m3/h
Water Treatment
2,000m3/h
Enviro-Pond Production
System
Circulation
Water
Domestic Water
Supply Station
Wastewater
Channel
Domestic Water Wastewater
Station
7,500m3/h

C-109
Table 3 Unit Consumption and Annual Consumption in 1998
Material Use Unit Consumption 1. Energy Coal-Powder Fuel Oil H2SO4 NaOH Soft Water Cooling Water Electricity
Tons Tons Tons Tons
103m3 103m3 Kwh
198,600
581 205 18
1,100 51,000 20,000
2. Ammonia Coal Electricity Steam Cooling Water MEA
Tons Mwh Tons
103m3 Tons
60,500 52,800
234,000 4,500
32 3. Urea Fertilizer Liquid Ammonia Electricity Cooling Water Uresoft-150
Tons Mwh 103m3 Tons
37,800 9,000
14,000 20
4. Industrial Wastewater Treatment and Discharge
4.1 Wastewater Quality
Aperiodical check on the wastewater is performed once every 15 days and the
results of the analysis are evaluated continuously.
The expansion of chemical wastewater treatment plant to a capacity of
40,000m3/d has been suspended because of the weakness of the market.
discharged wastewater, because flow direction changed, influenced by tides in
spite of the far distance, 70 km, from the sea.Table 4 shows sampling points.
Table 4 Sampling Points
Sample # Sampling Points 1 Wastewater from the Pond to the Canal 2 Process Water 3 Wastewater from processes 4 Wastewater from Power Plant 5 Wastewater from Urea Plant(4,000m3/h) 6 Wastewater after the Pond 7 Wastewater in the Canal 8 Outlet to the River 9 Intake Water from the River(1km upstream from the discharge point)
10 River Water ( 500m downstream from the discharge point)

C-110
The results of analysis by CECO for wastewater samples taken at the same
time as the JICA Team are shown in Table 5.
Table 5 Wastewater Quality (CECO)
Sample Point 1 2 3 4 5 Parameter Unit
Time 14:00 14:10 14:20 14:30 14:40 Temp. ℃ 39 26 32 31 59 pH 7.27 7.8 7.23 7.03 9.1 Conductivity mmS/cm 0.95 0.24 0.95 0.25 1.52 Turbidity NTU 48 10 79 1,028 11 Oil content Mg/l 0.31 0.03 0.21 0.47 0.14 BOD5 Mg/l 17 4 10 6 8 COD Mg/l 35.2 6 25.6 12.4 14.4 DO Mg/l 4.8 8.2 5.6 6.6 2.6 SS Mg/l 76 6 111 2,500 16 T-Nitrogen Mg/l 107.64 2.25 12.45 4.68 71.21 CN Mg/l 0.20 0.004 0.20 0.006 0.004 Phenol Mg/l 0.015 0.006 0.052 0.04 0.005 Residual Cl Mg/l 0.12 0.47 0.16 0 0.12 Cr (Ⅵ) Mg/l 0.03 0.05 0.01 0.03 0.001 Cu Mg/l 0.029 0.014 0.02 0.04 0.001 Fe Mg/l 0.52 0.36 0.99 0.4 0.3
Sample Point 6 7 8 9 10 Parameter Unit
Time 14:50 15:00 15:10 15:20 15:30 Temp. ℃ 31 32 32 27 26 pH 8.1 8.89 9.31 8.62 8.25 Conductivity mmS/cm 0.65 0.29 0.35 0.26 0.26 Turbidity NTU 30 17 68 22 79 Oil content Mg/l 0.27 0.33 0.2 0.04 0.16 BOD5 Mg/l 9 17.8 15.8 4 5 COD Mg/l 24 29.6 26.4 6 6.4 DO Mg/l 6.5 6.8 6.6 7.8 8.2 SS Mg/l 35 126 114 25 27 T-Nitrogen Mg/l 8.68 17.8 19.2 2.19 6.8 CN Mg/l 0.01 0.15 0.045 0.004 0.006 Phenol Mg/l 0.002 <0.001 0.001 0.007 0.012 Residual Cl Mg/l 0.13 0.22 0.13 0.56 0.39 Cr (Ⅵ) Mg/l 0.002 0.012 0.01 0.05 0.05 Cu Mg/l 0.016 0.01 0.01 0.016 0.019 Fe Mg/l 0.44 0.53 0.5 0.48 0.5
4.2 Regulation Standards
Regulation Standards for Industrial Wastewater (Rank B) in Viet Nam are
shown in Table 6.

C-111
Table 6 TCVN 5945-1995( Rank B)
Parameter Unit Wastewater Discharge Standard
(B)
Parameter Unit Wastewater Discharge Standard
(B) Temp. ℃ 40 Mn mg/l 1
pH 5.5-9 Ni mg/l 1 BOD5 mg/l 50 Organic P mg/l 0.5 COD mg/l 100 Fe mg/l 5 SS mg/l 100 Sn mg/l 1
Mineral Oil mg/l 1 Hg mg/l 0.005 Organic Oil mg/l 10 T-Nitrogen mg/l 60
As mg/l 0.1 T-P mg/l 6 Cd mg/l 0.02 F Compounds mg/l 2
Residual Cl mg/l 2 Phenol mg/l 0.05 Cr(Ⅵ) mg/l 0.1 S Compounds mg/l 0.5 Cr(Ⅲ) mg/l 1 CN mg/l 0.1
Zn mg/l 2 Pb mg/l 0.5 Cu mg/l 1
By comparison between the result of analysis shown in Table 5(Sampling Point
No.8)and Standard shown in Table 6, value for pH and SS exceed the standard.
5. Recommended Countermeasures for Improvement
5.1 Short Term Countermeasures
(1) Conduct a study to reinforce the neutralization and sedimentation process,
especially in order to decrease pH and SS.
(2) Conduct a study for the treatment and utilization of solid waste, like sludge.
5.2 Mid- Term and Long Term Countermeasures
(1) Maintain equipment against rusting through periodical effective painting.

C-112

C-113
CASE STUDY C-06
Trang Kenh Chemical & Calcium Carbide Company
Survey Date : November 22, 1999
1. General
1.1 Profile
Trang Kenh Calcium Carbide & Chemical Company is one of the national
companies under VINACHEM. The factory profile is summarized in Table 1.
Table 1 Company Profile
Company Name: Trang Kenh Calcium Carbide & Chemical Company
Ownership: State owned
Address: Minh Duc- Thuy Nguyen- Hai Phong
Director: Mr. Bui Huy Hoang
Established: 1940’s as JV sponsored by Japanese Co. (80%) and French Co. (20%) and then became a State owened company.
Corporate Capital:
Number of Employees: 273 including 15 engineers
Main Products: Calcium Carbide, Soft Calcium Carbonate
The plant for the main product, calcium carbide, has a capacity of 10,000t/y to
12,000t/y after improving the process and expanding from the original designed
capacity of 2,000t/y.
1.2 Status of Business
(1) Production
The actual production of carbide for 1998 stayed at only 2,160 t/y. The main
products of Trang Kenh Calcium Carbide & Chemical Company are calcium
carbide, acetylene, and black acetylene. The company is now planning an
investment to install a new product line using Taiwanese technology for calcium
carbonate with a capacity of 2000 t/y, and the total capacity will be 6,600 t/y in the
beginning of year 2000. The annual production and the revenues in 1998 are shown
in Table 2.

C-114
Table 2 Annual Production and Revenues in 1998
Product Unit Production Revenue (VND) Calcium Carbide Tones 2,160 7,058,445,000 Acetylene Gas m3 10,673 486,494,400 Acetylene Black Tones 21,922 4,921,650,000 Soft Powder (CaCO3) Tones -- -- Total 12,466,589,400
There was 1 electricity generating plant in the factory, but it had been already
shut down and instead, electricity is purchased from outside at the price of 730
VD/kwh. The electricity cost share is almost 60% of the total production cost, and
cost improvement is an urgent issue for the company. The factory has an annual
maintenance from Nov. 20, 1999 to Dec. 20, 1999 and as no plant was in operation
today, the production condition could not be evaluated. The plant was said to be
scheduled for operation from the beginning of the new year, 2000.
(2) Debt
2. Production Technology
2.1 Process
The production technology and original plant for calcium carbide were supplied
by the Denka Corporation of Japan, and even now the business relationship
between them and Denka corp. still exists and they cooperate to exchange
information on calcium carbide production.
Calcium carbide, Acetylene, and Acetylene Black production processes are
shown Figure 1,2, and 3 respectively.

C-115
CO2
CO2
Figure 1 Calcium Carbide Production Process
Figure 2 Acetylene Gas Production Process
Lime stone (CaCO3)
Lime furnace
Grinding
Coal
Grinding, Screening
Arc-electrode
Cooling, grinding, packaging
Storage (CaC2)
Ca(OH)2
CaC2
H2O
Moisture elimination,H2S & H3P removal
Air compressor, & Oil removal
Bottling & Storage
Ca(OH)2;H2O
C2H2 Gas generator
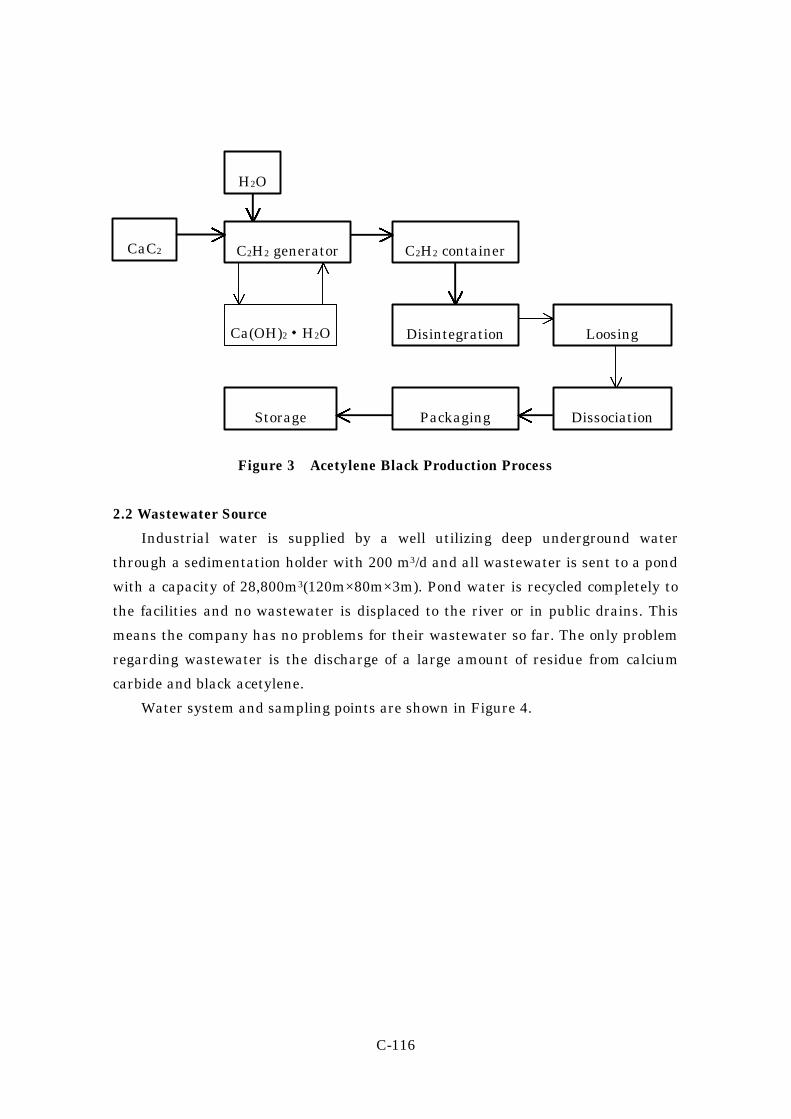
C-116
Figure 3 Acetylene Black Production Process
2.2 Wastewater Source
Industrial water is supplied by a well utilizing deep underground water
through a sedimentation holder with 200 m3/d and all wastewater is sent to a pond
with a capacity of 28,800m3(120m×80m×3m). Pond water is recycled completely to
the facilities and no wastewater is displaced to the river or in public drains. This
means the company has no problems for their wastewater so far. The only problem
regarding wastewater is the discharge of a large amount of residue from calcium
carbide and black acetylene.
Water system and sampling points are shown in Figure 4.
CaC2 C2H2 generator
H2O
C2H2 container
Ca(OH)2・H2O Disintegration Loosing
Dissociation Packaging Storage

C-117
Well Water Domestic Use
②
③
①
④
Figure 4 Water System
3. Management
3.1 General
EIA is applied by the MOI Environmental Center, but the ISO system has not
been applied yet in this company. Environmental aspects are considered in the long
term, but present facility is not enough for environmental evaluation in Viet Nam.
Investment costs for environmental facilities in Viet Nam are too expensive for
them to bear at present, and almost all investors hesitate to invest in their factory
because of their economic aspect.
The factory of this company seems not to be well managed, as facilities are not
maintained and the site is not kept clean. However, we need to consider that the
raw materials and products are basically powder solid and are scattered easily
during treatment.
3.2 Annual Consumption and Cost
The annual consumption and cost in 1998 are shown in Table 3.
Calcium Carbide
Acetylene Gas
Acetylene Black
Pond
Filtration

C-118
Table 3 Annual Consumption and Cost in 1998
Material Use Unit Amount Cost (VND) Calcium Carbide Coal Lime Stone Bre Resin Coal Lead Steel Plate Electricity
Tones
m3 Tones Tones Tones Tones Kwh
1,751,461
2,475 134,513 203,299
80,650 35,581
8,847,714
655,746,998
54,450,000 215,220,800 234,958,800
68,955,750 185,021,200
5,931,660,260 Acetylene Gas Calcium Carbide Water Electricity Acetone
Tones
m3 Kwh Kg
6,127 5,000
18,255 1,560
211,485,000
5,150,000 15,699,300 17,160,000
Acetylene Black Calcium Carbide Water Electricity
Tones
m3 Kwh
9,844
29,000 45,072
3,913,741,312
30,000,000 38,761,920
4. Industrial Wastewater Treatment and Discharge
4.1 Wastewater Quality
Table 4 shows Sampling Points.
Table 4 Sampling Points
Sample number Sample 1 Wastewater from the Pond 2 Underground Water before treatment 3 Underground Water after Filtration 4 Recycled Water from Acetylene Black Production
The results of the analysis by CECO for wastewater samples taken at the same
time as the JICA Team are shown in Table 5.
Table 5 Wastewater Quality (CECO)
Sampling Point 1 2 3 4 Parameter Unit
Time 11:20 11:30 11:40 11:50 Temp. ℃ 25 26 26 25 pH 7.8 7.5 7.8 11.8
Conductivity mmS/㎝ 0.46 0.36 0.37 2.1 Turbidity NTU 80 38 10 98
Oil Content ㎎/l 0.2 0.0 0.0 1.4 BOD5 ㎎/l 14 2 0 76 COD ㎎/l 18 7.2 3.6 110

C-119
Sampling Point 1 2 3 4 Parameter Unit
DO ㎎/l 7.2 7.6 7.8 6.5 SS ㎎/l 36 4 1 59
T-nitrogen ㎎/l 49.6 17.6 14.3 19.8 CN ㎎/l 0.000 0.000 0.000 0.000
Phenol ㎎/l 0.001 0.000 0.000 0.000 Residual Cl ㎎/l 0.04 0.04 0.02 0.01
Fe ㎎/l 0.16 1.03 0.38 0.27
5. Recommended Countermeasures for Improvement
5.1 Short Term Countermeasures
(1) Have periodical checks on the quality of recycling water especially from
acetylene black.
5.2 Mid- Term and Long Term Countermeasures
(1) Maintain the facility from aging through periodical effective painting.

C-120

C-121
CASE STUDY C-07
Viet Tri Chemicals Company Survey Date : November 25, 1999
1. General
1.1 Profile
Viet Tri Chemical Company is one of the State-Owned companies under
VINACHEM, Ministry of Industry. The factory profile is summarized in Table 1.
Table 1 Company Profile
Company Name: Viet Tri Chemical Company
Ownership: State-Owned
Address: Tho Son- Viet Tri City- Phu Tho Province
Director: Mr. Dao Quang Tuyen
Established: 1961
Corporate Capital:
Number of Employees: 555 including 30 engineers (10 chemical engineers )
Main Products: NaOH, HCl, Detergents, Liquefied Cl2
The main products of Viet Tri Chemical Company are NaOH, HCl, liquefied
chlorine, CaCl2 and detergents. Capacity of NaOH production has expanded 3
times to 6,000t/y since starting and will be expanded two fold to satisfy demand in
the northern region. They produced PVC and pesticide before 1990 and stopped the
production because of economic and environmental problems. However, there is a
possibility to re-start production depending on the market, and in such a case,
modification of facilities will be needed. Another factory 3km apart from this main
factory produces CaCl2 and 2 types of detergents of which raw material, LAS is
imported from Korea. There is no expansion plan for detergent, because of many
competitors in Viet Nam.
1.2 Status of Business
Business of their products is still weak especially for NaOH and chlorine
because of competition with Chinese products and a price-free market which is not
controlled. Cost of their products are rather high and this is caused by small scale
production and old fashioned equipment, beside expensive electricity. Demand for

C-122
electricity in Viet Nam is increasing and the price went up from 5 cents/kw to 6-7
cents/kw recently, and 2.5 cents/kw in China and 4 cents/kw in Japan, they said.
(1) Production
Production Capacity, Annual Production and Revenues in 1999 are shown in
Table 2.
The company has been obliged to produce their product at a low operation rate,
because of the market condition.
Table 2 Production Capacity, Annual Production and Revenues
Product Production (t/y) Capacity (t/y) Revenue (Million VND) NaOH (as 100%) 5,000 6,000 HCl (31%) 10,200 14,000 NaOCl 2,750 8,000 Liq. Cl2 977 1,500 Washing Powder 1,515 5,000 Washing Paste 5,187 14,000 Na2SiO3 2,681 5,000 CaCl2 (at least 96%) 1,150 2,000 Total 64,105.898
(2) Debt
The company’s debt is 4,700 million VND as the short term loan.
2. Production Technology
2.1 Process
The production technology for NaOH is the diaphragm process introduced from
China and titan is used for the material of electrodes. Figure 1 shows caustic soda
production process, and Figure 2 shows detergent and silicate production processes.
The technology for detergent is domestic by local consultant.
2.2 Wastewater Resource
They use intake water from the Red River water after going through the
sedimentation pond. In 1995 a recovery system of industrial wastewater was
introduced to the company and 70% of wastewater, the total amount is 12,000m3/d,
was recovered successfully decreasing the amount discharged into the river.
Industrial wastewater is treated by neutralization with no stirring and
sedimentation, and the neutralization facilities are very simple, but work well now.

C-123
After this neutralization treatment, wastewater is discharged to the Red River
with domestic wastewater. They are planning to recycle all wastewater in 2 years.
Another factory producing detergents discharges wastewater at only 30 m3/d
and has no problems. The company performs the analysis of pH for industrial
wastewater on 3-4 points every day. The wastewater system and sampling points
are shown in Figure 3.
Figure 2 Sodium silicate , Detergent Production Process
from the Red River
②
④
To the Red River
Figure 3 Water System and Sampling Points
①
③
Sedimentation Pond
Production Processes
Sedimentation &
Neutralization
Water Sand Na2CO3 FO
Melting
LAS HCl Na2CO3
Na2SO4
Reaction
LAS HCl
Reaction Na2CO3
Na2SO4
Dissolve Filtration & Grinding Filtration & Grinding
Sedimentation
Concentration
NaSiO3
Spraying & Drying
Packaging
Washing Powder
Packaging
Washing Paste
Domestic Wastewater

C-124
Sludge
Sludge
78%H2SO4
Sludge
Figure 1 Caustic Soda and Chlorine Production Process
78%H2SO4
Steam Boiler
Sedimentation & Filtration
Electrolysis Cl2 Drying
Cl2 Liquidification
Gravel Liquid Cl2
NaCl Filtration
NaOH
Concentration
NaOH Chilling
H2 Chilling
HCl Synthesis
HCl Absorption
30%NaOH 31%HCl
CaCO3 BaCl2
31% HCl
Concentration (45%)
Packaging 96% CaCl2
Dissolve & Purified
Spraying, Drying, Grinding & Cooling
Ca(OH)2
Purification, Filtration & Sedimentation
Reaction
DC NaCl Water Coal
Sludge wash
Gravel Production
Na2CO3 H2SO4
Cl2 Cooling

C-125
3.Management 3.1 General After an environmental conference was held in Viet Tri district in 1992, the management decided to change the factory to be cleaner than ever, and the
activities to plant trees and to put nests for doves were implemented. Management of the factory is well performed and the concept on improvement
for production and future plans very clear and concrete. The facility, building and equipment are being maintained in very good and beautiful condition.
The top management thinks that their factory is too small scale, too old and the cost of electricity is too expensive to survive the competition, so they eagerly
want to renovate the factory soon. Environmental impact of gas and solid waste is quite low and the main
problem is wastewater discharged to the Red River. A recovery system of
industrial wastewater was introduced in 1995. Unit consumption of raw materials for each products, additives and utilities
with annual consumption in 1998 are shown with its cost in Table 3.
Table 3 Annual Consumption and Cost in 1998 Material Used Amount (kg) Cost (VND/kg) Total Use (Tones)
NaOH NaCl NaCO3 CaCl2 Asbestos Steam
1,812 12.4
13.96 0.167 7,500
550
1,785 2,500
69,607.7 244,000
9,066
69.394 69.8
0.8358 37,129
HCl Cl2 Gas
328
360
3,347.233
Liq. Cl2 H2SO4 NH3
1.4 1.33
1,511.4 3,000
1.36
1,010 NaOCl Cl2 Gas NaOH
78 96
360
3,100
214 264
Na2SiO3 Na2CO3 SiO2
217 350
1,785 126.1
548 941
Detergent LAS Na2CO3 NaCl HCl Na2SO4 Na3P5O10 NaOH
100.02 78.02 24.6
26.31 147.53 10.04 4.96
11,459 1,785 550 800
975.5 6,396 3,100
670.554 922.930 165.200 176.34
988.775 673.17 33.307
CaCl2 HCl CaCO3
3,003.6 1,338
800
112.9
3,319 1,479

C-126
According to company materials, consumption of utilities are as follows; Industrial water:2,187,244m3
Domestic water:53,948m3 Electricity:15,142,833kwh
Coal:7,690t Fuel oil:279.116t
4. Industrial Wastewater Treatment and Discharge 4.1 Wastewater Quality Sampling points and numbers are shown in Table 4. The results of the
analysis by CECO for wastewater samples taken at the same time as the JICA Team are shown in Table 5.
Table 4 Sampling Points and Numbers Sample Numbers Sampling Points
1 Wastewater discharged to the Red River 2 Intake Water from the Red River after Treatment 3 Wastewater after Treatment 4 Wastewater before Treatment
Table 5 Wastewater Quality (CECO)
Sampling Point 1 2 3 4
Parameter Unit Time 10:50 11:00 11:07 11:12 Temp. ℃ 37 27 35 27 pH 7.0 7.8 5.7 1.9 Conductivity mmS/㎝ 3.5 0.27 3.6 12 Turbidity NTU 380 30 20 44 Oil content ㎎/l 0.35 0.00 0.27 0.32 BOD5 ㎎/l 52 15 72 97 COD ㎎/l 142 28 168 344 DO ㎎/l 3.9 3.6 3.4 3.6 SS ㎎/l 1,122 67 9 69 T- nitrogen ㎎/l 28.6 16.8 30 28 CN ㎎/l 0.004 0.000 0.006 0.01 Phenol ㎎/l 0.002 <0.001 0.003 0.003 Residual Cl ㎎/l 0.2 0.00 0.2 0.7 SO4 ㎎/l 38 11 12 10
4.2 Regulation Standards Regulation Standards of Industrial Wastewater (Rank B) in Viet Nam are

C-127
shown in Table 6. in order to compare to the value at sample point 1 in Table 5 where wastewater is discharged to the public areas.
Table 6 TCVN 5945-1995( Rank B)
Parameter Unit Wastewater Discharge Standard
(B)
Parameter Unit Wastewater Discharge Standard
(B) Temp. ℃ 40 Mn mg/l 1
PH 5.5-9 Ni mg/l 1 BOD5 mg/l 50 Organic P mg/l 0.5 COD mg/l 100 Fe mg/l 5 SS mg/l 100 Sn mg/l 1
Mineral Oil mg/l 1 Hg mg/l 0.005 Organic Oil mg/l 10 T-Nitrogen mg/l 60
As mg/l 0.1 T-P mg/l 6 Cd mg/l 0.02 F
Compounds mg/l 2
Residual Cl mg/l 2 Phenol mg/l 0.05 Cr(Ⅵ) mg/l 0.1 S
Compounds mg/l 0.5
Cr(Ⅲ) mg/l 1 CN mg/l 0.1 Zn mg/l 2 Pb mg/l 0.5 Cu mg/l 1
According to the comparison between the results of the analysis on sample No.1 which is discharged water to the river and TCVN value, BOD5, COD and SS
exceed the regulated standard value. On the other hand, process wastewater before being mixed with domestic wastewater exceeds only BOD5 and COD. This
fact indicates that excess SS is the result of domestic wastewater. So, if they aimed for a 100% water recycle system in 2 years, they should install a biological
treatment facility such as activated sludge treatment, for domestic wastewater.
5. Recommendation for Pollution Prevention 5.1 Short term recommendation (1) Take action to have a study for countermeasures on decreasing BOD5, COD
and SS as soon as possible. However, first thing to do is to accelerate reduction, recovery and recycle of wastewater.
(2) Consider recovering 100% wastewater by recycling, the company should install an activated sludge treatment system for their domestic waste
water. (3) Discharged water to the Red River seems to contain chlorine because of

C-128
its odor, and chlorine content should be studied in detail. However, data in Table 5 does not show that is exceed the regulated standard value.
5.2 Mid- Term and Long Term Countermeasures (1) Improve the productivity by cutting variable costs through expansion of production and introduction of new effective technology.

C-129
CASE STUDY C-08
Sao Vang Rubber Company
Survey Date : November 26, 1999
1. General
1.1 Profile
Sao Vang (Gold Star) Rubber Chemicals Company is one of the State-owned
companies under MOI, specializing in producing tires and rubber products for
vehicles and industrial use. The factory profile is summarized in Table 1.
Table 1 Company Profile
Company Name: Sao Vang Rubber Company / Ha Noi Factory
Ownership: State owned
Address: 231 Nguyen Trai- Thanh Xuan- Ha Noi
Director: Mr. Nguyen Duy Dang
Established 1960
Corporate Capital
Number of Employees: 2,100
Main Products: Rubber Tire & Derived Goods
The main products of Sao Vang Rubber Chemicals Company are tubes and
tires for automobiles and tractors, tubes and tires for motorcycles and bicycles,
conveyor belts and V-belts of different sorts, rubber hoses and other rubber
technical retail products. The number of employees is 2,100, however, the number
of employees was 260 at the time of establishment in 1960. The initial production
capacity of tires for bicycles was 30,000 tires/y.
The demand for tires and the development of the company was so fast, so as to
increase the production capacity. At the end of the 1980’s, the production capacity
became 31 times the initial capacity, for example;
① bicycle tires; 4,000,000-5,000,000tires/y
② car tires; 60,000-70,000sets/y
③ rubber pipe; 1,000,000m/y
④ rubber products and other technical products for industrial use
The main factory is located in Hanoi. There is a factory producing

C-130
intermediate rubber products in Vinh Phu province and another factory producing
tires for bicycles in Thai Binh province.
1.2 Status of Business
The market of rubber products in Viet Nam is big and the demand is
expanding, so the production facility runs at its full capacity. Also employees work
overtime everyday at present. The business outlook of the company for the future is
quite bright and investment is planned for future expansion of car tires for which
production capacity is to be 500,000sets/y at the year of 2003, and was approved by
top management. The new facility will be installed in Vinh Phu province.
1.2.1 Production
The actual production for 1998 for their main product and revenues are shown
in Table 2.
Table 2 Annual Production and Revenues in 1998
Product Type Unit Production Revenue (1000VND) Air Plane Tire Product 822 1,817,000 Car & Truck Tire Product 100,601 61,596,535 Car & Truck Tube Product 84,457 4,279,525 Car & Truck Carpet Product 9,593 489,405 Motorbike Tire Product 453,872 24,261,567 Motorbike Tube Product 1,090,234 16,428,017 Bicycle Tire Product 6,780,358 102,131,120 Bicycle Tube Product 7,839,982 39,172,821 Rubber Boot Pair 16,437 384,205 Curoa (all type) Product 8,223 83,116 Rubber Pipe (all type) M 5,155 314,444 Technical Rubber Kg -- 8,516,709 Battery Cell Product 28,570,000 27,256,567
According to this data, the main product, tires for cars were produced at almost
100,000sets/y and tires for bicycle 6,800,000tires/y in 1998.
The main raw material, natural rubber, is purchased from Southern Viet Nam
and is sulfurized for various products.
As for the boiler system, 5 coal boilers(made in China and Taiwan) and 1 oil
base boiler(made in Germany) are operated at a capacity of 36t/hr steam
generation, but the actual operation rate is about 40% now. Two of the coal base
boilers will be replaced by oil base boilers of German technology in the near future.
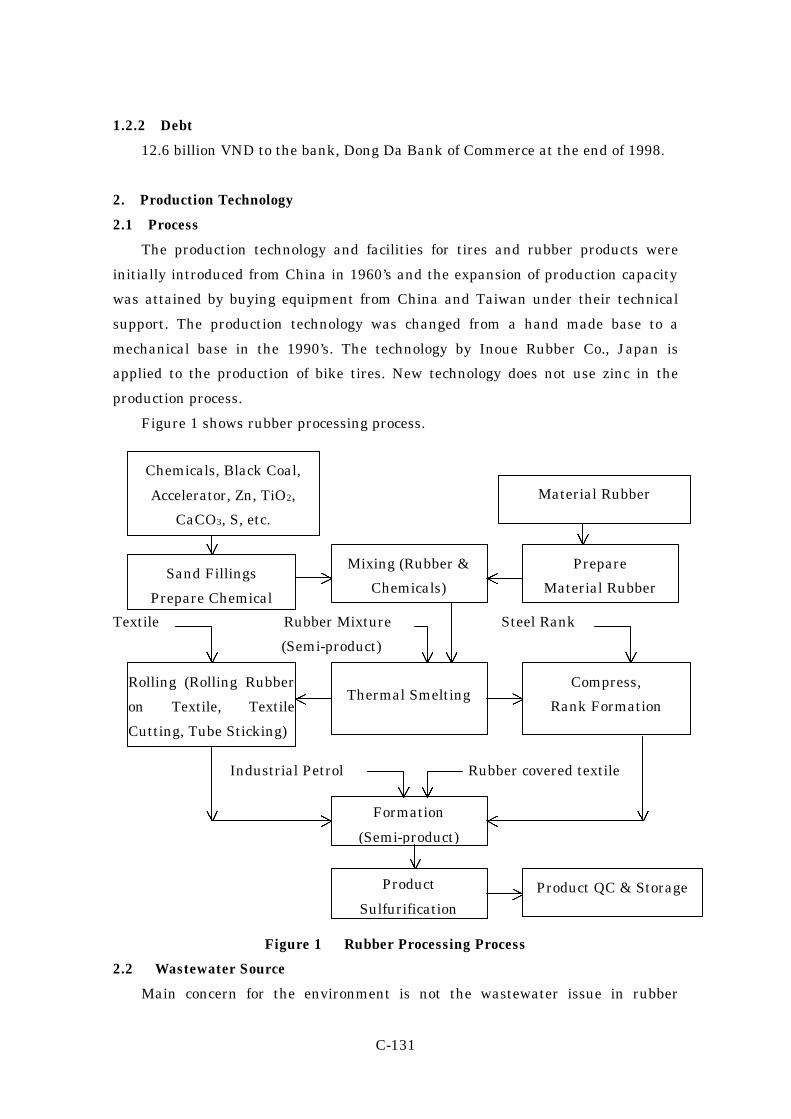
C-131
1.2.2 Debt
12.6 billion VND to the bank, Dong Da Bank of Commerce at the end of 1998.
2. Production Technology
2.1 Process
The production technology and facilities for tires and rubber products were
initially introduced from China in 1960’s and the expansion of production capacity
was attained by buying equipment from China and Taiwan under their technical
support. The production technology was changed from a hand made base to a
mechanical base in the 1990’s. The technology by Inoue Rubber Co., Japan is
applied to the production of bike tires. New technology does not use zinc in the
production process.
Figure 1 shows rubber processing process.
Textile Rubber Mixture Steel Rank
(Semi-product)
Industrial Petrol Rubber covered textile
Figure 1 Rubber Processing Process
2.2 Wastewater Source
Main concern for the environment is not the wastewater issue in rubber
Sand Fillings
Prepare Chemical
Prepare
Material Rubber
Mixing (Rubber &
Chemicals)
Rolling (Rolling Rubber
on Textile, Textile
Cutting, Tube Sticking)
Thermal Smelting Compress,
Rank Formation
Formation
(Semi-product)
Product
Sulfurification Product QC & Storage
Material Rubber
Chemicals, Black Coal,
Accelerator, Zn, TiO2,
CaCO3, S, etc.

C-132
production, but dust and toxic organic solvents. The organic solvent was changed
from benzene to industrial petroleum to decrease its toxic influence.
The industrial water is supplied from a deep well in the factory at 200 m3/h for
boiler feed water and supplemental water for cooling water and domestic use.
There is no data on the amount of steam condensate.
Before 1996 they had no recovery system and water was wasted at 6,000m3/d.
Recycled water is used as cooling water. After a circulating system was applied for
minimizing the wastewater, it is now estimated at only about 200m3/d. The quality
of all wastewater is within standards and the main concern is SS and volatile
substances. They would like to increase recycling water rate from 40% to 90% in
the future.
A periodical check on wastewater has not been performed since 1996 after the
wastewater project in the company finished its work, and EIA was performed in
1996 only. So no recent data for wastewater exists and the wastewater treatment is
not actually performed for environmental conservation.
The wastewater seems not to be seriously polluted at present, but the oil
contamination on the surface of wastewater can been seen. Oil leakage was
observed on the ground in the factory, especially a large amount around the boiler
facility, near the mechanical machine facility, from knock out vessels and from cars
used for logistics.
Water System and Sampling Points are shown in Figure 2.
Figure 2 Water System and Sampling Points
For drainage as common channel is utilized by 3 enterprises, Sao Vang Rubber
Co., LEVER HASO and their subsidiary company, Ha Noi Detergent Company.
④
③
①
②
Ion Exchange Column Boilers
Production Processes
Domestic Use
Common Drainage
Well Water
To the river
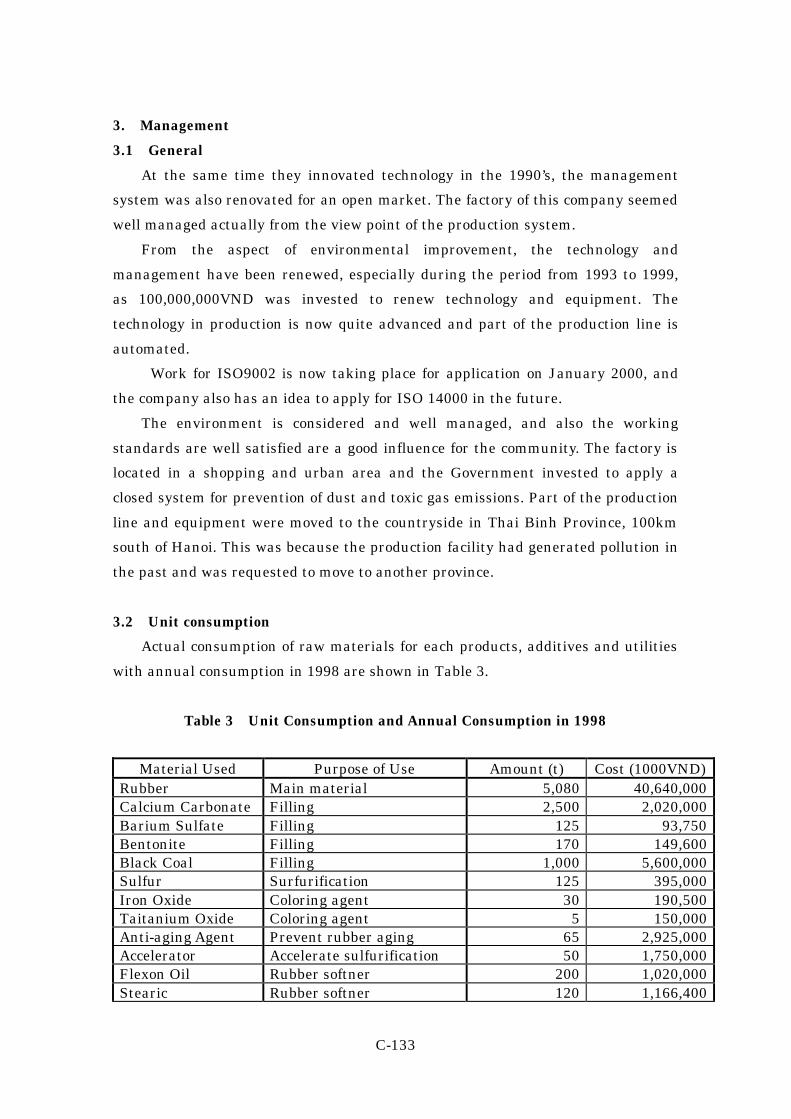
C-133
3. Management
3.1 General
At the same time they innovated technology in the 1990’s, the management
system was also renovated for an open market. The factory of this company seemed
well managed actually from the view point of the production system.
From the aspect of environmental improvement, the technology and
management have been renewed, especially during the period from 1993 to 1999,
as 100,000,000VND was invested to renew technology and equipment. The
technology in production is now quite advanced and part of the production line is
automated.
Work for ISO9002 is now taking place for application on January 2000, and
the company also has an idea to apply for ISO 14000 in the future.
The environment is considered and well managed, and also the working
standards are well satisfied are a good influence for the community. The factory is
located in a shopping and urban area and the Government invested to apply a
closed system for prevention of dust and toxic gas emissions. Part of the production
line and equipment were moved to the countryside in Thai Binh Province, 100km
south of Hanoi. This was because the production facility had generated pollution in
the past and was requested to move to another province.
3.2 Unit consumption
Actual consumption of raw materials for each products, additives and utilities
with annual consumption in 1998 are shown in Table 3.
Table 3 Unit Consumption and Annual Consumption in 1998
Material Used Purpose of Use Amount (t) Cost (1000VND) Rubber Main material 5,080 40,640,000 Calcium Carbonate Filling 2,500 2,020,000 Barium Sulfate Filling 125 93,750 Bentonite Filling 170 149,600 Black Coal Filling 1,000 5,600,000 Sulfur Surfurification 125 395,000 Iron Oxide Coloring agent 30 190,500 Taitanium Oxide Coloring agent 5 150,000 Anti-aging Agent Prevent rubber aging 65 2,925,000 Accelerator Accelerate sulfurification 50 1,750,000 Flexon Oil Rubber softner 200 1,020,000 Stearic Rubber softner 120 1,166,400

C-134
Material Used Purpose of Use Amount (t) Cost (1000VND) Paraffin Framing additive 60 330,000 Pine Oil Softner 70 525,000 Pine Resin Softner 40 280,000 Dissolvable Powder Separating agent 60 180,000 Industrial Fat Softner 10 135,000 Industrial Petrol Dissolve solvent 230 1,633,000 Textile Resistance enhancer 620 33,699,480 Textile Resistance enhancer 25 1,007,975 Textile Water proofing 60 180,000 Steel Car & Bicycle Tire 720 8,106,480 Lubricant Equipment lubricating 270 270,000 Diesel Car & Truck consumption 2 7,000 Fuel Oil Use for oil based boiler 3,600 6408,000 Furnace Coal Use for coal based boiler 15,000 4,800,000 Electricity Production & Domestic use 16,800,000kwh 13,000,000
4. Industrial Wastewater Treatment and Discharge
4.1 Wastewater Quality
Sampling points and numbers are shown in Table 4. The results of the analysis
by CECO for wastewater samples taken at the same time as the JICA Team are
shown in Table 5.
Table 4 Sampling Points and Numbers
Sample number Sampling Points 1 Wastewater Outlet to the Common Drainage 2 Wastewater in the Common Drainage (3 companies) 3 Well Water 4 Wastewater from Production Processes in the Circulation Line
Table 5 Wastewater Quality (CECO)
Sampling Point 1 2 3 4 Parameter Unit
Time 10:20 10:22 10:37 10:45 Temp. ℃ 38.5 32.4 29 31.3 pH 7.1 8.5 7.1 8.2 Conductivity mmS/㎝ 0.9 0.1 0.8 0.68 Turbidity NTU 66 74 52 39 Oil content ㎎/l 0.2 0.32 0.00 0.17 BOD5 ㎎/l 78 270 1 12.5 COD ㎎/l 220 452 7 36 DO ㎎/l 2.4 4.5 7.8 4.2 SS ㎎/l 61 71 3 3

C-135
Sampling Point 1 2 3 4 Parameter Unit
T-nitrogen ㎎/l 8.4 13.7 3.8 4.5 CN ㎎/l 0.009 0.006 0.000 0.001 Phenol ㎎/l 0.007 0.005 <0.001 <0.001 Residual Cl ㎎/l 0.03 0.05 0.00 0.00 S Compounds ㎎/l 67 30 0.00 3
4.2 Regulation Standards
Regulation Standards for Industrial Wastewater (Rank B) in Viet Nam are
shown in Table 6.
Table 6 TCVN 5945-1995( Rank B)
Parameter Unit Wastewater Discharge Standard
(B)
Parameter Unit Wastewater Discharge Standard
(B) Temp. ℃ 40 Mn mg/l 1
pH 5.5-9 Ni mg/l 1 BOD5 mg/l 50 Organic P mg/l 0.5 COD mg/l 100 Fe mg/l 5 SS mg/l 100 Sn mg/l 1
Mineral Oil mg/l 1 Hg mg/l 0.005 Organic Oil mg/l 10 T-Nitrogen mg/l 60
As mg/l 0.1 T-P mg/l 6 Cd mg/l 0.02 F
Compounds mg/l 2
Residual Cl mg/l 2 Phenol mg/l 0.05 Cr(Ⅵ) mg/l 0.1 S
Compounds mg/l 0.5
Cr(Ⅲ) mg/l 1 CN mg/l 0.1 Zn mg/l 2 Pb mg/l 0.5 Cu mg/l 1
According to the comparison of the data for Sampling point No.1 in Table 5 and
TCVN in Table 6, the value of BOD5、COD and sulfur compounds exceed the
regulation.

C-136
5. Recommended Countermeasures for Improvement
5.1 Short Term Countermeasures
(1) Take countermeasures for BOD5,COD and sulfur compounds soon.
(2) Adopt the activated sludge treatment for the high BOD5 wastewater after
studying the present condition of domestic wastewater and reducing it, if
necessary.
(3) Prevent sulfur compounds flowing into drainage from the contaminated
floor.
(4) Conduct a periodical check on the quality of wastewater and include quality
check on industrial wastewater in EIA starting next time.
(5) Countermeasure to stop the oil leakage from equipment ,facilities and cars.
Also for oil leakage removal from ground and equipment.
(6) Reduce the volume of industrial wastewater to the river by recovery.
5.2 Mid- Term and Long Term Countermeasures
(1) Install an oil separator before discharging wastewater of the drainage
to the river.
(2) Apply for ISO14000 in the near future. In order to apply, it is necessary that
the periodical EIA, more active environmental management including
environmental committee should be implemented.

C-137
CASE STUDY C-09
Van Dien Fused Magnesium Phosphate Fertilizer Company Survey Date : November 29, 1999
1. General
1.1 Profile
Van Dien Sintering Superphosphate and Chemical Company is one of the
State-owned companies under MOI, specializing in producing fused magnesium
phosphate fertilizer and NPK fertilizer. The factory profile is summarized in
Table 1.
Table 1 Company Profile
Company Name: Van Dien Fused Magnesium Phosphate Fertilizer
Ownership: State owned
Address: Van Dien- Thanh Tri- Ha Noi
Director: Mr. Nguyen Quoc Viet
Established 1960
Corporate Capital
Number of Employees: 526 (27 engineers)
Main Products: Fused Magnesium Phosphate Fertilizer, NPK, Cement
The main products of Van Dien Sintering Superphosphate and Chemical
Company are fused magnesium phosphate fertilizer, NPK combination fertilizer
and cement. When the company was established, the initial production capacity of
fused magnesium phosphate fertilizer was 20,000 t/y by vertical furnaces and was
increased to 90,000 t/y by the introduction of 5 vertical furnaces in 1975.
The strong demand for fused magnesium phosphate fertilizer has enabled the
company to develop their production capacity to 180,000t/y in 1999. Also the
demand for fertilizer for this is still very high and increases in production capacity
are planned more and more, but they have no concrete figures for expansion yet at
present.
The capacity of the main product, fused magnesium phosphate fertilizer, was
attained by improving the technology and changing facilities, which consisted of
the furnaces, reactors and other equipment. Especially, the 5 furnaces were
replaced with 3 new ones with new technology in order to reduce raw materials and

C-138
energy for production by 30% compared with conventional technology. If the
conventional technology was still in use now at 180,000t/y production, solid waste
from the process should be 5,000 to 6,000t/y, but actually the byproduct was
completely recovered and fed to the process as a main raw material. This
improvement had a big effect on the economy and environment of the existing
process and it caused to a considerable reduction in their production cost. Fuel is
another factor that causes high costs and pollution to the environment. Coal costs
are so high for production and it contains a higher amount of sulfur. Coal generates
much sulfur dioxide and carbon dioxide. So they made efforts to take
countermeasures to reduce the consumption of coal. For example, by only
introducing a vertical furnace it caused the unit consumption ratio of coal to drop
from 0.62 t-coal/t-product to 0.19 t-coal/t-product. Also, the consumption ratio of
electricity improved from 145kw/t-product to 60 kw/t-product (electricity cost was
cut almost 65% to 70%). This improvement made it possible to reduce total cost of
the product by about 60%. At the same time they made efforts to improving product
quality, and got customers from Japan in the beginning of the 1990’s. Area of the
factory is 10 hectares. Expansion in the past was attained by improvement of
efficiency, because the available area is too small for them to expand more.
1.2 Status of Business
They need to improve production capacity more because their product demand
is getting bigger, however, an expansion of production capacity is not planned at
present.
(1) Production
Annual Production and Revenues in 1998 are shown in Table 2.
Table 2 Annual Production and Revenues in 1998
Product Production Revenue (Billion VND)
Fused Magnesium Phosphate Fertilizer 139,144 Tons 115.432
NPK Compounded Fertilizer 9,270 Tons 10.835
Cement & Other Products 0.478
Total 126.745
(2) Debt
No description

C-139
2. Production Technology
2.1 Process
The production technology and facilities for main products were initially
transferred through Japan, China and Korea in 1950’s and introduced to the
enterprise in 1960.
Fused calcium superphosphate production process is shown in Figure 1.
Figure 1 Fused Calcium Superphosphate Production Process
2 .2 Wastewater Source
In spite of increasing the capacity of production, the volume of wastewater has
been decreased and the quality of wastewater improved apparently after having
implemented a wastewater treatment system similar to one of phosphate
companies in Japan. The circulation system of water enables wastewater discharge
to be decreased to 2/3 of original amount and 100% of wastewater will be recovered
in the near future by minimizing water usage.
Water supply comes from underground pumping at present, but they have been
warned by authorities that their descending land will be a big problem in Hanoi
because of excessive consumption of underground water in the near future.
The volume of discharged water is 2,000 m3/d from each furnace and is sent to
the To Lich River. An amount of 4,000 m3/d is utilized through recycling in the
company.
Water system and the sampling points are shown in Figure 2.
Gas Treatment
Superphosphate Grinding Storage
Superphosphate Production
(Vertical Furnace)
Apatite Serpentine Coal

C-140
①
Well Water
Cooling Water
Water
Recovered
②
Blow down of
⑤ Cooling Water
④
③
To the Tolich River
Figure 2 Water System and Sampling Points
3. Management
3.1 General
The company has Targeted the 3 main objectives, product quality 1st,
environmental conservation 2nd and economic improvement 3rd ,as the basic
principles of the company.
The company is now just applying for ISO9002 and it seems that they will get
ISO9000 certification in 2001. However, an application for ISO14000 is not planned
at the moment.
3.2 Unit Consumptions
The following is a comparison of 3 types of furnaces, unit consumption of raw
materials for each product, and additives and utilities in 1998 are shown in
Table 3.
Iron Removal
Processes
Neutralization
(By Lime)
Sedimentation
Common Pond
Gas
Treatment

C-141
① Unit Consumption of Raw Materials
Though 3 technologies have the same unit consumption, electric furnaces and
horizontal furnaces need fine raw materials, so there is an added cost for crushing.
On the other hand, high vertical furnaces consume raw materials with a size 10-90
mm in diameter and fine materials should be arranged into the shape and size of a
cake.
② Unit Consumption of Fuel Oil and Electricity
Electric furnaces : Unit consumption of electricity is 900+74 kw/t-product and unit
price of electricity is 770 VND, so the electricity cost is 749,980 VND/t-product.
Horizontal furnaces : Unit consumption of fuel oil and unit price of oil, 3600 VND/l
will result in fuel costs of 468,000 VND/t-product. In the same way, electricity cost
is 119,550 VND/t-product. Total cost is 587,350 VND/t-product.
High Vertical furnace:Electricity cost is 50,050 VND/t-product and coal cost is
153,600 VND/t-product (Unit price : 640 VND/t). Total cost is 203,650
VND/t-product.
The vertical furnace is the most economical among the 3 type of furnaces.
Anyway, waste treatment for exhaust gas, wastewater and solid waste is necessary
for the 3 processes. The data of horizontal furnace was supplied by Hinode Co.,
Japan in 1993.
Table 3 Unit Consumption in 1998
Material Electric Furnace Horizontal Furnace High Vertical Furnace
Apatite
Serpentine
Additive
1.25 t/t-product 1.25 t/t-product 1.25 t/t-product
Electricity for
Thermal reaction
800-900
kw/t-product
Electrode 5 kg/t-product
Electricity for
Machine
74 kw/t-product 155 kw/t-product 65 kw/t-product
Fuel Oil 130 l/t-product
Coal 0.23 t/t-product
Powder Coal No.4 for
Semi product drying
0.1 t/t-product

C-142
4. Industrial Wastewater Treatment and Discharge
4.1 Wastewater Quality
Results of the analysis by the Institute of Chemical Industry in on December
9th 1998 are shown in Table 4.
Table 4 Results of the analysis by the Institute of Chemical Industry
Results Parameter Unit Vietnam Standard
Sample 1 Sample 2
pH 5.5-9 8.46 7.46
COD mg/l 100 49 28
BOD5 mg/l 50 15.6 10.2
SS mg/l 100 120 100
Pb mg/l 0.5 0.04 0.07
Mn mg/l 1 0.71 0.51
Fe mg/l 5 3.48 2.28
T-nitrogen mg/l 60 5.6 7.0
P2O5 mg/l 6 2.9 Undetectable
F mg/l 2 2.32 1.98
Sample 1: Wastewater in the drainage of the company
Sample 2: Pond Water next to the living area of the company workers
Company stated that there is no problem on exhaust gas because they wash
HF in the exhaust gas, however, opposite statement was given by Mr. Do Thanh
Bai from Institute of Chemical Industry.
Table 5 shows sampling points.
The results of the analysis by CECO for wastewater samples taken at the same
time as the JICA Team are shown in Table 6.
Table 5 Sampling Points
Sample Number Sampling Points
1 Intake water before treatment
2 Wastewater after furnace(Smelter)
3 Wastewater after treatment
4 Cooling Water
5 Wastewater after neutralization

C-143
Table 6 Wastewater Quality (CECO)
Sampling Point 1 2 3 4 5 Parameter Unit
Time 10:05 10:10 10:30 10:50 10:55 Temp. ℃ 22.3 48.7 41 41 42
pH 7.15 7.51 7.29 7.5 2.7
Conductivity mms/cm 0.42 0.69 0.7 0.6 0.3
Turbidity NTU 10 51 29 80 239
Oil content mg/l 0.02 3.5 1.6 0.52 0.25
BOD5 mg/l 3 7 27 7.5 18
COD mg/l 12 32.9 120 19 64
DO mg/l 8.3 2.2 2.7 2.4 1.9
SS mg/l 24 77 39 42 465
T-nitrogen mg/l 4.56 10.14 12.48 14.66 16.24
CN mg/l 0.000 0.000 0.001 0.000 0.000
Phenol mg/l <0.0001 0.00 <0.001 <0.001 <0.001
Residual Cl mg/l 0.00 0.00 0.01 0.05 0.03
SO4 mg/l 0.00 19 40 3 118
Mn mg/l 0.00 0.1 0.6 0.5 3
Fe mg/l 1.94 1.24 0.63 1.85 12.68
T-P mg/l 0.03 5.41 1.72 1.64 67.5
Pb mg/l 0.00 0.071 0.658 0.02 18.86
F mg/l 0.052 12.5 8.15 0.17 23.3
4.2 Regulation Standards
Regulation Standards for Industrial Wastewater (Rank B) in Viet Nam are
shown in Table 7.
Table 7 TCVN 5945-1995(Rank B)
Parameter Unit Wastewater Parameter Unit Wastewater
Temp. ℃ 40 Mn mg/l 1
pH 5.5-9 Ni mg/l 1
BOD5 mg/l 50 Organic P mg/l 0.5
COD mg/l 100 Fe mg/l 5
SS mg/l 100 Sn mg/l 1
Mineral Oil mg/l 1 Hg mg/l 0.005
Organic Oil mg/l 10 T-Nitrogen mg/l 60
As mg/l 0.1 T-P mg/l 6
Cd mg/l 0.02 F Compounds mg/l 2
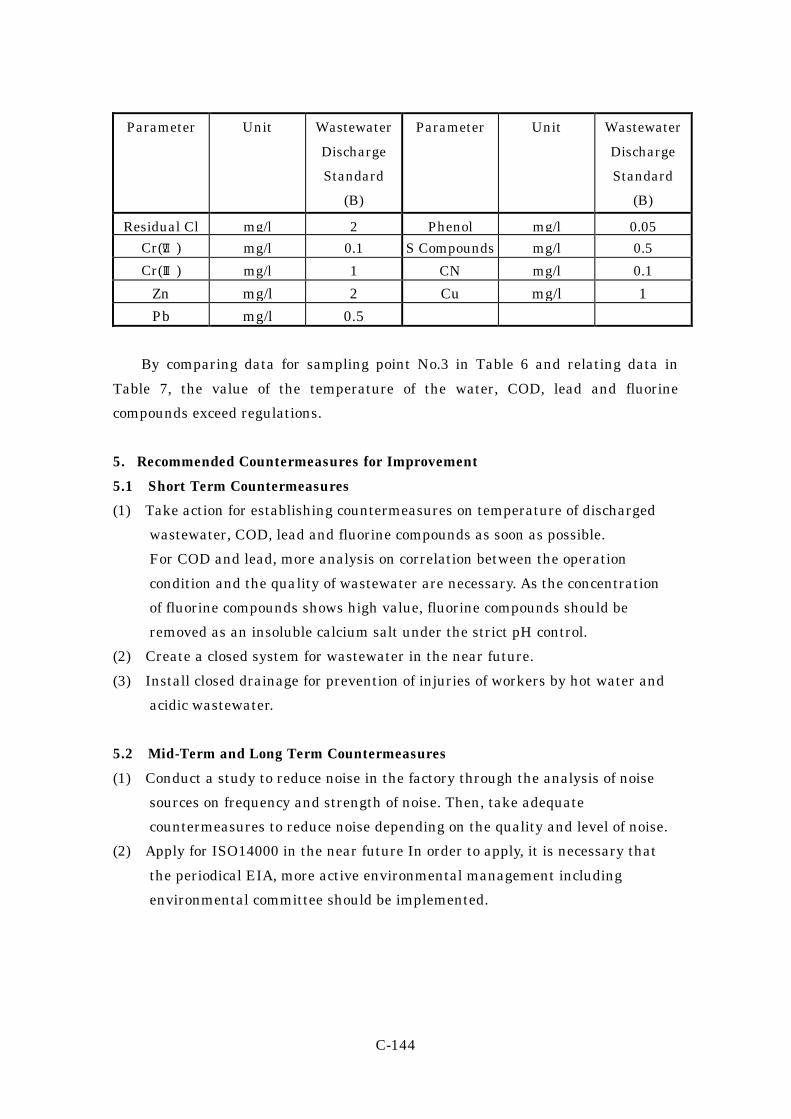
C-144
Parameter Unit Wastewater
Discharge
Standard
(B)
Parameter Unit Wastewater
Discharge
Standard
(B)
Residual Cl mg/l 2 Phenol mg/l 0.05
Cr(Ⅵ) mg/l 0.1 S Compounds mg/l 0.5
Cr(Ⅲ) mg/l 1 CN mg/l 0.1
Zn mg/l 2 Cu mg/l 1
Pb mg/l 0.5
By comparing data for sampling point No.3 in Table 6 and relating data in
Table 7, the value of the temperature of the water, COD, lead and fluorine
compounds exceed regulations.
5. Recommended Countermeasures for Improvement
5.1 Short Term Countermeasures
(1) Take action for establishing countermeasures on temperature of discharged
wastewater, COD, lead and fluorine compounds as soon as possible.
For COD and lead, more analysis on correlation between the operation
condition and the quality of wastewater are necessary. As the concentration
of fluorine compounds shows high value, fluorine compounds should be
removed as an insoluble calcium salt under the strict pH control.
(2) Create a closed system for wastewater in the near future.
(3) Install closed drainage for prevention of injuries of workers by hot water and
acidic wastewater.
5.2 Mid-Term and Long Term Countermeasures
(1) Conduct a study to reduce noise in the factory through the analysis of noise
sources on frequency and strength of noise. Then, take adequate
countermeasures to reduce noise depending on the quality and level of noise.
(2) Apply for ISO14000 in the near future In order to apply, it is necessary that
the periodical EIA, more active environmental management including
environmental committee should be implemented.

C-145
CASE STUDY C-10
LEVER HASO JV Company
Survey Date : November 30, 1999
1. General
1.1 Profile
Lever Haso is one of the JV venture companies invested in by Unilever, one of
the worlds biggest consumer products company. As one of 3 joint venture companies
of Unilever, Lever Haso was formed by Unilever and MOI, the Government of
Vietnam in Jan., 1995. The company profile is summarized in Table 1.
Table 1 Company Profile
Company Name: LEVER HASO JV Company
Ownership: JV between State owned company and private company
Address: 233 Nguyen Trai- Thanh Xuan- Ha Noi
Director: Mr. Pham Van Trac
Established 1995 (starting operation in 1996)
Corporate Capital
Number of Employees: 200 (excluding 100 seasonal employees)
Main Products: Powder Detergent, Body Wash, Shampoo, Wash Milk
Their 4 main products are detergent powder, body wash, shampoo and washing
milk. 1 year after establishment, production started in 1996, and after 2 more
years, the operation generated profits and paid taxes to the Government. The
company has already applied for ISO9000 and is now trying to apply for ISO14000.
The organization of the company consists of 1 director, 1 vice director, 3 units
of production, R&D department, maintenance department, energy department and
administrative department. At present the company has a good relationship with
the Local Government and is complying with all laws and regulations.
The Unilever group in Viet Nam was chosen as the No.1 production company
in 1999 and their products by Lever Viso, Lever Haso and Elida P/S were honored
as Top 10 Products in Viet Nam in 1999.
1.2 Status of Business
The market for home and personal care in Viet Nam has been very good for

C-146
Lever Haso. Their revenue in 1998 reached 17.3 mil. USD, 14 times more than
before they formed the joint venture. In 1999, a 20% increase is expected in
comparison with the figures for 1998.
The capacity of the main products comply with present demand, but expansion
of capacity is expected to increase 20% annually in the future. Because of the
limitation of land area there, they can not install any more new facilities, but
exchanging intermediates for products enables them to increase production levels.
(1) Production
One of the raw materials for powder detergent, LAS, is supplied from the JV
company with Japan in Viet Nam. Annual production of main products in 1998 is
shown in Table 2.
Table 2 Annual Production in 1998
Product Production (t) Shampoo 3,197 Scented Soap 1,723 Detergent Powder 18,990 Total 23,910
(2) Debt
2. Production Technology
2.1 Process
The production technology and facilities for the main product were transferred
from Unilever, UK. All production processes for all products seems to have already
introduced Cleaner Production and are maintained in good condition.
Basically, all production systems are operated automatically and high
productivity and high quality has been attained. The production line is operated by
3 shifts, 24hrs/d and packaging unit operators wear clean uniforms, masks and
caps. The equipment in the production line is made of stainless steel to keep the
product quality higher. The floor in the production building is kept clean
everywhere except in the powder packaging unit, which is polluted by gray dust
caused by a neighboring factory. There was slight leakage at the LAS tank yard.
Soap, powder detergent, and shampoo production processes are shown Figure
1,2 and 3 respectively.

C-147
Figure 1 Soap Production Process
Figure 2 Powder Detergent Production Process
Figure 3 Shampoo Production Process
2.2 Wastewater Source
There is no industrial discharge from the company to public drainage, and only
40m3/d domestic wastewater is discharged to the Tolich River, one of the most
polluted river in Hanoi City. Supply water is introduced from common water pond
outside and 100m3/d (3,000m3/M) is consumed for domestic water, boiler feed water
and process water. Industrial use of water is only 60m3/d which is consumed as
boiler feed water, cooling water and washing water in processes, but all wastewater
from the processes s circulated through sedimentation treatment pond and recycle
water storage tank. These circulating facilities for reducing and reusing
wastewater were completed at the end of 1998.
Water system and sampling points are shown in Figure 4.
Soap Chip Mixer Chip
Thrusting
Strip
Thrusting
Cutting Shaping Packaging
Mixing Grinding Drying
Enzyme
Mixer
Packaging
Mixing Mixing Bottling
Screening
Grinding

C-148
Well Water
①
② To the Tolich
River
⑤
③ ④
Figure 4 Water System and Sampling Points
3. Management
3.1 General
The management system of the company is just the same as advanced
companies in developed countries. They have an environment and safety
organization consisting of a Vice director, Heads of each related Department and
representatives of a labor union. They have environmental audits annually by the
parent company UK, and also have information exchange with parent UK company
on the various subjects. There are high level of Environmental manuals for
operation. The activities for activation of the company, Total Productive
Management/Maintenance, 5S activity and Kaizen (improvement) activity are
performed through all the factories there. These activities make company
productivity high and ensure a clean environment, safe working conditions, stable
production & quality control.
They already have ISO9000 certification, and ISO 14000, which they are
Domestic Use Common Drainage
Shampoo etc.
R&D Dept.
Boilers
Storage Tank
for Wastewater
Detergent Powder
Production
Sedimentation Tank
Deionization

C-149
getting ready for, will be certified in the beginning of 2000.
3.2 UnitConsumption of Raw Materials and Utilities
Unit consumption of raw materials for each product, additives and utilities in
1998 are shown in Table 3.
Table 3 Unit Consumption and Cost in 1998
Material Used Amount Cost (VND) Shampoo Emal Silicone Fragrance
19,508 kg
2,350 kg 500 kg
328,844,000
1,239,400,000 125,132,000
Scented Soap Soap Chip Fragrance
336,300 kg
2,830 kg
3,767,500,000
315,478,000 Detergent Powder LAS Silicate STPP NaOH Fragrance
3,744,326 kg 5,577,819 kg 2,890,700 kg 1,485,000 kg
48,000 kg
38,540,058,985 4,264,232,661
18,700,600,000 2,730,900,000 7,860,663,000
Utilities Water Electricity Fuel Oil & Diesel Oil
10,219 m3
1,234,868 kwh 1,234,950 kg
40,876,000
929,403,804 2,259,876,150
4. Industrial Wastewater Treatment and Discharge
4.1 Wastewater Quality
The quality analysis is performed 1/week on domestic wastewater discharge on
BOD5, COD, SS and AD (Active Detergent) by relative institute of MOSTE
(STIMMEQ). The latest results of the analysis in Nov. 1999 show BOD5-20.9mg/l,
COD-61.0mg/l and SS-46.6mg/l. All pollution items are analyzed annually in the
EIA. No heavy metals are used in the production process. Results of the analysis by
the STIMMEQ are shown in Table 4.
Table 4 Results of analysis on domestic wastewater by the STIMMEQ
Parameter Unit Results BOD5 mg/l 20.9 COD mg/l 61.0 SS mg/l 46.6
Sampling points and their numbers are shown in Table 5 and the results of the

C-150
analysis by CECO for wastewater samples taken at the same time as the JICA
Team are shown in Table 6.
Table 5 Sampling Points
Sample Number Sampling Points 1 Intake water after Treatment(Well water) 2 Discharged Domestic Wastewater to the Common Drainage 3 Industrial Wastewater after Treatment 4 Industrial Wastewater before Treatment 5 River Water( the To Lich River)
Table 6 Wastewater Quality (CECO)
Sampling Point 1 2 3 4 5 Parameter Unit
Time 10:06 10:35 10:45 10:50 11:50 Temp ℃ 23 23 24 23 23 pH 7.7 11.9 9.2 7.8 7.7 Conductivity mmS/㎝ 1.0 2.7 2.9 0.55 4.3 Turbidity NTU 60 67 80 3 59 Oil content ㎎/l 0.43 2.2 0.5 0.00 1.2 BOD5 ㎎/l 94 920 1,100 0 350 COD ㎎/l 120 1,400 1,800 4 520 DO ㎎/l 2.6 6.0 1.3 5.1 0.7 SS ㎎/l 46 57 93 3 56 T-nitrogen ㎎/l 26.52 19.35 14.12 8.76 26.95 CN ㎎/l 0.002 0.003 0.000 0.000 0.013 Phenol ㎎/l <0.001 0.008 0.005 <0.001 0.15 Residual Cl ㎎/l 0.6 0.4 0.1 0.0 0.0 SO4 ㎎/l 7 688 240 0 9 T-P ㎎/l 0.34 0.16 0.19 0.01 1.52 As ㎎/l <0.001 0.006 <0.001 <0.001 0.09 LAS ㎎/l 843 2,785 1,132 15 372
4.2 Regulation Standards
Regulation Standards for Industrial Wastewater (Rank B) in Viet Nam are
shown in Table 7.
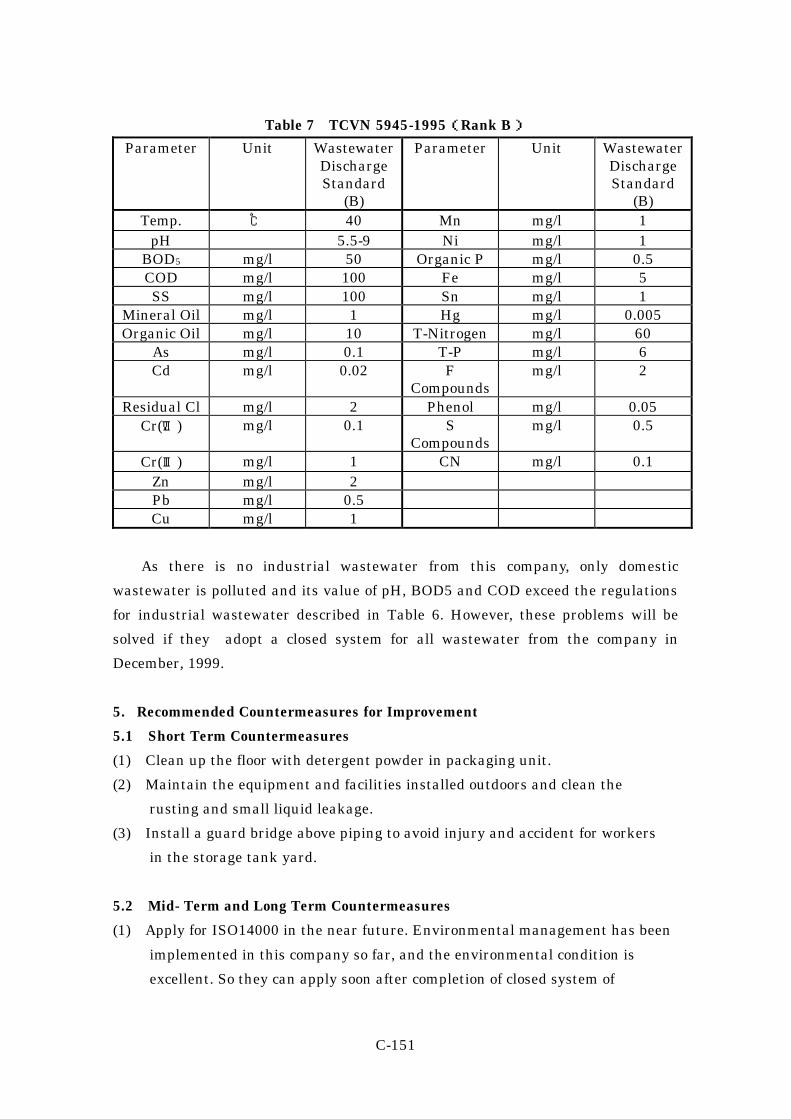
C-151
Table 7 TCVN 5945-1995(Rank B)
Parameter Unit Wastewater Discharge Standard
(B)
Parameter Unit Wastewater Discharge Standard
(B) Temp. ℃ 40 Mn mg/l 1
pH 5.5-9 Ni mg/l 1 BOD5 mg/l 50 Organic P mg/l 0.5 COD mg/l 100 Fe mg/l 5 SS mg/l 100 Sn mg/l 1
Mineral Oil mg/l 1 Hg mg/l 0.005 Organic Oil mg/l 10 T-Nitrogen mg/l 60
As mg/l 0.1 T-P mg/l 6 Cd mg/l 0.02 F
Compounds mg/l 2
Residual Cl mg/l 2 Phenol mg/l 0.05 Cr(Ⅵ) mg/l 0.1 S
Compounds mg/l 0.5
Cr(Ⅲ) mg/l 1 CN mg/l 0.1 Zn mg/l 2 Pb mg/l 0.5 Cu mg/l 1
As there is no industrial wastewater from this company, only domestic
wastewater is polluted and its value of pH, BOD5 and COD exceed the regulations
for industrial wastewater described in Table 6. However, these problems will be
solved if they adopt a closed system for all wastewater from the company in
December, 1999.
5. Recommended Countermeasures for Improvement
5.1 Short Term Countermeasures
(1) Clean up the floor with detergent powder in packaging unit.
(2) Maintain the equipment and facilities installed outdoors and clean the
rusting and small liquid leakage.
(3) Install a guard bridge above piping to avoid injury and accident for workers
in the storage tank yard.
5.2 Mid- Term and Long Term Countermeasures
(1) Apply for ISO14000 in the near future. Environmental management has been
implemented in this company so far, and the environmental condition is
excellent. So they can apply soon after completion of closed system of
C-152
domestic wastewater.
6. Notice
Lever Haso seems to be one of the most advanced companies in the chemical
industry in Viet Nam from the point of view of Cleaner Production and
Environmental Conservation. The company is recommended to be one of the model
companies in Vietnamese industry.

C-153
CASE STUDY C-11
Hai Phong Tia Sang Battery Company Survey Date : December 1, 1999
1. General
1.1 Profile
The company profile for Hai Phong Tia Sang Battery Company is summarized
in Table 1.
Table 1 Company Profile
Company Name: Hai Phong Tia Sang battery Company
Ownership: State owned
Address: Ton Duc Thang- Hai Phong City
Director: Mr. Nguyen Duy Sy
Established 1960
Corporate Capital
Number of Employees: 275 (20 engineers)
Main Products: Battery
Tia Sang Battery Company is one of the State-owned companies under MOI.
The company produces various kinds of batteries for domestic use and has been
expanding capacity, process technology and quality of its products. However, they
don’t produce any dry cell batteries and they have no plan to produce them in the
future.
1.2 Status of Business
Business for batteries is not so strong now and the operation rate of the plant
in 1998 is about 80% of production capacity. However, they have to keep up with
competition through expansion and improvement of existing facilities, especially in
regards to product quality.
(1) Production
Battery production in the beginning in the 1960’s was 2,000 batteries/y and
electricity consumption was 12,000kwh/y. However, production reached 178,000
batteries/y and electricity consumption rose to 1,656,000 kwh/y in 1998.
They are struggling to improve quality, including the life of the battery and to
lower the cost of their product.

C-154
They purchases raw materials, PbO at 10,000 VND/kg and H2SO4 at 2,000
VND/kg. H2SO4 is transferred from Lam Thao Superphosphates and Chemical Co.,
at a transportation rate of 300,000 VND/5,000 kg using a 5 T-pickup. There is a
storage tank for their H2SO4 near Hai Phong.
The ebonite casing is a little bit of a problem for consumers compared to plastic
casing and the market share of plastic casing reaches 60% because the appearance
is better than ebonite in spite of better strength and similar quality and cost.
The actual production for 1998 for their main product is shown in Table 2.
Table 2 Annual Production and Revenues in 1998
Product Production (Product) Revenue (x1000VND) Staring Battery 54,000 22,680,000 Motorbike Battery 120,000 8,400,000 Specialized Battery 4,000 3,600,000 Total 178,000 34,680,000
(2) Debt
There is no description.
2. Production Technology
2.1 Process
The production technology used for batteries is an integration of domestic
and foreign (Chinese, Korean and Russian) technology. The equipment for
production was imported from Taiwan and Korea. At first, the ebonite casing was
used for batteries, but they have made an investment to produce a new type of
casing which is made of plastics. Battery production process is shown in Figure 1.
Figure 1 Battery Production Process
Pb Powder
Grid Casting
Pasting H2SO4
Drying
Formation
Steam
H2SO4
Battery Assembling

C-155
2.2 Wastewater Source
In accordance with the increase in production, the volume of wastewater,
especially cooling water, has increased. The production facility is washed once a
day and effluent water contains PbSO4. They recover 4 kg PbSO4/day.
There is a big industrial wastewater treatment facility for neutralization, lime
bed ponds sized 2 m-in width, 15 m-in length and 1 m-in depth in 4 rooms’ of a
concrete vessel. However, the actual procedure is not appropriate and pH of
wastewater in not improved after even being sent to the huge lime bed. This means
heavy metals like Pb can not be precipitated as salt for removal from wastewater,
so the method which utilizes a lime bed is requested to be improved as soon as
possible.
Results of analysis for heavy metals had no problems in the past, and recent
results for Fe were 5.0 mg/l and 1.4 mg/l, and for Cd 0.5 mg/l and 0.48 mg/l.
Supply water is 210 m3/d of city water and part of it is used for the ebonite
casing unit at 50 m3/d, for the battery assembling unit at 5 m3/d, for the battery
production line at 72 m3/d and for boiler feed water at 23 m3/d. Wastewater from
these units are treated through a lime stone bed facility, common pond in the
factory, and discharged to the Re River. Periodical quality analysis of wastewater is
implemented annually by Hai Phong Agency under DOSTE, Ha Noi. Only a pH
check using pH testing paper is performed daily by the company.
The water system for intake water and wastewater are shown in Figure 2.
3. Management
3.1 General
The management of the factory seems to be good, especially for the
maintenance of the equipment, building and other facilities.
3.2 Annual Consumption of Raw Materials and Utilities
The actual consumption of raw materials, utilities and additives in 1998 as
well as cost are also shown in Table 3.

C-156
⑧210m3/d City Water ②
50m3/d ①
5m3/d
17m3/d
10m3/d ④
⑥ ③
⑤
Cooling Water
5m3/d
⑩
23m3/d
Figure 2 Water System and Sampling Points
⑦
Storage Tank
Ebonite Casing
Production
Lead Powder
Grid Casting
Pasting
Drying
Formation
Battery
Assembling
Boiler
Fou
r W
aste
wat
er T
reat
men
t T
anks
(
Lim
e S
ton
e)
Sedimentation
(for Pb Recovery)
To the Re River Pond
⑨
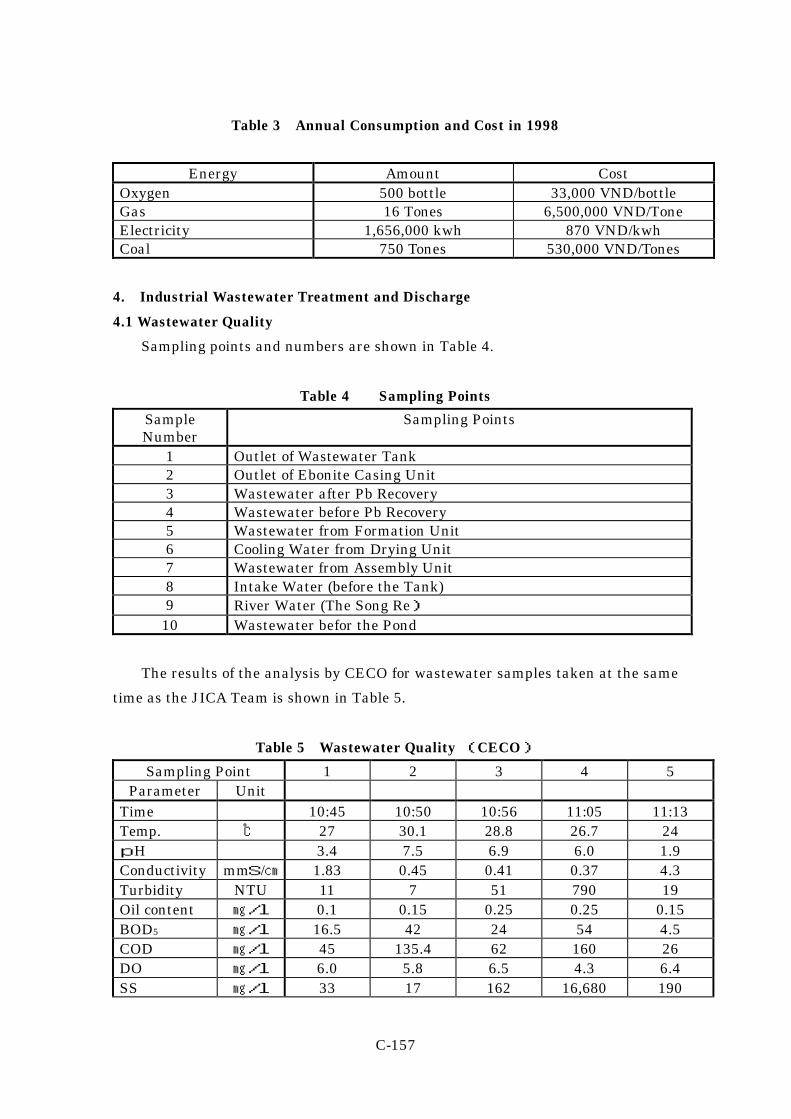
C-157
Table 3 Annual Consumption and Cost in 1998
Energy Amount Cost Oxygen 500 bottle 33,000 VND/bottle Gas 16 Tones 6,500,000 VND/Tone Electricity 1,656,000 kwh 870 VND/kwh Coal 750 Tones 530,000 VND/Tones
4. Industrial Wastewater Treatment and Discharge
4.1 Wastewater Quality
Sampling points and numbers are shown in Table 4.
Table 4 Sampling Points
Sample Number
Sampling Points
1 Outlet of Wastewater Tank 2 Outlet of Ebonite Casing Unit 3 Wastewater after Pb Recovery 4 Wastewater before Pb Recovery 5 Wastewater from Formation Unit 6 Cooling Water from Drying Unit 7 Wastewater from Assembly Unit 8 Intake Water (before the Tank) 9 River Water (The Song Re)
10 Wastewater befor the Pond
The results of the analysis by CECO for wastewater samples taken at the same
time as the JICA Team is shown in Table 5.
Table 5 Wastewater Quality (CECO)
Sampling Point 1 2 3 4 5 Parameter Unit
Time 10:45 10:50 10:56 11:05 11:13 Temp. ℃ 27 30.1 28.8 26.7 24 pH 3.4 7.5 6.9 6.0 1.9 Conductivity mmS/㎝ 1.83 0.45 0.41 0.37 4.3 Turbidity NTU 11 7 51 790 19 Oil content ㎎/l 0.1 0.15 0.25 0.25 0.15 BOD5 ㎎/l 16.5 42 24 54 4.5 COD ㎎/l 45 135.4 62 160 26 DO ㎎/l 6.0 5.8 6.5 4.3 6.4 SS ㎎/l 33 17 162 16,680 190

C-158
Sampling Point 1 2 3 4 5 Parameter Unit
T-nitrogen ㎎/l 8.12 11.32 14.18 14.57 7.33 CN ㎎/l 0.002 0.001 0.001 0.006 0.016 Phenol ㎎/l 0.001 0.005 <0.001 0.00 0.001 Residual Cl ㎎/l 0.04 0.02 0.02 0.05 0.07 SO4 ㎎/l 1,016 51 86 98 440 Fe ㎎/l 6.02 0.19 0.37 2.06 2.55 Cr(Ⅵ) ㎎/l 0.02 0.01 0.01 0.01 0.000 Pb ㎎/l 4.727 0.923 32.5 1,194.12 520.07
Sampling Point 6 7 8 9 10 Parameter Unit
Time 11:20 11:26 11:30 11:40 11:35 Temp. ℃ 33.5 26.8 44.4 23 27.6 pH 6.5 8.7 7.56 7.9 3.9 Conductivity mmS/㎝ 0.39 0.49 0.46 1.3 1.9 Turbidity NTU 11 15 5 116 10 Oil content ㎎/l 0.18 0.1 0.00 0.03 0.05 BOD5 ㎎/l 3 11 0.0 32 16 COD ㎎/l 14 36 4.3 91 49 DO ㎎/l 5.7 4.8 7.3 5.6 5.2 SS ㎎/l 31 28 32 147 17 T-nitrogen ㎎/l 9.86 8.72 15.46 14.59 11.43 CN ㎎/l 0.001 0.00 0.001 0.001 0.026 Phenol ㎎/l 0.005 0.003 0.005 0.00 0.001 Residual Cl ㎎/l 0.04 0.015 0.01 0.04 0.08 SO4 ㎎/l 47 42 41 54 40 Fe ㎎/l 0.43 0.11 0.12 0.49 4.68 Cr(Ⅵ) ㎎/l 0.000 0.01 0.01 0.01 0.00 Pb ㎎/l 0.064 0.031 0.014 0.132 0.717
4.2 Regulation Standards
Regulation Standards for Industrial Wastewater (Rank B) in Viet Nam are
shown in Table 6.

C-159
Table 6 TCVN 5945-1995( Rank B)
Parameter Unit Wastewater Discharge Standard
(B)
Parameter Unit Wastewater Discharge Standard
(B) Temp. ℃ 40 Mn mg/l 1
pH 5.5-9 Ni mg/l 1 BOD5 Mg/l 50 Organic P mg/l 0.5 COD Mg/l 100 Fe mg/l 5 SS Mg/l 100 Sn mg/l 1
Mineral Oil Mg/l 1 Hg mg/l 0.005 Organic Oil Mg/l 10 T-Nitrogen mg/l 60
As Mg/l 0.1 T-P mg/l 6 Cd Mg/l 0.02 F Compounds mg/l 2
Residual Cl Mg/l 2 Phenol mg/l 0.05 Cr(Ⅵ) Mg/l 0.1 S Compounds mg/l 0.5 Cr(Ⅲ) Mg/l 1 CN mg/l 0.1
Zn Mg/l 2 Pb Mg/l 0.5 Cu Mg/l 1
Discharged wastewater from the company, Sample No.10, shows higher data
on Pb and lower data on pH than the regulation standards. This means there is an
inappropriate operation of the neutralization pond and sedimentation pond
because the pH is almost neutral even at the inlet of the sedimentation pond
(Sample No.4) and at the outlet of another one (Sample No.3). Therefore, the lead
concentration is especially high, 32.5 mg/l, at the outlet.
5. Recommended Countermeasures for Improvement
5.1 Short Term Countermeasures
(1) Improve the pH control system for wastewater from the unit and keep pH on
the alkaline side to precipitate Pb salt efficiently.
(2) Improve the operation and equipment used in the huge neutralization pond
for packing lime stone so as to enable a sufficient reaction of Pb with CaCO3
on the surface of lime stone. Through this reaction, hindering CO2 will be
removed. In order to attain such targets the velocity of wastewater flow
should be increased by using buffer plates in the water stream of the pond, by
narrowing the stream, or by pouring in pressurized jet water.
(3) Prepare another kind of neutralization agent like Ca(OH)2 or wasted caustic
soda for efficient wastewater treatment.
C-160
5.2 Mid- Term and Long Term Countermeasures
(1) Apply for ISO 9000 in the near future. In order to apply, the factory and
facilities should be maintained cleanly and orderly, and documentation
system for production and quality control should be completed orderly.

C-161
CASE STUDY C-12
The Hanoi Battery Company
Survey Date : December 02, 1999
1. General
1.1 Profile
Ha Noi Battery Company is one of the state-owned companies under
VINACHEM, the Ministry of Industry. The Company Profile is shown in Table 1.
Table 1 Company Profile
Company Name: Ha Noi Battery Company
Ownership: State-owned
Address: Van Dien- Thanh Tri- Ha Noi
Director: Mr. Nguyen Xuan Cuong
Established 1960
Corporate Capital
Number of Employees: 653 (including 30 engineers)
Main Products: Different kinds of Batteries
The Hanoi Battery Corporation is one of the state-owned companies which
produce only conventional dry cell batteries, but they have produced many kinds of
dry cells so far. The company was established in 1960 and will have a 40 year
celebration soon. In the beginning stages of the company, there was no problem in
the company with environmental issues, because they were surrounded only by
fields, but nowadays, due to an increase in the population moving into the
community near the factory, many places were contaminated by domestic and
industrial waste. However, the company has complied with the law on the
environment and taken environmental protection countermeasures even though
their company is a state-owned one.
The company explained that MOI would not invest in environmental projects
without business profits from the state-owned enterprises, and that an investment
for environmental improvement should not be considered in the short term. As the
cost of investment for environmental facilities is included in their product prices,
the government of Viet Nam probably does not do this. They undertook a Japanese

C-162
supported project on environmental management a few years ago, the second of it's
kind for them, and they seem to be following the same path as chemical factories in
Thailand.
They are conscientious of their responsibility to comply with environmental
laws and regulations of Viet Nam and that the Government should make efforts for
sustainable development for long term issues even though financial resources are
limited.
1.2 Status of Business
The market for dry cells in Viet Nam has been rather good for their industry
over the past 40 years, enough for them to have increased production capacity.
However, recently the business situation is changing to a free market, and besides
the many producers entering the industry, low priced products from China and
high quality products from Japan have flown into this country. The excessive
supply is forcing them to lower their production rate to 75%.
(1) Production
The present capacity of dry cells is 150,000,000 cells/y, but the expected
production in 1999 is 90,000,000 cells/y. The original capacity in 1960 was
5,000,000 cells/y and the capacity reached 20,000,000 cells/y in 1990, but no further
expansion of capacity is expected at present. However a new production line for
improvement is going to be tested by Chinese engineers from Shang Hai.
Actual annual productions and revenues in 1998 are shown in Table 2.
Table 2 Annual Production sand Revenues in 1998
Battery Product label Rabbit Production (Cell) Revenue (VND) Electro-paste Cell (R14, R20, R40) 63,760,000 68,330,000,000 Pasted Paper Cell (R6p) 24,300,000 11,300,000,000 Alkali Cell (LR6) 13,000 32,000,000 Total 88,073,000 79,662,000,000
There are 3 boilers in the factory, but only 1 boiler in operation consumes boiler
feed water at 0.5t/d.
(2) Debt

C-163
2. Production Technology
2.1 Process
The production technology and facilities for dry cells consists of 3 process
technologies; ① Dry cells using MnO2, ② Electro-Paste, ③ Soda Alkali Cells
using paper technology which is the base technology of the company and also is a
rather new one developed and used by the company since 1994. ①and②are rely on
Chinese technology.
The management has future plans to introduce new technology from Japan by
a target date of 2005, especially for their key paper technology.
The cost of production is rather competitive so far compared even with Chinese
products. The main concern at present is their product quality. Consumers buy
high quality dry cells rather than low ones in spite of their expensive price. The top
policy of the company is to attain 4 objectives.
① Implement advanced and new technology
② Attain high quality, the same as Japan
③ Lower costs and prices to the same level as Chinese products
④ Environmental conservation
As for expansion of business, discussions were held for establishing a joint
venture company with Hitachi Maxell Co., Ltd and Fuji Battery Co., Ltd for
rechargeable dry cell production but an agreement has not been reached. The
company is also thinking about Ni-MH(Metal Hydrate) cell production to comply
with the demand for mobile phones but it costs too much to construct a new facility
at present market conditions.
2.2 Wastewater Resources
Wastewater from the company is estimated at 830 m3/d of which 150 m3/d is
industrial wastewater. A new wastewater treatment facility is just under
construction and will be starting operations within 1 month. The process was
designed by CECO and the equipment has been constructed by a domestic chemical
construction company.
The main treatment process consists of neutralization, flock processing and a
sedimentation unit. Wastewater is discharged to the Kim Nguu River almost with
no treatment and analysis is said to be performed regularly, once every 3-4days but
no results were shown to us.

C-164
Figure 1 Dry Cells Production Process
Well Water Supply for the Community
①
⑥
②
Figure 2 Water System and Sampling Points
To the Kim Nuguu River
MnO2,
Graphite,
C-Powder
NH4Cl
NH4Cl
ZnCl2
HgCl
Zn
Cathode
Powder
Mixing
Electrolysis
Solution
Preparation
Anode
Production
Assembling Product
Domestic Wastewater
380m3/d ④
CoolingWater300m3/d ③
⑦ ⑥
50m3/d
100m3/d
⑤
Cathode Powder
Mixing
Electrolysis Solution
Preparation
Assembling of
Electric Paste
Dry Cells
Anode Production
Wastewater Treatment
Facility
(under Construction)

C-165
The factory indicated that the latest EIA was performed by CECS in 1996. The
main concern of wastewater quality is the content of heavy metals and ammonium
ion contained in the raw material preparation unit. Supply water is drawn from a
deep well with pump capacity 160m3/h in the company. Water system and
sampling points are shown in Figure 2.
3. Management
3.1 General
The company is now preparing an application for ISO 9000 in the year 2000
and is also looking for a consultant from overseas.
3.2 Annual Unit Consumption and Cost
Annual unit consumption of raw materials for each products, additives and
utilities with annual consumption in 1998 are shown in Table 3.
Table 3 Annual Unit Consumption and Cost in 1998
Electro-paste Cells Pasted Paper Cells Alkali Cells Material Used
Amount Material Used
Amount Material Used
Amount
Natural MnO2
1,203 t Synthesis MnO2
45 t MnO2 Alkali 12 t
Synthesis MnO2
501 t Acetylene Black
15 t Graphite 2.1 t
Acetylene Black
146 t ZnCl2 4 t KOH 1.5 t
Graphite 148.5 t NH4Cl 3 t Zinc Powder 0.3 t NH4Cl 416.5 t Pasted
Paper 4 t CMC 0.05 t
Carbon Rod 300 t Carbon rod 28 t Distilled Water
22.31 t
Starch 150 t Zn 223 t Ethanol 9.6 t ZnCl2 24 t Bitumen 7 t Epoxy 0.3 t HgCl2 0.34 t Pine Resin 2 t Bitumen 0.3 t Pine Resin 25 t Paraffin 5 t Label &
Packing Paper
2.5 kg
Paraffin 50 t Label Paper 35 t Electricity 470 kwh Zn 1,200 t Electricity 234,000 kwh Bitumen 30 t Fuel Oil &
Diesel Oil 50 t

C-166
Electro-paste Cells Pasted Paper Cells Alkali Cells Label Paper 167 t Water 900 m3 Coal 90 t Fuel Oil & Diesel Oil
80 t
Electricity 703,000 kwh
4. Industrial Wastewater Treatment and Discharge
4.1 Wastewater Quality
Sampling points and each number are shown in Table 4. The results of the
analysis by CECO for wastewater samples taken at the same time as the JICA
Team are shown in Table 5.
Table 4 Sampling Points
Sampling Points Sample 1 Intake Water(Well Water) 2 Wastewater Discharged 3 Cooking Water 4 Domestic Wastewater 5 Wastewater from Electrolysis Solution Preparation Unit 6 Wastewater from Electrolysis Solution Preparation 7 Wastewater after mixing No.5 and No.6
Table 5 Results of the Analysis(CECO)
Sampling Point 1 2 3 4 Parameter Unit
Time 10:00 10:05 10:10 10:20 Temp. ℃ 23.5 24 26.5 25 pH 7.6 7.2 7.7 7.8 Conductivity MmS/cm 0.32 0.62 0.32 0.38 Turbidity NTU 1 25 3 25 Oil content mg/l 0.00 0.15 0.07 0.12 BOD5 mg/l 3 76 21 86 COD mg/l 16 124 30 124 DO mg/l 7.2 6.9 5.4 5.1 SS mg/l 2 56 14 71 T-nitrogen mg/l 4.02 6.78 5.37 14.59 CN mg/l 0.000 <0.001 <0.001 <0.001 Phenol mg/l <0.001 0.002 0.001 0.002 Residual Cl mg/l 0.02 0.08 0.03 0.09

C-167
Sampling Point 1 2 3 4 Parameter Unit
SO4 mg/l 1 2 0 3 Mn mg/l 2.84 10.76 2.94 2.78 Fe mg/l 1.67 1.42 1.58 1.69 Cr(Ⅵ) mg/l 0.01 0.04 0.01 0.02 Pb mg/l <0.001 0.002 <0.001 <0.001 Ni mg/l <0.001 0.002 <0.001 <0.001 Cd mg/l <0.001 0.001 <0.001 <0.001 Zn mg/l 0.02 8.7 1.28 17.4 Hg mg/l <10-5 1.78*10-3 10-5 8.49*10-3
Sampling Point 5 6 7 Parameter Unit
Time 10:25 10:30 10:55 Temp. ℃ 23.5 26.5 24.5 pH 6.8 7.2 7.0 Conductivity MmS/cm 6.7 2.1 1.2 Turbidity NTU 265 37 56 Oil content mg/l 0.1 0.12 0.25 BOD5 mg/l 287 205 272 COD mg/l 436 289 328 DO mg/l 5.9 5.5 6.3 SS mg/l 267 53 77 T-nitrogen mg/l 16.36 8.19 13.74 CN mg/l <0.001 <0.001 <0.001 Phenol mg/l 0.004 0.003 0.002 Residual Cl mg/l 0.12 0.05 0.04 SO4 mg/l 2 0.0 4 Mn mg/l 6.21 17.69 12.33 Fe mg/l 0.07 0.88 0.19 Cr(Ⅵ) mg/l 0.19 0.04 0.00 Pb mg/l 0.002 0.001 0.001 Ni mg/l 0.001 <0.001 <0.001 Cd mg/l 0.002 0.001 0.001 Zn mg/l 49.8 39.3 39.7 Hg mg/l 30.9*10-3 16.81*10-3 24.73*10-3
4.2 Regulation Standards
Regulation Standards for Industrial Wastewater (Rank B) in Viet Nam are
shown in Table 6.

C-168
Table 6 TCVN 5945-1995( Rank B)
Parameter Unit Wastewater Discharge Standard
(B)
Parameter Unit Wastewater Discharge Standard
(B) Temp. ℃ 40 Mn mg/l 1
pH 5.5-9 Ni mg/l 1 BOD5 mg/l 50 Organic P mg/l 0.5 COD mg/l 100 Fe mg/l 5 SS mg/l 100 Sn mg/l 1
Mineral Oil mg/l 1 Hg mg/l 0.005 Organic Oil mg/l 10 T-Nitrogen mg/l 60
As mg/l 0.1 T-P mg/l 6 Cd mg/l 0.02 F Compounds mg/l 2
Residual Cl mg/l 2 Phenol mg/l 0.05 Cr(Ⅵ) mg/l 0.1 S Compounds mg/l 0.5 Cr(Ⅲ) mg/l 1 CN mg/l 0.1
Zn mg/l 2 Pb mg/l 0.5 Cu mg/l 1
Hatching columns for Sample No.2 in Table 5 show values that exceed
regulations for BOD5, COD, Mn and Zn.
5. Recommended Countermeasures for Improvement
5.1 Short Term Countermeasures
(1) After installing wastewater treatment facilities, the effect these facilities
have should be strictly evaluated and the pH control should be performed
under optimum conditions in order to remove the precipitate of heavy metals
efficiently.
(2) Decrease the volume of wastewater used for washing water for containers of
raw materials, washing water for assembly unit, and floor and cooling water
for the dry cell assembly line.
(3) Recover all cooling water, estimated at 300m3/d and having almost the same
quality as supply water, from the deep well. The amount should be about
30% of the total water usage of the company.
(4) Clean up oil leakage on the floor and ground.
5.2 Mid-term and Long Term Countermeasures
(1) Prepare an application for ISO 14000 after receiving the certificate for ISO
C-169
9000. In order to apply for ISO 14000, it is necessary that the periodical EIA,
the activity on the environmental management, committee system, manager
system should be implemented in the near future.

C-170
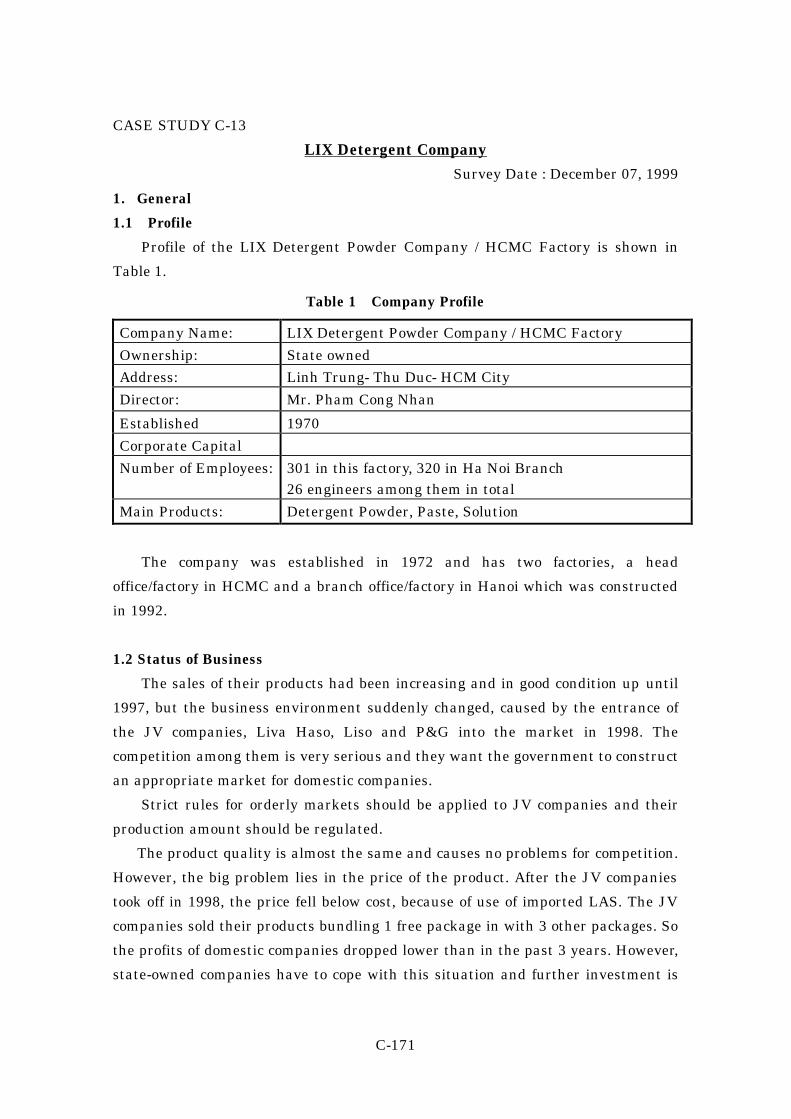
C-171
CASE STUDY C-13
LIX Detergent Company Survey Date : December 07, 1999
1. General
1.1 Profile
Profile of the LIX Detergent Powder Company / HCMC Factory is shown in
Table 1.
Table 1 Company Profile
Company Name: LIX Detergent Powder Company / HCMC Factory
Ownership: State owned
Address: Linh Trung- Thu Duc- HCM City
Director: Mr. Pham Cong Nhan
Established 1970
Corporate Capital
Number of Employees: 301 in this factory, 320 in Ha Noi Branch 26 engineers among them in total
Main Products: Detergent Powder, Paste, Solution
The company was established in 1972 and has two factories, a head
office/factory in HCMC and a branch office/factory in Hanoi which was constructed
in 1992.
1.2 Status of Business
The sales of their products had been increasing and in good condition up until
1997, but the business environment suddenly changed, caused by the entrance of
the JV companies, Liva Haso, Liso and P&G into the market in 1998. The
competition among them is very serious and they want the government to construct
an appropriate market for domestic companies.
Strict rules for orderly markets should be applied to JV companies and their
production amount should be regulated.
The product quality is almost the same and causes no problems for competition.
However, the big problem lies in the price of the product. After the JV companies
took off in 1998, the price fell below cost, because of use of imported LAS. The JV
companies sold their products bundling 1 free package in with 3 other packages. So
the profits of domestic companies dropped lower than in the past 3 years. However,
state-owned companies have to cope with this situation and further investment is

C-172
needed to update their technology, to increase their productivity and to realize
lower prices for their products.
They have been exporting a portion of their products to Iraq, Taiwan,
Cambodia, Singapore, New Zealand and to the Madagascar Islands.
Production trends and revenues of the company are shown in Table 2
Table 2 Production Trends and Revenues Unit 1993 1997 1998
Production t/y 10,405 36,275 26,508 Revenue Billion VND 72,467 223,981 128,114
(1) Production
Production capacity and technology for powder detergent, paste detergent and
liquid detergent are shown in Table 3.
Table 3 Production Capacity and Technology
Product Technology HCM Factory Ha Noi Factory Total Powder Deterget Italy
Domestic (Total)
15,000 t/y 30,000 t/y 45,000 t/y
-- 15,000 t/y 15,000 t/y
15,000 t/t 45,000 t/y 60,000 t/y
Paste Detergent Domestic 6,000 t/y 14,000 t/y 20,000 t/y Liquid Detergent Domestic 1,500 t/y 3,000 t/y 4,500 t/y
Powder detergent is produced through continuous operation, but paste
detergent and liquid detergent are produced through batch production. Raw
material, LAS, is purchased from domestic companies, for example TICO, rather
than importing from abroad. No heavy metals are used in production.
Unit consumption of raw materials for each product, additives and utilities
with annual consumption in 1998 and the first and second quarter in 1999 are
shown with its cost in Table 4.
Table 4 Production Capacity and Production in 1998 and in 1999
Production Designed Capacity (t/y)
1998 (t)
1st quarter 1999 (t)
2nd quarter 1999 (t)
Powder Detergent 15,000 10,221 1,565 2,103 Paste Detergent 6,000 501 83 113 Dish Washing Liq. 1,000 83 19 29 Washing Liq. 500 31 1 5
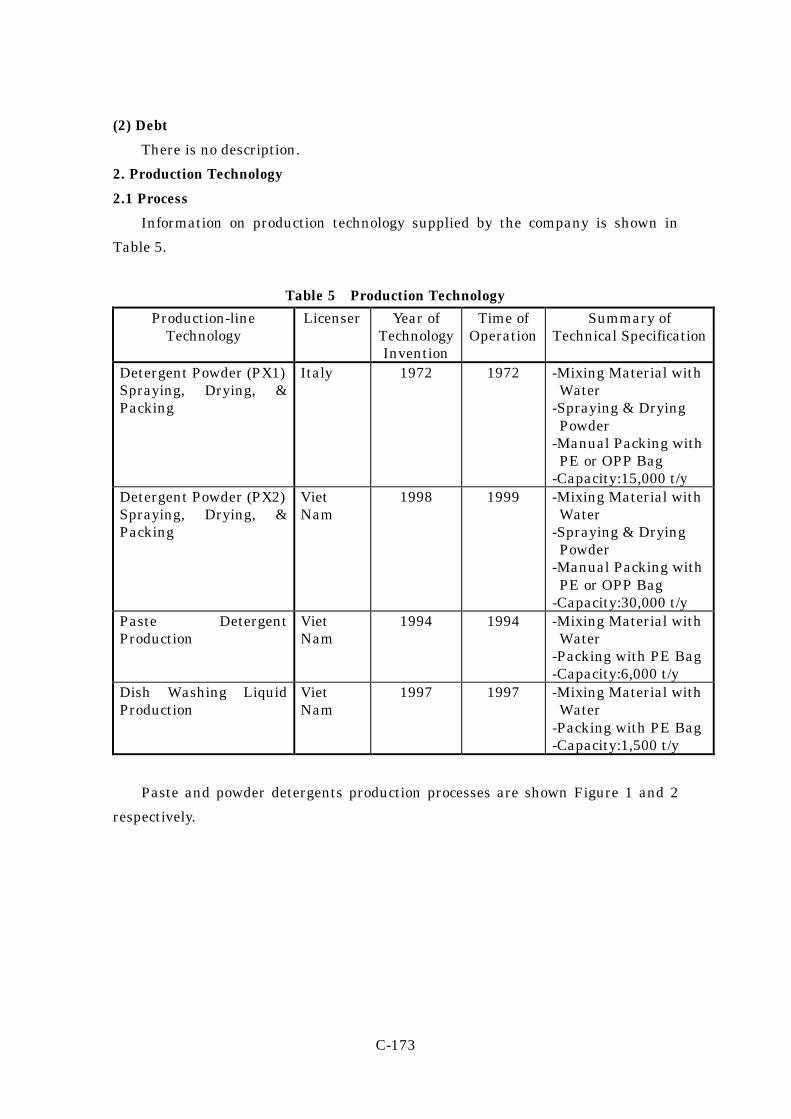
C-173
(2) Debt
There is no description.
2. Production Technology
2.1 Process
Information on production technology supplied by the company is shown in
Table 5.
Table 5 Production Technology
Production-line Technology
Licenser Year of Technology Invention
Time of Operation
Summary of Technical Specification
Detergent Powder (PX1) Spraying, Drying, & Packing
Italy 1972 1972 -Mixing Material with Water -Spraying & Drying Powder -Manual Packing with PE or OPP Bag -Capacity:15,000 t/y
Detergent Powder (PX2) Spraying, Drying, & Packing
Viet Nam
1998 1999 -Mixing Material with Water -Spraying & Drying Powder -Manual Packing with PE or OPP Bag -Capacity:30,000 t/y
Paste Detergent Production
Viet Nam
1994 1994 -Mixing Material with Water -Packing with PE Bag -Capacity:6,000 t/y
Dish Washing Liquid Production
Viet Nam
1997 1997 -Mixing Material with Water -Packing with PE Bag -Capacity:1,500 t/y
Paste and powder detergents production processes are shown Figure 1 and 2
respectively.

C-174
Figure 1 Paste Detergent Production Process
Figure 2 Powder Detergent Production Process
2.2 Source of Wastewater
Wastewater is discharged from washing facilities of exhausted gas from a
Solid Material Liquid Material
Mixer
Detergent Paste Bucketing
Mixer
Grinding & Filtration
BEC
Drying Tower Cyclone
Fine Powder
Screening Fragrant Oil Coarse
Powder
Packaging
Solid
Raw Material
Liquid
Raw Material
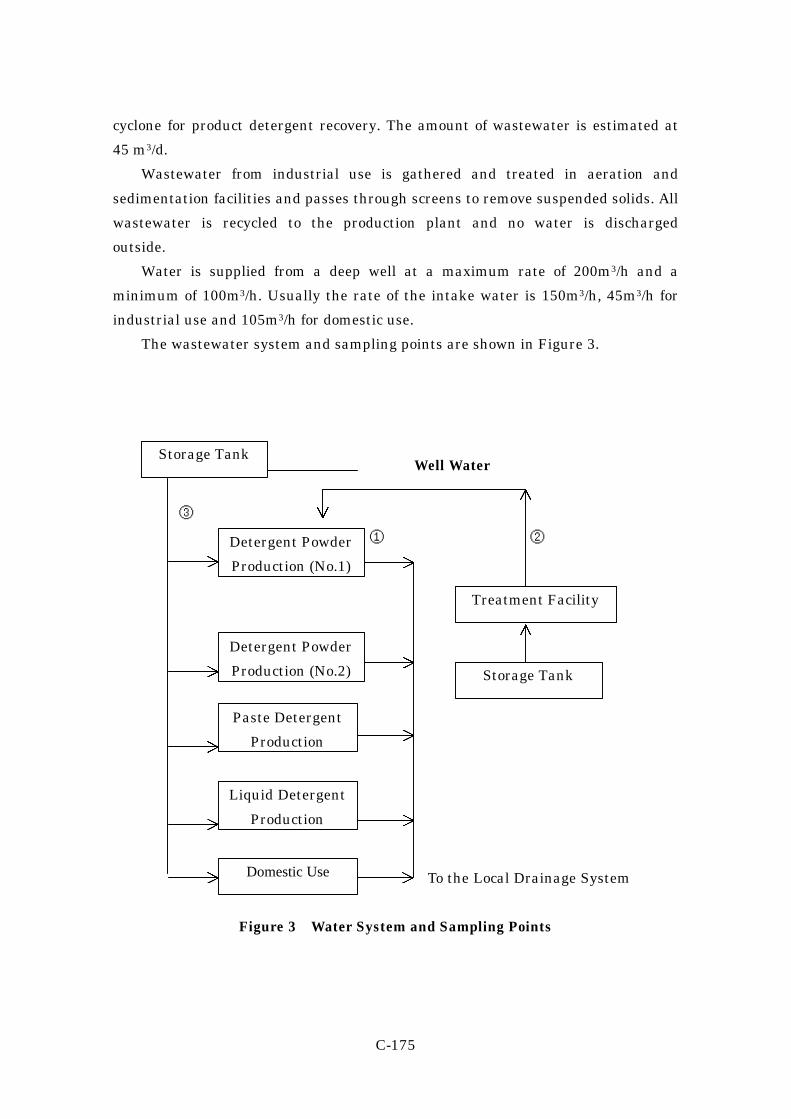
C-175
cyclone for product detergent recovery. The amount of wastewater is estimated at
45 m3/d.
Wastewater from industrial use is gathered and treated in aeration and
sedimentation facilities and passes through screens to remove suspended solids. All
wastewater is recycled to the production plant and no water is discharged
outside.
Water is supplied from a deep well at a maximum rate of 200m3/h and a
minimum of 100m3/h. Usually the rate of the intake water is 150m3/h, 45m3/h for
industrial use and 105m3/h for domestic use.
The wastewater system and sampling points are shown in Figure 3.
Well Water
③
① ②
To the Local Drainage System
Figure 3 Water System and Sampling Points
Detergent Powder
Production (No.1)
Detergent Powder
Production (No.2)
Paste Detergent
Production
Liquid Detergent
Production
Storage Tank
Treatment Facility
Domestic Use
Storage Tank

C-176
3. Management
3.1 General
There is some environmental impact from gases like SO2, CO2, CO and dust
caused by using fuel oil ( Sulfur content ; 2.28% ) at 60 l/1mt of product in the
drying unit only. Fuel oil consumption is about 35 mt/d for drying. There is a
scrubber for washing gases for preventing air pollution and the dust is recycled to
the process after washing. There is almost no solid waste, but foul odors come from
neighborhood hog raising farms. The company is in the process of applying for ISO
9000.
3.2 Annual Consumption of Raw Materials and Utilities
Annual Consumption of Raw Materials and Utilities in 1998 are shown in
Table 6.
Table 6 Annual Consumption and Cost in 1998
Material Used Form Purpose Amount (t/y) LAS Liquid BG, KG Production 1,170 Sodium Silicate Liquid BG, KG Production 5,060 NPE 90E Liquid NRC Production 0.8 CDE Liquid NRC Production 0.66 Liquid Al2(SO4)3 Liquid KG Production 22 Fuel Oil Liquid Spraying, Drying 631 Rubber Milk Liquid Box Adhesion 7 Aromatic Substance Liquid BG, KG, NRC Production 29.4 SLESS Liquid NRC Production 6.5 Sodium Sulfate Solid BG, KG, NRC Production 4,200 Soda Ash Solid BG, KG, NRC Production 1,250 STS Solid BG Production 108 CMC Solid BG Production 35.4 STPP Solid BG, KG Production 582 Whitener (1) Solid BG, KG Production 1.4 Whitener (2) Solid BG, KG Production 4.4 NaCl Solid KG, NRC Production 20 Caustic Soda Solid NRC Production 1.2 CaCO3 Solid KG Production 14
4. Industrial Wastewater Treatment and Discharge
Sample numbers and Sampling points are described in Table 7. And the results
of the analysis by CECO for wastewater samples taken at the same time as the
JICA Team are shown in Table 8. As it was stated in section 2.2, all process waster
is recycled in the factory and no water is discharged to outside.

C-177
Table 7 Sample Numbers and Sampling Point
Sample Number Sample Point 1 Wastewater from Powder Unit No.1 2 Recycling Water 3 Well Water
Table 8 Wastewater Quality (CECO)
Sampling Point 1 2 3 parameter Unit
Time 10:33 11:00 11:15 Temp. ℃ 28 27 27 pH 9.7 10.2 6.9 Conductivity mmS/㎝ 2.2 8.41 0.008 Turbidity NTU 104 49 0 Oil content ㎎/liter 0.10 0.07 <0.01 BOD5 ㎎/liter 650 367 1 COD ㎎/liter 1,200 1,040 4.8 DO ㎎/liter 6.7 6.4 6.6 SS ㎎/liter 216 36 0 T-nitrogen ㎎/liter 6.24 4.68 3.12 CN ㎎/liter 0.011 0.007 <0.001 Phenol ㎎/liter 0.013 0.01 <0.001 Residual Cl ㎎/liter 0.84 0.39 0.01 SO4 ㎎/liter 725 6,375 0.00 T-P ㎎/liter 21.58 6.12 0.06 Las ㎎/liter 2,058 1,326 0.00
5. Recommended Countermeasures for Improvement
5.1 Short Term Countermeasures
(1) Take countermeasures to control oil leakage from production equipment in
house and the oil storage tank unit outdoors and maintain the clean condition
of the factory.
(2) Check the quality of recycling water in order to maintain the quality of
circulating water and products for finding the improving points continuously.
(3) Take countermeasure to save product loss in the packaging unit. Especially,
procedure for measuring work of products and packaging work should be
improved. For example, install a cover and dust collector to the packaging
facilities.

C-178
5.2 Mid-term and Long Term Countermeasures
(1) Install automatic packaging equipment precisely in order to control productivity
by reducing product loss, decreasing personnel cost, and improving
environmental conditions.
(2) Prepare application for ISO 14000 after receiving the certificate for ISO
9000. In order to apply for ISO 14000, it is necessary that the periodical EIA,
the activity on the environmental management, committee system, manager
system should be implemented in the near future.

C-179
CASE STUDY C-14
The Southern Rubber Industry Company
Survey Date: December 08, 1999
1. General
1.1 Profile
The Southern Rubber Industry Company is one of the State-owned company
under VINACHEM, Ministry of Industry. The factory profile is summarized in
Table 1.
Table 1 Company Profile
Company Name: Southern Rubber Industry Company / Hoc Mon Factory Ownership: State-owned
Address: 180 Ng. T. Minh Khai- Pre. 3-HCM City Director: Mr. Le Binh Thuan
Established 1969 ; in 1976, joined CASUMINA Corporate Capital Number of Employees: 700 including 30 engineers for this factory
Main Products: Tires, Rubber Gloves, Rubber Tubes
The company was established in 1960 by a French owned company related to
Michelin, one of the biggest tire producers in the world. The company changed over
to a state-owned company with several subsidiary enterprises in 1976 as
CASUMINA. There are 6 enterprises in CASUMINA, 4 factories and 2 joint
venture enterprises in Southern Viet Nam. One of 2 JV enterprises is jointed with
YOKOHAMA Tire Co., located in the Tan Binh Rubber factory.
Their main products are tube tires and tubeless tires for industrial use and for
motorcycles & scooters, bicycle tires & tubes, tires & tubes for tractor/light,
truck/fork lift, and other rubber products.
1.2 Status of Business
Turnover of the company was 10 million US$/y in 1998 and has been
increasing at 5-10%/y over the last 5 years. The company has been exporting their
products to Western countries and Eastern Asian countries at 3 million US$/y.
(1) Production
The mixing unit for motorcycle tires and car tires among the three main

C-180
production units has a strong environmental impact, especially for wastewater. The
lubricant oil from mixing machines is constantly spilling out and going into
wastewater facilities. The consumption amount of lubricant oil is estimated at
1,000l/every month. They recover waste oil from wastewater facilities and sell it to
a recycling trader.
Some portion of the raw materials for rubber products are imported from
Japan, JSR Co., and Nippon Zeon Co. There are 2 boilers and a diesel generator.
Actual annual production and revenues are shown in Table 2.
Table 2 Annual Production and Revenues in 1998
Product Production Revenue(VDN)
Bicycle Tires 1,145,588 15,465,438,000 Bicycle Tubes 4,493,758 22,468,920,000 Baby Tires 1,516,358 22,745,370,000 Baby Tubes 51,834 356,421,000 Motorbike Tires 340,119 1,530,535,500 Motorbike Tubes 1,616,530 2,3,439,685,000
Total 86,066,369,500
(2) Debt
Total debt is 20,000 million VND,which includes 560 million VND with a
commercial bank and 300 million VND with the National Bank.
2. Production Technology
2.1 Process
Figure 1 shows tires production process.
Figure 1 Tires Production Process
Rubber Chemicals Additives Textile Rank
Mixing & Rolling Formation
Sulfurification Packaging

C-181
2.2 The Source of Wastewater
Water is supplied to totally from a deep well at 2,400m3/d and more than 90%
of it is used for cooling water for intermediate and end-products and 10% is for
domestic use. There are 3 wells in the factory, and 2 of them are rather old,
containing much Fe and a low pH of about 4.5. So they use only one new well and
well water is treated by removing Fe, neutralization with lime, sedimentation by
CaSO4 and filtration through activated carbon.
Industrial wastewater mixed with water from the subsidiary company is
treated by an oil separator which has 2 rooms for heavy oil and light oil, and at a
sedimentation facility before being discharged into the Tham Luong River which
flows into the Sai Gon River 30km down stream. The physical wastewater
treatment system with skimming facilities for oil removal was designed by an
environmental technical company in Viet Nam.
Though the wastewater from these companies is mainly used for cooling and is
rather clean, it actually seems to contain oil even downstream of the separator
where grease can still be observed on the surface of the river. The causes of the oil
spill are leakage of lubricant oil from rotating machines, of fuel oil from boiler on
facilities and of waste oil from oil drums onto the road.
An analysis of the wastewater is carried out annually.
The water system and sampling points are described in Figure 2.

C-182
①
Well Water
②
⑤
450m3
20m3 700m3
30m3
2.5m3
120m3
80m3
Figure 2 Water System and Sampling Points
3. Management
3.1 General
The company received the certificate of ISO 9002 as CASUMINA in May, 1999,
but they have no plans to apply for ISO 14000 as of yet. 3.2 Annual consumption of raw materials and utilities Annual consumption of raw materials for each product, additives and utilities
with their costs in 1998 are shown in Table 3.
⑥ To the Than Luong River
Treatment Facilities
Brother Factory
Mixing
Rolling
Tire Pressing
Tube Pressing
Boiler
Domestic
Wastewater Treatment
③
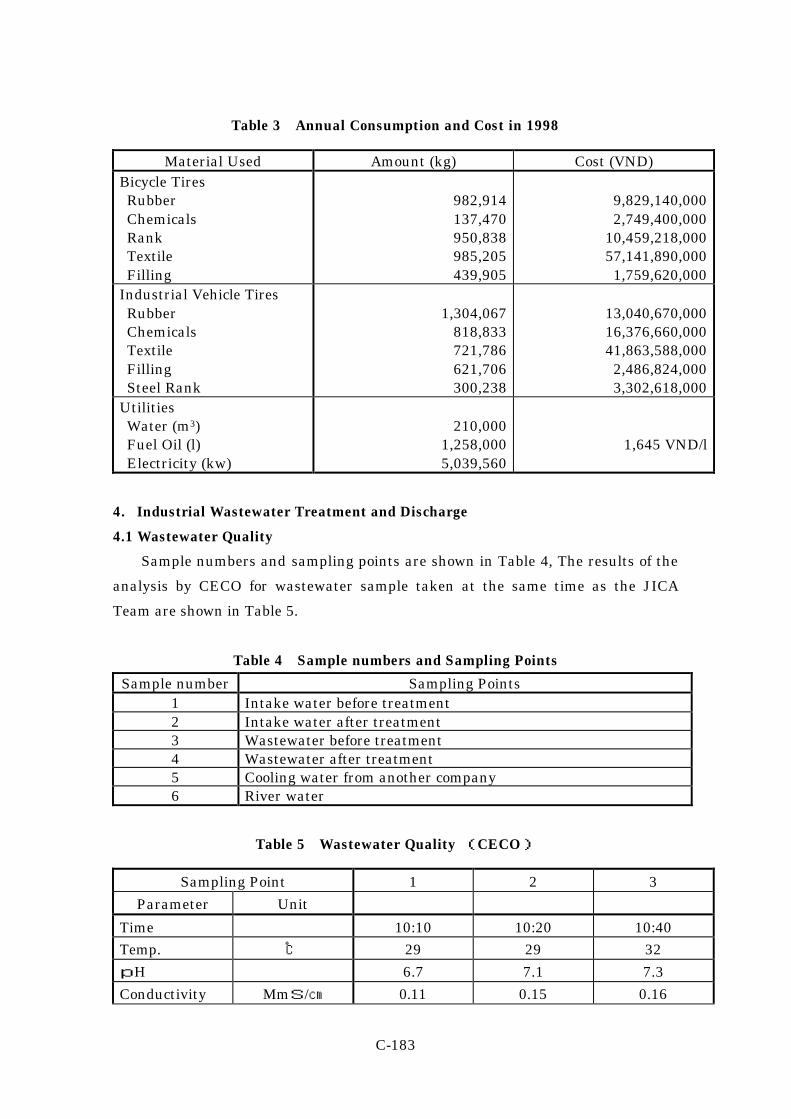
C-183
Table 3 Annual Consumption and Cost in 1998
Material Used Amount (kg) Cost (VND) Bicycle Tires Rubber Chemicals Rank Textile Filling
982,914 137,470 950,838 985,205 439,905
9,829,140,000 2,749,400,000
10,459,218,000 57,141,890,000 1,759,620,000
Industrial Vehicle Tires Rubber Chemicals Textile Filling Steel Rank
1,304,067
818,833 721,786 621,706 300,238
13,040,670,000 16,376,660,000 41,863,588,000 2,486,824,000 3,302,618,000
Utilities Water (m3) Fuel Oil (l) Electricity (kw)
210,000
1,258,000 5,039,560
1,645 VND/l
4. Industrial Wastewater Treatment and Discharge
4.1 Wastewater Quality
Sample numbers and sampling points are shown in Table 4, The results of the
analysis by CECO for wastewater sample taken at the same time as the JICA
Team are shown in Table 5.
Table 4 Sample numbers and Sampling Points
Sample number Sampling Points 1 Intake water before treatment 2 Intake water after treatment 3 Wastewater before treatment 4 Wastewater after treatment 5 Cooling water from another company 6 River water
Table 5 Wastewater Quality (CECO)
Sampling Point 1 2 3
Parameter Unit
Time 10:10 10:20 10:40
Temp. ℃ 29 29 32
pH 6.7 7.1 7.3
Conductivity MmS/㎝ 0.11 0.15 0.16

C-184
Sampling Point 1 2 3
Parameter Unit
Turbidity NTU 10 0 6
Oil content ㎎/l 0.00 0.00 0.14
BOD5 ㎎/l 9 4 19
COD ㎎/l 32 8 29
DO ㎎/l 6.7 7.1 6.5
SS ㎎/l 7 0 6
T-nitrogen ㎎/l 2.32 2.11 7.41
CN ㎎/l <0.001 <0.001 0.008
Phenol ㎎/l <0.001 <0.001 0.002
Residual Cl ㎎/l 0.16 0.02 0.06
SO4 ㎎/l 13 11 16
Fe ㎎/l 5.625 0.07 0.24
Sampling Point 4 5 6
Parameter Unit
Time 10:45 12:30 11:35
Temp. ℃ 33 30.5 29.8
pH 7.2 7.7 7.0
Conductivity MmS/㎝ 3.6 0.15 0.39
Turbidity NTU 10 6 80
Oil content ㎎/l 0.16 0.22 0.20
BOD5 ㎎/l 11 15.2 101
COD ㎎/l 19 32 360
DO ㎎/l 6.7 6.3 1.3
SS ㎎/l 5 4 263
T-nitrogen ㎎/l 7.33 4.68 12.40
CN ㎎/l 0.005 0.002 0.004
Phenol ㎎/l <0.001 0.002 0.015
Residual Cl ㎎/l 0.07 0.08 0.8
SO4 ㎎/l 15 14 39
Fe ㎎/l 0.20 0.22 2.08
4.2 Regulation Standards for Industrial Wastewater
In order to check result of analysis for sample 4, wastewater discharge to a
river, with regulation standards, Regulation Standards for Industrial Wastewater
(Rank B) in Viet Nam are shown in Table 6.
The quality of the river water seems to be the worst, its color is black and its

C-185
smell is strong and bad. The condition of the Tham Luong River is said not to have
changed over the last 20 years. This is because of discharge of industrial
wastewater from many enterprises, such as a textile factory and food processing
factory, as well as discharged domestic wastewater. In order to improve this
terrible condition, it is necessary to take action for countermeasures to improve
wastewater from each factory and remove bottom soil in the river.
Table 6 TCVN 5945-1995(Rank B)
Parameter Unit Wastewater Discharge
Standard (B)
Parameter Unit Wastewater Discharge Standard
(B) Temp. ℃ 40 Mn mg/l 1
pH 5.5-9 Ni mg/l 1 BOD5 mg/l 50 Organic P mg/l 0.5 COD mg/l 100 Fe mg/l 5 SS mg/l 100 Sn mg/l 1
Mineral Oil mg/l 1 Hg mg/l 0.005 Organic Oil mg/l 10 T-Nitrogen mg/l 60
As mg/l 0.1 T-P mg/l 6 Cd mg/l 0.02 F Compounds mg/l 2
Residual Cl mg/l 2 Phenol mg/l 0.05 Cr(Ⅵ) mg/l 0.1 S Compounds mg/l 0.5 Cr(Ⅲ) mg/l 1 CN mg/l 0.1
Zn mg/l 2 Pb mg/l 0.5 Cu mg/l 1
5. Recommended Countermeasures for Improvement
5.1 Short Term Countermeasures
(1) Remove oil spillage on the floor, on the road of the mixing unit and on the
boiler unit.
(2) Recover oil leakage, and lubricant oil from the mixing machine through
installing oil receiver and oil recovery piping system.
(3) Take countermeasure to stop oil leakage from the equipment in the mixing
unit and from the boiler feed oil storage tank unit through reinforcement of
periodical maintenance.
(4) Reduce cooling water consumption by recycling after checking the quality of
the water.

C-186
These countermeasures will result in a decrease of water discharge, water
consumption, maintenance cost and lubricant oil purchasing.
(5) Strive for more cooperation between the environmental department and the
production department for improving equipment, productivity and
environmental conditions.
5.2 Mid- term and Long Term Countermeasures
(1) Prepare an application for ISO14000 in the near future. In order to apply for
ISO 14000, it is necessary that the periodical EIA, the activity on the
environmental management, committee system, manager system should be
implemented in the near future.
(2) Not only this factory is the cause of polluted water in the river, however, very
bad condition such as black colored water, foul odors, hasn’t been changed for
20 years. This is caused by many textile factories, and food processing
factories along the river, and domestic wastewater from the houses in this
neighborhood.
As countermeasure for this, Restoration and Cleaning of the Tham Luong
River with strong cooperation among the Central Government, Local
Government, the enterprises and local inhabitants are necessary.
C-187
CASE STUDY C-15
Southern Vietnam Basic Chemicals Company / Tan Binh Chemical Factory
Survey Date : December 09, 1999
1. General
1.1 Profile
The Tan Binh Chemical Factory is a factory belonging to the South Vietnam
Basic Chemicals Company, a state-owned company, that produces basic chemicals.
The company profile is summarized in Table 1
Table 1 Company Profile
Company Name: Southern Basic Chemical Company / TAN BINH Chemical Factory
Ownership: State owned
Address: 22 Ly Tu Trong-Pre.1- HCM City
Director: Mr. Nguyen Do Ky
Established 1917
Corporate Capital
Number of Employees: 210 including 8 engineers
Main Products: H2SO4, Al(OH)3
The company has 4 factories and 1 research facility. The company was
established in 1917 and the production of sulfuric acid, aluminum hydroxide and
aluminum sulfate was started with technological support from a Taiwanese
company.
Production ability for sulfuric acid was 12,000t/y at the beginning, however, it
reaches 18,000 t/y now. The selling price has been stable, and the production rate
has been growing satisfactory. We would like to improve production amount with
increasing productivity, not with installing more production lines.
Also, in order to strengthening environmental management, we would like to
suggest them to plan to get ISO 9000 certification in 2000.
1.2 Status of Business
(1) Production
Revenue of the company and price of their products are almost stay in these
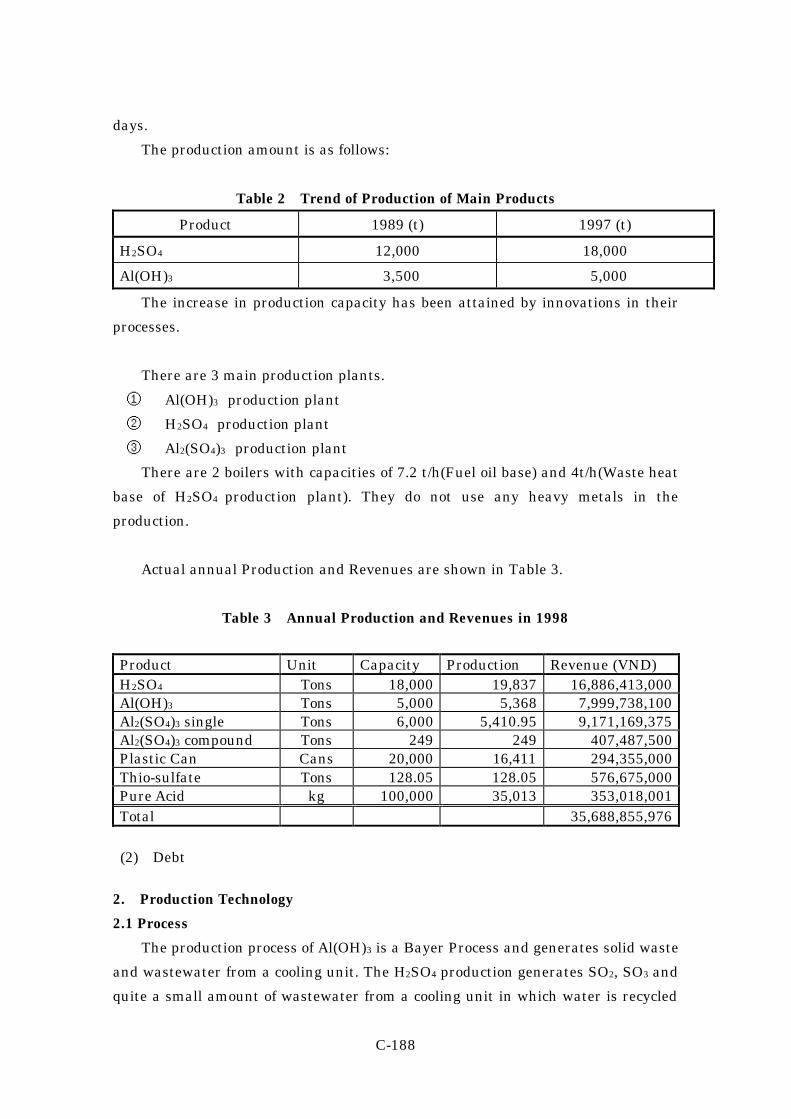
C-188
days.
The production amount is as follows:
Table 2 Trend of Production of Main Products
Product 1989 (t) 1997 (t)
H2SO4 12,000 18,000
Al(OH)3 3,500 5,000
The increase in production capacity has been attained by innovations in their
processes.
There are 3 main production plants.
① Al(OH)3 production plant
② H2SO4 production plant
③ Al2(SO4)3 production plant
There are 2 boilers with capacities of 7.2 t/h(Fuel oil base) and 4t/h(Waste heat
base of H2SO4 production plant). They do not use any heavy metals in the
production.
Actual annual Production and Revenues are shown in Table 3.
Table 3 Annual Production and Revenues in 1998
Product Unit Capacity Production Revenue (VND) H2SO4 Tons 18,000 19,837 16,886,413,000 Al(OH)3 Tons 5,000 5,368 7,999,738,100 Al2(SO4)3 single Tons 6,000 5,410.95 9,171,169,375 Al2(SO4)3 compound Tons 249 249 407,487,500 Plastic Can Cans 20,000 16,411 294,355,000 Thio-sulfate Tons 128.05 128.05 576,675,000 Pure Acid kg 100,000 35,013 353,018,001 Total 35,688,855,976
(2) Debt 2. Production Technology
2.1 Process
The production process of Al(OH)3 is a Bayer Process and generates solid waste
and wastewater from a cooling unit. The H2SO4 production generates SO2, SO3 and
quite a small amount of wastewater from a cooling unit in which water is recycled

C-189
now.
Wastewater from both processes are mixed into one channel before being
discharged. The Al2(SO4)3 production unit generates no wastewater.
Renovation of production technology is needed for improving productivity and
more environmental protection is requested for gas emission and wastewater
discharge into the community.
Figure 1 shows aluminum hydroxide production process, Figure 2 shows
sulfuric acid production process, and Figure 3 shows aluminum sulfate production
process.
Figure 1 Aluminum Hydroxide Production Process
Figure 2 Sulfuric Acid Production Process Side Product
30% NaOH sol. recycle
Bauxite
Wet Grinding
Screening
Mixing
Dilution
Reaction
Sedimentation
Crystallization
Filtration
Packaging
Concentration
Sludge
Washing
Drying
NaOH solution
Sulfur Combustion Dust Filter Oxygenation
Cooling Product
(H2SO4 )
Gas Treatment Na2CO3 solution
Absorption
Waste Gas

C-190
Dissolved Dust
Figure 3 Aluminum Sulfate Production Process
2.2 The Source of Wastewater
The capacity of supply water from a deep well is about 1,680 m3/d and water
consumption is almost the same amount as the supply water. For domestic use the
volume is; 192m3/d, for boiler feed water; 96m3/d and for industrial use as cooling
water: 1,400m3/d.
Well water shows strong acidity with a high Fe concentration and a metal-like
odor. In addition, clothes are smeared after washing. This water is not adequate
for drinking and the factory installed treatment facilities for neutralization, Fe
removal and filtration. Boiler feed water is treated through the ion exchange unit.
Domestic wastewater is discharged independently to the Tham Luong River.
Industrial wastewater is basically, recycled efficiently. For example, steam
condensate is reused as boiler feed water and is also partly used for mixing with
wastewater from the Al(OH)3 plant. Also wastewater from the H2SO4 plant is
recycled to its process as cooling water and utilized for neutralization with
wastewater from the Al(OH)3 plant. The H2SO4 production unit has a recycled
cooling water system relating to the intake water unit, and it includes a softening
treatment.
Furthermore, wastewater from the Al(OH)3 plant is mixed with wastewater
from the washing facilities of H2SO4 cans. The company explained that all of this
H2SO4 Al(OH)3
Reactor
Crystallization
Grinding Dust Vacuum Fan
Water based
Dust Washing Tower
Packaging

C-191
wastewater is treated before being discharged to the Tham Luong River after
checking its pH at a volume of around 1,000m3/d. They also explained that
periodical analysis of well water and wastewater is undertaken themselves, weekly.
The water system is described in Figure 4.
1,680m3/d
Well Water
② ①
192m3/d
96m3/d
③ A
⑦ ⑤⑥
④
⑧
the Tam Luong River
⑨
Figure 4 Water System and Sampling Points
Neutralization
Domestic Use
Boiler
H2SO4 Production
Al(OH)3 Production
Acid Container Washing
Al2(SO4)3 Production Pond
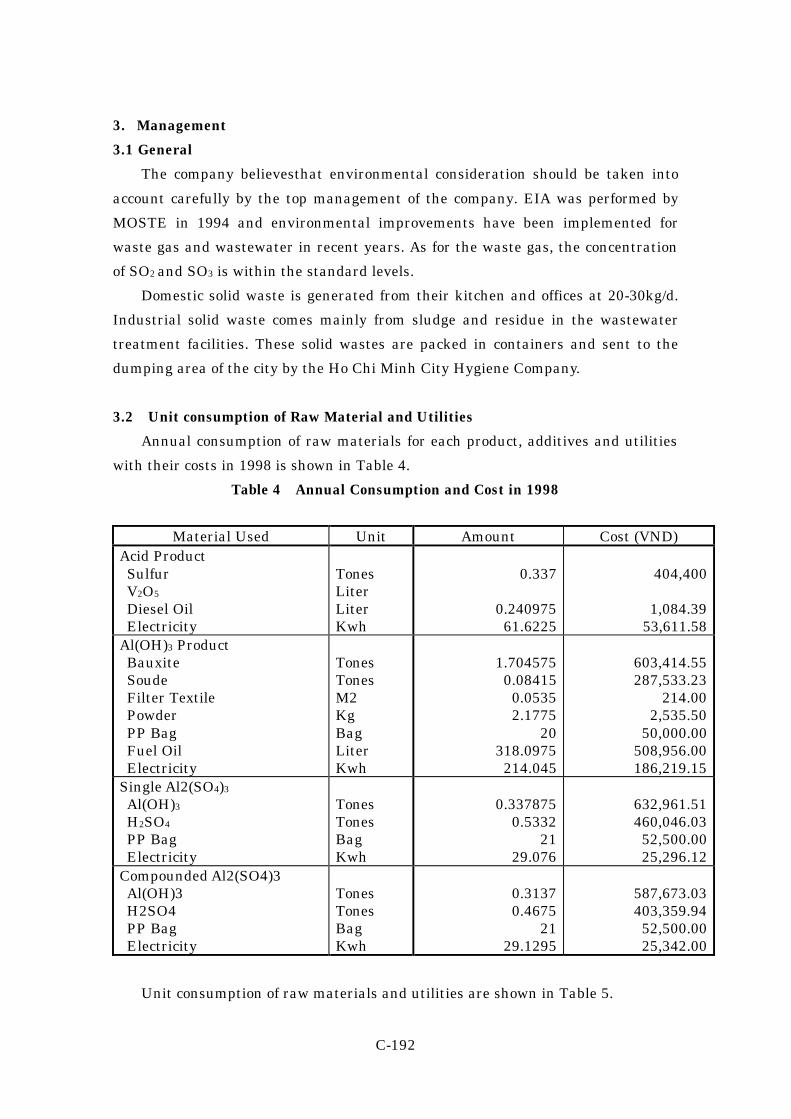
C-192
3. Management
3.1 General
The company believesthat environmental consideration should be taken into
account carefully by the top management of the company. EIA was performed by
MOSTE in 1994 and environmental improvements have been implemented for
waste gas and wastewater in recent years. As for the waste gas, the concentration
of SO2 and SO3 is within the standard levels.
Domestic solid waste is generated from their kitchen and offices at 20-30kg/d.
Industrial solid waste comes mainly from sludge and residue in the wastewater
treatment facilities. These solid wastes are packed in containers and sent to the
dumping area of the city by the Ho Chi Minh City Hygiene Company.
3.2 Unit consumption of Raw Material and Utilities
Annual consumption of raw materials for each product, additives and utilities
with their costs in 1998 is shown in Table 4.
Table 4 Annual Consumption and Cost in 1998
Material Used Unit Amount Cost (VND) Acid Product Sulfur V2O5 Diesel Oil Electricity
Tones Liter Liter Kwh
0.337
0.240975 61.6225
404,400
1,084.39
53,611.58 Al(OH)3 Product Bauxite Soude Filter Textile Powder PP Bag Fuel Oil Electricity
Tones Tones M2 Kg Bag Liter Kwh
1.704575 0.08415
0.0535 2.1775
20 318.0975 214.045
603,414.55 287,533.23
214.00 2,535.50
50,000.00 508,956.00 186,219.15
Single Al2(SO4)3 Al(OH)3 H2SO4 PP Bag Electricity
Tones Tones Bag Kwh
0.337875
0.5332 21
29.076
632,961.51 460,046.03 52,500.00 25,296.12
Compounded Al2(SO4)3 Al(OH)3 H2SO4 PP Bag Electricity
Tones Tones Bag Kwh
0.3137 0.4675
21 29.1295
587,673.03 403,359.94 52,500.00 25,342.00
Unit consumption of raw materials and utilities are shown in Table 5.

C-193
Table 5 Unit Consumption of Raw Materials and Utilities
Name Consumption Bauxite 1.7 t/t-Al(OH)3 Sulfur 0.34 t/t-H2SO4 Caustic soda 100% 70 kg/t-Al(OH)3
4. Industrial Wastewater Treatment and Discharge
4.1 Wastewater Quality
Table 6 shows sample numbers and sample points. The results of the analysis
by CECO for wastewater samples are shown in Table 7.
Table 6 Sampling Points
Sample number Sampling Points 1 Supply Water after Treatment 2 Supply Water before Treatment 3 Wastewater from H2SO4 Production Unit 4 Wastewater before Discharging to the river (Inside the Factory) 5 Wastewater from Al(OH)3 Production Unit mixed with Washing
Water for Acid Container 6 Wastewater from Al(OH)3 Production Unit mixed with Washing
Water for Acid Container(30min after the sample 5 was taken) 7 Wastewater from Al(OH)3 Production Unit 8 Wastewater just before Dischargint to the river (Outside the
Factory) 9 River Water (500m Upstream from the Discharge Point)
There was some trouble and fluctuation in the factory while we were there, so
there is a difference between the data, sample number 5 and 6, during the 30
minute interval that sampling took place . However, the causes were not known at
that time.
Table 7 Wastewater Quality (CECO)
Sampling Point 1 2 3 4 5 Parameter Unit
Time 10:20 10:30 10:40 10:50 10:55 Temp. ℃ 32 29 36.5 34 29 pH 7.6 6.1 3.5 2.9 2.4 Conductivity mmS/cm 0.43 0.35 0.55 3.9 7.8 Turbidity NTU 1 8 4 14 42 Oil content mg/l <0.01 <0.01 - 0.12 0.14 BOD5 mg/l 5 6 - 36 14 COD mg/l 15 36 - 96 44 DO mg/l 6.6 5.4 - 3.7 4.3 SS mg/l 6 14 5.4 147 35

C-194
Sampling Point 1 2 3 4 5 Parameter Unit
T-nitrogen mg/l 2.73 6.21 - 12.2 11.31 CN mg/l <0.001 <0.001 - 0.006 0.023 Phenol mg/l <0.001 <0.001 - 0.001 0.015 Residual Cl mg/l 0.02 0.06 - 0.01 0.09 SO4 mg/l 20.7 64 - 171 624 Fe mg/l 0.13 12.32 - 10.6 16.56
Sampling Point 6 7 8 9 Parameter Unit
Time 11:20 10:30 11:40 11:52 Temp. ℃ 30 33.1 35 27 pH 11.9 6.7 3.9 7 Conductivity mmS/cm 6.8 0.39 1.5 0.26 Turbidity NTU 33 117 1 35 Oil content mg/l 0.18 0.20 0.28 0.13 BOD5 mg/l 24 20 24 68 COD mg/l 70 56 64 138 DO mg/l 3.1 6.5 3.2 3.8 SS mg/l 119 113 18 79 T-nitrogen mg/l 6.24 8.11 4.89 5.62 CN mg/l 0.01 0.02 0.07 0.03 Phenol mg/l 0.012 0.010 0.010 0.012 Residual Cl mg/l 0.022 0.08 0.05 0.017 SO4 mg/l 750 82 300 14 Fe mg/l 16.58 12.08 11.92 3.6
4.2 Regulation Standards for Industrial Wastewater
Regulation Standards for Industrial Wastewater (Rank B) in Viet Nam are
shown in Table8.
According to the comparison of data between sample No.8 in Table 7 and in
Table8, pH and Fe concentrations exceed the regulation standards.
Table 8 TCVN 5945-1995( Rank B)
Parameter Unit Wastewater Discharge Standard
(B)
Parameter Unit Wastewater Discharge Standard
(B) Temp. ℃ 40 Mn mg/l 1
pH 5.5-9 Ni mg/l 1 BOD5 mg/l 50 Organic P mg/l 0.5 COD mg/l 100 Fe mg/l 5

C-195
Parameter Unit Wastewater Discharge Standard
(B)
Parameter Unit Wastewater Discharge Standard
(B) SS mg/l 100 Sn mg/l 1
Mineral Oil mg/l 1 Hg mg/l 0.005 Organic Oil mg/l 10 T-Nitrogen mg/l 60
As mg/l 0.1 T-P mg/l 6 Cd mg/l 0.02 F Compounds mg/l 2
Residual Cl mg/l 2 Phenol mg/l 0.05 Cr(Ⅵ) mg/l 0.1 S Compounds mg/l 0.5 Cr(Ⅲ) mg/l 1 CN mg/l 0.1
Zn mg/l 2 Pb mg/l 0.5 Cu mg/l 1
5. Recommended Countermeasures for Improvement
5.1 Short Term Countermeasures
(1) Take countermeasures for the pH and Fe concentrations that exceed the
regulation standards. This is because low sedimentation performance is due
to low a pH value. As Fe can forms an insoluble salt under alkaline condition
in wastewater, and pH control is very important in this case.
(2) Stabilize the operation of both plants, the ones for H2SO4 production and
aluminum hydroxide, because the fluctuation of operating conditions results
in a loss of raw materials, energy and additives, and also is a cause of the
higher emission of pollutants.
(3) Avoid sending acidic washing water from the H2SO4 cans to the drainage
directly. It is recommended to recover H2SO4 or to neutralize it before sending
it to the drainage.
(4) Clean up the factory more than now for further environmental and safety
improvement.
(5) Apply for ISO9002 as soon as possible. In order to apply, the factory and
facilities should be maintained cleanly and orderly, and the documentation
system for production and quality control should be completed orderly.
5.2 Mid- Term and Long Term Countermeasures
(1) Install a neutralization treatment pond with a pH control system and
measure and evaluate pH continuously. The results should be fed back to
the operation and this results the development of productivity and better
environment.
C-196
6. Notes
This factory needs a more detailed survey to determine ways improve its
productivity and environmental conditions. They seem to have renovated their
plant with a cooperative attitude and also have the capability to prepare for the
necessary data for a further survey for this project.

C-197
CASE STUDY C-16
Southern Vietnam Basic Chemicals Company / Bien Hoa Chemical Factory Survey Date : December 10, 1999
1. General
1.1 Profile
The Bien Hoa Chemical Factory is one of the factories belonging to the South
Vietnam Basic Chemicals Company which is state-owned and produces basic
chemicals. The company profile is summarized in Table 1.
Table 1 Company Profile
Company Name: Southern Basic Chemical Company
Bien Hoa Chemical Factory Ownership: State owned
Address: Bien Hoa Ⅰ Industry, Dong Nai Province Director: Mr. Nguyen Do Ky
Established 1962 Corporate Capital Number of Employees: 286 including 30 engineers
Main Products: NaOH, Liquid Cl2, HCl, Sodium Silicate
The company produces caustic soda, liquefied chlorine, hydrochloric acid,
sodium silicate for detergent additives, sodium hypochlorite and calcium
hypochlorite.
1.2 Status of Business
(1) Production
New production facility was introduced from Italy in 1996. The production
capacity of caustic soda of 100% concentration is 10,000 t/y and production in 1998
was 7,500 t/y. Just before introducing the new facility in 1995, the production was
4,000 t/y for 100% concentrated caustic soda. The causes of the decrease in total
production to a level less than its capacity were unfavorable ①market situation
and ②financial conditions, but the production plant has been operating at a 100%
rate since last August. The product is mainly sent to the domestic market and only
a small amount of caustic soda and liquefied chlorine is exported to Cambodia.
Only solid caustic soda is imported.
Actual annual production and revenues are shown in Table 2.

C-198
Table 2 Annual Production and Revenues in 1998
Product Production (Tons) Revenue (VND) NaOH (32%) 23,700.000 27,302,400,000 HCl (32%) 16,710.000 18,381,000,000 Liquid Cl2 908.870 5,998,542,000 Sodium Silicate 4,388.000 2,121,709,200 Bleaching Liquid 2,720.140 680,035,000 Total 48,427.010 54,483,686,200
(2) Debt
There is no description.
2. Production Technology
2.1 Process
The production technology used for caustic soda is not a mercury process but a
membrane process, so the only heavy metal contained in the wastewater is Fe. Two
Boiler facilities with a capacity of 2t/hr in the existing plant in this factory were
introduced from China and Japan. The fuel oil is fed to the boiler as fuel.
Figure 1 shows solicic acid production process, Figure 2 shows bleaching
solution production process, and figure 3 shows caustic soda, hydrochloric acid,
and liquid chlorine production processes.
Sand Sludge
Wastewater
Figure 1 Silicic Acid Production Process
Sand
(80%SiO2) River Water
Sand Washing
FO NaOH Pipe Water
Silicate Preparation Press Filter
Silicate Product

C-199
Lime Sludge
Figure 2 Bleach Production Process
Wastewater Sludge
Figure 3 Caustic Soda, Hydrochloric Acid and Liquid Chlorine Production Process
H2 Gas
Wastewater
CL2 Gas
Cl2 Gas
Lime
(80%CaO)
Cl2 Gas Pipe Water
Bleaching Liquid Preparation Bleaching Liquid Product
(35g/l Cl2)
BaCl2
NaOH
NaCl
Primary Solution
Make up
Na2CO3
Focculant
Pipe Water
Na2SO3
HCl Secondary Solution
Make up
NaOH
Enrichment of
Dilute Salt Solution
Liquid Cl2
Preparation
HCl NaOH
Electrolysis
32%HCl
Preparation
32%NaOH
Product
Pure Water
Cooling Water

C-200
2.2 Wastewater Source
Their supply water has two sources, city water and river water from the Dong
Nai River.
City water is utilized for pure water production, production for silicate
compounds, hypochlorite and electrolite solution. The total volume of city water is
19m3/hr. River water is utilized for washing and cooling of equipment at a volume
of 25m3/hr.
The only treatment for the supply water is at an ion exchanging facility for
making pure water. Total water discharge from the factory is 34m3/hr and this
mainly consists of washing water for their equipment and floors, and also includes
a small amount of domestic water. Analysis on wastewater is performed daily, and
on pure water for the boiler weekly at their laboratory.
Environmental pollution is one of the major problems of the whole industrial
area and this factory also has pollution problems with its wastewater.
As for industrial wastewater, the wastewater flowing from the factory to the
sedimentation pond has a very low PH value, but no neutralization treatment has
been introduced so far, and they are now studying ways to introduce an automatic
neutralization facility in the near future.The water system is described in Figure 4.
20m3/d ③ City Water 186m3/d ① 13m3/d
32m3/d
④ Cooling Water River Water 70m3/d
⑨
95m3/d Cooling water
⑦
⑧
⑥
⑦
40m3/d
84m3/d
70m3/d ⑤Washing Water
Primary Solution Make Up
De-ionizer
Secondary Solution
Make Up
Electrolysis
Bleaching Liquid Preparation
Silicate Preparation
HCl Preparation
Pond
②
Figure 4 Water system and Sampling Points
Liquid Cl2 Preparation
The Dong Nai River

C-201
3. Management
3.1 General
From the general observation the management of the factory seems rather
good because of the well maintained factory site, facilities and equipment.
They are now applying for ISO 9000 and expecting the certification in the year
2000. However, there is no plan at present to apply for ISO 14000.
3.2 Unit Consumption of Raw Material and Utilities
Table 3 shows unit consumption of raw material and utilities in 1998.
Table 3 Unit Consumption in 1998
Material Used Unit Amount Cost NaOH (32%)
NaCl (93%) NaOH (32%) Na2CO3 (98%) HCl (30%) BaCl2 (85%) Na2SO3 (95%) Fuel Oil Electricity De-ionized Water City Water
Tons Tons Tons Tons Tons Tons Tons kwh m3 m3
13,442.370
869.350 103.120 727.034 283.775 12.700
640.780 18,402,477.000
14,653.250 45,504.000
505,000 VND/t 992,000 VND/t
1,900,000 VND/t 950,000 VND/t
2,900,000 VND/t 11,000,000 VND/t 1,600,000 VND/t
779 VND/kwh 34,312 VND/m3 3,100 VND/m3
HCl (32%) Cl2 Gas Fuel Oil Electricity Pipe Water De-ionized Water
Tons Tons kwh m3 m3
5,409.199
4.435 1,038,393.000
23,787.500 3,334.280
2,311,042 VND/t 1,600,000 VND/t
830 VND/kwh 3,100 VND/m3 34,312 VND/m3
Liquid Cl2 Cl2 Gas H2SO4 (97%) Electricity
Tons Tons kwh
999.757 56.004
345,756.000
2,311,042 VND/t 900,000 VND/t 830 VND/kwh
Sodium Silicate Sand NaOH (32%) Fuel Oil Pipe Water Electricity
Tons Tons Tons m3
kwh
1,798.740 2,481.696 212.135
21,940.000 127,905.300
80,000 VND/t
1,232,553 VND/t 1,600,000 VND/t 3,100 VND/m3 830 VND/kwh
Bleaching Liquid Cl2 Gas CaO (70%) Pipe Water Electricity
Tons Tons m3
kwh
217.611 634.290
13,600.700 75,494.00
2,311,042 VND/t 600,000 VND/t 3,100 VND/m3 830 VND/kwh

C-202
4. Industrial Wastewater Treatment and Discharge
4.1 Wastewater Quality
Sampling points and numbers are shown in Table 4.
Table 4 Sampling Points and Sample Numbers
Sample number Sampling point 1 City Water ( One of resource water) 2 River Water( One of resource water) 3 Wastewater from Primary Solution Preparation
(we can not take sample because of no continuous flow) 4 Wastewater from Liquid Cl2 Preparation(Cooling water) 5 Wastewater from Sodium Silicate Preparation( Washing water) 6 Wastewater before the pond 7 Wastewater from Acid Production (Cooling Water) 8 Wastewater after the Pond ( discharge to the river) 9 River water (We can not find out the convenient place for taking
samples)
We could not take sample at sampling point 3 because of no continuous flow.
Also, we tried to take sample at sampling point 9 as a general river water
sample, however, we could not take sample because a suitable point for the
condition was not found.
The results of the analysis by CECO for wastewater samples are shown in
Table 5.
At sampling points No.4, No.6 and in the pond, oil was observed on the surface
of water. However, no oil was observed at sampling point No.8. The pH value was
very low, 2.1 and 2.4 respectively, at the upstream and downstream of the pond.
Table 5 Wastewater Quality (CECO)
Sampling Point 1 2 3 4 5 Parameter Unit
Time 10:55 10:40 - 10:00 10:34 Temp. ℃ 26 27 - 28 26 pH 7.2 8.0 - 7.4 10.8 Conductivity mmS/cm 0.05 0.25 - 0.05 2.0 Turbidity NTU 1 15 - 24 760 Oil content mg/l <0.01 0.04 - 0.10 0.15 BOD5 mg/l 2 13.4 - 8 37 COD mg/l 3.4 47.6 - 11.2 60.8 DO mg/l 6.9 6.1 - 6.6 4.4 SS mg/l 4 22 - 18 1,784 T-nitrogen mg/l 2.9 6.2 - 6.6 4.3

C-203
Sampling Point 1 2 3 4 5 Parameter Unit
CN mg/l <0.001 <0.001 - 0.004 0.018 Phenol mg/l <0.001 <0.001 - 0.005 0.001 Residual Cl mg/l 0.12 0.07 - 0.06 0.84 SO4 mg/l 1.3 11 - 1.0 0.0 Fe mg/l 0.08 0.29 - 0.53 0.34
Sampling Point 6 7 8 9
Parameter Unit Time 10:24 10:18 10:30 - Temp. ℃ 28 29 28 - pH 2.1 4.3 2.6 -
Conductivity mmS/cm 7.3 0.21 0.22 - Turbidity NTU 40 19 30 - Oil content mg/l 0.17 0.15 0.13 - BOD5 mg/l 26 9 9 - COD mg/l 52.4 11.2 23.2 - DO mg/l 5.4 5.8 6.4 - SS mg/l 644 29 45 - T-nitrogen mg/l 7.2 4.56 6.46 - CN mg/l 0.006 0.001 0.016 - Phenol mg/l 0.001 <0.001 0.003 - Residual Cl mg/l 0.09 0.19 1.46 - SO4 mg/l 40 25 25 - Fe mg/l 6.08 1.18 2.92 -
4.2 Regulation Standards for Industrial Wastewater
Regulation Standards for Industrial Wastewater (Rank B) in Viet Nam are
shown in Table 6.
Wastewater discharged to public water area, Sample No.8, shows that pH
exceeds the regulated standard value (rank B).
Table 6 TCVN 5945-1995( Rank B)
Parameter Unit Wastewater Discharge
Standard (B)
Parameter Unit Wastewater Discharge Standard
(B) Temp. ℃ 40 Mn mg/l 1
pH 5.5-9 Ni mg/l 1 BOD5 mg/l 50 Organic P mg/l 0.5 COD mg/l 100 Fe mg/l 5 SS mg/l 100 Sn mg/l 1

C-204
Parameter Unit Wastewater Discharge
Standard (B)
Parameter Unit Wastewater Discharge Standard
(B) Mineral Oil mg/l 1 Hg mg/l 0.005 Organic Oil mg/l 10 T-Nitrogen mg/l 60
As mg/l 0.1 T-P mg/l 6 Cd mg/l 0.02 F Compounds mg/l 2
Residual Cl mg/l 2 Phenol mg/l 0.05 Cr(Ⅵ) mg/l 0.1 S Compounds mg/l 0.5 Cr(Ⅲ) mg/l 1 CN mg/l 0.1
Zn mg/l 2 Pb mg/l 0.5 Cu mg/l 1
5. Recommended Countermeasures for Improvement
5.1 Short Term Countermeasures
(1) Take countermeasures for neutralization of low pH water by adding alkaline
chemicals into the sedimentation pond continuously.
(2) Remove oil in the wastewater found in certain drainage using absorbing
mats.
5.2 Mid- Term and Long Term Countermeasures
There are no special recommendations.

C-205
Case Study C-17
Industrial Gas and Welding Electrode Company
Survey Date : December 13, 1999
1. General
1.1 Profile
The Industrial Gas and Welding Electrode Company is a State-owned company.
The company profile is summarized in Table 1.
Table 1 Company Profile
Company Name: Industrial Gas & Welding Electrode Company / BIEN HOA Industrial Gas Factory
Ownership: State owned
Address: Bien Hoa Industrial Zone, Dong Nai Province
Director: Mr. Dao Van Tong
Established 1968
Corporate Capital
Number of Employees: 400 including 32 engineers (Whole Company) 61 including 5 engineers (Bien Hoa Factory)
Main Products: Oxygen, Acetylene, Nitrogen
The company was established in 1968 and consists of 5 factories, 2 in HCMC, 1
in Bien Hoa, 1 in Can Tho and 1 in Nha Trang. The main products of the company
are oxygen, nitrogen, acetylene welding materials and electrode products. The
number of employees in the whole company is 400 people, including 32 engineers
and, in Bien Hoa factory, there are 64 employees, of who 5 are engineers. The total
area of the factory is 2.7 hectares.
1.2 Status of Business
The facility is rather old, but production has grown 5 -7 %/each year and
market share is almost 50 -60% in the South. Recently, foreign companies including
joint ventures with domestic companies and those with 100% foreign capital are
developing there market share, so they need to improve productivity and quality of
their products through this survey.
A new production line is under construction in Bien Hoa factory, of which

C-206
capacity is 3 times the existing one for O2, N2 and its liquefied products.
There are several competitor companies, a domestic company and a JV
company in the North, and a JV company with a Japanese company – Nippon
Sanso, Tomoe Shokai and Nissho Iwai – and a JV company with a German
company in the South.
Demand of oxygen is increasing for medical and industrial use.
Electricity is the main cost for the product at 33 -36% of total product cost and
electricity consumption will increase from the present 770kwh/d to 800kwh/d.
Transportation costs are not estimated. In Bien Hoa factory there are 2 production
lines for producing industrial gases. The production in 1999 is expected to be lower
than the capacity.
(1) Production
Table 2 Production Capacity of the Air Separation Plant
Product Existing Facility After Expansion Oxygen (Nm3/h) 145 300 Liquid Nitrogen (l/h) 200 900 Argon Gas (Nm3/h) - 6 Acetylene (Nm3/h) 70
Annual production capacity and production amounts for 1998 and 1999 are
shown in Table 3.
Table 3 Production Capacity and Amount
Product Unit Capacity Production (1998)
Production (1999)
Oxygen Nm3/y 5,600,000 4,368,000 744,000 Acetylene Nm3/y 1,000,000 188,000 60,000 Nitrogen Nm3/y 200,000 137,000 74,000
Actual annual Production and Revenues are shown in Table 4.
Table 4 Annual Production and Revenue in 1998
Product Capacity Production Revenue (VND) Oxygen 5,600,000 m3 4,368,000 19,656,000 Acetylene 1,000,000 m3 188,000 7,144,000 Liquid Nitrogen 200,000 m3 137,000 1,370,000 Welding Electrode 3,000 t 1,160 7,846,000 Bottle Checking 22,700 4,000,000 Valve Repairing 33,000 Industrial Services Total 40,016,000
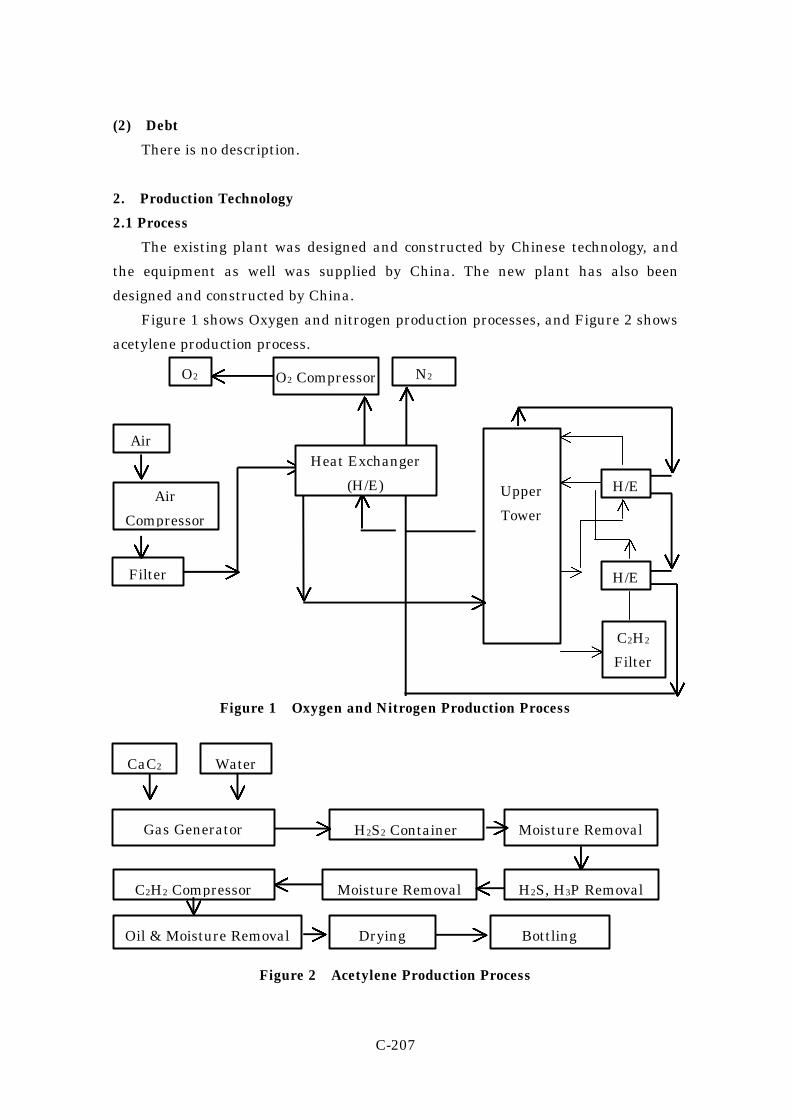
C-207
(2) Debt
There is no description.
2. Production Technology
2.1 Process
The existing plant was designed and constructed by Chinese technology, and
the equipment as well was supplied by China. The new plant has also been
designed and constructed by China.
Figure 1 shows Oxygen and nitrogen production processes, and Figure 2 shows
acetylene production process.
Figure 1 Oxygen and Nitrogen Production Process
Figure 2 Acetylene Production Process
Air
Air
Compressor
Filter
Upper
Tower
H/E
H/E
C2H2
Filter
N2 O2 Compressor O2
Heat Exchanger
(H/E)
Gas Generator H2S2 Container Moisture Removal
H2S, H3P Removal Moisture Removal C2H2 Compressor
Oil & Moisture Removal Drying Bottling
Water CaC2

C-208
2.2 Wastewater Sources
Supply water has two sources, from city water which flows through piping from
Dong Nai River and deep well water. The water consumption volume of city water
is 8,000m3/y and deep well water is also 8,000m3/y. Total water usage for domestic,
cooling of oxygen and other industrial use is 21,000 Nm3/y, and only 12,600
Nm3/y(60%) is discharged outside. A quality analysis inspection is performed every
year.
There is a sedimentation pond with 2 channels for wastewater for the purpose
of separating solid waste from wastewater. Not only the factory, but the Bien Hoa
industrial area No.1 has environmental problems with wastewater and solid waste.
Ind. area No.1 has a surface drainage system which discharges wastewater to the
Dong Nai River. Industrial wastewater is mixed with residential wastewater and is
discharged to the Dong Nai River, but the water supply source is the same Dong
Nai River. Water system and sampling points are shown in Figure 3.
Well Water City Water
② ③
20m3/d
⑦ 60m3/d ⑧ ⑥
④
① 60m3/d
⑤
54m3/d
The Dong Nai River
Figure 3 Water System and Sampling Points
Moisture
Removal in
Acetylene
Unit
Cooling
Water
Reactor
in Acetylene
Unit
Sedimentation
Pond
Storage Pond

C-209
The production technology for caustic soda is not a mercury process, but a
membrane process, and so the only heavy metal contained in the wastewater is Fe.
Two boiler facilities with a capacity of 2t/hr in the existing plant in this factory
were introduced from China and Japan. The fuel oil is fed to the boiler as fuel.
3. Management
3.1 General
From the general observation the management of the factory seems rather
good because the factory site, facilities and equipment are well maintained.
They started to study ISO 9000 in order to obtain it. After that they plan to
challenge ISO 14000.
Wastewater and solid waste come along the production of acetylene have a big
impact to environment. A Production level of 60,000Nm3/y of acetylene requires
6,261,000kg/y CaC2 raw materials and discharges 522,000 l/y of Ca(OH)2
(1kg-CaC2 generates 2 l-Ca(OH)2)and 320t/y of CaC2 residue. The composition of
CaC2 residue after reaction is shown in Table 5.
Table 5 Composition of CaC2 Residue
Parameter Content ( %wt.) Calcium Carbide 24.6 CaO 12.5 MgO 0.5 Fe2O3 + Al2O3 3.5 S 0.2 C 1 FeSiO4 4
The data mentions considerable amount of CaC2 is contained the reaction
residue.
3.2 Annual Consumption of Raw Material and Utilities
Raw material of acetylene, Calcium kabaite, is imported from China.
Annual consumption of raw materials for each product, additives and utilities
with their costs in 1998 are shown in Table 6.

C-210
Table 6 Annual Consumption and Cost in 1998
Material Used Amount Cost (VND/unit) Oxygen/Nitrogen Solid Soude Perlite Insulator Copper Wire Ammonium Chloride Ammonium Hydroxide Lubricant Electricity Water
20 t
0.0051 t
0.150 t 0.300 t
8.0 t 9,906,000 kwh
36,000 m3
3,810,000
40,000,000 4,000,000
6,000 9,727
770 3,100
Acetylene Calcium Carbide Calcium Chloride Acetone Water Electricity
6,000 t
4.0 t 15.0 t
54,000 kwh
5,136,000 4,300,000 7,910,000
1,020
Electrode Product Ferro-manganese Rutile Ilmenite Feldspar Kaolin CaCO3 Wood Chip Iron Oxide Titanium Oxide Silicate Tale Powder Steel Electricity
35.0 t
100.0 t 50.0 t 40.0 t 17.0 t
7.0 t 11.0 t 3.0 t 1.0t 4.0 t 70 t
730 t 230,000 kwh
12,199,000 3,636,000
636,000 1,182,000
825,000 961,000
2,400,000 7,909,000
31,905,000 1,812,000 1,340,000 4,200,000
820
4. Industrial Wastewater Treatment and Discharge
4.1 Wastewater Quality
Sampling points are shown in Table 7, and the result of the analysis by CECO
for wastewater is shown in Table 8.

C-211
Table 7 Sampling Points
Point Number Flow rate(m3/d)
Sample
1 60 Recycled Cooling Water from the Storage Pond 2 10 Well Water(1/2 of consumption amount) 3 10 City Water(1/2 of consumption amount) 4 60 Wastewater to the Storage Pond 5 54 Wastewater after Sedimentation 6 54 Wastewater from Acetylene Reactor 7 little Wastewater from Humidity Removal 8 60 Cooling Water from Processes
Table 8 Wastewater Quality (CECO)
Sampling Point 1 2 3 4 Parameter Unit
Time 11:31 11:22 11:24 11:50 Temp. ℃ 27 28 28 27.8 pH 8.0 5.0 5.0 9.7 Conductivity mmS/cm 0.12 0.09 0.09 0.09 Turbidity 8 1 1 14 Oil content mg/l 0.09 <0.01 <0.01 0.14 BOD5 mg/l 8 3 2 7 COD mg/l 16 5.6 3.8 14 DO mg/l 5.8 5.4 6.4 5.8 SS mg/l 19 6 3 11 T-nitrogen mg/l 7.5 2.3 1.3 6.5 CN mg/l 0.001 <0.001 <0.001 <0.01 Phenol mg/l 0.002 <0.001 <0.001 0.13 Residual Cl mg/l 0.02 0.01 0.02 0.05 SO4 mg/l 3 1 0.71 6 S mg/l 4.5 2.3 4.5 45.8 T-P mg/l 0.52 0.04 0.017 0.43
Sampling Point 5 6 7 8 Parameter Unit
Time 12:00 11:43 11:39 11:30 Temp. ℃ 28 28 27 28.5 pH 11.98 5.0 7.8 7.8 Conductivity mmS/cm 7.96 0.09 4.78 0.14 Turbidity 1,080 1 301 21 Oil content mg/l 0.17 <0.001 0.10 0.08 BOD5 mg/l 118 2 391 20 COD mg/l 340 3.8 648 68 DO mg/l 3.4 6.4 4.0 5.4

C-212
Sampling Point 5 6 7 8 Parameter Unit
SS mg/l 3,336 3 732 60 T-nitrogen mg/l 29.3 1.3 324 8.4 CN mg/l 0.079 <0.001 0.121 0.003 Phenol mg/l 0.008 <0.001 0.03 0.09 Residual Cl mg/l 1.85 0.02 1.72 0.09 SO4 mg/l 15 0.71 86 5 S mg/l 349.5 4.5 0.83 0.08 T-P mg/l 6.71 0.07 0.12 0.27
The quality of well water and city water are almost the same.
The sedimentation pond was filled with CaC2 residue and wastewater was not
treated in the pond because the back fill of residue caused new wastewater to pass
over the surface of the pond so no sedimentation could take place. The color of
wastewater from the acetylene reactor was grayish because it contained much
CaC2 residue.
4.2 Regulation Standards for Industrial Wastewater Regulation Standards for Industrial Wastewater (Rank B) in Viet Nam are
shown in Table9. Discharged water from the company, Sample No.5, shows that pH,
BOD5, COD, SS, sulfur compounds and total phosphor exceed regulated standard
values.
Table 9 TCVN 5945-1995( Rank B)
Parameter Unit Wastewater Discharge Standard
(B)
Parameter Unit Wastewater Discharge Standard
(B) Temp. ℃ 40 Mn mg/l 1
pH 5.5-9 Ni mg/l 1 BOD5 Mg/l 50 Organic P mg/l 0.5 COD Mg/l 100 Fe mg/l 5 SS Mg/l 100 Sn mg/l 1
Mineral Oil Mg/l 1 Hg mg/l 0.005 Organic Oil Mg/l 10 T-Nitrogen mg/l 60
As Mg/l 0.1 T-P mg/l 6 Cd mg/l 0.02 F Compounds mg/l 2
Residual Cl mg/l 2 Phenol mg/l 0.05 Cr(Ⅵ) mg/l 0.1 S Compounds mg/l 0.5 Cr(Ⅲ) mg/l 1 CN mg/l 0.1
Zn mg/l 2 Pb mg/l 0.5 Cu mg/l 1

C-213
5. Recommended Countermeasures for Improvement
5.1 Short Term Countermeasures
(1) Countermeasures need to be taken for wastewater discharge from the
company as soon as possible. (Refer the following items)
(2) Neutralize wastewater before sedimentation using alkaline chemicals.
However, if there are other sources of alkaline wastewater it is preferable to
neutralize that wastewater in a common treatment pond.
(3) The sedimentation pond is full of solid waste and that waste needs to be
removed. The sedimentation pond should be divided into two ponds, and they
should be utilized for removing precipitate in turn.
(4) Clean up the factory, especially concentrating on safety aspects.
(5) Install portable acetylene gas detector or a stationary one for prevention
of fires and explosions.
5.2 Mid- Term and Long Term Countermeasures
(1) Install a common wastewater treatment system in industrial zones.
(2) Apply for ISO 9000. In order to apply, the factory and facilities should be
maintained cleanly and orderly, and the documentation system for production
and quality control should be completed orderly.

C-214

C-215
CASE STUDY C-18
Tay Ninh Rubber Company
Survey Date : December 14, 1999
1. General
1.1 Profile
Tay Ninh Rubber Company is one of the Local Government owned companies
of Ho Chi Minh City. The company profile is summarized in Table 1.
Table 1 Company Profile
Company Name: Tay Ninh Rubber Company
Ownership: Local Government owned
Address: Go Dau- Tay Ninh Province
Vice Director: Mr. Le Khac Minh
Established 1908 as a French Company, then in 1975 established as Tay Ninh Rubber Company
Corporate Capital
Number of Employees: 2,250 including 20 engineers
Main Products: Rubber Materials
The plantation was started in 1908 before the French governed the country.
The total area of the plantation was developed to 4,000ha in 1975. The Government
of Viet Nam took over the plantation and the Tay Ninh Rubber Company was
established in 1975. At present, the area has been expanded to 7,300ha and the
number of employees is 2,300, including 60 university graduates, with 20 engineers
in the chemical, mechanical and agricultural field. 100 technicians are also
included in this figure. The company has 3 enterprises in 3 plantation locations, a
head-quarters and a factory in Tay Ninh district and a factory in 25 km north from
their head quarters in the Ben Cui district. There are three types of rubber
products, block rubber from milk (latex) produced at 3,000t/y, block rubber from
cup lump at 2,000t/y and latex concentrate at 2,000t/y.
The production capacity of rubber products is shown in Table 2.

C-216
Table 2 Production Capacity of Rubber Products
Product Factory in Tay Ninh Factory in Ben Cui Total block rubber from latex 3,000t/y 3,000 t/y 6,000 t/y rubber from cup lump 2,000t/y -- 2,000 t/y latex concentrate 2,000t/y -- 2,000 t/y
1.2 Status of Business
Their production rate is rather low and their main markets are China, South
East Asian countries and the USA. There are some difficulties with domestic
competition in terms of quality. They have almost the same quality as imported
products, but are 60 to 200 US$ cheaper in price. So Tay Ninh Rubber company
needs to stabilize the quality of their products. As for production costs, their
product cost is similar to the products made in Thailand, especially for tree costs
and labor costs. Future expansion will be depend on cost factors, especially
equipment cost, labor cost and the cost of investment. The traditional chemical
industry in Viet Nam is not big in scale and in the future an environmental
friendly industry should be developed.
(1) Production
The main products of the company are SVR3L, SVR5 and market preferable
products SVR10 and SVR20. Production of the latter 2 products will be increased
from 20% to 75% for tire use. However, because of the limitation of available land
area, they have no future expansion plan at present. Their main additives, formic
acid in 30l cans is imported from Germany and NH3 in 30l cans is transported by
train from Ha Bac district. Formic acid is substituted for acetic acid depending on
each products' market price.
Actual annual Production and Revenues are shown in Table 3.
Table 3 Annual Production and Revenues in 1998
Product Amount (t) Revenue (1,000 VND) From the plantation’s material SVR3L SVR5 SVR10 SVR20 Specialized Skim Latex Concentrates
5,768.720 3,666.000
34.435 67.894
728.258 0.467
121.732 1,148.973
52,017,913 30,017,626
249,266 589,581
5,482,743 3,497
622,268 14,307,932

C-217
From outside material SVR20
9.667 9.667
71,460 71,460
Process for other material owner SVR3L SVR5 SVR10 SVR20
1,055.827 238.580
15.181 339.567 462.499
Total SVR3L SVR5 SVR10 SVR20 Specialized Skim Latex Concentrates
6,834.214 3,950.541
49.616 407.461
1,200.424 0.467
121.732 1,148.973
(2) Debt
A certain amount of debt has been introduced from the bank through the
government and USA funds so far, but the company has been requested to pay back
the debt in advance in spite of its original 10year pay back period.
2. Production Technology
2.1 Process
Figure 1 shows the rubber processing from pure latex process, figure 2 shows
rubber processing process from cup lump and Figure 3 shows concentrated latex
production process made from natural latex.
Figure 1 Rubber Production Process from Pure Latex
Water
Wastewater
Latex Washing Receiver Formic Acid
Dryer Packaging
Pulling Roller
Roller 1, 2 & 3
Cutting Roller &
Vibration Floor
Wastewater

C-218
Figure 2 Rubber Processing Process from Cup Lump
Figure 3 Concentrate Latex Production Process
2.2 Wastewater Source
The supply water sources are deep well and river water (The Vam Co Dong
River). Pump capacity for each types of supply water is 50m3/h and 30 m3/h
respectively. River water is used for washing water of the 1st half block rubber unit
Wastewater
Latex Receiver Formic Acid
Dryer Packaging
Pulling Roller
Roller 1, 2 & 3
Cutting Roller &
Vibration Floor
Latex
From plantation
Centrifugation Formic Acid
Coagulation
Serum skim Skim rubber
NH3 Latex concentrate product Skim latex (Side product)
Wastewater Water
Washing

C-219
and well water is used for the 2nd half unit.
The company discharges 500m3/d of industrial wastewater through a biological
wastewater treatment system that was renovated because of some unsuitability
problems in the past, and now the system runs well with light loads so far.
Water system and sampling points are shown in Figure 4.
Well Water River Water (the Vam Co Dong River)
① ⑨
22
500m3/d 500m3/d
200m3/d
1,200m3/d ⑧
the Vam Co Dong River
Figure 4 Water System and Sampling Points
Rubber Processing
from Pure Latex
②
③
④
Rubber Processing
from Cuplump
⑤
Latex Concentrates
Production
⑥
⑦
Washing
Raw Material
Concentra-ti
on Tank
Washing
1st Stage
Washing
2nd.Stage
Washing
Coagulation
Tank
Wastewater Treatment Facilities (Not Working)
Centrifugal
Machine

C-220
3. Management
3.1 General
The main environmental problems of the company are gas emissions, foul
odors and wastewater. They are preparing to apply for ISO 9000 under the
supervision of French consultant and expect to be certified in the middle of 2000,
but ISO 14000 is not under consideration yet.
3.2 Annual Consumption of Raw Materials and Utilities
Annual consumption of raw materials for each products, additives and utilities
with their cost in 1998 are shown in Table 4.
Table 4 Annual Consumption and Cost in 1998
Material Used Amount Cost / Unit (VND)
Cost (VND)
SVR3L,5 Formic Acid NH3,20% solution Sodium Bisulfide Sulfuric Acid
3.6kg/t x3.955=14,240kg
0.4kg x3,955=1,582kg 0.6kg x3,955=2,373kg 0.08kg x3,955=316kg
10,216 2,135 8,522 3,616
170,220,000 145,476,000
3,378,000 20,223,000 1,143,000
SVR10,20 No Chemicals Water for Pure latex Water for Cuplump Water for Skim Latex Electricity
3,955t x 25m3/t=98,875m3 1,608t x35=56,280m3 1,271t x20=25,420m3
971,165kw
350 350 350 811
850,816,000
34,606,000 19,698,000 8,897,000
487,615,000 Latex Concentrates NH3 Gas NH3 Solution
12kg x1,149=13,788kg
16.2kg x1,149=18,1387kg
10,665 2,135
185,774,000 147,049,000 38,725,000
Skim Rubber Formic Acid
250kg x122=30,500
10,216
311,588,000 311,588,000
4. Industrial Wastewater Treatment and Discharge
4.1 Wastewater Quality
They often checked the quality of the wastewater in the past because the
wastewater treatment did not work well at that time. The results of the analysis
for industrial wastewater in 1997 are shown in Table 5.
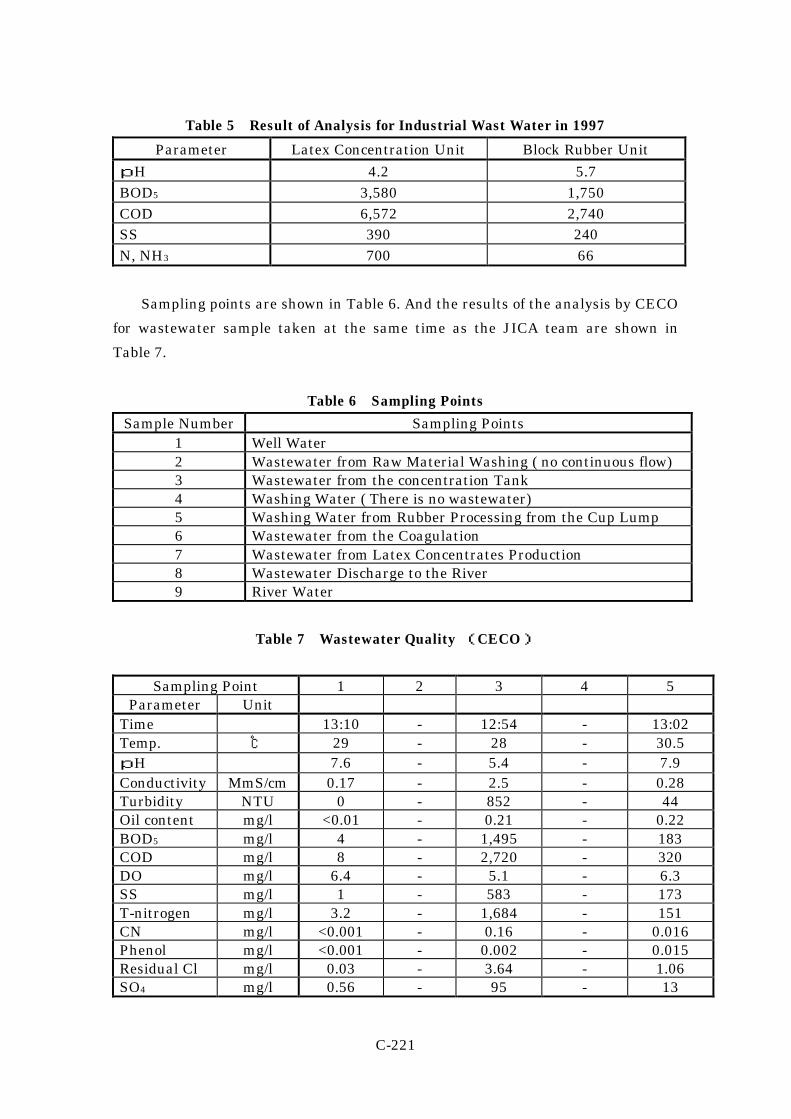
C-221
Table 5 Result of Analysis for Industrial Wast Water in 1997
Parameter Latex Concentration Unit Block Rubber Unit
pH 4.2 5.7 BOD5 3,580 1,750 COD 6,572 2,740 SS 390 240 N, NH3 700 66
Sampling points are shown in Table 6. And the results of the analysis by CECO
for wastewater sample taken at the same time as the JICA team are shown in
Table 7.
Table 6 Sampling Points
Sample Number Sampling Points 1 Well Water 2 Wastewater from Raw Material Washing ( no continuous flow) 3 Wastewater from the concentration Tank 4 Washing Water ( There is no wastewater) 5 Washing Water from Rubber Processing from the Cup Lump 6 Wastewater from the Coagulation 7 Wastewater from Latex Concentrates Production 8 Wastewater Discharge to the River 9 River Water
Table 7 Wastewater Quality (CECO)
Sampling Point 1 2 3 4 5 Parameter Unit
Time 13:10 - 12:54 - 13:02 Temp. ℃ 29 - 28 - 30.5 pH 7.6 - 5.4 - 7.9 Conductivity MmS/cm 0.17 - 2.5 - 0.28 Turbidity NTU 0 - 852 - 44 Oil content mg/l <0.01 - 0.21 - 0.22 BOD5 mg/l 4 - 1,495 - 183 COD mg/l 8 - 2,720 - 320 DO mg/l 6.4 - 5.1 - 6.3 SS mg/l 1 - 583 - 173 T-nitrogen mg/l 3.2 - 1,684 - 151 CN mg/l <0.001 - 0.16 - 0.016 Phenol mg/l <0.001 - 0.002 - 0.015 Residual Cl mg/l 0.03 - 3.64 - 1.06 SO4 mg/l 0.56 - 95 - 13
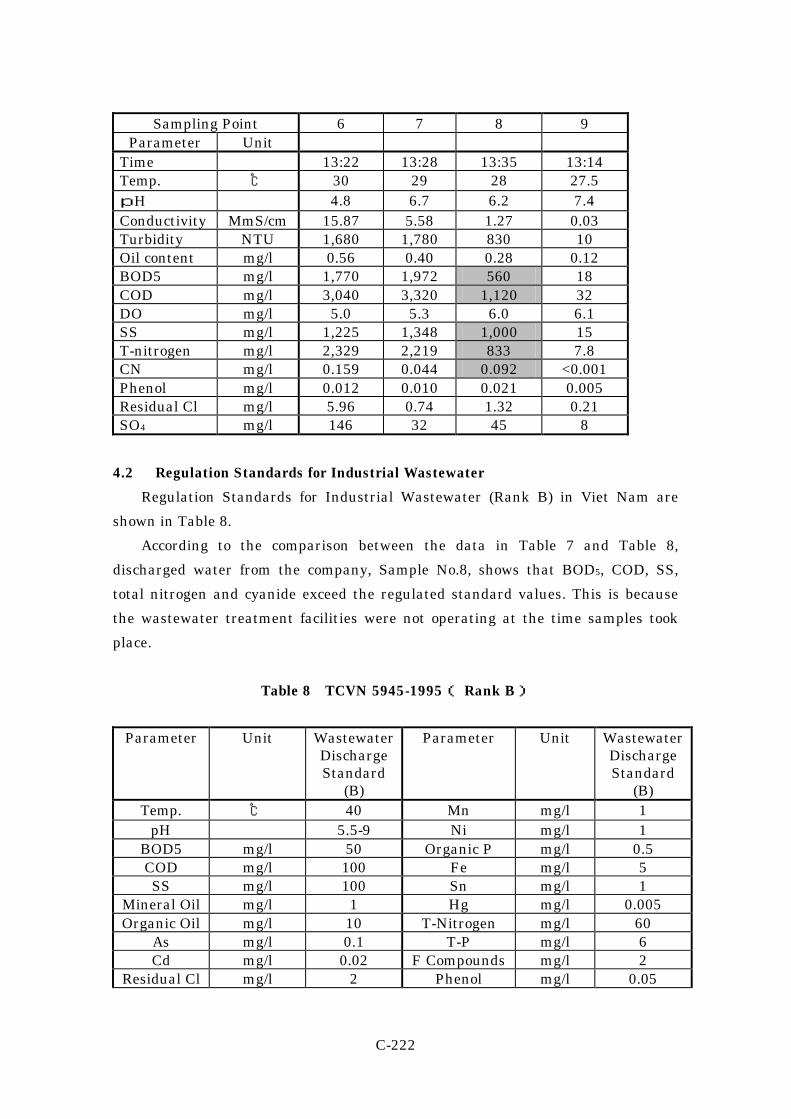
C-222
Sampling Point 6 7 8 9 Parameter Unit
Time 13:22 13:28 13:35 13:14 Temp. ℃ 30 29 28 27.5 pH 4.8 6.7 6.2 7.4 Conductivity MmS/cm 15.87 5.58 1.27 0.03 Turbidity NTU 1,680 1,780 830 10 Oil content mg/l 0.56 0.40 0.28 0.12 BOD5 mg/l 1,770 1,972 560 18 COD mg/l 3,040 3,320 1,120 32 DO mg/l 5.0 5.3 6.0 6.1 SS mg/l 1,225 1,348 1,000 15 T-nitrogen mg/l 2,329 2,219 833 7.8 CN mg/l 0.159 0.044 0.092 <0.001 Phenol mg/l 0.012 0.010 0.021 0.005 Residual Cl mg/l 5.96 0.74 1.32 0.21 SO4 mg/l 146 32 45 8
4.2 Regulation Standards for Industrial Wastewater
Regulation Standards for Industrial Wastewater (Rank B) in Viet Nam are
shown in Table 8.
According to the comparison between the data in Table 7 and Table 8,
discharged water from the company, Sample No.8, shows that BOD5, COD, SS,
total nitrogen and cyanide exceed the regulated standard values. This is because
the wastewater treatment facilities were not operating at the time samples took
place.
Table 8 TCVN 5945-1995( Rank B)
Parameter Unit Wastewater Discharge Standard
(B)
Parameter Unit Wastewater Discharge Standard
(B) Temp. ℃ 40 Mn mg/l 1
pH 5.5-9 Ni mg/l 1 BOD5 mg/l 50 Organic P mg/l 0.5 COD mg/l 100 Fe mg/l 5 SS mg/l 100 Sn mg/l 1
Mineral Oil mg/l 1 Hg mg/l 0.005 Organic Oil mg/l 10 T-Nitrogen mg/l 60
As mg/l 0.1 T-P mg/l 6 Cd mg/l 0.02 F Compounds mg/l 2
Residual Cl mg/l 2 Phenol mg/l 0.05

C-223
Parameter Unit Wastewater Discharge Standard
(B)
Parameter Unit Wastewater Discharge Standard
(B) Cr(Ⅵ) mg/l 0.1 S Compounds mg/l 0.5 Cr(Ⅲ) mg/l 1 CN mg/l 0.1
Zn mg/l 2 Pb mg/l 0.5 Cu mg/l 1
5. Recommended Countermeasures for Improvement
5.1 Short Term Countermeasures
(1) Start operation of the wastewater treatment facilities as soon as possible to
satisfy the regulation standards. At the same time, the condition of was water
and its fluctuation for the optimum operation of the wastewater treatment
facilities.
(2) Study measures to reduce water consumption by recycling through continuous
analysis of quality and quantity of water, and also separation of water lines due
to kind of water.
(3) Improve the turbidity of wastewater by utilizing coagulation and sedimentation
ponds.
(4) Increase efficiency of water used, for example, cooling by heat exchanger and its
operation should be done in a counter flow system.
(5) Clean up the factory and floor, especially in order to remove the foul odor
through specifying the sources of odor.
(6) Apply for ISO9000 as soon as possible. In order to apply, the factory and
facilities should be maintained cleanly and orderly, and the documentation
system for production and quality control should be completed orderly.
5.2 Mid- Term and Long Term Countermeasures
(1) If BOD or COD is extremely high, a special wastewater treatment is necessary
to improve the quality of the discharge water. One example of this kind of
system would be an improved activated sludge treatment system.

C-224
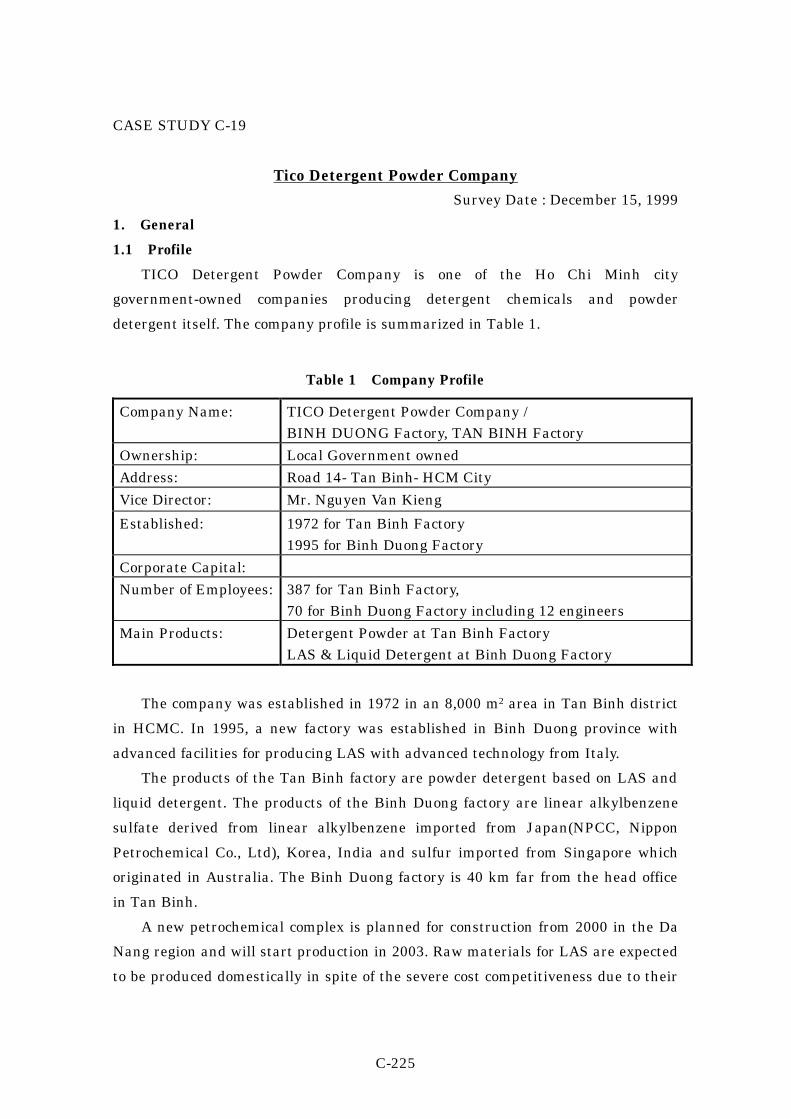
C-225
CASE STUDY C-19
Tico Detergent Powder Company Survey Date : December 15, 1999
1. General
1.1 Profile
TICO Detergent Powder Company is one of the Ho Chi Minh city
government-owned companies producing detergent chemicals and powder
detergent itself. The company profile is summarized in Table 1.
Table 1 Company Profile
Company Name: TICO Detergent Powder Company / BINH DUONG Factory, TAN BINH Factory
Ownership: Local Government owned
Address: Road 14- Tan Binh- HCM City
Vice Director: Mr. Nguyen Van Kieng
Established: 1972 for Tan Binh Factory 1995 for Binh Duong Factory
Corporate Capital:
Number of Employees: 387 for Tan Binh Factory, 70 for Binh Duong Factory including 12 engineers
Main Products: Detergent Powder at Tan Binh Factory LAS & Liquid Detergent at Binh Duong Factory
The company was established in 1972 in an 8,000 m2 area in Tan Binh district
in HCMC. In 1995, a new factory was established in Binh Duong province with
advanced facilities for producing LAS with advanced technology from Italy.
The products of the Tan Binh factory are powder detergent based on LAS and
liquid detergent. The products of the Binh Duong factory are linear alkylbenzene
sulfate derived from linear alkylbenzene imported from Japan(NPCC, Nippon
Petrochemical Co., Ltd), Korea, India and sulfur imported from Singapore which
originated in Australia. The Binh Duong factory is 40 km far from the head office
in Tan Binh.
A new petrochemical complex is planned for construction from 2000 in the Da
Nang region and will start production in 2003. Raw materials for LAS are expected
to be produced domestically in spite of the severe cost competitiveness due to their

C-226
huge investment in construction of the complex.
The main problem in the head factory is leakage of products because sieve
shaker doesn’t have any cover for it. High frequency tone from weighing machine
for packaging , and low frequency tone from blower also cause noise problem in this
factory. Most of water is used for washing water and wastewater is discharged to
city sewage.
A petrochemical complex will be starting built in 2000 in Da Nang, and plan to
be started operation around the year 2003.
1.2 Status of Business
Total capacity of LAS in Viet Nam is 100,000t/y and is produced by 2
companies in the North and 3 companies in the South. However, the demand for
LAS is not active even now with its supply at 1/3 of capacity. Because of the market
situation they are planning to increase the ratio of sales of LAS to other powder
detergent producers. In 2000 they will sell 90% of their LAS to powder detergent
makers and only 10% of LAS will be utilized for their own powder detergent
production. This means they will shift their business from consumer products to
raw material chemical products.
(1) Production
A new production facility from Italy was introduced in 1995. The production
capacity of LAB is 12,000 t/y and production in 1998 was nearly equal to full
capacity.
20% of LAS is utilized for powder detergent production and 80% is sold to the
other powder detergent producers in Viet Nam. In spite of the weak demand for
LAS, they have plans to double their production capacity in the year 2000.
There are 5 enterprises that produce powder detergent, 3 in the North and 2 in
the South, and their combined total production capacity is estimated at 100,000 t/y
which is 3 times the total demand in Viet Nam. Quality and price of their products
are similar each other and profits are rather small.
The company plans to produce liquid detergents using lauryl alcohol imported
from Japan and Singapore.
Actual annual Production and Revenues are shown in Table 2.

C-227
Table 2 Annual Production and Revenues in 1998
Product Amount (t) Revenue (million VND) LASA 11,595 100,107 Detergent Powder 7,915 64,232 Detergent Paste 376 2,009 Total 166,351
(2) Debt
According to the data submitted by the company, the total amount of debt as of
December, 1999 is as follows;
Commerce Bank : 560 million VND
State Bank : 300 million VND
Investment Bank : 0.885 million VND
Industrial and Commerce Bank : 83,000 US$
Total investment in the construction of LAS production facilities is 3.6 million
US$, including 2.4 million US$ for equipment. The debt has to be paid back in 7
years and the interest rate is 9.6 %/y (0.2% / month).
2. Production Technology
2.1 Process
In the Binh Duong factory, LAS is produced under the conditions of a reaction
temperature of 50 ℃ and a pressure of 200 mbar(reactor inlet) and 300
mbar( reactor outlet). Raw material used in production for LAB is imported from
Japan, Korea and India, and another raw material, SO3 is derived from sulfur
which is imported from Australia. This production technology for LAS was
introduced from Italy in 1995 and also, the main equipment was made in Italy.
Figure 1 shows LAS production Process, and Figure 2 shows powder and paste
detergent production process.
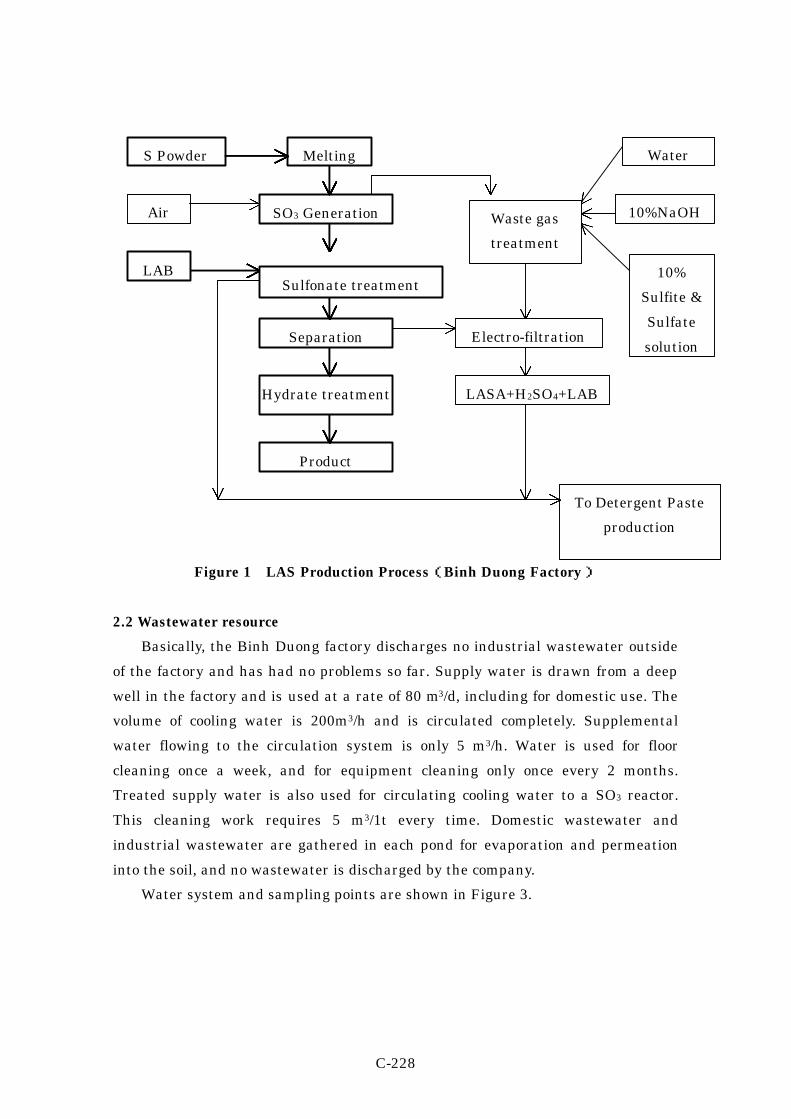
C-228
Figure 1 LAS Production Process(Binh Duong Factory)
2.2 Wastewater resource
Basically, the Binh Duong factory discharges no industrial wastewater outside
of the factory and has had no problems so far. Supply water is drawn from a deep
well in the factory and is used at a rate of 80 m3/d, including for domestic use. The
volume of cooling water is 200m3/h and is circulated completely. Supplemental
water flowing to the circulation system is only 5 m3/h. Water is used for floor
cleaning once a week, and for equipment cleaning only once every 2 months.
Treated supply water is also used for circulating cooling water to a SO3 reactor.
This cleaning work requires 5 m3/1t every time. Domestic wastewater and
industrial wastewater are gathered in each pond for evaporation and permeation
into the soil, and no wastewater is discharged by the company.
Water system and sampling points are shown in Figure 3.
S Powder
SO3 Generation
Melting
Air
LAB
Separation
Hydrate treatment
Product
Water
10%NaOH
10%
Sulfite &
Sulfate
solution Electro-filtration
LASA+H2SO4+LAB
To Detergent Paste
production
Waste gas
treatment
Sulfonate treatment

C-229
Figure 2 Powder and Paste Detergent Production Process(Tan Binh Factory)
Well Water
80m3/d ③
Figure3 Water System Chart and Sampling point(Binh Duong Factory)
Industrial Use
①
④
Water
Na2CO3
LASA
Na2SO4
STPP
Tinopal
Solid Silicate
Drying Detergent Paste
stirring
Fragrant
Detergent Powder product Detergent Paste product
Na3P5O10
CMC
Fragrant
Domestic Use
Washing Water
Pond ②
(No Discharge)
Pond ⑤
(No Discharge)
④
Cooling Water
Treatment
For Cooling Water
Dissolve Silicate
Into 40% solution
Na2CO3 dissolve &
stirring

C-230
3. Management
3.1 General
From the general observation the management of the factory seems rather
good because of the well maintained factory site, facilities and equipment.
Environmental problems in Tan Binh factory are leakage of products from the
vibrating sieves, and noise from the blowers disrupting the community.
Regarding wastewater, there are no environmental problems.
3.2 Raw material and utility consumption
Table 3 shows consumption amount of raw material and utilities in 1998.
Table 3 Consumption Amount of Raw Material and Utility(1998)
Material Used Unit Amount Cost/Unit Cost Detergent Powder LABSA Na2CO3 Sodium Sulfate STPP TINOPOL,CBS-X Fuel Oil & Diesel Oil Silicate (40%) Process Water Electricity Fragrant CMC
kg/t
l/t
kw/t l/t
1,425.00
633.00 3,989.00
673.00 1,583.00
831,075.00
3,348.00 7,836.00
792.00 20.00 39.60
10,576.91
1,622.42 1,124.23 6,090.14
355,542.52 FO:1,583.69 DO:3,153.05
764.75 3,100.00
740.00 278,374.79
11,674.00
15,072,096.00 1,026,991.80 4,484,553.00 4,098,664.20 5,628,238.40
394,849,550.00 1,834,294,720.00
2,560,383.00 24,291,600.00
586,080.00 5,567,495.80
462,290.40
LAS LAB Sulfur NaOH Electricity Fuel Oil Diesel Oil
kg
kw/t l/t l/t
8,812.00 1,230.00
104.40 2,551,000.00
173,925.00 28,987.00
12,509.34
1,267.46 4,000.00
810.00 1,583.69 3,135.05
110,234,805.90
1,558,975.80 132,322.82
2,066,310.00 275,443,283.30 91,397,460.35
Detergent Paste LABSA Na2CO3 Sodium Sulfate STPP Silicate (40%) Electricity Process Water Fragrant CMC
kg/t
l/t
57.20 30.10 37.60 15.00 64.00
18,800.00 169.20
0.94 3.00
10,576.91
1,622.42 1,124.23 6,090.14
764.75 740.00
3,100.00 278,374.97
11,674.00
604,999.25 48,834.84 42,271.01 91,352.10 48,994.00
13,912,000.00 524,520.00 261,672.00 35,022.00

C-231
4. Industrial Wastewater Treatment and Discharge
4.1 Wastewater Quality
The water system and sampling points are described in Table 4 and the results
of the analysis for wastewater by the JICA team are shown in Table 5.
Table 4 Sampling Points (Binh Duong Factory)
Sampling Point 1 Washing Water 2 Domestic Wastewater in the Pond 3 Well Water 4 Cooling Water after Treatment 5 Industrial Wastewater in the Drainage 6 River Water ( the Sai Gon River at Bing Duong Province)
Basically, the Binh Duong factory discharges no industrial wastewater outside
of the factory and has had no problems so far.
Table 5 Wastewater Quality in Binh Duong Factory (CECO)
Sampling Point 1 2 3 4 5 6 Parameter Unit
Time 11:15 11:32 11:40 11:45 11:52 13:54 Temp. ℃ 31 26 29 32 28 27 pH 6.7 6.9 5.0 6.4 5.4 7.8 Conductivity mmS/
㎝ 0.05 0.07 0.2 0.2 0.04 0.03
Turbidity NTU 1 15 10 1 31 40 Oil content ㎎/l 0.03 0.1 <0.01 <0.01 0.12 0.15 BOD5 ㎎/l 4.7 27 4 2 10 6 COD ㎎/l 12.8 48 14 3.2 14.4 9.2 DO ㎎/l 6.7 4.9 4.0 6.4 5.6 5.0 SS ㎎/l 6 12 6 1 26 35 T-nitrogen ㎎/l 1.8 9.2 1.7 1.6 6.35 3.2 CN ㎎/l <0.001 0.024 <0.001 <0.001 0.012 0.003 Phenol ㎎/l <0.001 0.002 <0.001 <0.001 0.020 0.001 Residual Cl ㎎/l 0.02 0.04 0.04 0.05 0.06 0.02 SO4 ㎎/l 1.6 27 2 0.32 18 2.6 LAS ㎎/l 10.3 4.8 <0.01 <0.01 38.4 1.02 T-P ㎎/l 0.01 0.17 0.02 0.01 1.33 0.02

C-232
Remarks:
Sampling Point No.1: Washing Water
Sampling Point No.2: Domestic Wastewater in the Pond
Sampling Point No.3: Well Water
Sampling Point No.4: Cooling Water Downstream of the Treatment Process
Sampling Point No.5: Industrial Wastewater in the Drainage
Sampling Point No.6: River Water (the Sai Gon River at the Binh Duong Province)
5. Recommended Countermeasures for Improvement
5.1 Short Term Countermeasures
(1) Apply for ISO 9000 as soon as possible. In order to apply, the factory and
facilities should be maintained cleanly and orderly, and the documentation
system for production and quality control should be completed orderly.
(2) Reduce product loss by installing sliding lids on vibrating sieves in the Tan
Binh Factory. This results cost reduction and environmental improvement.
5.2 Mid- Term and Long Term Countermeasures
(1) Conduct a study on countermeasures for noise generated by the rotating
machines in the Tan Binh Factory. In order to improve the present condition,
the detail analysis on noise sources such as rotating machines is required, for
example, measurement of frequency of noise and noise level and check of
maintenance condition of machines. According to above analysis, the
appropriate countermeasures can be selected and implemented effectively.

C-233
CASE STUDY C-20
Da Nang Chemical Industry Company
Survey Date: December 16, 1999
1. General
1.1 Profile
The Da Nang Chemical Industry Company is one of the State-owned
companies producing powder detergents and NPK fertilizers. The company profile
is summarized in Table 1.
Table 1 Company Profile
Company Name: Da Nang Chemical Industrial Company Ownership: State-owned
Address: 53- Le Hong Phong- Da Nang City
Vice Director: Mr. Huynh Ngoc Thuyen
Established 1975 Corporate Capital Number of Employees: 300 including 60 engineers,150 technicians
Main Products: Detergent & Additives, NPK fertilizer
The company was established in 1975 as part of the Viet Nam Chemical
Corporation and is located in the Hoa Khanh Industrial Zone 15 km west of Da
Nang City. The company’s 3 main activities are ① production of chemical products,
②research, development and design of chemical products and ③ construction of
chemical plants.
1.2 Status of Business
As for powder detergents, the business had grown every year prior to 1998, but
since 1998 the business has decreased steeply because of increased competition
with JV companies supported by P&G and Unilever. Though the market is very
tight the company has an estimated sales plan and hopes to keep developing at
20-25% a year. On the other hand, the fertilizer business is in good condition and
production is expected to double in 1999 compared to 1998' production levels.
However, NPK fertilizer is the only the product whose raw materials are all
purchased from other enterprises and the company has future plans (as pre-F/S) to
install a new fertilizer production plant for superphosphate using fused

C-234
magnesium.
(1) Production
The capacity of the facility and their total production in 1998 are shown in the
attachment, but the actual capacity for fertilizer is now 10,000t/y after renovation
of the process. Excessive amounts of the product have been exported to IRAQ
recently. LAS for detergent powder is supplied by domestic producers like TICO, a
company in Hai Phong, a company in HCMC and a JV company with an
Indonesian company in Long Thang province. Silicate compound is also produced
in the company utilizing soil mined from the area near the factory as a natural
resource, and the liquid by-product of Na2SiO2 is stored in two storage tanks at
50ºC for selling to detergent producers and for consumption for their powder
products. Actual annual production and revenues are shown in Table 2.
Table 2 Annual Production and Revenues in 1998
Product Capacity (t/y) Production (t) Revenue (million VND) Detergent Powder 5,000 6,506 Detergent Paste 3,000 1,704 Fertilizer 5,000 2,086 Sodium Silicate 5,000 3,003 Total 32,728
(2) Debt
According to the data submitted by the company, they have 3,500 million VND
of debt with the Da Nang Industrial and Commerce Bank.
2. Production Technology
2.1 Process
The production technology for both powder detergent and NPK fertilizer were
developed autonomously as their own technology, but they do not give this process
a good evaluation and the facility itself is rather old. The NPK fertilizer production
process in the JV company with a Japanese company, stands out as one of reference
for the design of their processes, especially the design for the steam granular
production unit.

C-235
Figure 1 Detergent Production Process
Figure 2 Sodiam Solicate Production Process
LAS Soda Sulfate STP Silicate Water
Mixing Silicate Plant
Drying
Packaging
Raw
Material
Melting
(1400℃)
Cooling
Aqueous Solution
Preparation Vessel
(100-120℃)
Storage Tank
(50℃)
Drum filling

C-236
2.2 Wastewater Source
Supply water is drawn from a deep well in the factory at 40-150m3/d and it
goes through a filtering treatment and is supplied to the powder detergent
production process as cooling water, cleaning water, process water, boiler feed
water at 1t/hr and for domestic use. In addition process water is lost through
evaporation in the drying unit at 20m3/d. The actual volume of supply water is
80m3/d at present operating conditions. At the NPK fertilizer plant, only a little
water is consumed to add moisture to the product. A periodical analysis for
circulating water is said to be done.
The factory discharges no industrial wastewater outside the factory. In the Hao
Khanh Industrial Zone, it is already prohibited to discharge industrial wastewater
to the big, nearby lake and the company installed a wastewater treatment system
based on a sedimentation pond. The wastewater issue has been the only subject
related to the environment considered by the government and the company.
However, technology for the wastewater treatment is not yet complete and they
hope to complete it soon in the near future.
The water system and sampling points are described in Figure 3.
3. Management
3.1 General
The management of the factory is concentrating on increasing production. In
order to improve environmental conditions, they think about, study and implement
ways to improve the production system itself. On the other hand, they are not
considering applying for ISO yet because of their busy work on quality
management. There are no environmental problems in the factory.
3.2 Annual Consumption of Raw Material and Utilities
Table 3 shows annual consumption of raw material for each product, additives,
and utilities with their cost in 1998.

C-237
Well Water
10m3/d ①
Figure 3 Water System and Sampling Points
Table 3 Annual Consumption and Cost in 1998
Material Used Unit Amount Cost (million VND) Detergent LAS Soda Sodium Sulfate STP Sodium Silicate Water Fuel Oil Diesel Oil Electricity
Tons
m3 Tons
kwh
1,120 1,500 2,395 255
2,500 11,650
950 104
690,645
25,135.85 12,320 3,300 2,874 1,785 2,375 34.95 1,520 374.4 552.5
Fertilizer Urea FA DAP Superphosphate Potassium Sulfate Coal Powder Electricity
Tons
kwh
250 550 140 600 260 300
73,000
4. Industrial Wastewater Treatment and Discharge
4.1 Wastewater quality
Table 4 shows sampling points, and table 5 shows results of analysis by CECO
for wastewater samples taken at the same time as the JICA Team.
Silicate Production
20m3/d 5m3/d 5m3/d
Steam
③ 20m3/d
Clean Water Tank Recycled
Water Tank
Boiler
Mixing
Drying
Sedimentation
②

C-238
Table 4 Sampling Points
Sampling Points Samples 1 Well Water 2 Recycled Water before Sedimentation 3 Recycled Water after Sedimentation
Table 5 Wastewater Quality (CECO)
Sampling Point 1 2 3 Parameter Unit
Time 9:55 10:05 9:50 Temp. ℃ 25 24 25 pH 6.6 10.6 6.6 Conductivity mmS/㎝ 0.3 10 0.3 Turbidity NTU 4 331 4 Oil content ㎎/l <0.01 0.25 <0.01 BOD5 ㎎/l 7 68 7 COD ㎎/l 16 128 16 DO ㎎/l 4.6 4.3 4.6 SS ㎎/l 7 389 7 T-nitrogen ㎎/l 2.3 13 2.3 Phenol ㎎/l <0.001 0.05 <0.001 Residual Cl ㎎/l 0.07 0.58 0.07 SO4 ㎎/l 62 275 62 CN ㎎/l 0.009 0.063 0.009 T-P ㎎/liter 0.02 0.21 0.02 LAS 0.0 1,564.1 0.0
There is no wastewater pollution to environment because the factory
discharges no industrial wastewater outside the factory.
5. Recommended Countermeasures for Improvement
5.1 Short Term Countermeasures
(1) Apply for ISO 9000 as soon as possible. In order to apply, the factory and
facilities should be maintained cleanly and orderly, and the documentation
system for production and quality control should be completed orderly.
(2) Prevent the leakage of oil from the storage tank through reinforcement of
maintenance and operation. Clean up the oil leakage in the oil storage tank of
the furnace.
5.2 Mid- Term and Long Term Countermeasures
(1) There are no special recommendations.

C-239
CASE STUDY C-21
Da Nang Rubber Company Survey Date : December 17, 1999
1. General
1.1 Profile
The Da Nang Rubber Company is one of the state-owned companies producing
tires and tubes for cars and motorbikes. The company profile is summarized in
Table 1.
Table 1 Company Profile
Company Name: Da Nang Rubber Company Ownership: State-owned Address: 01 Le Van Hien- Da Nang City
Vice Director: Mr. Phan Thanh Hoang
Established 1975 Corporate Capital Number of Employees: 1,000 including 120 university graduates
Main Products: Auto, and Motorcycle Tires
1.2 Status of Business
The business is in good position at present because of the high growth rate of
demand for cars and motorbikes in the country. Revenues in 1998 were
175,000,000,000VND(15,000,000US$) for tire and tube sales. The main clients for
their tires and tubes are domestic.
(1) Production
The production amount for car tires in 1998 was 100,000 sets and for
motorbike tires 1,500,000 sets. This included a renewal of car tires of 20,000 sets
and for motorbike tires, 60,000 sets. Development of the tire business has risen
very steep during the years from 1994 to 1997, with a growth rate of almost double
that of the previous year. Rapid development continued even after 1998. Sales by
production for each year are shown in Table2.

C-240
Table 2 Sales Trends
Year Sales (million VND) 1994 16,000 1995 32,000 1996 64,000 1997 114,000 1998 175,000
1999 (Estimated) 250,000
(2) Debt
There is no description.
2. Production Technology
2.1 Process
The production technology used for tires and tubes is a mixture of various
technologies, and equipment from many countries have been introduced into the
process.
Figure 1 shows car or motorcycle tires and tubes production process, and
Figure 2 shows bicycle tires and tubes production process.
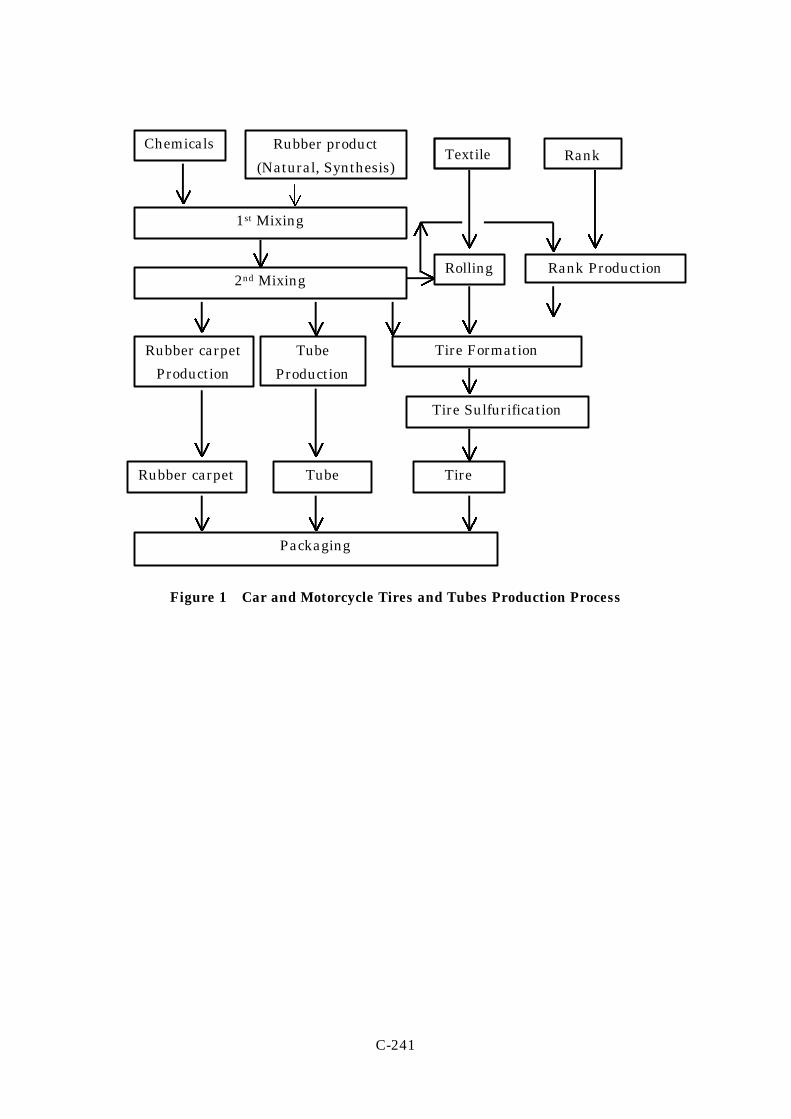
C-241
Figure 1 Car and Motorcycle Tires and Tubes Production Process
Chemicals Rubber product
(Natural, Synthesis)
1st Mixing
2nd Mixing Rolling Rank Production
Rubber carpet
Production
Tube
Production
Tire Formation
Tire Sulfurification
Rubber carpet Tube Tire
Packaging
Textile Rank
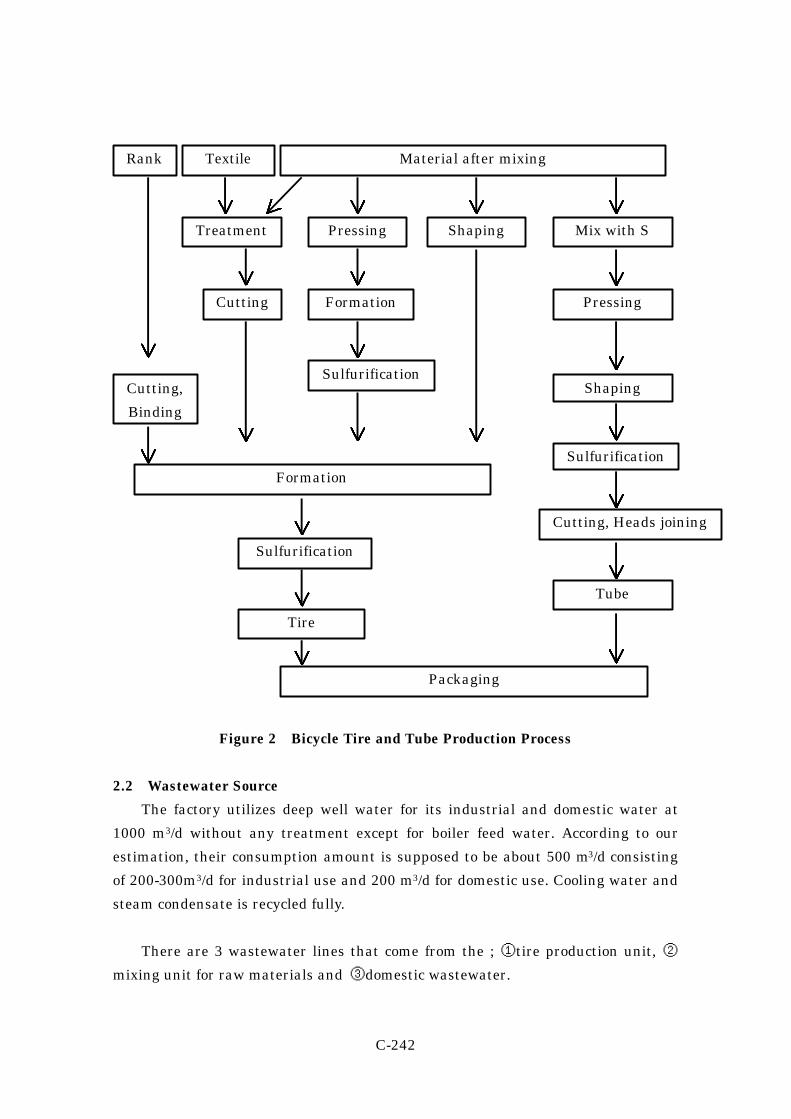
C-242
Figure 2 Bicycle Tire and Tube Production Process
2.2 Wastewater Source
The factory utilizes deep well water for its industrial and domestic water at
1000 m3/d without any treatment except for boiler feed water. According to our
estimation, their consumption amount is supposed to be about 500 m3/d consisting
of 200-300m3/d for industrial use and 200 m3/d for domestic use. Cooling water and
steam condensate is recycled fully.
There are 3 wastewater lines that come from the ; ①tire production unit, ②
mixing unit for raw materials and ③domestic wastewater.
Material after mixing
Shaping Pressing
Sulfurification
Mix with S
Formation
Formation
Pressing
Shaping
Sulfurification
Cutting, Heads joining
Tire
Tube
Rank Textile
Treatment
Cutting
Cutting,
Binding
Sulfurification
Packaging

C-243
Industrial wastewater is discharged from the cooling and product washing
process, and part of the water is circulated in the factory. So the wastewater is said
to have no contamination from the production process. The amount of industrial
wastewater discharged to common city drainage is estimated to be around 200-300
m3/d and common drainage is connected to the sea. Because the local government is
very strict on environmental issues, a periodical analysis of environmental items is
performed by DOSTE as EIA every 3 months.
The treatment facilities for industrial water include an ion exchange for boiler
feed water and a sedimentation pond for circulation water. The treatment of 2
industrial wastewater discharge is only a small sedimentation pond. Actually,
almost all drainage, including that for domestic use water, contains oil on the
surface and all roads in the factory are smeared by oil which was explained to be
leakage oil, and to come especially, from lubricant oil of equipment in all production
facilities. The floors of several buildings were observed to be very dusty and dirty.
Water system and sampling points are shown in Figure 3.
Well Water
①
200m3/d 200-300m3/d
③ ② ⑤
To the Common Drainage To Processes
Figure 3 Water system and sample points
Domestic Use Industrial Use
Mixing Ion Exchange Cooling Water
④
Boiler
Tire Production

C-244
3. Management
The management at the factory is concentrating on further production
expansion and 2 future projects are being proceeded with at present for car tires
and car tubes. The first project is an expansion of capacity from the existing
120,000 sets to 200,000 sets in the year 2000. This project requires an investment
of 75,000,000,000 VND which has already been approved by MOI. The second
project is a plan for expansion of production capacity from 200,000 sets to 500,000
in the year of 2003 and the required investment is estimated to be about
430,000,000,000 VND. As the area for expansion is limited in the existing factory,
the main mixing unit will be installed in another industrial zone, the Lien Chieu
Industrial Zone, for the second project.
Main concerns for the environmental protection are waste gas emission , solid
waste and industrial wastewater. The gas from the boiler facility contains sulfur
compounds and the rubber sulfurnizing unit emits toxic exhaust gas. Dust of
carbon black is another air pollution problem. Solid waste from rubber production
is rather huge, and includes polyamide products and all kinds of waste rubber.
The application for ISO 9000 is now under way and is expected to be complete
in the middle of next year. An application for ISO 14000 will be discussed at the
second project stage.
3.2 Unit Consumption Ratio
Unit consumption ratios for raw materials at 100 kg of rubber, the main raw
material, are shown in Table 3.
Table 3 Unit Consumption Ratio for Raw Materials
Commercial Name Unit Cosumption Sulfur 2.5 Zinc Oxide 4.0 Stearic Acid 2.0 Accelerator DM 1.0 Accelerator D 0.5 Accelerator DMTD 0.1 Accelerator Cz 0.6 Accelerator Ez 0.05 Paraffin 1.0 Calcium Carbonate 10.0 Kaolin 20.0
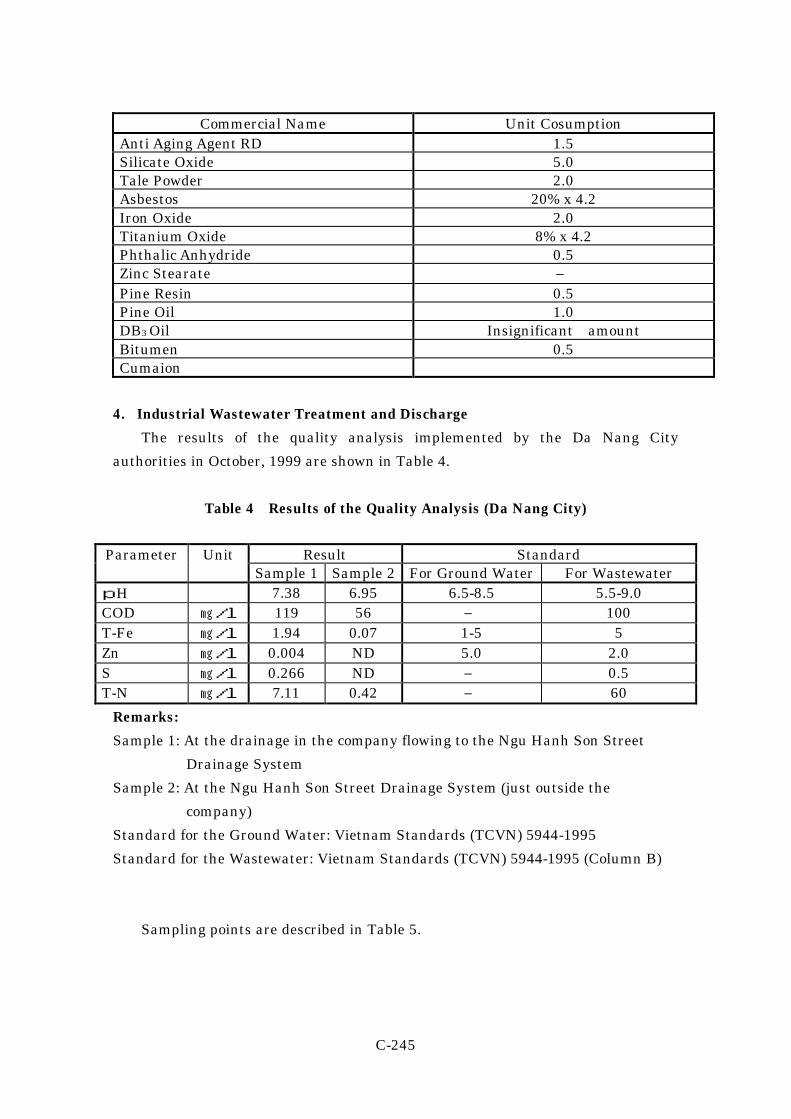
C-245
Commercial Name Unit Cosumption Anti Aging Agent RD 1.5 Silicate Oxide 5.0 Tale Powder 2.0 Asbestos 20% x 4.2 Iron Oxide 2.0 Titanium Oxide 8% x 4.2 Phthalic Anhydride 0.5 Zinc Stearate ― Pine Resin 0.5 Pine Oil 1.0 DB3 Oil Insignificant amount Bitumen 0.5 Cumaion
4. Industrial Wastewater Treatment and Discharge
The results of the quality analysis implemented by the Da Nang City
authorities in October, 1999 are shown in Table 4.
Table 4 Results of the Quality Analysis (Da Nang City)
Result Standard Parameter Unit Sample 1 Sample 2 For Ground Water For Wastewater
pH 7.38 6.95 6.5-8.5 5.5-9.0 COD ㎎/l 119 56 ― 100 T-Fe ㎎/l 1.94 0.07 1-5 5 Zn ㎎/l 0.004 ND 5.0 2.0 S ㎎/l 0.266 ND ― 0.5 T-N ㎎/l 7.11 0.42 ― 60
Remarks:
Sample 1: At the drainage in the company flowing to the Ngu Hanh Son Street
Drainage System
Sample 2: At the Ngu Hanh Son Street Drainage System (just outside the
company)
Standard for the Ground Water: Vietnam Standards (TCVN) 5944-1995
Standard for the Wastewater: Vietnam Standards (TCVN) 5944-1995 (Column B)
Sampling points are described in Table 5.

C-246
Table 5 Sampling Points and Detail of the samples
Sample Points Sampling Points 1 Well Water 2 Wastewater from the Tire Production Process 3 Wastewater from the Mixing Unit 4 Cooking Water in the Recycle Line 5 Boiler Feed Water downstream of the Treatment Process
The results of the analysis by CECO for wastewater samples taken at the same
time as the JICA Team are shown in Table 6.
Table 6 Wastewater Quality (CECO)
Sampling Point 1 2 3 4 5 Parameter Unit
Time 10:25 10:40 10:50 10:20 10:35 Temp. ℃ 27.5 38 29 23 28 pH 7.3 8.2 8.0 8.4 7.6 Conductivity mmS/㎝ 0.45 0.43 0.35 0.43 0.65 Turbidity NTU 3 4 1 1 0 Oil content ㎎/l <0.01 0.15 0.1 0.12 <0.01 BOD5 ㎎/l 3 16 18 9 3 COD ㎎/l 12 24 32 20 8 DO ㎎/l 5.7 3.9 3.3 4.3 5.1 SS ㎎/l 7 4 3 4 2 T-nitrogen ㎎/l 1.9 6.8 7.8 5.7 1.2 Phenol ㎎/l <0.001 0.002 0.002 0.001 0.001 Residual Cl ㎎/l 0.03 0.02 0.02 0.03 0.04 SO4 ㎎/l 3.5 8.59 5.25 5.67 2.73 CN ㎎/l 0.003 0.001 0.001 0.002 0.007 Fe ㎎/l 0.04 0.07 0.06 0.04 0.03 Zn ㎎/l 0.22 0.28 0.3 0.32 0.4 S ㎎/l 5.67 34 28.70 34 3.86
4.2 Regulation standard for Industrial Wastewater
Regulation Standards for Industrial Wastewater (Rank B) in Viet Nam are
shown in Table 7.
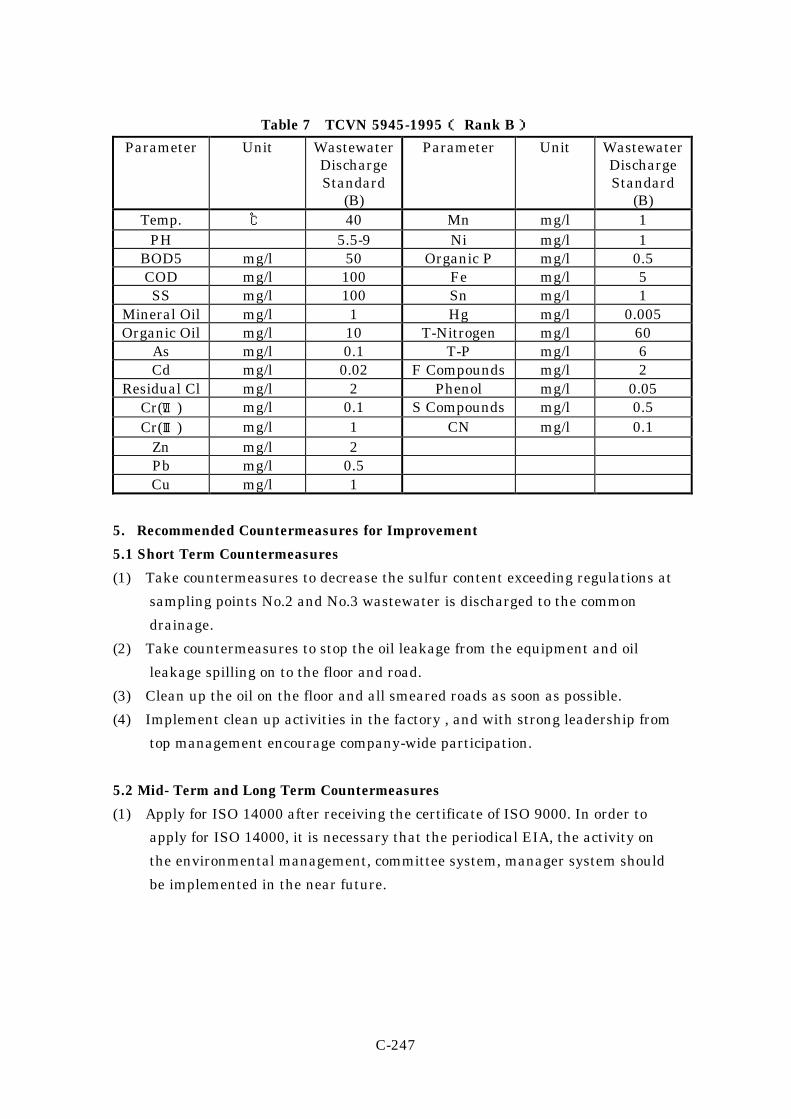
C-247
Table 7 TCVN 5945-1995( Rank B)
Parameter Unit Wastewater Discharge Standard
(B)
Parameter Unit Wastewater Discharge Standard
(B) Temp. ℃ 40 Mn mg/l 1
PH 5.5-9 Ni mg/l 1 BOD5 mg/l 50 Organic P mg/l 0.5 COD mg/l 100 Fe mg/l 5 SS mg/l 100 Sn mg/l 1
Mineral Oil mg/l 1 Hg mg/l 0.005 Organic Oil mg/l 10 T-Nitrogen mg/l 60
As mg/l 0.1 T-P mg/l 6 Cd mg/l 0.02 F Compounds mg/l 2
Residual Cl mg/l 2 Phenol mg/l 0.05 Cr(Ⅵ) mg/l 0.1 S Compounds mg/l 0.5 Cr(Ⅲ) mg/l 1 CN mg/l 0.1
Zn mg/l 2 Pb mg/l 0.5 Cu mg/l 1
5. Recommended Countermeasures for Improvement
5.1 Short Term Countermeasures
(1) Take countermeasures to decrease the sulfur content exceeding regulations at
sampling points No.2 and No.3 wastewater is discharged to the common
drainage.
(2) Take countermeasures to stop the oil leakage from the equipment and oil
leakage spilling on to the floor and road.
(3) Clean up the oil on the floor and all smeared roads as soon as possible.
(4) Implement clean up activities in the factory , and with strong leadership from
top management encourage company-wide participation.
5.2 Mid- Term and Long Term Countermeasures
(1) Apply for ISO 14000 after receiving the certificate of ISO 9000. In order to
apply for ISO 14000, it is necessary that the periodical EIA, the activity on
the environmental management, committee system, manager system should
be implemented in the near future.

C-248