Embed Size (px)
Citation preview
Chapter 14Chapter 14
SamplingSampling
McGraw-Hill/Irwin Copyright © 2011 by The McGraw-Hill Companies, Inc. All Rights Reserved.

14-2
Learning ObjectivesLearning Objectives
Understand . . .
• The two premises on which sampling theory is based.
• The accuracy and precision for measuring sample validity.
• The five questions that must be answered to develop a sampling plan.

14-3
Learning ObjectivesLearning Objectives
Understand . . .
• The two categories of sampling techniques and the variety of sampling techniques within each category.
• The various sampling techniques and when each is used.

14-4
Small Samples Can EnlightenSmall Samples Can Enlighten
“The proof of the pudding is in the eating.
By a small sample we may judge of the
whole piece.”
Miguel de Cervantes Saavedra
author

14-5
PulsePoint: PulsePoint: Research RevelationResearch Revelation
80 The average number of text messages sent per day by
American teens.

14-6
The Nature of SamplingThe Nature of Sampling
•Population
•Population Element
•Census
•Sample
•Sampling frame

14-7
Why Sample?Why Sample?
Greater accuracy
Availability of elements
Availability of elements
Greater speed
Greater speed
Sampling provides
Sampling provides
Lower costLower cost
14-8
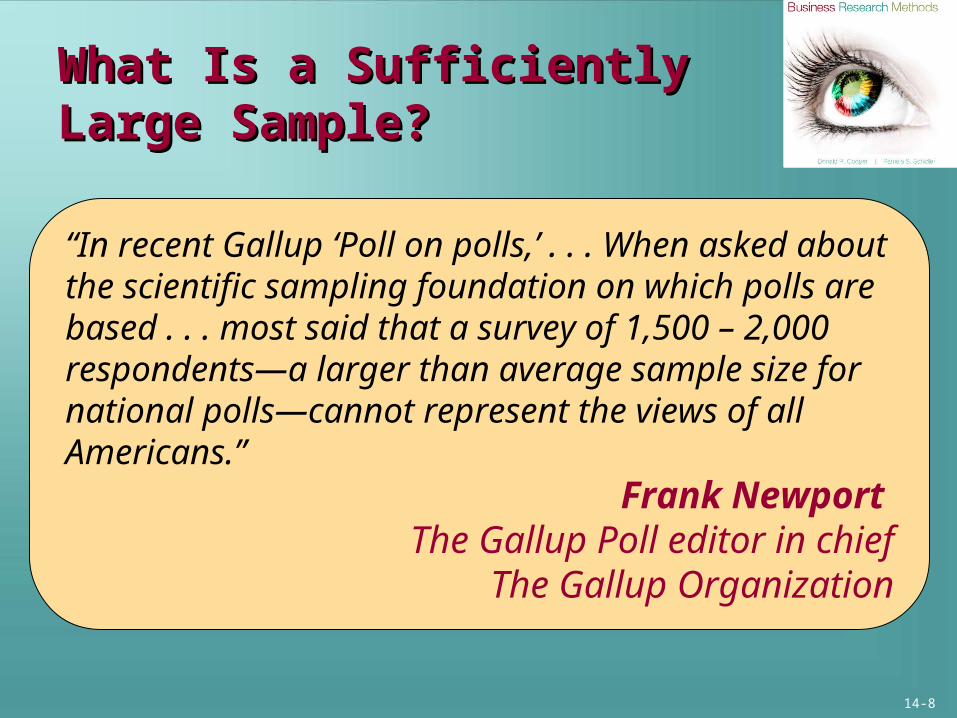
What Is a Sufficiently What Is a Sufficiently Large Sample?Large Sample?
“In recent Gallup ‘Poll on polls,’ . . . When asked about the scientific sampling foundation on which polls are based . . . most said that a survey of 1,500 – 2,000 respondents—a larger than average sample size for national polls—cannot represent the views of all Americans.”
Frank Newport The Gallup Poll editor in chief
The Gallup Organization

14-9
When Is a Census When Is a Census Appropriate?Appropriate?
NecessaryFeasible

14-10
What Is a Valid Sample?What Is a Valid Sample?
Accurate Precise

14-11
Sampling Design Sampling Design within the Research Processwithin the Research Process

14-12
Types of Sampling DesignsTypes of Sampling Designs
Element
Selection
Probability Nonprobability
•Unrestricted • Simple random • Convenience
•Restricted • Complex random • Purposive
• Systematic • Judgment
•Cluster •Quota
•Stratified •Snowball
•Double

14-13
Steps in Sampling DesignSteps in Sampling Design
What is the target population?What is the target population?
What are the parameters of interest?What are the parameters of interest?
What is the sampling frame?What is the sampling frame?
What is the appropriate sampling method?
What is the appropriate sampling method?
What size sample is needed?What size sample is needed?

14-14
When to Use Larger Sample?When to Use Larger Sample?
Desired precisionDesired
precisionNumber of subgroupsNumber of subgroups
Confidence level
Confidence level
Population variance
Small error range

14-15
Simple RandomSimple Random
Advantages•Easy to implement with random dialing
Disadvantages•Requires list of population elements
•Time consuming
•Larger sample needed
•Produces larger errors
•High cost

14-16
SystematicSystematic
Advantages•Simple to design
•Easier than simple random
•Easy to determine sampling distribution of mean or proportion
Disadvantages•Periodicity within population may skew sample and results
•Trends in list may bias results
•Moderate cost
14-17
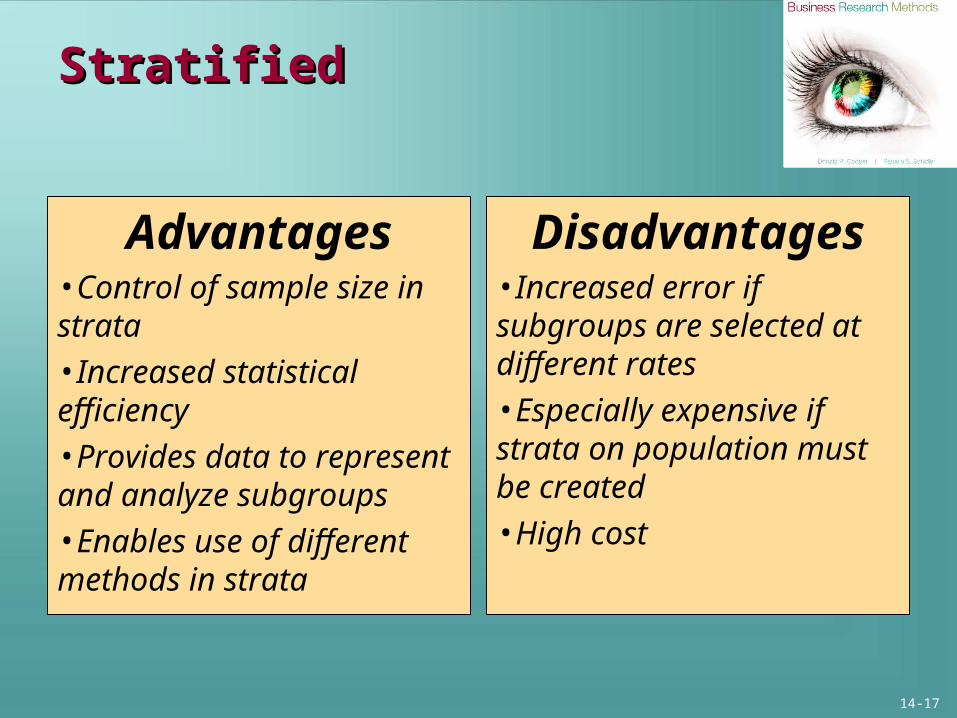
StratifiedStratified
Advantages•Control of sample size in strata•Increased statistical efficiency•Provides data to represent and analyze subgroups•Enables use of different methods in strata
Disadvantages•Increased error if subgroups are selected at different rates•Especially expensive if strata on population must be created •High cost
14-18
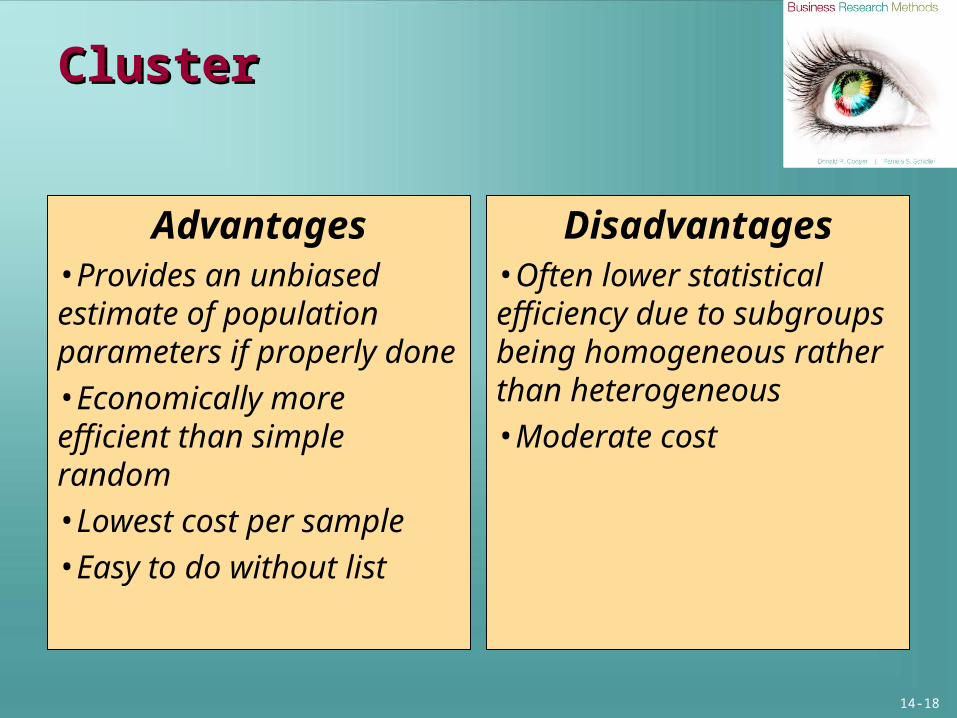
Cluster Cluster
Advantages•Provides an unbiased estimate of population parameters if properly done•Economically more efficient than simple random•Lowest cost per sample•Easy to do without list
Disadvantages•Often lower statistical efficiency due to subgroups being homogeneous rather than heterogeneous•Moderate cost

14-19
Stratified and Cluster SamplingStratified and Cluster Sampling
Stratified•Population divided into few subgroups•Homogeneity within subgroups•Heterogeneity between subgroups•Choice of elements from within each subgroup
Cluster•Population divided into many subgroups•Heterogeneity within subgroups•Homogeneity between subgroups•Random choice of subgroups

14-20
Area SamplingArea Sampling

14-21
Double SamplingDouble Sampling
Advantages•May reduce costs if first stage results in enough data to stratify or cluster the population
Disadvantages•Increased costs if discriminately used

14-22
Nonprobability SamplesNonprobability Samples
Cost
FeasibilityFeasibility
TimeTime
No need to generalize
Limited objectivesLimited
objectives

14-23
Nonprobability Nonprobability Sampling MethodsSampling Methods
ConvenienceConvenience
JudgmentJudgment
QuotaQuota
SnowballSnowball

14-24
Key TermsKey Terms
• Area sampling
• Census
• Cluster sampling
• Convenience sampling
• Disproportionate stratified sampling
• Double sampling
• Judgment sampling
• Multiphase sampling
• Nonprobability sampling
• Population
• Population element
• Population parameters
• Population proportion of incidence
• Probability sampling

14-25
Key TermsKey Terms
• Proportionate stratified sampling
• Quota sampling
• Sample statistics
• Sampling
• Sampling error
• Sampling frame
• Sequential sampling
• Simple random sample
• Skip interval
• Snowball sampling
• Stratified random sampling
• Systematic sampling
• Systematic variance

Appendix 14aAppendix 14a
Determining Determining Sample SizeSample Size
McGraw-Hill/Irwin Copyright © 2011 by The McGraw-Hill Companies, Inc. All Rights Reserved.

14-27
Random SamplesRandom Samples

14-28
Increasing PrecisionIncreasing Precision

14-29
Confidence Levels & the Confidence Levels & the Normal CurveNormal Curve

14-30
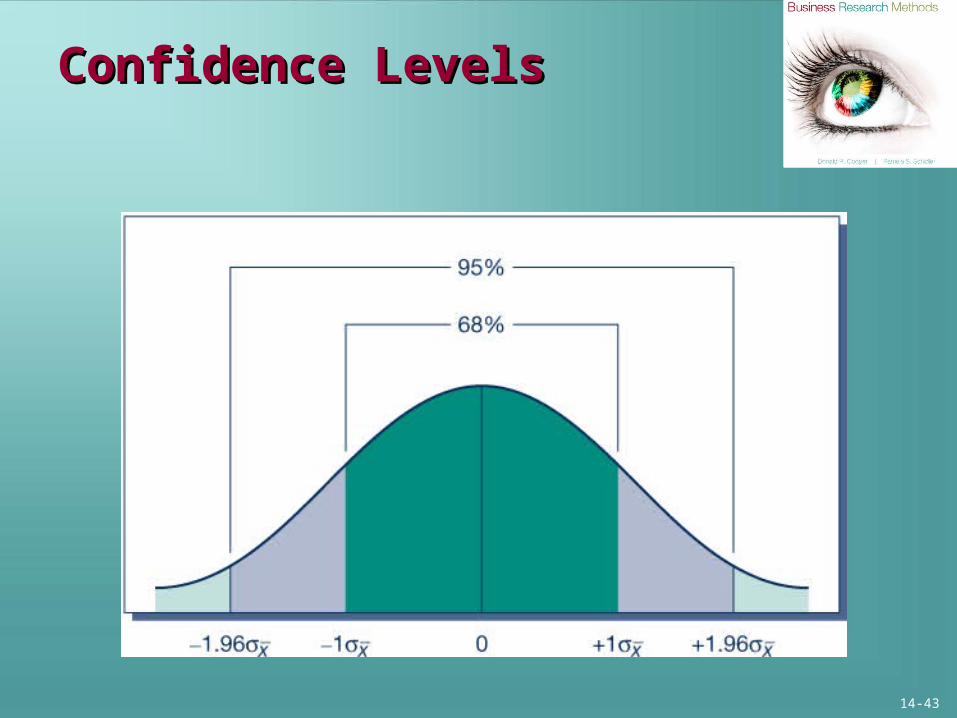
Standard ErrorsStandard Errors
Standard Error
(Z score)
% of Area Approximate Degree of
Confidence
1.00 68.27 68%
1.65 90.10 90%
1.96 95.00 95%
3.00 99.73 99%
14-31
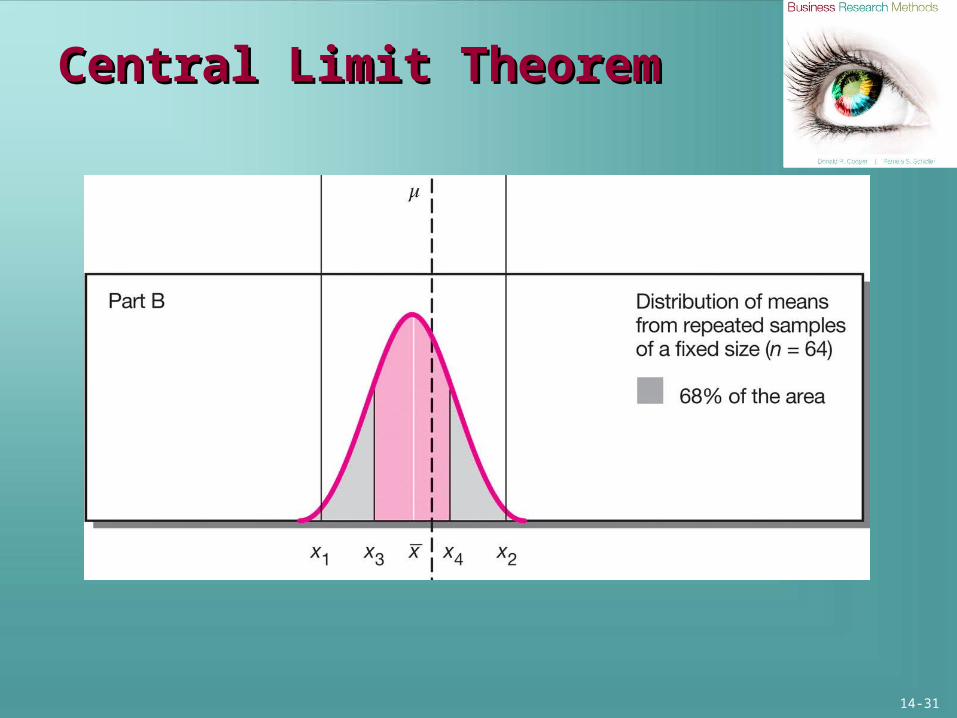
Central Limit TheoremCentral Limit Theorem

14-32
Estimates of Dining VisitsEstimates of Dining Visits
Confidence Z score
% of Area
Interval Range
(visits per month)
68% 1.00 68.27 9.48-10.52
90% 1.65 90.10 9.14-10.86
95% 1.96 95.00 8.98-11.02
99% 3.00 99.73 8.44-11.56

14-33
Calculating Sample Size for Calculating Sample Size for Questions involving MeansQuestions involving Means
PrecisionPrecision
Confidence levelConfidence level
Size of interval estimateSize of interval estimate
Population DispersionPopulation Dispersion
Need for FPANeed for FPA

14-34
Metro U Sample Size for MeansMetro U Sample Size for Means
Steps InformationDesired confidence level 95% (z = 1.96)
Size of the interval estimate .5 meals per month
Expected range in population
0 to 30 meals
Sample mean 10
Standard deviation 4.1
Need for finite population adjustment
No
Standard error of the mean .5/1.96 = .255
Sample size (4.1)2/ (.255)2 = 259

14-35
Proxies of the Proxies of the Population DispersionPopulation Dispersion
• Previous research on the topic
• Pilot test or pretest
• Rule-of-thumb calculation– 1/6 of the range

14-36
Metro U Sample Size for Metro U Sample Size for ProportionsProportions
Steps InformationDesired confidence level 95% (z = 1.96)
Size of the interval estimate .10 (10%)
Expected range in population 0 to 100%
Sample proportion with given attribute
30%
Sample dispersion Pq = .30(1-.30) = .21
Finite population adjustment No
Standard error of the proportion
.10/1.96 = .051
Sample size .21/ (.051)2 = 81

14-37
Appendix 14a: Key TermsAppendix 14a: Key Terms
• Central limit theorem
• Confidence interval
• Confidence level
• Interval estimate
• Point estimate
• Proportion

Addendum: Keynote
CloseUp
McGraw-Hill/Irwin Copyright © 2011 by The McGraw-Hill Companies, Inc. All Rights Reserved.

14-39
Keynote ExperimentKeynote Experiment

14-40
Keynote Experiment (cont.)Keynote Experiment (cont.)

Determining Determining Sample SizeSample Size
Appendix 14a
McGraw-Hill/Irwin Copyright © 2011 by The McGraw-Hill Companies, Inc. All Rights Reserved.

14-42
Random SamplesRandom Samples
14-43
Confidence LevelsConfidence Levels

14-44
Metro U. Dining Club StudyMetro U. Dining Club Study