Embed Size (px)
Citation preview

CHAPTER 111
OBJECTIVES AND METHODOLOGY
3.1 NEED FOR THE STUDY
The Public Distribution System in Tamilnadu is established to meet the
basic needs of the community who cannot afford to depend upon the market
forces alone to obtain supplies of essential commodities. It also involves a
heavy outgo in the form of subsidies from the public exchequer both a t the
Central and State Government levels. Hence it is imperative that the system
needs to work a t its peak efficiency. However, there have been several
complaints about the system through the mass media as well as through
direct representations to the authorities concerned. Some of these complaints
relate to broad policy issues like geographical coverage, population coverage,
commodity coverage, extent of subsidy, etc. and many others relate to
operational issues like non-availability of commodities a t the shop level, under
weighrnent, bogus cards, poor quality, etc. In the past as well as to a great
extent even now, most of the decisions involving the Public Distribution
System have been based on the experience and intuition of officials and the
political compulsions of the Government of the day. Decisions were not taken
on scientific basis partly due to the complexities involved in analysing the
problem and partly due to the highly sensitive nature of the problems

confronted by the Public Distribution System calling for quick and
"acceptable" decisions.
A number of studies have been taken up in the recent past on the
Public Distribution System. Since the system is dynamic in nature, tllere is
a wide scope for many more studies. From the literature survey in Chapter
11, it was found that studies relating to Tamilnadu State have been very few
and most of them have become out of context. The most recent study relates
to Madras city only (Submitted to Madras University by Fatima Jacob in
1995). There has not been a study carried out so far covering the entire State
and getting the opinions of the policy planners, the social planners, the
consumers and the staff who operate the system. The present study is an
effort in this direction.
3.2 OBJECTIVES
The following are the objectives of the present study;
(i) To identify the perceptions (views, attitudes and preferences) of
the consumers (from rural and urban areas and belonging to
different income groups) regarding the critical elements of the
Public Distribution System in Tamil Nadu.
(ii) To identify the similarities and differences in the perceptions of
the consumers and sale~men in the Public Distribution System

outlets regarding the critical elements of the public Distribution
System in Tamilnadu.
(iii) To develop an index to measure the effectiveness of the present
Public Distribution System according to the perceptions of the
consumer.
(iv) To suggest a hierarchy of objectives of the Public Distribution
System in Tamilnadu for the enhancement of the above index.
(v) To evolve certain broad policy guidelines to make the present
Public Distribution System more effective so as to achieve the
above objectives.
(vi) To suggest specific measures for the improvement of the
operation of the present Public Distribution System so as to
enhance the index of consumer satisfaction.
3.3 SIGNIFICANCE OF TRE STUDY
The results of the present study will be useful to the policy planners
in the State Government in their efforts to improve the working of the
present system. It will be useful to the academicians and students in their
study of the present system. Finally the study results may be useful for
comparison with the results obtained by similar studies in other States.

3.4 RESEARCH DESIGN
The research design for the present study involved surveys,
quantitative analysis, testing of hypothesis and formulation of conclusions
based on the above. Both secondary and primary data were used. A short
description of the methodology followed is given below:
(i) Literature Survey
Data was gathered from Government Publications (including Budgets.
Economic Surveys, Plan Documents, Policy Notes, Committee Reports, etc.)
Annual Reports of the Food Corporation of India and Tamil Nadu Civil
Supplies Corporation, earlier siudies on Public Distribution System, recent
Publications and a large number of research articles in reputed journals. This
study not only resulted in a good data base but also enlightened the
researcher regarding the past policies, the bottlenecks, the reasons for failure,
etc. The final results of the other surveys were examined in the above
background.
(ii) Consumer Survey
A questionnaire on 19 key elements was prepared. These included 9
critical elements which determine the effectiveness of the system. A draft
questionnaire was pre-tested in Madras City and a village in Chengai-M.G.R.
district by get,ting the responses of a small group of people. Based on the

problems encountered some of the questions were re-phrased. Since
close-ended questions elicited more dear data than open-ended questions
:;vhich give xise to complex ans\c-ers which are difficult to classifyi, ihesr wele
preferred. The questionnaire was administered to consumers in the selected
Public Distribution System shops and their responses were recorded.
The questionnaire for consumer survey (Annexure I) was intended to
elicit responses from the consumers on the following 19 key elements;
Commodities purchased
Distance of the shops
Locational convenience
Timely availability
Persons who go to xhop
Time taken to complete the purchase
Reasons for delay in service
Convenience of working hours
Availability of total quota
Number of instalments preferred
Adequacy of entitlements
Basis for quota
Quality of supplies
Rehaviour of staff
Overall asse~sment
Ranking of complaints

* Preference for packed commodities
* Preferred agency for the Public Distribution System
* Suggestions
Of the above, on t,he basis of their intrinsic importance, their impact
on the effectiveness of the system, on the role they play in influencing the
other elements and the importance attached to these by consumers and
salesmen, the following 9 "critical elements" were chosen for in depth
analysis:
(i) Locational convenience
(ii) Timely availability
(iii) Time spent to complete the purchase
(iv) Suitability of working hours
(v) Quota availability
(vi) Adequacy of quantity
(vii) Acceptability of quality
(viii) Behaviour of staff and
(ix) Overall assessment
All these factors were taken up for more detailed analysis with
reference to the responses by the consumers who were sub-divided as rural
and urban as well as low, middle and high income groups. Some of these
were compared and contrasted along with the responses of the salesmen also.

(iii) Salesmen S w e y
Another questionnaire (Annexure 11) consisting of 7 questions for the
salesmen in the Public Distribution System outlets was prepared. This was
pre-tested in the same way as the consumer survey questiomaire. This was
administered to the main salesman in the same shop where the consumer
survey was conducted.
The s w e y was intended to obtain the following information/comments
from the salesmen.
# Nature of ownership of the shop
# Its monthly turnover
# Number of family cards attached to the shop
# Number of staff employed
# Whether their present salary is satisfactory or not
# Whether their present profit is adequate or not
# Whether they want to handle more commodities
# Whether they feel that they are rendering adequate service to
the consumers and
# What, according to them, among the following factors, prevent
their rendering better service to the consumers:
* Inadequate profits
* Non availability of all commodities at the proper time
* Over crowding of the cardholders

* Excessive supervision
* Insufficient space
* Damaged building
* Excessive scriptory work
Activities of anti-social elements and
* Demands by political parties and others
Among the above elements, except the monthly turnover, all others
were taken up for further analysis.
The following responses of the consumers have beeh compared and
contrasted with those of the salesmen.
(i) Timely availability
(ii) Time spent for completing the purchase
(iii) Availability of quota
(iv) Behaviour of staff and
(v) Overall assessment
(iv) Delphi Survey
Since it may not be possible to amve a1 various policy options in the
Public Distribution System through strict quantitative analyfiis, it was
decided to use the Delphi technique for this portion of the study. The
technique may he defined as follows.

'The Delphi Techniqile' is a method ibr the systematic solicitation and
collation of ~udgements 911 a particular topic through a set of carefully
designed sequential questionnaires inters~raeci with summanzed infwmaticn
and fecd back of opinions derived from earlier responses."
This technique uses sequential questionnaires to obtain information or
opinions from a group of experts. These experts never meet face to face since
the questionnaires are usually mailed. Thus, the group members retain their
anonymity throughout the process and verbal, domineering types who would
influence others in an interactive meeting are absent. Further, a statistical
group response can be calculated from the responses in each round. This
group response represents the pooled opinions of the group of experts. Again
by feeding back this group responge for examination by the participants, each
respondent is allowed to review and modify his response in lieu of this new
evidence. Thus, through successive rounds, the group of experts tends towards
a strong group consensus with regard lo the assigned topic.
With a view to select lssues un which data is to be collected, a pilot
s ~ u d y was carried out. Discussions were held by the researcher with experts
in Madras and Delhi on the various issues to be taken up for study.
Reference was also made to vanous books nnd nrticles in journals where
simllar or related studies were reported. Discussions were also held with
' Norma, Dalkey and his assoriates a t the Rand Cnrporation (1960) - Group Techniques for Program Planning by Delbecq, Van de Ven and Gustafson.
academicians to elicit their guidance to evolve a aet of relevant and valid
questions or items oi'information to generate the data needed for an in-depth
study. On the basis oi'this it was decided that the Deiphi Study would try to
get the responses of the experts on 14 policy issues and 5 operational issues.
TO cover all the above issues, a draft questionnaire with 33 questions
was evolved. The questions related to policy issues, objectives, kev indicators,
operational issues etc. It was pre-tested among 10 respondents in Madras and
3 in Delhi. Results generally showed that the questions were relevant, valid
and easy to respond. However, in the light of the responses, three questions
were re-designed to be more sharp and specific. This revised questionnaire
was mailed to all the respondents. A specimen copy of the questionnaire may
be found in Annexure 111.
A public policy is generally evolved by the State in the light of political
goals, administrative expediency, past practices, level of economic
development, interests of pressure groups, etc. For taking a policy decision
the views of those who are to be benefitted, who are to be affected, who are
to implement and who are to be held accountable are necessary. Further
objective comments from academicians also will be very useful. In this
background it was decided that the views of the following 7 categories of
persons ("experts") will be required t o evolve a neu policy on Public
ilistrihution System in 'Tamilnadu State:

(1) Politicians
(2) Administrators
(3: Academicians
(4) Farmers
(5) Traders
(6) Lawyers and
( 7 ) Consumers
The Delphi questionnaire was administered to these categories of
experts.
(v) Other Studies
Among the commodities dealt with by the Public Distribution System,
rice is the most important. The off take of rice is more than one lakh tonnes
per month whereas the off take of wheat and sugar is of the order of 15,000
tonnes and 22,000 tonnes per month re~pectively.~ Further the State
Government bears a massive subsidy only for rice and not for other
commodities. Thirdly, the State Government is in charge of procurement of
rice and not of the other commodities. Lastly, for the average card holder cost
of rice represents about 70 per cent of the total cost of PDS purchase per
mont,h. Because of all these reaeons a further study regarding the offtake of
rice was also attempted.
' Pnlicy Note of the Government of Tamil Nudu, F;lal.cli. 1995

An,off-take study of rice for the past 10 years was undertaken. Based
on the historical data on off-take, a functional analysis was carried out to
study th~: uff-take pattern vis-a-vis different iactors affect~ng the same. A
multiple regression model was developed to identify the key factors and their
relative importance.
(vi) Hypothesis Testing
The following hypotheses were formulated for validation
(i) There will not be any significant difference in the perception of
the rural and urban consumers regarding the critical elements
of the Public Distribution System.
(ii) There will not be any significant difference in the perception of
the consumers belonging to different income groups ree~rd+:
the critical elements of the Public Distributi0.n System.
(iii) There will not be any significant difference in the perception of
the consumerr. 1x3 salesmen regarding the critical elements of
the Public Distribution System.
(iv) The present Public Distribution System is urban oriented and
pro-rich

(v) The present Public Distribution System is effective in the sense
that it meets the expectations of the consumers whb are its
beneficiaries.
(vi) Consumers prefer the Public Distribution System outlet being
run in the public or cooperative sector rather than in the private
sector.
These hypotheses were tested in the light of the above studies and
their correctness or otherwise was established.
3.5 ANALYSIS AND INTERPRETATION
Appropriate statistical tools were used to classify and analyse the
results of the surveys undertaken. The tools used in the study are inferential
statistics, ANOVA, stepwise discriminant analysis and Chi square statistics.
The findings from various surveys were interpreted and conclusions drawn.
On the basis of these, appropriate recommendations on policy and operational
issues are offered.
3.6 SAMPLE DESIGN
Consumer and Salesmen Surveys
Since there are 21,985 Public Distribution System outlets in this State
a survey of the consumers and salesmen has to be necessarily done on the
basis of a sample study. There is no single right answer to the question of

how large a sample should be. As the sample size increases the sampling
error decreased (Kaplan, 1987), hut this should not be taken to imply that
a I O U per cent sample is better than a sample estimate of the population
characteristic that is to be measured. Non sampling error which tends to
increase with very large sample size is frequently a much more serious source
of error in surveys. The sample surveyor's art lies in choosing that sample
size which reduces the total error to a minimum (Speak, 1974) Social Science
Research is often affected by non-sampling errors also. The following factors
were taken into account in determining the sample size for the consumer and
salesmen surveys.
(i) The entitlement of all the cardholders are uniform;
(ii) The shop system is run by mostly co-operative agencies;
(iiij Every village has got at least one shop;
(iv) Cost and time involved in the conduct of survey.
ARer consideration of the above, it was decided that a sample of about
350 to 400 shops out of the total of 21,985 will be a valid, dependable and
representative sample (the population being fairly homogeneous). In order to
provide for non-responses and incomplete responses it was decided to aim a t
a sample of 500 shops.
A circular systematic random sampling technique was adopted for
selection of samples to conduct the survey. The selection of consumers was

done on the basis of two stage random sampling design. At the first stage all
the shops in the State were arranged districtwise and given a number each;
from that !ist 500 shops were selected a1 random without replacement
through generation of random numbers. In the second stage in each shop
selected the consumer who stood last in the queue a t the time of survey was
interviewed so as to avoid the possibility of any bias. The main salesman in
each of the selected shops was interviewed for the salesman survey. This
survey was conducted in 1992
Inspite of the precautions taken and care exercised only 456 responses
were received from the survey team; the other responses were presumed to
be either lost in transit or not sent a t all. Again out of the responses received
it was found that 72 were incomplete or defective and hence had to be
rejected. Thus finally only 384 responses were found to be in complete shape
capable of being subjected to further analysis and interpretation. However,
448 number of responses from the salesmen were received in complete shape.
Still, in order to have a congruence it was decided to choose only the 384
shops for which the consumers' responses in complete shape had been
received. Thus f'urther analysis and interpretation of only 384 salesmen
responses were taken up. The sample represents 1.75 per cent of the number
of shops and covers all districts and shops run by different agencies both in
urban and rural areas. Profiles of the consumer respondents domicile war and
income war are shown in Figures 3.1 and 3.2 respectively. A State map
depicting the number of samples taken from each District may be found in
Plbmre 3.3.

Fig. 3.1 Consumer8 According to Domicile
LOW
MIDDLE 74
Fig. 3.2 Consumere According to Income
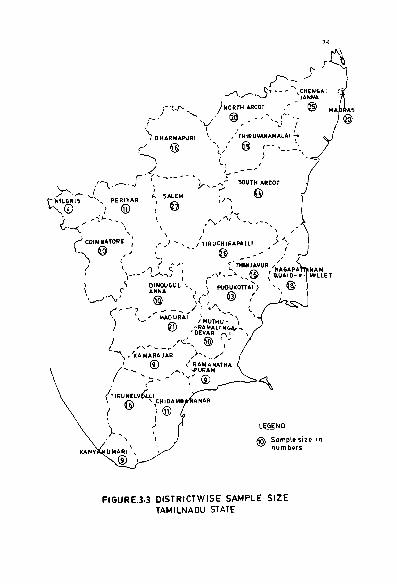
FIGURE.3.3 DISTRICTWISE SAMPLE SIZE TAMILNADU STATE

Delphi Survey
It was a difficult decision to decide on the number of experts from the
seven categories, to whom the questionnaire is to be mailed. After considering
various factors, it was decided to select the following number of experts in the
categories noted against each.
(i) Politicians
(ii) Administrators
(iii) Academicians
(iv) Farmers
(v) Traders
(vi) Lawyers
(vii) Consumers
Total
The categories of politicians and administrators were given higher
representation in view of their familiarity with the subject and their crucial
role in formulating and implementing a new policy.
All these experts were supplied with a questionnaire along with a
covering letter requesting their cooperation In the study and a detailed
background note giving all the relevant information about the Public
Distribution System in Tamilnadu which will enable them to properly
appreciate the context in which the questions are being asked. The first round

took a long time and many respondents were reminded in writing on 3
occasions, apart from phone calls wherever possible. After waiting for six
months it was decided to complete the first round when only 80 responses
had been received. These respondents were approached again with a feed
back of the responses and a covering letter explaining the need for the second
round and the options before them. After nearly another six months and after
many reminders and personal contacts, 61 experts gave their second round
response. It was found that on a large number of questions (22) congruence
has been achieved in the second round. A revised third round questionnaire
giving the second round feed back and asking for certain further details was
mailed to all the 61 experts. In this round value scales were introduced and
a close questioning of the respondents for reasons for certain replies was also
attempted. During the third round it was more difficult to get the responses.
After many reminders and personal contacts the researcher was able to get
responses only from 51 of them. Considering the cost and time involved and
in the light of the fact that congruence has been reached in most of the cases
and there was little chance of congruence in other cases where the views were
widely different from each other, it was decided to stop the exercise and
analyse the responses. This survey was conducted in 1993 and 1994.
3.7 DEFINITIONS
For the purposes of this study the following definitions are adopted.

Public Distribution System
This is the present system run by the Government of Tamilnadu under
which each family is issued a card which entitles it to receive certain
specified quotas of rice, wheat, sugar and kerosene every month through
authorised outlets spread all over the state.
Poverty Line
The cost of an All India Average consumption basket which can provide
2400 calories per capita per day for the rural areas and 2100 calories per
capita per day for the urban areas has been adopted as the official poverty
line by the Government of India. The expert group of the Planning
Commission estimated the proportion of Tamil Nadu population below the
poverty line as 40.7 per cent (rural 40.6 per cent and urban 40.9 per cent) for
the year 1987-88. Figures for the later years have not been made available.
It is generally believed that in the last 10 years the proportion would have
come down and currently i t may be of the order of 30 percent.
Food Subsidy
The food subsidy borne by the Government of India covers the direct
cost of operation plus the indirect cost of interest subsidy given by banks to
the Food Corporation of India and working capital concession given by the
Government of India to the Food Corporation of India. The food subsidy borne

by the Government of Tamil Nadu relates to the difference between the issue
price of rice and the cost price of rice.
Fair Price Shop
A fair price shop is a retail outlet under the Public Distribution System
which caters to the needs of a specified number of card holders attached to
it.
Domicile Classification
Shops located in areas coming under Town Panchayats, Townships,
Municipalities and Corporations are classified as urban shops. The rest are
classified as rural shops.
Income Classification
The following classification has been adopted with reference to the
incomes declared by the respondents;
(1) Income upto Rs.5001- per month - Low Income
(2) Income upto Rs.501 to Rs.lOOO1- per month - Middle Income
(3) Income above Rs.10001- per month - High Income
No check was made to find out whether the declared income is true.

3.8 ASSUMPTIONS
In this study the following 2 major assumptions have been made:
(1) That the Government of Tamil Nadu would continue its
commitment to run an effective Public Distribution System as an
anti-poverty and anti-inflationary measure.
(2) That the Government of India will continue its present policy of
procuring rice and wheat from the surplus States through the
Food Corporation of India and distributing the same to various
States to run the Public Distribution System.
3.9 LIMITATIONS
The following are the limitations of the study
(a) Though statistically significant samples have been studied, yet
the results may be much more dependable if larger number of
samples have been chosen.
(b) Special problems of hilly and tribal areas in the State have not
been studied. However, population in these areas constituted
only 2 per cent of the total population (1991)
(c) Special problems, if any, relating to wheat, sugar and kerosene
have not been studied. Rice constituted about 70 per cent of the

value of purchases made by an average cardholder. I t is a
commodity for which State Government bears a heavy subsidy.
Hence this study concentrated on rice.
(d) Revamping the structure and operating style of the agencies of
the Public Distribution System like Food Corporation of India,
Tamil Nadu Civil Supplies Corporation, Civil Supplies
Department, Co-operative Department etc. has not been
examined in this study.
However, further studies are possible on all the above points. Since the
Public Distribution System in Tamil Nadu is mainly a subsidised rice
distribution system and since the views and opinions of a large number of
experts from various walks of life apart from actual consumers have been
analysed and interpreted, the results of the present study are likely to be
valid even in the context of a larger study.