Embed Size (px)
Citation preview

Copyright © The McGraw-Hill Companies, Inc 2011
SEGMENT REPORTING,
DECENTRALIZATION, AND THE
BALANCED SCORECARD
Chapter 11
PowerPoint Authors:
Susan Coomer Galbreath, Ph.D., CPA
Charles W. Caldwell, D.B.A., CMA
Jon A. Booker, Ph.D., CPA, CIA
Copyright © The McGraw-Hill Companies, Inc 2011
11-2
Copyright © The McGraw-Hill Companies, Inc 2011
2
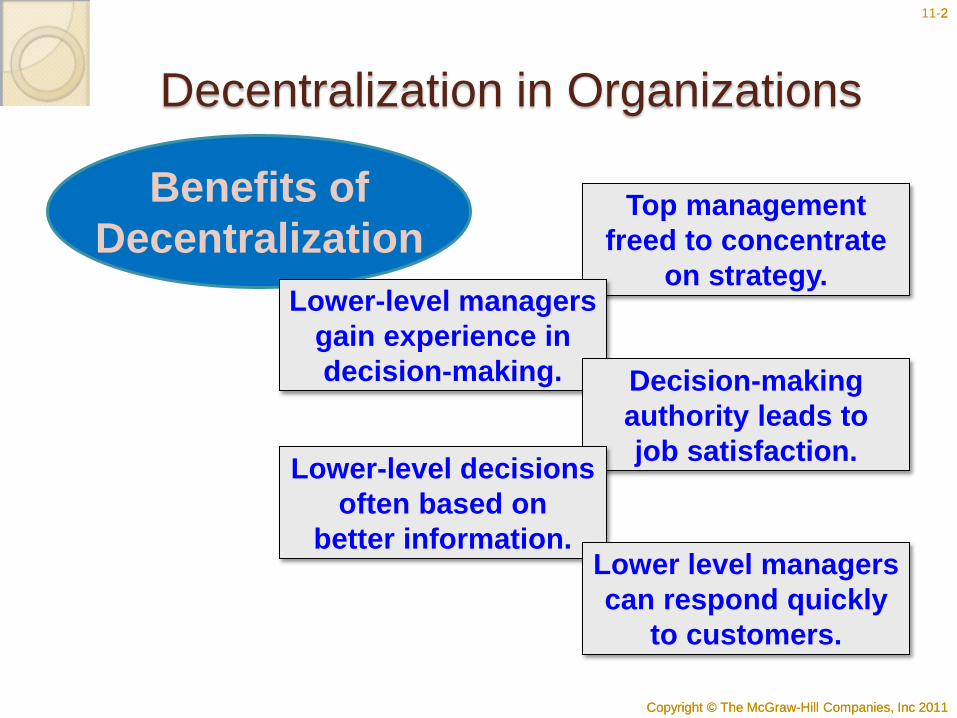
Decentralization in Organizations
Benefits of
Decentralization Top management
freed to concentrate
on strategy. Lower-level managers
gain experience in
decision-making. Decision-making
authority leads to
job satisfaction. Lower-level decisions
often based on
better information. Lower level managers
can respond quickly
to customers.

Copyright © The McGraw-Hill Companies, Inc 2011
11-3
Copyright © The McGraw-Hill Companies, Inc 2011
3
Decentralization in Organizations
Disadvantages of
Decentralization
Lower-level managers
may make decisions
without seeing the
“big picture.”
May be a lack of
coordination among
autonomous
managers.
Lower-level manager’s
objectives may not
be those of the
organization.
May be difficult to
spread innovative ideas
in the organization.

Copyright © The McGraw-Hill Companies, Inc 2011
11-4
Copyright © The McGraw-Hill Companies, Inc 2011
4
Cost, Profit, and Investments Centers
Responsibility
Center
Cost
Center
Profit
Center
Investment
Center
Cost, profit,
and investment
centers are all
known as
responsibility
centers.

Copyright © The McGraw-Hill Companies, Inc 2011
11-5
Cost Center
A segment whose manager has control over costs,
but not over revenues or investment funds.

Copyright © The McGraw-Hill Companies, Inc 2011
11-6
Profit Center
A segment whose
manager has control
over both costs and
revenues,
but no control over
investment funds.
Revenues
Sales
Interest
Other
Costs
Mfg. costs
Commissions
Salaries
Other

Copyright © The McGraw-Hill Companies, Inc 2011
11-7
Investment Center
A segment whose
manager has control
over costs,
revenues, and
investments in
operating assets.
Corporate Headquarters
Copyright © The McGraw-Hill Companies, Inc 2011
11-8
Copyright © The McGraw-Hill Companies, Inc 2011
8
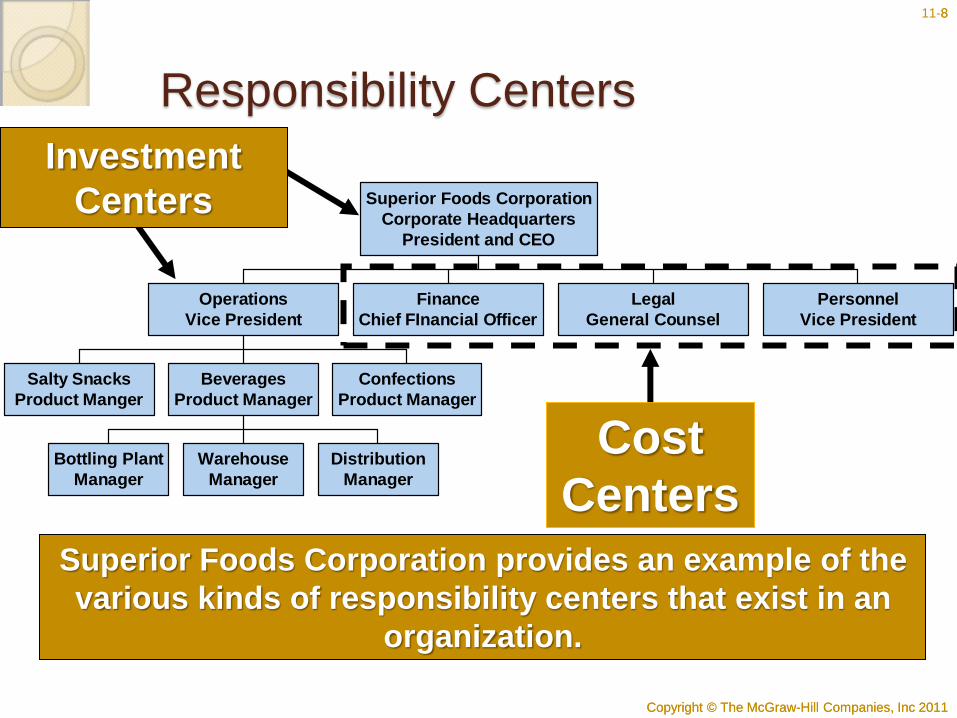
Responsibility Centers
Salty Snacks
Product Manger
Bottling Plant
Manager
Warehouse
Manager
Distribution
Manager
Beverages
Product Manager
Confections
Product Manager
Operations
Vice President
Finance
Chief FInancial Officer
Legal
General Counsel
Personnel
Vice President
Superior Foods Corporation
Corporate Headquarters
President and CEO
Cost
Centers
Investment
Centers
Superior Foods Corporation provides an example of the
various kinds of responsibility centers that exist in an
organization.

Copyright © The McGraw-Hill Companies, Inc 2011
11-9
Copyright © The McGraw-Hill Companies, Inc 2011
9
Responsibility Centers
Salty Snacks
Product Manger
Bottling Plant
Manager
Warehouse
Manager
Distribution
Manager
Beverages
Product Manager
Confections
Product Manager
Operations
Vice President
Finance
Chief FInancial Officer
Legal
General Counsel
Personnel
Vice President
Superior Foods Corporation
Corporate Headquarters
President and CEO
Superior Foods Corporation provides an example of the
various kinds of responsibility centers that exist in an
organization.
Profit
Centers

Copyright © The McGraw-Hill Companies, Inc 2011
11-10
Copyright © The McGraw-Hill Companies, Inc 2011
10
Responsibility Centers
Salty Snacks
Product Manger
Bottling Plant
Manager
Warehouse
Manager
Distribution
Manager
Beverages
Product Manager
Confections
Product Manager
Operations
Vice President
Finance
Chief FInancial Officer
Legal
General Counsel
Personnel
Vice President
Superior Foods Corporation
Corporate Headquarters
President and CEO
Cost
Centers
Superior Foods Corporation provides an example of the
various kinds of responsibility centers that exist in an
organization.

Copyright © The McGraw-Hill Companies, Inc 2011
11-11
Copyright © The McGraw-Hill Companies, Inc 2011
11
Learning Objective 1
Prepare a segmented income
statement using the contribution
format, and explain the difference
between traceable fixed costs and
common fixed costs.
Copyright © The McGraw-Hill Companies, Inc 2011
11-12
Decentralization and Segment
Reporting
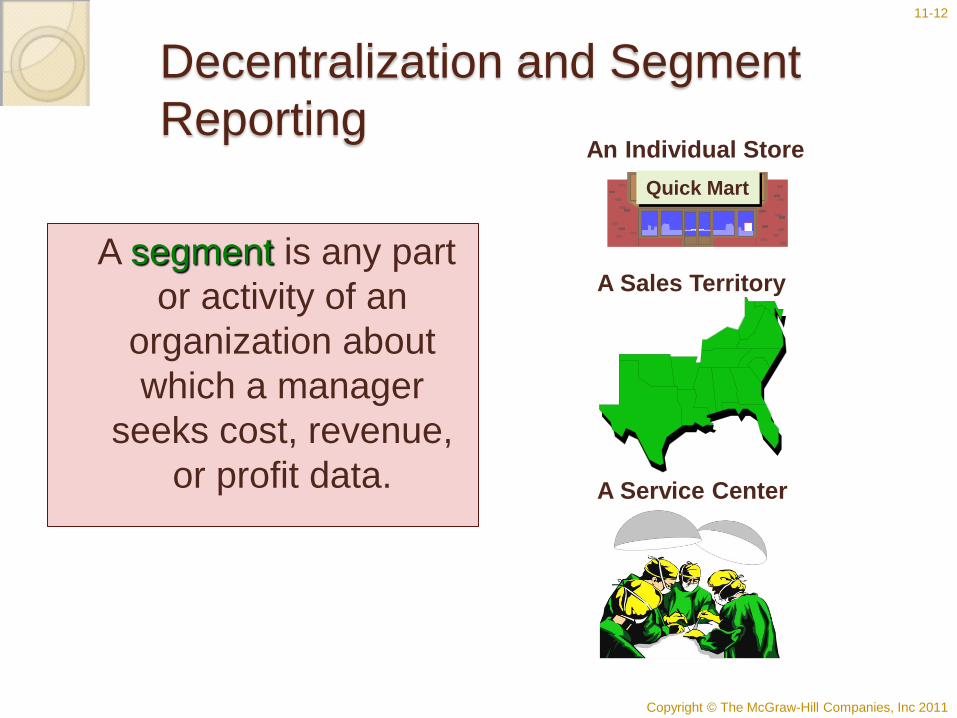
A segment is any part
or activity of an
organization about
which a manager
seeks cost, revenue,
or profit data.
Quick Mart
An Individual Store
A Sales Territory
A Service Center

Copyright © The McGraw-Hill Companies, Inc 2011
11-13
Copyright © The McGraw-Hill Companies, Inc 2011
13
Superior Foods: Geographic
Regions
East
$75,000,000
Oregon
$45,000,000
Washington
$50,000,000
California
$120,000,000
Mountain States
$85,000,000
West
$300,000,000
Midwest
$55,000,000
South
$70,000,000
Superior Foods Corporation
$500,000,000
Superior Foods Corporation could segment its business
by geographic region.

Copyright © The McGraw-Hill Companies, Inc 2011
11-14
Copyright © The McGraw-Hill Companies, Inc 2011
14
Superior Foods: Customer Channel
Convenience Stores
$80,000,000
Supermarket Chain A
$85,000,000
Supermarket Chain B
$65,000,000
Supermarket Chain C
$90,000,000
Supermarket Chain D
$40,000,000
Supermarket Chains
$280,000,000
Wholesale Distributors
$100,000,000
Drugstores
$40,000,000
Superior Foods Corporation
$500,000,000
Superior Foods Corporation could segment its business
by customer channel.

Copyright © The McGraw-Hill Companies, Inc 2011
11-15
Copyright © The McGraw-Hill Companies, Inc 2011
15
Keys to Segmented Income
Statements
There are two keys to building
segmented income statements:
A contribution format should be used
because it separates fixed from variable
costs and it enables the calculation of a
contribution margin.
Traceable fixed costs should be separated
from common fixed costs to enable the
calculation of a segment margin.

Copyright © The McGraw-Hill Companies, Inc 2011
11-16
Identifying Traceable Fixed Costs
Traceable costs arise because of the existence of a particular segment and would disappear over time if the segment itself disappeared.
No computer
division means . . .
No computer
division manager.
Copyright © The McGraw-Hill Companies, Inc 2011
11-17
Copyright © The McGraw-Hill Companies, Inc 2011
17
Identifying Common Fixed Costs
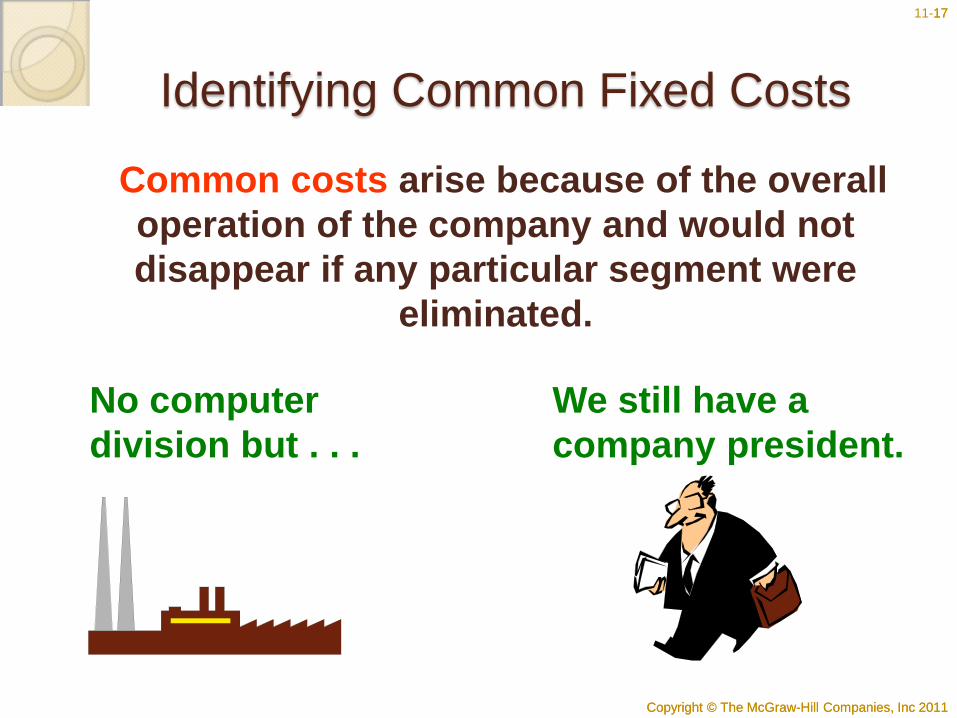
Common costs arise because of the overall
operation of the company and would not
disappear if any particular segment were
eliminated.
No computer
division but . . .
We still have a
company president.

Copyright © The McGraw-Hill Companies, Inc 2011
11-18
Copyright © The McGraw-Hill Companies, Inc 2011
18
Traceable Costs Can Become
Common Costs
It is important to realize that the traceable
fixed costs of one segment may be a
common fixed cost of another segment.
For example, the landing fee
paid to land an airplane at an
airport is traceable to the
particular flight, but it is not
traceable to first-class,
business-class, and
economy-class passengers.

Copyright © The McGraw-Hill Companies, Inc 2011
11-19
Segment Margin
The segment margin, which is computed by subtracting the traceable fixed costs of a
segment from its contribution margin, is the best gauge of the long-run profitability of a segment.
Time
Pro
fits

Copyright © The McGraw-Hill Companies, Inc 2011
11-20
Copyright © The McGraw-Hill Companies, Inc 2011
20
Traceable and Common Costs
Fixed
Costs
Traceable Common
Don’t allocate
common costs to
segments.
Copyright © The McGraw-Hill Companies, Inc 2011
11-21
Copyright © The McGraw-Hill Companies, Inc 2011
21
Activity-Based Costing
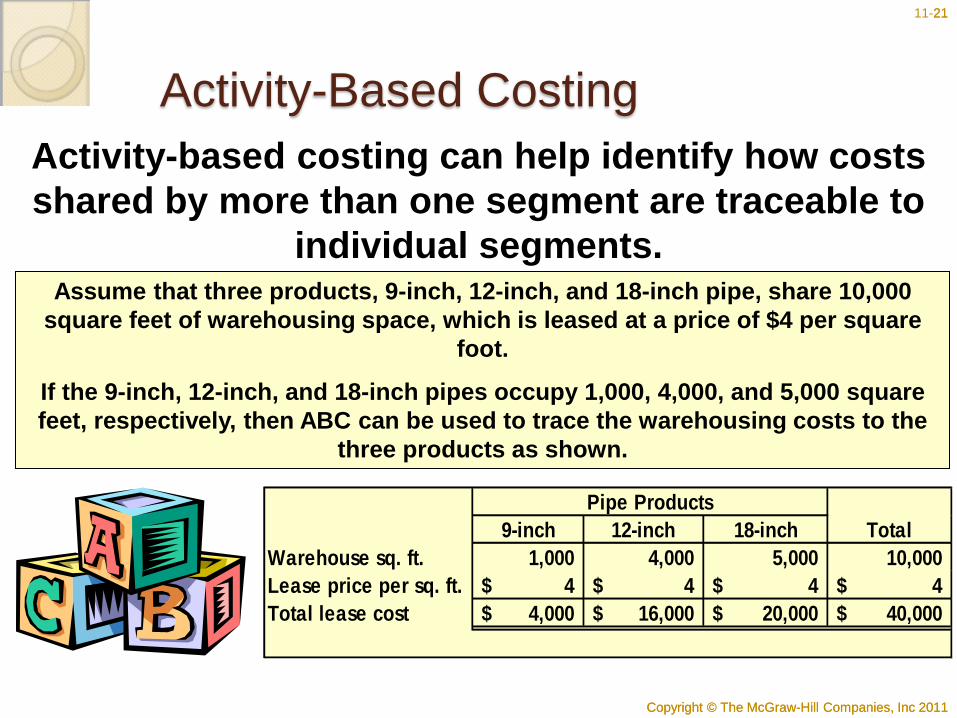
9-inch 12-inch 18-inch Total
Warehouse sq. ft. 1,000 4,000 5,000 10,000
Lease price per sq. ft. 4$ 4$ 4$ 4$
Total lease cost 4,000$ 16,000$ 20,000$ 40,000$
Pipe Products
Activity-based costing can help identify how costs
shared by more than one segment are traceable to
individual segments. Assume that three products, 9-inch, 12-inch, and 18-inch pipe, share 10,000
square feet of warehousing space, which is leased at a price of $4 per square
foot.
If the 9-inch, 12-inch, and 18-inch pipes occupy 1,000, 4,000, and 5,000 square
feet, respectively, then ABC can be used to trace the warehousing costs to the
three products as shown.
Copyright © The McGraw-Hill Companies, Inc 2011
11-22
Copyright © The McGraw-Hill Companies, Inc 2011
22
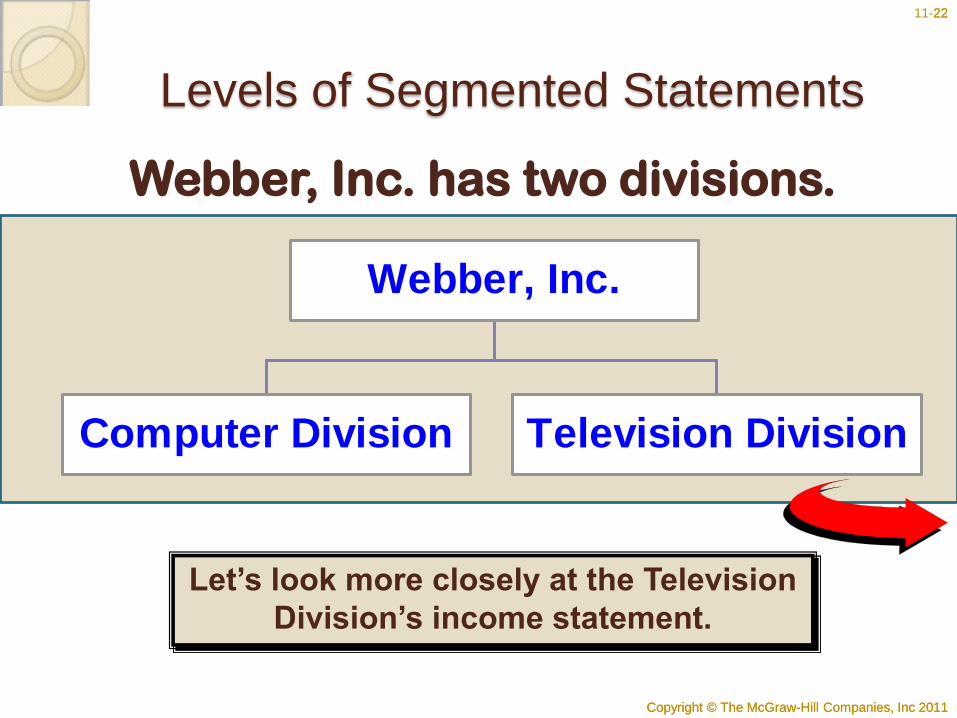
Levels of Segmented Statements
Let’s look more closely at the Television
Division’s income statement.
Webber, Inc. has two divisions.
Computer Division Television Division
Webber, Inc.

Copyright © The McGraw-Hill Companies, Inc 2011
11-23
Levels of Segmented Statements
Income Statement
Contribution Margin Format
Television Division
Sales 300,000$
Variable COGS 120,000
Other variable costs 30,000
Total variable costs 150,000
Contribution margin 150,000
Traceable fixed costs 90,000
Division margin 60,000$
Cost of goods
sold consists of
variable
manufacturing
costs.
Fixed and
variable costs
are listed in
separate
sections.
Our approach to segment reporting
uses the contribution format.

Copyright © The McGraw-Hill Companies, Inc 2011
11-24
Levels of Segmented Statements
Segment margin
is Television’s
contribution
to profits.
Contribution margin
is computed by
taking sales minus
variable costs.
Our approach to segment reporting
uses the contribution format.
Income Statement
Contribution Margin Format
Television Division
Sales 300,000$
Variable COGS 120,000
Other variable costs 30,000
Total variable costs 150,000
Contribution margin 150,000
Traceable fixed costs 90,000
Division margin 60,000$

Copyright © The McGraw-Hill Companies, Inc 2011
11-25
Copyright © The McGraw-Hill Companies, Inc 2011
25
Levels of Segmented Statements
Income Statement
Company Television Computer
Sales 500,000$ 300,000$ 200,000$
Variable costs 230,000 150,000 80,000
CM 270,000 150,000 120,000
Traceable FC 170,000 90,000 80,000
Division margin 100,000 60,000$ 40,000$
Common costs
Net operating
income
Copyright © The McGraw-Hill Companies, Inc 2011
11-26
Copyright © The McGraw-Hill Companies, Inc 2011
26
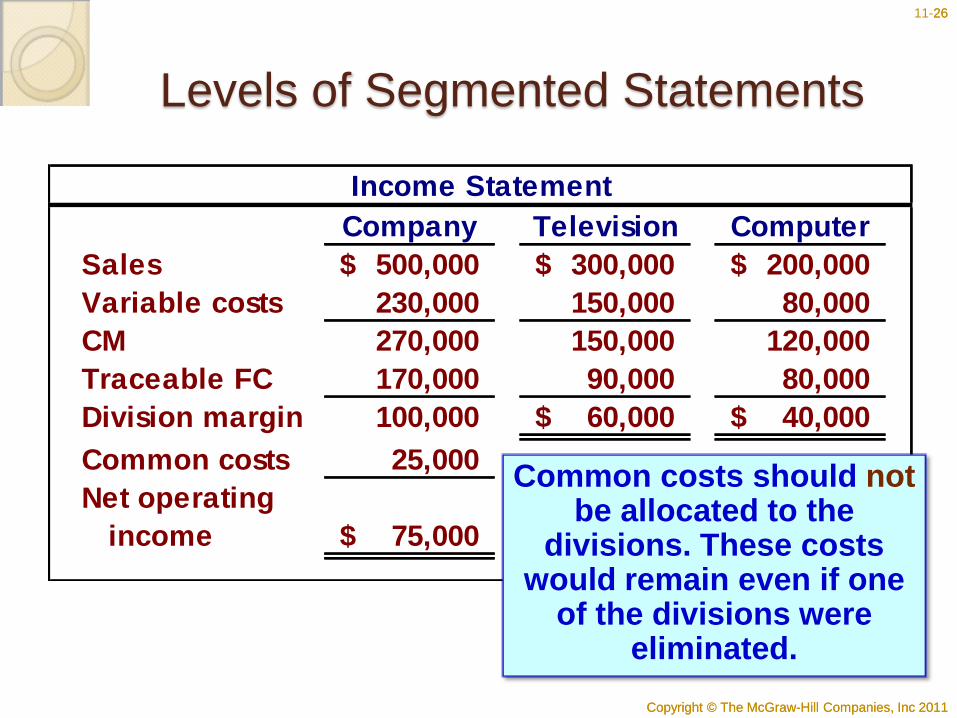
Levels of Segmented Statements
Income Statement
Company Television Computer
Sales 500,000$ 300,000$ 200,000$
Variable costs 230,000 150,000 80,000
CM 270,000 150,000 120,000
Traceable FC 170,000 90,000 80,000
Division margin 100,000 60,000$ 40,000$
Common costs 25,000
Net operating
income 75,000$
Common costs should not be allocated to the
divisions. These costs would remain even if one
of the divisions were eliminated.

Copyright © The McGraw-Hill Companies, Inc 2011
11-27
Traceable Costs Can Become
Common Costs
As previously mentioned, fixed costs that
are traceable to one segment can become
common if the company is divided into
smaller segments.
Let’s see how this works
using the Webber, Inc.
example!

Copyright © The McGraw-Hill Companies, Inc 2011
11-28
Traceable Costs Can Become
Common Costs
Product
Lines
Regular Big Screen
Television
Division
Webber’s Television Division

Copyright © The McGraw-Hill Companies, Inc 2011
11-29
Copyright © The McGraw-Hill Companies, Inc 2011
29
Traceable Costs Can Become
Common Costs
We obtained the following information from
the Regular and Big Screen segments.
Income Statement
Television
Division Regular Big Screen
Sales 200,000$ 100,000$
Variable costs 95,000 55,000
CM 105,000 45,000
Traceable FC 45,000 35,000
Product line margin 60,000$ 10,000$
Common costs
Divisional margin

Copyright © The McGraw-Hill Companies, Inc 2011
11-30
Copyright © The McGraw-Hill Companies, Inc 2011
30
Income Statement
Television
Division Regular Big Screen
Sales 300,000$ 200,000$ 100,000$
Variable costs 150,000 95,000 55,000
CM 150,000 105,000 45,000
Traceable FC 80,000 45,000 35,000
Product line margin 70,000 60,000$ 10,000$
Common costs 10,000
Divisional margin 60,000$
Traceable Costs Can Become
Common Costs
Fixed costs directly traced
to the Television Division $80,000 + $10,000 = $90,000

Copyright © The McGraw-Hill Companies, Inc 2011
11-31
Copyright © The McGraw-Hill Companies, Inc 2011
31
External Reports
The Financial Accounting Standards Board now requires
that companies in the United States include segmented
financial data in their annual reports.
1. Companies must report segmented
results to shareholders using the same
methods that are used for internal
segmented reports.
2. Since the contribution approach to
segment reporting does not comply
with GAAP, it is likely that some
managers will choose to construct
their segmented financial statements
using the absorption approach to
comply with GAAP.

Copyright © The McGraw-Hill Companies, Inc 2011
11-32
Omission of Costs
Costs assigned to a segment should include all
costs attributable to that segment from the
company’s entire value chain.
Product Customer
R&D Design Manufacturing Marketing Distribution Service
Business Functions
Making Up The
Value Chain

Copyright © The McGraw-Hill Companies, Inc 2011
11-33
Copyright © The McGraw-Hill Companies, Inc 2011
33
Inappropriate Methods of Allocating
Costs Among Segments
Segment
1
Segment
3
Segment
4
Inappropriate
allocation base
Segment
2
Failure to trace
costs directly

Copyright © The McGraw-Hill Companies, Inc 2011
11-34
Copyright © The McGraw-Hill Companies, Inc 2011
34
Common Costs and Segments
Segment
1
Segment
3
Segment
4
Segment
2
Common costs should not be arbitrarily allocated to segments
based on the rationale that “someone has to cover the
common costs” for two reasons:
1. This practice may make a profitable business segment appear
to be unprofitable.
2. Allocating common fixed costs forces managers to be held
accountable for costs they cannot control.

Copyright © The McGraw-Hill Companies, Inc 2011
11-35
Copyright © The McGraw-Hill Companies, Inc 2011
35
Income Statement
Hoagland's
Lakeshore Bar Restaurant
Sales 800,000$ 100,000$ 700,000$
Variable costs 310,000 60,000 250,000
CM 490,000 40,000 450,000
Traceable FC 246,000 26,000 220,000
Segment margin 244,000 14,000$ 230,000$
Common costs 200,000
Profit 44,000$
Quick Check
Assume that Hoagland's Lakeshore prepared its
segmented income statement as shown.

Copyright © The McGraw-Hill Companies, Inc 2011
11-36
Quick Check
How much of the common fixed cost of
$200,000 can be avoided by eliminating the
bar?
a. None of it.
b. Some of it.
c. All of it.

Copyright © The McGraw-Hill Companies, Inc 2011
11-37
How much of the common fixed cost of
$200,000 can be avoided by eliminating the
bar?
a. None of it.
b. Some of it.
c. All of it.
Quick Check
A common fixed cost
cannot be eliminated by
dropping one of the
segments.

Copyright © The McGraw-Hill Companies, Inc 2011
11-38
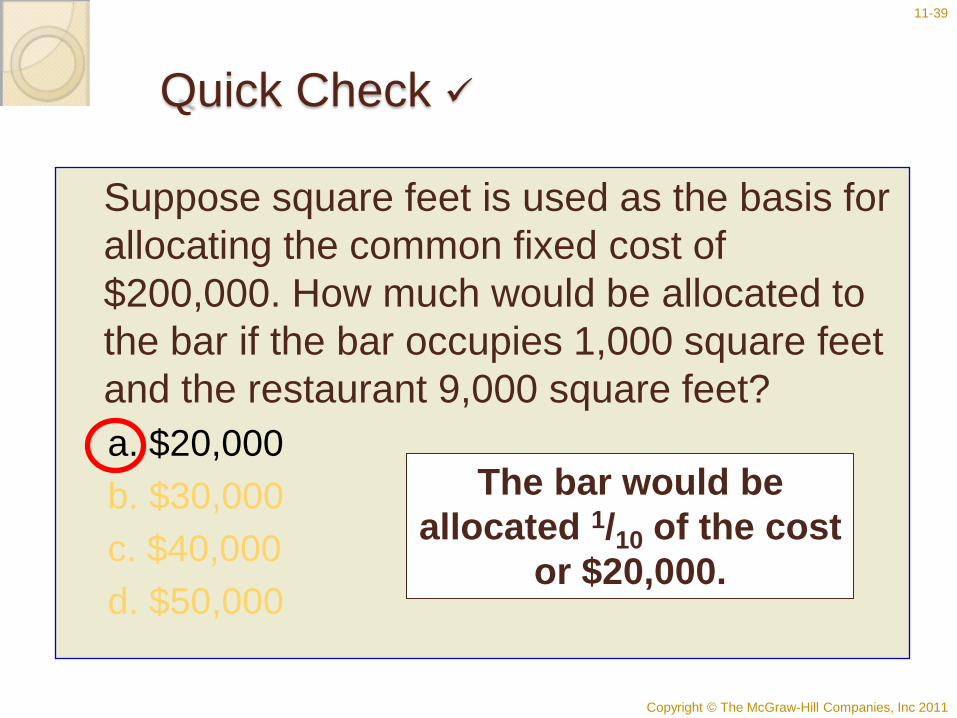
Quick Check
Suppose square feet is used as the basis for
allocating the common fixed cost of
$200,000. How much would be allocated to
the bar if the bar occupies 1,000 square feet
and the restaurant 9,000 square feet?
a. $20,000
b. $30,000
c. $40,000
d. $50,000
Copyright © The McGraw-Hill Companies, Inc 2011
11-39
Suppose square feet is used as the basis for
allocating the common fixed cost of
$200,000. How much would be allocated to
the bar if the bar occupies 1,000 square feet
and the restaurant 9,000 square feet?
a. $20,000
b. $30,000
c. $40,000
d. $50,000
Quick Check
The bar would be
allocated 1/10 of the cost
or $20,000.

Copyright © The McGraw-Hill Companies, Inc 2011
11-40
Copyright © The McGraw-Hill Companies, Inc 2011
40
Quick Check
If Hoagland's allocates its common
costs to the bar and the restaurant,
what would be the reported profit of
each segment?
Copyright © The McGraw-Hill Companies, Inc 2011
11-41
Copyright © The McGraw-Hill Companies, Inc 2011
41
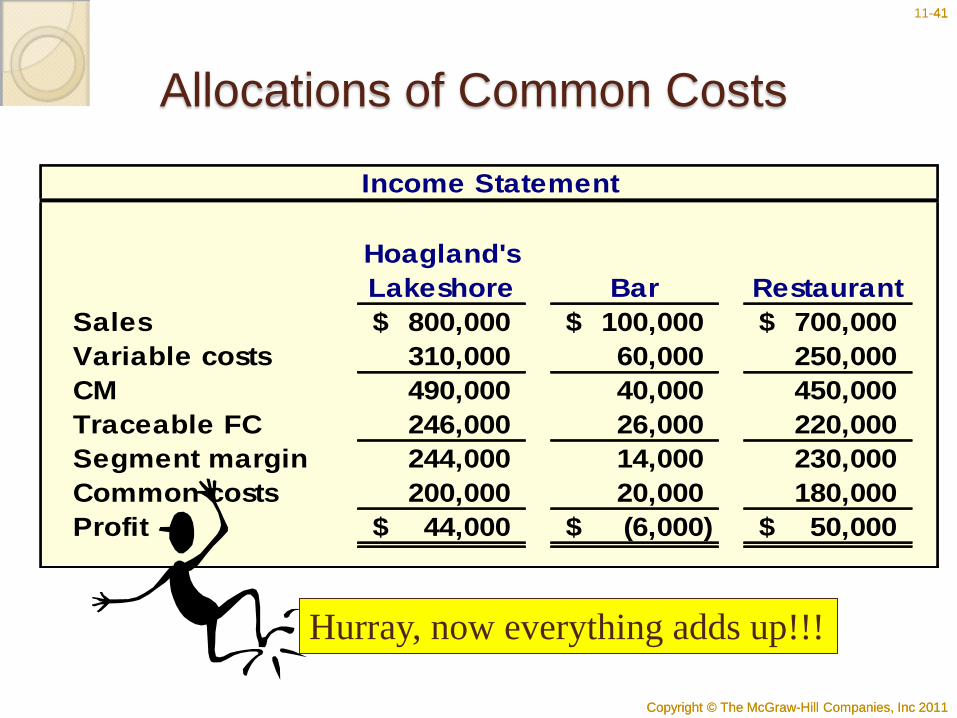
Income Statement
Hoagland's
Lakeshore Bar Restaurant
Sales 800,000$ 100,000$ 700,000$
Variable costs 310,000 60,000 250,000
CM 490,000 40,000 450,000
Traceable FC 246,000 26,000 220,000
Segment margin 244,000 14,000 230,000
Common costs 200,000 20,000 180,000
Profit 44,000$ (6,000)$ 50,000$
Allocations of Common Costs
Hurray, now everything adds up!!!

Copyright © The McGraw-Hill Companies, Inc 2011
11-42
Quick Check
Should the bar be eliminated?
a. Yes
b. No

Copyright © The McGraw-Hill Companies, Inc 2011
11-43
Should the bar be eliminated?
a. Yes
b. No
Quick Check
Income Statement
Hoagland's
Lakeshore Bar Restaurant
Sales 700,000$ 700,000$
Variable costs 250,000 250,000
CM 450,000 450,000
Traceable FC 220,000 220,000
Segment margin 230,000 230,000
Common costs 200,000 200,000
Profit 30,000$ 30,000$
The profit was $44,000 before
eliminating the bar. If we eliminate
the bar, profit drops to $30,000!

Copyright © The McGraw-Hill Companies, Inc 2011
11-44
Copyright © The McGraw-Hill Companies, Inc 2011
44
Learning Objective 2
Compute return on investment (ROI)
and show how changes in sales,
expenses, and assets affect ROI.

Copyright © The McGraw-Hill Companies, Inc 2011
11-45
Copyright © The McGraw-Hill Companies, Inc 2011
45
Return on Investment (ROI)
Formula
ROI = Net operating income
Average operating assets
Cash, accounts receivable, inventory,
plant and equipment, and other
productive assets.
Income before interest
and taxes (EBIT)

Copyright © The McGraw-Hill Companies, Inc 2011
11-46
Copyright © The McGraw-Hill Companies, Inc 2011
46
Net Book Value vs. Gross Cost
Most companies use the net book value of
depreciable assets to calculate average
operating assets.
Acquisition cost
Less: Accumulated depreciation
Net book value

Copyright © The McGraw-Hill Companies, Inc 2011
11-47
Copyright © The McGraw-Hill Companies, Inc 2011
47
Understanding ROI
ROI = Net operating income
Average operating assets
Margin = Net operating income
Sales
Turnover = Sales
Average operating assets
ROI = Margin Turnover
Copyright © The McGraw-Hill Companies, Inc 2011
11-48
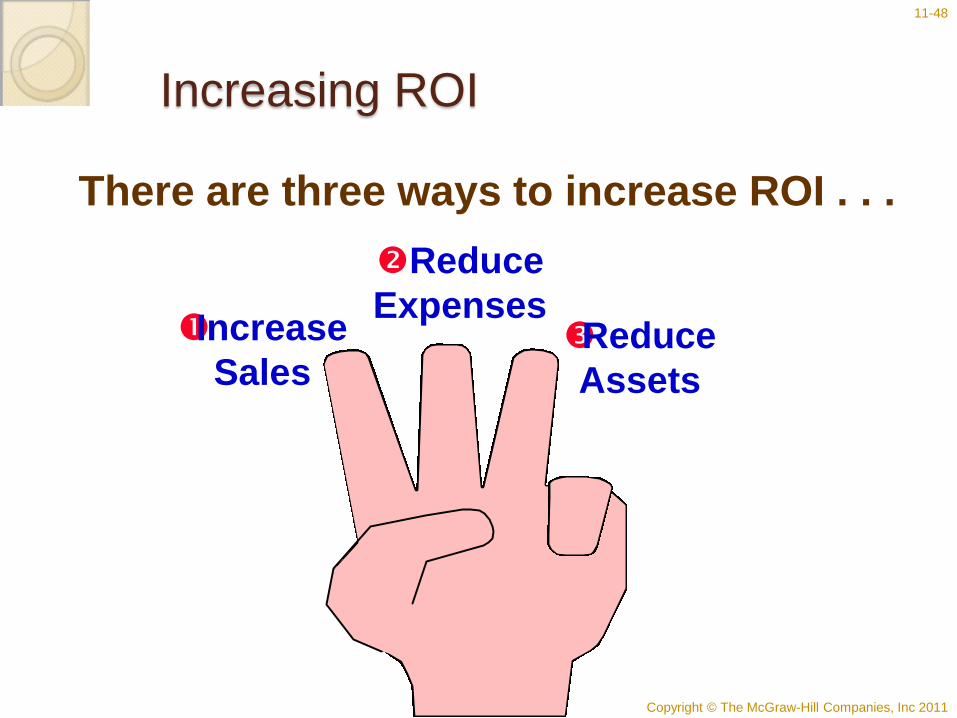
Increasing ROI
There are three ways to increase ROI . . .
Increase
Sales
Reduce
Expenses Reduce
Assets

Copyright © The McGraw-Hill Companies, Inc 2011
11-49
Increasing ROI – An Example
Regal Company reports the following:
Net operating income $ 30,000
Average operating assets $ 200,000
Sales $ 500,000
Operating expenses $ 470,000
ROI = Margin Turnover
Net operating income
Sales
Sales
Average operating assets × ROI =
What is Regal Company’s ROI?

Copyright © The McGraw-Hill Companies, Inc 2011
11-50
Copyright © The McGraw-Hill Companies, Inc 2011
50
Increasing ROI – An Example
$30,000
$500,000 ×
$500,000
$200,000 ROI =
6% 2.5 = 15% ROI =
ROI = Margin Turnover
Net operating income
Sales
Sales
Average operating assets × ROI =

Copyright © The McGraw-Hill Companies, Inc 2011
11-51
Copyright © The McGraw-Hill Companies, Inc 2011
51
Investing in Operating Assets to
Increase Sales
Assume that Regal's manager invests in a $30,000 piece of equipment that increases sales by
$35,000, while increasing operating expenses by $15,000.
Let’s calculate the new ROI.
Regal Company reports the following:
Net operating income $ 50,000
Average operating assets $ 230,000
Sales $ 535,000
Operating expenses $ 485,000

Copyright © The McGraw-Hill Companies, Inc 2011
11-52
Copyright © The McGraw-Hill Companies, Inc 2011
52
Investing in Operating Assets to
Increase Sales
$50,000
$535,000 ×
$535,000
$230,000 ROI =
9.35% 2.33 = 21.8% ROI =
ROI increased from 15% to 21.8%.
ROI = Margin Turnover
Net operating income
Sales
Sales
Average operating assets × ROI =

Copyright © The McGraw-Hill Companies, Inc 2011
11-53
Copyright © The McGraw-Hill Companies, Inc 2011
53
Criticisms of ROI
In the absence of the balanced
scorecard, management may
not know how to increase ROI.
Managers often inherit many
committed costs over which
they have no control.
Managers evaluated on ROI
may reject profitable
investment opportunities.
Copyright © The McGraw-Hill Companies, Inc 2011
11-54
Copyright © The McGraw-Hill Companies, Inc 2011
54
Learning Objective 3
Compute residual income and
understand its strengths and
weaknesses.
Copyright © The McGraw-Hill Companies, Inc 2011
11-55
Copyright © The McGraw-Hill Companies, Inc 2011
55
Residual Income - Another Measure
of Performance
Net operating income
above some minimum
return on operating
assets

Copyright © The McGraw-Hill Companies, Inc 2011
11-56
Copyright © The McGraw-Hill Companies, Inc 2011
56
Calculating Residual Income
Residual
income=
Net
operating
income
-
Average
operating
assets
Minimum
required rate of
return( )
This computation differs from ROI.
ROI measures net operating income earned relative
to the investment in average operating assets.
Residual income measures net operating income
earned less the minimum required return on average
operating assets.

Copyright © The McGraw-Hill Companies, Inc 2011
11-57
Residual Income – An Example
• The Retail Division of Zephyr, Inc. has average operating assets of $100,000 and is required to earn a return of 20% on these assets.
• In the current period, the division earns $30,000.
Let’s calculate residual income.

Copyright © The McGraw-Hill Companies, Inc 2011
11-58
Copyright © The McGraw-Hill Companies, Inc 2011
58
Residual Income – An Example
Operating assets 100,000$
Required rate of return × 20%
Minimum required return 20,000$
Actual income 30,000$
Minimum required return (20,000)
Residual income 10,000$

Copyright © The McGraw-Hill Companies, Inc 2011
11-59
Copyright © The McGraw-Hill Companies, Inc 2011
59
Motivation and Residual Income
Residual income encourages managers to
make profitable investments that would
be rejected by managers using ROI.

Copyright © The McGraw-Hill Companies, Inc 2011
11-60
Quick Check
Redmond Awnings, a division of Wrap-up
Corp., has a net operating income of
$60,000 and average operating assets of
$300,000. The required rate of return for the
company is 15%. What is the division’s ROI?
a. 25%
b. 5%
c. 15%
d. 20%

Copyright © The McGraw-Hill Companies, Inc 2011
11-61
Quick Check
Redmond Awnings, a division of Wrap-up
Corp., has a net operating income of
$60,000 and average operating assets of
$300,000. The required rate of return for the
company is 15%. What is the division’s ROI?
a. 25%
b. 5%
c. 15%
d. 20%
ROI = NOI/Average operating assets
= $60,000/$300,000 = 20%

Copyright © The McGraw-Hill Companies, Inc 2011
11-62
Quick Check
Redmond Awnings, a division of Wrap-up
Corp., has a net operating income of $60,000
and average operating assets of $300,000. If
the manager of the division is evaluated based
on ROI, will she want to make an investment
of $100,000 that would generate additional net
operating income of $18,000 per year?
a. Yes
b. No
Copyright © The McGraw-Hill Companies, Inc 2011
11-63
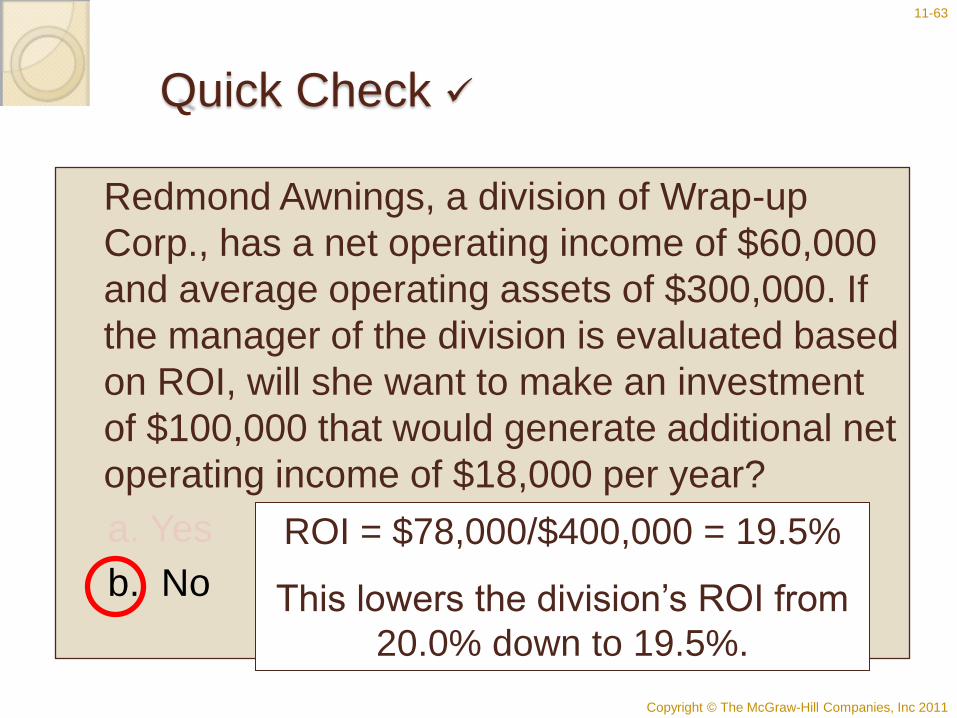
Quick Check
Redmond Awnings, a division of Wrap-up
Corp., has a net operating income of $60,000
and average operating assets of $300,000. If
the manager of the division is evaluated based
on ROI, will she want to make an investment
of $100,000 that would generate additional net
operating income of $18,000 per year?
a. Yes
b. No
ROI = $78,000/$400,000 = 19.5%
This lowers the division’s ROI from
20.0% down to 19.5%.

Copyright © The McGraw-Hill Companies, Inc 2011
11-64
Quick Check
The company’s required rate of return is
15%. Would the company want the
manager of the Redmond Awnings
division to make an investment of
$100,000 that would generate additional
net operating income of $18,000 per
year?
a. Yes
b. No

Copyright © The McGraw-Hill Companies, Inc 2011
11-65
Quick Check
The company’s required rate of return is
15%. Would the company want the
manager of the Redmond Awnings
division to make an investment of
$100,000 that would generate additional
net operating income of $18,000 per
year?
a. Yes
b. No
ROI = $18,000/$100,000 = 18%
The return on the investment
exceeds the minimum required rate
of return.

Copyright © The McGraw-Hill Companies, Inc 2011
11-66
Quick Check
Redmond Awnings, a division of Wrap-up Corp., has a net operating income of $60,000 and average operating assets of $300,000. The required rate of return for the company is 15%. What is the division’s residual income?
a. $240,000
b. $ 45,000
c. $ 15,000
d. $ 51,000

Copyright © The McGraw-Hill Companies, Inc 2011
11-67
Quick Check
Redmond Awnings, a division of Wrap-up Corp., has a net operating income of $60,000 and average operating assets of $300,000. The required rate of return for the company is 15%. What is the division’s residual income?
a. $240,000
b. $ 45,000
c. $ 15,000
d. $ 51,000
Net operating income $60,000
Required return (15% of $300,000) (45,000)
Residual income $15,000

Copyright © The McGraw-Hill Companies, Inc 2011
11-68
Quick Check
If the manager of the Redmond Awnings
division is evaluated based on residual
income, will she want to make an
investment of $100,000 that would
generate additional net operating income
of $18,000 per year?
a. Yes
b. No

Copyright © The McGraw-Hill Companies, Inc 2011
11-69
Quick Check
If the manager of the Redmond Awnings
division is evaluated based on residual
income, will she want to make an
investment of $100,000 that would
generate additional net operating income
of $18,000 per year?
a. Yes
b. No
Net operating income $78,000
Required return (15% of $400,000) (60,000)
Residual income $18,000
Yields an increase of $3,000 in the residual income.

Copyright © The McGraw-Hill Companies, Inc 2011
11-70
Divisional Comparisons and Residual
Income
The residual
income approach
has one major
disadvantage.
It cannot be used
to compare the
performance of
divisions of
different sizes.

Copyright © The McGraw-Hill Companies, Inc 2011
11-71
Copyright © The McGraw-Hill Companies, Inc 2011
71
Zephyr, Inc. - Continued
Retail Wholesale
Operating assets 100,000$ 1,000,000$
Required rate of return × 20% 20%
Minimum required return 20,000$ 200,000$
Retail Wholesale
Actual income 30,000$ 220,000$
Minimum required return (20,000) (200,000)
Residual income 10,000$ 20,000$
Recall the following
information for the Retail
Division of Zephyr, Inc.
Assume the following
information for the Wholesale
Division of Zephyr, Inc.

Copyright © The McGraw-Hill Companies, Inc 2011
11-72
Copyright © The McGraw-Hill Companies, Inc 2011
72
Zephyr, Inc. - Continued
Retail Wholesale
Operating assets 100,000$ 1,000,000$
Required rate of return × 20% 20%
Minimum required return 20,000$ 200,000$
Retail Wholesale
Actual income 30,000$ 220,000$
Minimum required return (20,000) (200,000)
Residual income 10,000$ 20,000$
The residual income numbers suggest that the Wholesale
Division outperformed the Retail Division because its residual
income is $10,000 higher. However, the Retail Division earned
an ROI of 30% compared to an ROI of 22% for the Wholesale
Division. The Wholesale Division’s residual income is larger
than the Retail Division simply because it is a bigger division.

Copyright © The McGraw-Hill Companies, Inc 2011
11-73
Copyright © The McGraw-Hill Companies, Inc 2011
73
Learning Objective 4
Understand how to construct
and use a balanced scorecard.

Copyright © The McGraw-Hill Companies, Inc 2011
11-74
Copyright © The McGraw-Hill Companies, Inc 2011
74
Internal
business
processes
Customers
Learning
and growth
The Balanced Scorecard
Management translates its strategy into
performance measures that employees
understand and influence.
Performance
measures
Financial

Copyright © The McGraw-Hill Companies, Inc 2011
11-75
Copyright © The McGraw-Hill Companies, Inc 2011
75
The Balanced Scorecard: From Strategy to Performance Measures
Financial Has our financial
performance improved?
Customer Do customers recognize that
we are delivering more value?
Internal Business Processes Have we improved key business processes so that we can deliver
more value to customers?
Learning and Growth Are we maintaining our ability
to change and improve?
Performance Measures
What are our financial goals?
What customers do we want to serve and how are we going to win and retain them?
What internal busi- ness processes are critical to providing
value to customers?
Vision
and
Strategy

Copyright © The McGraw-Hill Companies, Inc 2011
11-76
Copyright © The McGraw-Hill Companies, Inc 2011
76
The Balanced Scorecard: Non-financial Measures
The balanced scorecard relies on non-financial measures
in addition to financial measures for two reasons:
Financial measures are lag indicators that summarize
the results of past actions. Non-financial measures are
leading indicators of future financial performance.
Top managers are ordinarily responsible for financial
performance measures – not lower level managers.
Non-financial measures are more likely to be
understood and controlled by lower level managers.

Copyright © The McGraw-Hill Companies, Inc 2011
11-77
Copyright © The McGraw-Hill Companies, Inc 2011
77
The Balanced Scorecard for
Individuals
A personal scorecard should contain measures that can be influenced by the individual being evaluated and that
support the measures in the overall balanced scorecard.
The entire organization
should have an overall
balanced scorecard.
Each individual should
have a personal
balanced scorecard.

Copyright © The McGraw-Hill Companies, Inc 2011
11-78
Copyright © The McGraw-Hill Companies, Inc 2011
78
The balanced scorecard lays out concrete
actions to attain desired outcomes.
A balanced scorecard should have measures
that are linked together on a cause-and-effect basis.
If we improve
one performance
measure . . .
Another desired
performance measure
will improve.
The Balanced Scorecard
Then

Copyright © The McGraw-Hill Companies, Inc 2011
11-79
The Balanced Scorecard and Compensation
Incentive compensation should be linked to
balanced scorecard performance
measures.

Copyright © The McGraw-Hill Companies, Inc 2011
11-80
Copyright © The McGraw-Hill Companies, Inc 2011
80
Employee skills in installing options
Number of options available
Time to install option
Customer satisfaction with options
Number of cars sold
Contribution per car
Profit
Learning and Growth
Internal Business
Processes
Customer
Financial
The Balanced Scorecard ─ Jaguar Example

Copyright © The McGraw-Hill Companies, Inc 2011
11-81
Copyright © The McGraw-Hill Companies, Inc 2011
81
Employee skills in installing options
Number of options available
Time to install option
Customer satisfaction with options
Number of cars sold
Contribution per car
Profit
Increase Options Time
Decreases
Strategies
Satisfaction Increases
Increase Skills
Results
The Balanced Scorecard ─ Jaguar Example

Copyright © The McGraw-Hill Companies, Inc 2011
11-82
Copyright © The McGraw-Hill Companies, Inc 2011
82
Employee skills in installing options
Number of options available
Time to install option
Customer satisfaction with options
Number of cars sold
Contribution per car
Profit
Satisfaction Increases
Results Cars sold Increase
The Balanced Scorecard ─ Jaguar Example

Copyright © The McGraw-Hill Companies, Inc 2011
11-83
Copyright © The McGraw-Hill Companies, Inc 2011
83
Employee skills in installing options
Number of options available
Time to install option
Customer satisfaction with options
Number of cars sold
Contribution per car
Profit
Results
Time Decreases
Contribution Increases
Satisfaction Increases
The Balanced Scorecard ─ Jaguar Example

Copyright © The McGraw-Hill Companies, Inc 2011
11-84
Copyright © The McGraw-Hill Companies, Inc 2011
84
The Balanced Scorecard ─ Jaguar Example
Employee skills in installing options
Number of options available
Time to install option
Customer satisfaction with options
Number of cars sold
Contribution per car
Profit Results
Contribution Increases
Profits Increase
If number
of cars sold
and contribution
per car increase,
profits
increase.
Cars Sold Increases

Copyright © The McGraw-Hill Companies, Inc 2011
TRANSFER PRICING
Appendix 11A
Copyright © The McGraw-Hill Companies, Inc 2011
11-86
Copyright © The McGraw-Hill Companies, Inc 2011
86
Key Concepts/Definitions
A transfer price is the price
charged when one segment of
a company provides goods or
services to another segment of
the company.
The fundamental objective in
setting transfer prices is to
motivate managers to act in the
best interests of the overall
company.
Copyright © The McGraw-Hill Companies, Inc 2011
11-87
Copyright © The McGraw-Hill Companies, Inc 2011
87
Three Primary Approaches
There are three primary
approaches to setting
transfer prices:
1. Negotiated transfer prices;
2. Transfers at the cost to the
selling division; and
3. Transfers at market price.

Copyright © The McGraw-Hill Companies, Inc 2011
11-88
Copyright © The McGraw-Hill Companies, Inc 2011
88
Learning Objective 5
Determine the range, if any, within
which a negotiated transfer price
should fall.

Copyright © The McGraw-Hill Companies, Inc 2011
11-89
Copyright © The McGraw-Hill Companies, Inc 2011
89
Negotiated Transfer Prices
A negotiated transfer price results from discussions
between the selling and buying divisions.
Advantages of negotiated transfer prices:
1. They preserve the autonomy of the
divisions, which is consistent with
the spirit of decentralization.
2. The managers negotiating the
transfer price are likely to have much
better information about the potential
costs and benefits of the transfer
than others in the company.
Upper limit is
determined by the
buying division.
Lower limit is
determined by the
selling division.
Range of Acceptable
Transfer Prices

Copyright © The McGraw-Hill Companies, Inc 2011
11-90
Copyright © The McGraw-Hill Companies, Inc 2011
90
Grocery Storehouse – An Example
West Coast Plantations:
Naval orange harvest capactiy per month 10,000 crates
Variable cost per crate of naval oranges 10$ per crate
Fixed costs per month 100,000$
Selling price of navel oranges on the outside
market 25$ per crate
Grocery Mart:
Purchase price of current naval oranges 20$ per crate
Monthly sales of naval oranges 1,000 crates
Assume the information as shown with
respect to West Coast Plantations and Grocery
Mart (both companies are owned by Grocery
Storehouse).
Copyright © The McGraw-Hill Companies, Inc 2011
11-91
Copyright © The McGraw-Hill Companies, Inc 2011
91
Grocery Storehouse – An Example
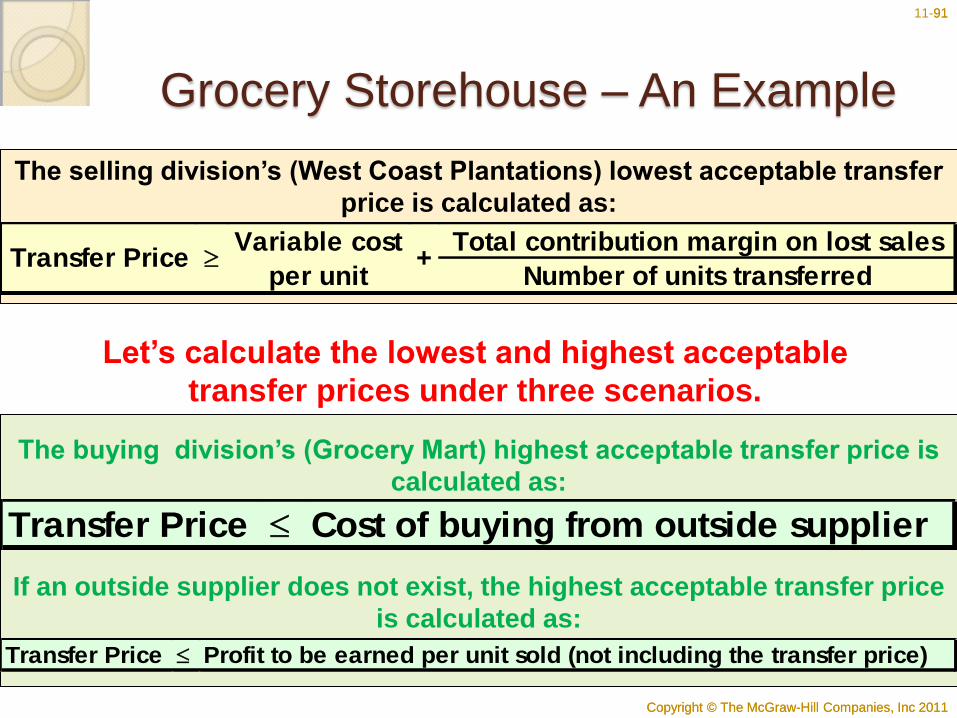
The selling division’s (West Coast Plantations) lowest acceptable transfer
price is calculated as:
Variable cost Total contribution margin on lost sales
per unit Number of units transferredTransfer Price +
Transfer Price Cost of buying from outside supplier
The buying division’s (Grocery Mart) highest acceptable transfer price is
calculated as:
Let’s calculate the lowest and highest acceptable
transfer prices under three scenarios.
Transfer Price Profit to be earned per unit sold (not including the transfer price)
If an outside supplier does not exist, the highest acceptable transfer price
is calculated as:
Copyright © The McGraw-Hill Companies, Inc 2011
11-92
Copyright © The McGraw-Hill Companies, Inc 2011
92
Grocery Storehouse – An Example
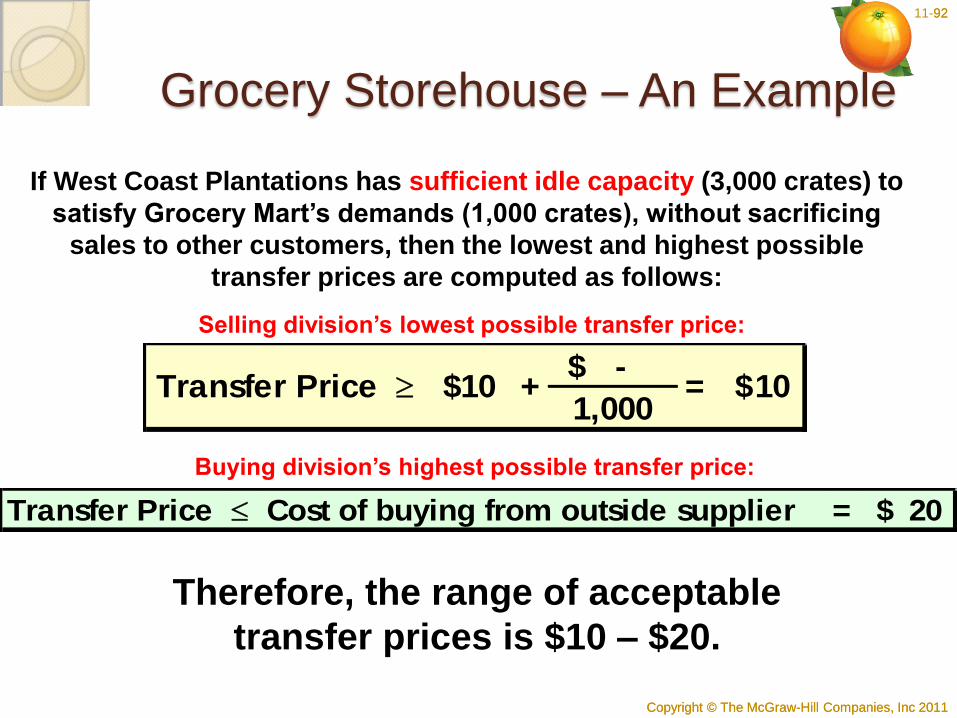
If West Coast Plantations has sufficient idle capacity (3,000 crates) to
satisfy Grocery Mart’s demands (1,000 crates), without sacrificing
sales to other customers, then the lowest and highest possible
transfer prices are computed as follows:
-$
1,000= 10$ Transfer Price +10$
Selling division’s lowest possible transfer price:
Transfer Price Cost of buying from outside supplier = 20$
Buying division’s highest possible transfer price:
Therefore, the range of acceptable
transfer prices is $10 – $20.

Copyright © The McGraw-Hill Companies, Inc 2011
11-93
Copyright © The McGraw-Hill Companies, Inc 2011
93
Grocery Storehouse – An Example
If West Coast Plantations has no idle capacity (0 crates) and must
sacrifice other customer orders (1,000 crates) to meet Grocery Mart’s
demands (1,000 crates), then the lowest and highest possible transfer
prices are computed as follows:
( $25 - $10) × 1,000
1,000= 25$ Transfer Price +10$
Selling division’s lowest possible transfer price:
Transfer Price Cost of buying from outside supplier = 20$
Buying division’s highest possible transfer price:
Therefore, there is no range of
acceptable transfer prices.

Copyright © The McGraw-Hill Companies, Inc 2011
11-94
Copyright © The McGraw-Hill Companies, Inc 2011
94
Grocery Storehouse – An Example
If West Coast Plantations has some idle capacity (500 crates) and
must sacrifice other customer orders (500 crates) to meet Grocery
Mart’s demands (1,000 crates), then the lowest and highest possible
transfer prices are computed as follows:
Transfer Price Cost of buying from outside supplier = 20$
Buying division’s highest possible transfer price:
Therefore, the range of acceptable
transfer prices is $17.50 – $20.00.
Selling division’s lowest possible transfer price:
( $25 - $10) × 500
1,000= 17.50$ Transfer Price +10$

Copyright © The McGraw-Hill Companies, Inc 2011
11-95
Copyright © The McGraw-Hill Companies, Inc 2011
95
Evaluation of Negotiated Transfer Prices
If a transfer within a company would result in
higher overall profits for the company, there is
always a range of transfer prices within which
both the selling and buying divisions would have
higher profits if they agree to the transfer.
If managers are pitted against each other rather
than against their past performance or
reasonable benchmarks, a noncooperative
atmosphere is almost guaranteed.
Given the disputes that often accompany the
negotiation process, most companies rely on
some other means of setting transfer prices.

Copyright © The McGraw-Hill Companies, Inc 2011
11-96
Copyright © The McGraw-Hill Companies, Inc 2011
96
Transfers at the Cost to the Selling
Division
Many companies set transfer prices at either
the variable cost or full (absorption) cost
incurred by the selling division.
Drawbacks of this approach include:
1. Using full cost as a transfer price
can lead to suboptimization.
2. The selling division will never
show a profit on any internal
transfer.
3. Cost-based transfer prices do not
provide incentives to control
costs.

Copyright © The McGraw-Hill Companies, Inc 2011
11-97
Copyright © The McGraw-Hill Companies, Inc 2011
97
Transfers at Market Price
A market price (i.e., the price charged for an
item on the open market) is often regarded as
the best approach to the transfer pricing
problem.
1. A market price approach works
best when the product or service
is sold in its present form to
outside customers and the
selling division has no idle
capacity.
2. A market price approach does
not work well when the selling
division has idle capacity.

Copyright © The McGraw-Hill Companies, Inc 2011
11-98
Copyright © The McGraw-Hill Companies, Inc 2011
98
Divisional Autonomy and
Suboptimization The principles of
decentralization suggest
that companies should
grant managers autonomy
to set transfer prices and
to decide whether to sell
internally or externally,
even if this may
occasionally result in
suboptimal decisions.
This way top management
allows subordinates to
control their own destiny.

Copyright © The McGraw-Hill Companies, Inc 2011
SERVICE DEPARTMENT
CHARGES
Appendix 11B

Copyright © The McGraw-Hill Companies, Inc 2011
11-100
Copyright © The McGraw-Hill Companies, Inc 2011
100
Learning Objective 6
Charge operating departments
for services provided by service
departments.
Copyright © The McGraw-Hill Companies, Inc 2011
11-101
Copyright © The McGraw-Hill Companies, Inc 2011
101
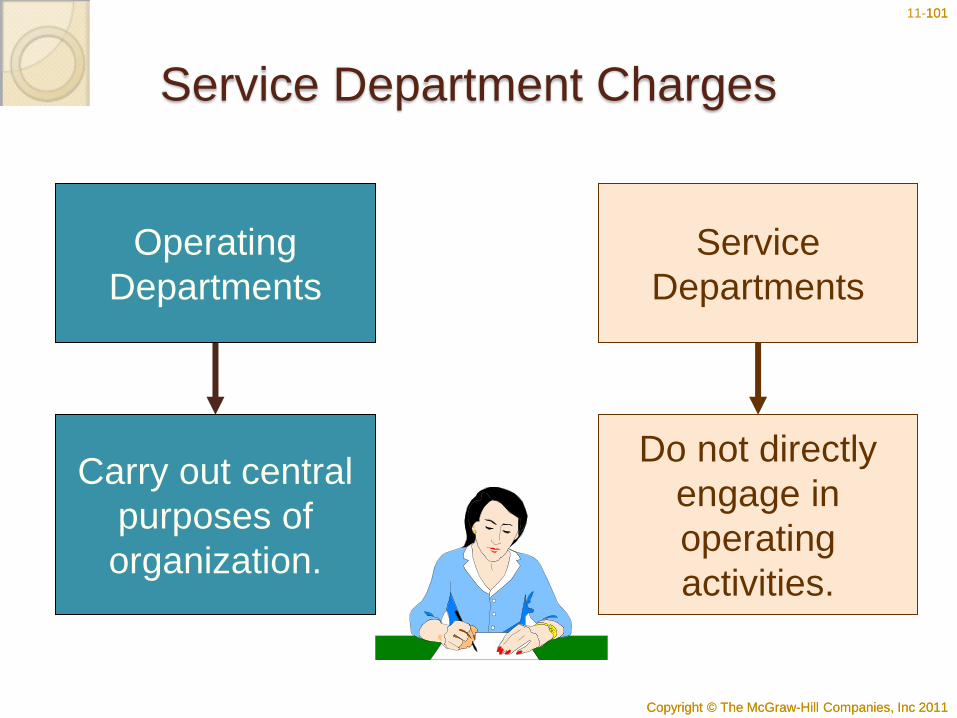
Service Department Charges
Operating
Departments
Carry out central
purposes of
organization.
Service
Departments
Do not directly
engage in
operating
activities.

Copyright © The McGraw-Hill Companies, Inc 2011
11-102
Copyright © The McGraw-Hill Companies, Inc 2011
102
Reasons for Charging Service Department Costs
To encourage operating departments to wisely use service
department resources.
To provide operating departments with
more complete cost data for making
decisions.
To help measure the profitability of
operating departments.
To create an incentive for service
departments to operate efficiently.
Service department costs are charged to operating
departments for a variety of reasons including:

Copyright © The McGraw-Hill Companies, Inc 2011
11-103
Copyright © The McGraw-Hill Companies, Inc 2011
103
$
Transfer Prices
Operating
Departments
Service
Departments
The service department charges
considered in this appendix can be
viewed as a transfer price that is
charged for services provided by
service departments to operating
departments.

Copyright © The McGraw-Hill Companies, Inc 2011
11-104
Copyright © The McGraw-Hill Companies, Inc 2011
104
Charging Costs by Behavior
Whenever possible,
variable and fixed
service department costs
should be charged
separately.

Copyright © The McGraw-Hill Companies, Inc 2011
11-105
Copyright © The McGraw-Hill Companies, Inc 2011
105
Variable service
department costs should be
charged to consuming departments
according to whatever activity
causes the incurrence
of the cost.
Charging Costs by Behavior

Copyright © The McGraw-Hill Companies, Inc 2011
11-106
Copyright © The McGraw-Hill Companies, Inc 2011
106
Charge fixed service department costs to
consuming departments in predetermined
lump-sum amounts that are based on the
consuming department’s peak-period or long-
run average servicing needs.
Are based on amounts of
capacity each consuming
department requires.
Should not vary from
period to period.
Charging Costs by Behavior

Copyright © The McGraw-Hill Companies, Inc 2011
11-107
Copyright © The McGraw-Hill Companies, Inc 2011
107
Should Actual or Budgeted Costs Be
Charged?
Budgeted variable
and fixed service department
costs should be charged to
operating departments.

Copyright © The McGraw-Hill Companies, Inc 2011
11-108
Copyright © The McGraw-Hill Companies, Inc 2011
108
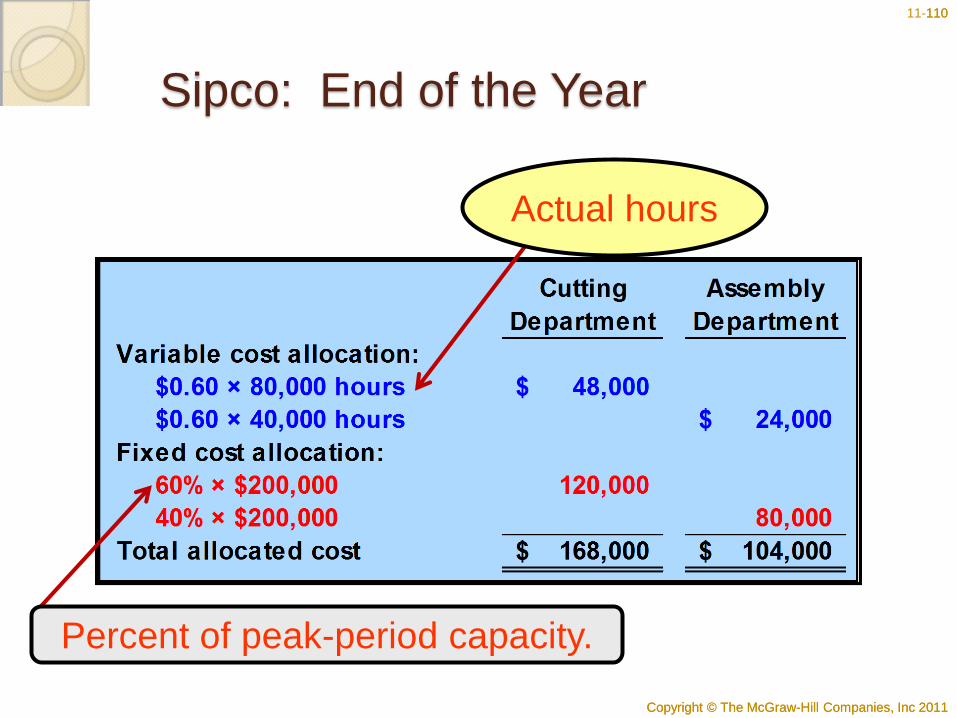
Sipco has a maintenance department and two operating departments: Cutting and Assembly. Variable
maintenance costs are budgeted at $0.60 per machine hour. Fixed maintenance costs are budgeted at $200,000
per year. Data relating to the current year are:
Allocate maintenance costs to the two operating departments.
Sipco: An Example

Copyright © The McGraw-Hill Companies, Inc 2011
11-109
Copyright © The McGraw-Hill Companies, Inc 2011
109
Actual hours
Sipco: End of the Year
Copyright © The McGraw-Hill Companies, Inc 2011
11-110
Copyright © The McGraw-Hill Companies, Inc 2011
110
Percent of peak-period capacity.
Sipco: End of the Year
Actual hours

Copyright © The McGraw-Hill Companies, Inc 2011
11-111
Copyright © The McGraw-Hill Companies, Inc 2011
111
Quick Check
Foster City has an ambulance service that is used
by the two public hospitals in the city. Variable
ambulance costs are budgeted at $4.20 per mile.
Fixed ambulance costs are budgeted at $120,000
per year. Data relating to the current year are:
Percent of
Peak-Period
Capacity Miles Miles
Hospitals Required Planned Used
Mercy 45% 15,000 16,000
Northside 55% 17,000 17,500
Total 100% 32,000 33,500

Copyright © The McGraw-Hill Companies, Inc 2011
11-112
Quick Check
How much ambulance service cost will be allocated to Mercy Hospital at the end of the year?
a. $121,200
b. $254,400
c. $139,500
d. $117,000

Copyright © The McGraw-Hill Companies, Inc 2011
11-113
How much ambulance service cost will be allocated to Mercy Hospital at the end of the year?
a. $121,200
b. $254,400
c. $139,500
d. $117,000
Quick Check

Copyright © The McGraw-Hill Companies, Inc 2011
11-114
Copyright © The McGraw-Hill Companies, Inc 2011
114
Allocating fixed
costs using a variable
allocation base.
Pitfalls in Allocating Fixed Costs
Result
Fixed costs
allocated to one
department are
heavily influenced by
what happens in
other departments.

Copyright © The McGraw-Hill Companies, Inc 2011
11-115
Copyright © The McGraw-Hill Companies, Inc 2011
115
Using sales
dollars as an
allocation base.
Pitfalls in Allocating Fixed Costs
Result
Sales of one department
influence the service
department costs
allocated to other
departments.

Copyright © The McGraw-Hill Companies, Inc 2011
11-116
Copyright © The McGraw-Hill Companies, Inc 2011
116
Autos R Us – An Example
Autos R Us has one service department and three
sales departments, New Cars, Used Cars, and Car
Parts. The service department costs total $80,000
for both years in the example. Contrary to good
practice, Autos R Us allocates the
service department costs based on sales.

Copyright © The McGraw-Hill Companies, Inc 2011
11-117
Copyright © The McGraw-Hill Companies, Inc 2011
117
Autos R Us – First-year Allocation
New Used Parts Total
Sales by department 1,500,000$ 900,000$ 600,000$ 3,000,000$
Percentage of total sales 50% 30% 20% 100%
Allocation of service
department costs 40,000$ 24,000$ 16,000$ 80,000$
Departments
$1,500,000 ÷ $3,000,000 50% of $80,000
In the next year, the manager of the New Cars department
increases sales by $500,000. Sales in the other departments
are unchanged. Let’s allocate the $80,000 service department
cost for the second year given the sales increase.

Copyright © The McGraw-Hill Companies, Inc 2011
11-118
Copyright © The McGraw-Hill Companies, Inc 2011
118
Autos R Us – Second-year
Allocation
New Used Parts Total
Sales by department 2,000,000$ 900,000$ 600,000$ 3,500,000$
Percentage of total sales 57% 26% 17% 100%
Allocation of service
department costs 45,714$ 20,571$ 13,714$ 80,000$
Departments
$2,000,000 ÷ $3,500,000 57% of $80,000
If you were the manager of the New Cars department, would
you be happy with the increased service department
costs allocated to your department?

Copyright © The McGraw-Hill Companies, Inc 2011
11-119
Copyright © The McGraw-Hill Companies, Inc 2011
119
End of Chapter 11