Embed Size (px)
Citation preview

CHAPTER 11
DIACEREIN

286
11.1. DRUG PROFILE
Diacerein, also known as diacetylrhein, is a (4, 5- diacetoxy-9, 10-dihydro9, 10
di-oxo-2 anthracene carboxylic acid) is a new anti-inflammatory, analgesic and
antipyretic drug used in the treatment of osteoarthritis. A 2005 Cochrane review found
Diacerein to be slightly, but significantly, more effective than placebo in Diacerein has a
small effect in improving pain and slowing the progress of osteoarthritis (in the hip).[1]
Figure: 11.A: Structure of Diacerein
Systematic (IUPAC) name : 4, 5-diacetyloxy-9, 10-dioxo-anthracene-2 carboxylic acid
Formula : C19H12O8
Mol. Mass : 368.294 g/mol
Routes : Oral
Excretion : Renal (30%)
It has a novel mode of action that differentiates it from NSAIDs and other
conventional form of drug therapy [2]
. Clinical trials have shown that Diacerein is highly
effective in relieving the symptoms of osteoarthritis. It also significantly reduces severity
of pathological changes of osteoarthritis compared to placebo and increases the
expression of transforming growth factor (TGF) - beta 1and TGF-beta 2, with, potential
cartilage repairing properties. Diacerein does not alter renal or platelet cyclo-oxygenase

287
activity and may therefore be tolerated by patients with prostaglandin-dependent renal
function.
In addition to effect on macrophage migration and phagocytosis, it also inhibits
superoxide production, chemotaxis and phagocytic activity of neutrophils [3, 4]
. However,
Diacerein lacks cyclooxygenase inhibitory activity and hence shows no effect on
prostaglandin synthesis [5,6]
. Therefore, it has been considered as a slow-acting
antiarthritic drug not belonging to the NSAIDs that may interfere with the pathological
course of osteoarthritis [7].
The most common side effects of Diacerein treatment are
gastrointestinal, such as diarrhea. [8]
List of brand names of Diacerien
S.No. BRAND
NAME
FORMULATION COMBINATION AVAILABLE
STRENGTH
(mg)
MANUFACTURER
1 ARTIFIT Cap 50 FDC
2 BICERIN Cap 50 OCTANE BIOTECH
3 CARTIDIN Cap 50 RANBAXY
4 CEDIA-50 Tab 50 INVISION
5 DASHING Cap 50 GENETIC PHARMA
6 DASHING-
GM
Tab glucosamine
sulphate
800 GENETIC PHARMA
7 DIACER Cap 50 CADILA
8 DIASOL Cap 50 IPCA
9 DIOSTEO Tab 50 INDOCO
10 DIPAIN Tab 50 WELBE LIFE
11 DISERAMI
NE
Cap 50 STALLION LABS

288
12 DYCERIN Cap 50 INTEGRACE
(GLENMARK)
13 GEMCERIN Tab glucosamine
sulphate, methyl
sulphonyl methane
50 ALKEM
14 GUDCERIN Cap 50 MANKIND
15 HILIN Cap 50 DR. REDDY'S LABS
16 ICERIN-50 Cap 50 INTRA LABS
17 JOINCERIN Cap 50 TORRENT (VISTA)
18 LEFAX Cap 50 ADLEY FORM.
19 NETREAT Cap 50 MERIDIAN
20 NETREAT-
G
Tab glucosamine 800 MERIDIAN
21 ONISRIN
cap
Cap 50 SYNTONIC LIFE
SCIENCES
22 ONISRIN G Tab glucosamine
sulphate
800 SYNTONIC LIFE
SCIENCES
23 ONISRIN
GSM
Tab glucosamine
sulphate
MSM
1100 SYNTONIC LIFE
SCIENCES
24 TOPCERIN Cap Diacerein 50mg 50 ENDEAVOUR
Table: 11.1

289
11.2. LITREATURE SURVEY
Several analytical methods have been reported for the determination of Diacerein in
pure drug, pharmaceutical dosage forms and in biological samples using
spcetrophotometry, liquid chromatography, electro kinetic chromatography high
performance thin layer chromatography either in single or in combined forms.
M. Jagadeeswaran et al [9]
has developed a simple reverse phase high-performance
liquid chromatographic method for the simultaneous determination of Diacerein and
aceclofenac in tablets. Chromatographic separations of the two drugs were analyzed on a
Phenomenex C18 column (250 × 4.60 mm, 5 µ). The mobile phase constituted of 0.01 M
potassium dihydrogen phosphate and acetonitrile 60:40 (v/v) and pH adjusted to 4.5 using
glacial acetic acid was delivered at the flow rate 2.0 mL min-1. Detection was performed
at 280 nm. The retention time of Diacerein and aceclofenac was 3.61 and 6.28 min,
respectively. Calibration curves were linear with coefficient correlation between 0.99 to
1.0 over a concentration range of 80-120 µg mL-1 of Diacerein and aceclofenac. The
relative standard deviation (R.S.D) was found to be < 2.0%.
Sarika Narade et al [10]
has been developed a simple, sensitive, rapid, accurate and
precise spectrophotometric method for the estimation of Diacerein in bulk and
pharmaceutical dosage forms. Diacerein shows maximum absorbance at 258.5 nm with
molar absorptivity of 4.2258×10⁴
l/mol/cm. Beer’s law was obeyed in the concentration
range of 1-10 µg/ml. The limit of detection (LOD) and limit of quantification (LOQ)
were found to be 0.02 µg/ml and 0.07 µg/ml respectively. The results of recovery studies
(98.68-101.11%) indicated that proposed method is accurate and precise for the
determination of Diacerein in capsules.
N. Kannappan et al [11]
described the analytical method suitable for validation of
Diacerein by reversed Phase high performance liquid chromatography (RP-HPLC)
method. The method utilized RP-HPLC (Water Alliance 2695 with PDA UV detector)
model, a column Zorbax CN, the Analytical balance Shimadzu Libror and a pH meter
Control Dynamics. The mobile phases were comprised of A and B of Acetonitrile and
Buffer pH-|3.5|. Validation experiments were performed to demonstrate system
suitability, specificity, precision, linearity and range, accuracy study, stability of
analytical solution and robustness. The method was linear over the concentration range of

290
25-150 g/ml. The method showed good recoveries (80.30% - 118.14%) and the relative
standard deviations of intra and inter-day assay were ± 0.6030 and result were 101.26%
respectively. The method can be used for quality control assay of Diacerein.
Janhavi Rao et al [12]
has developed and validated a stability-indicating HPLC
method for the quantitative determination of Diacerein in capsule dosage forms. An
isocratic separation was achieved using a perfectsil target ODS-3, 250×4.6 mm i.d., and 5
µm particle size columns with a flow rate of 1 ml/min and using a UV detector to monitor
the eluate at 254 nm. The mobile phase consisted of phosphate buffer: acetonitrile (40:60,
v/v) with pH 4.0 adjusted with phosphoric acid. The drug was subjected to oxidation,
hydrolysis, photolysis and thermal degradation. Diacerein was found to degrade in acidic,
basic, and oxidative stress and also under neutral condition. Complete separation of
degraded products was achieved from the parent compound. All degradation products in
an overall analytical run time of approximately 10 min with the parent compound
Diacerein eluting at approximately 4.9 min. The method was linear over the
concentration range of 1-10 µg/ml (r2 = 0.9996) with a limit of detection and quantitation
of 0.01 and 0.05 µg/ml respectively. The method has the requisite accuracy, selectivity,
sensitivity, precision and robustness to assay Diacerein in capsules. Degradation products
resulting from the stress studies did not interfere with the detection of Diacerein and the
assay is thus stability-indicating.
Sarika Narade et al [13]
has developed a simple, rapid, accurate and precise UV
spectrophotometric method for the simultaneous determination of Diacerein (DCN) and
aceclofenac (ACF) in tablet dosage forms. The method involved solving simultaneous
equations based on measurement of absorbance at two wavelengths, 258 nm and 274 nm,
max of Diacerein and aceclofenac respectively. The linearity for both Diacerein and
aceclofenac was in the range of 1-10 µg/ml and 5-40 µg/ml respectively. The % recovery
was found to be 99-101 % and 99-100 % for Diacerein and aceclofenac respectively
indicating proposed method is accurate and precise for simultaneous estimation of DCN
and ACF in tablets.
Keddal G. Lalitha et al [14]
has been developed a simple, economic, accurate reverse
phase isocratic RP-HPLC method for the quatitation of Diacerein in tablet dosage form.
The quantitation was carried out using Zorbax CN column. The mobile phase was

291
ammonium acetate buffer (pH adjusted to 3.5): Acetonitrile [53:47]. The LOD and LOQ
are found to be 3.952 µg mL-1 and 11.97 µg mL-1 respectively. The flow rate was
1mL/min with UV detection at 254 nm. The method has been validated and proved to be
accurate, precise, linear, rugged, robust, simple and rapid. The calibration curve was
linear in the concentration range 25-150 µg mL-1 with coefficient of correlation 0.99942.
The percentage recovery of Diacerein was found to be 101.60%.The method is useful in
the quality for the estimation of Diacerein in tablet dosage form.
R. Siva kumar et al [15]
has been developed a new simple, accurate, precise and
reproducible RP-HPLC method for the simultaneous estimation of Aceclofenac and
Diacerein in tablet dosage forms using C column (Phenomenex, 250 x 4.6 mm, 5 µm) in
isocratic mode. The mobile phase consisted of 0.02 M phosphate buffer: acetonitrile with
5 ml of 0.4% triethylamine in ration of (35:65 v/v) and adjusted to pH 4. The detection
wavelength was carried out at 254 nm. The method was linear over the concentration
range for Aceclofenac 5-25 µg/ml and for Diacerein 2-10 µg/ml. The recoveries of
aceclofenac and Diacerein were found to be in the range of 99.23-100.98% and 99.45-
100.61% respectively. The validation of method was carried out using ICH-guidelines.
The described HPLC method was successfully employed for the analysis of
pharmaceutical formulations containing combined dosage form.
Useni Reddy Mallu et al [16]
developed a simple, specific, sensitive, and rapid high
performance liquid chromatography (HPLC) method for the determination of
Glucosamine sulphate and Diacerein for assay. Glucosamine and Diacerein were baseline
separated and quantitated on C18 reversed phase column (4.6×250mm, 5.0µm), using a
mobile phase composed of a phosphate buffer-acetonitrile (55:45v/v, pH 3.0) delivered at
a flow rate of 0.6mL/min, and with UV detection (lamda excitation 195nm). The method
was proven to be linear over a Glucosamine concentration range of 84 to 504µg/mL with
a mean correlation coefficient of 0.9999 and a Diacerein concentration range of 5.6 to
33.6µg/mL with a mean correlation coefficient of 0.9998.
Ashwini Ojha et al [17]
has describes a simple HPLC method with UV detection for
simultaneous determination of rhein (the immediate metabolite of Diacerein) and
aceclofenac from human plasma samples. Sample preparation was accomplished through

292
liquid–liquid extraction with ethyl acetate and chromatographic separation was
performed on a reversed-phase ODS column. Mobile phase consisted of a mixture of
acetate buffer and acetonitrile run under gradient at flow rate of 1.0 ml/min. Wavelength
was set at 258 nm. The method was validated for linearity, accuracy, precision and
stability. The calibration was linear over the range of 0.1–7.0 μg/ml for rhein and 0.5–
20 μg/ml for aceclofenac using 500 μl plasma samples. Extraction recoveries were 85%
for rhein and 70% for aceclofenac. The method can easily be adopted for high-throughput
clinical and pharmacokinetic studies of above two-drug fixed dose combination
formulations.

293
11.3. EXPERIMENTAL
11.3.1. Instrumentation
Peak HPLC containing LC 20AT pump and variable wavelength programmable
UV-Visible detector and Rheodyne injector was employed for investigation. The
chromatographic analysis was performed on a Chromosil C18 column (250 mm × 4.6
mm, 5µm). Degassing of the mobile phase was done using a Loba ultrasonic bath
sonicator. A Denwar Analytical balance was used for weighing the materials.
11.3.2. Chemicals and Solvents
The reference sample of Diacerien (API) was obtained from Cipla, Mumbai. The
Formulation DYCERIN (Diacerien) was procured from the local market. Methanol,
Water used was of HPLC grade and purchased from Merck Specialities Private Limited,
Mumbai, India.
11.3.3. The mobile phase
A mixture of Methanol: Water in the ratio of 80:20 v/v was prepared and used as
mobile phase.
11.3.4. Standard solution of the drug
For analysis 100 ppm standard solution was prepared, required concentrations
were obtained from 100 ppm solution by appropriate dilution.
11.3.5. Sample (Capsule) solution
The formulation tablets of Diacerien (DYCERIN - 50 mg) were crushed to give
finely powdered material. From the Powder prepared a 3 ppm solution with mobile phase
and then filtered through Ultipor N66 Nylon 6, 6 membrane sample filter paper.

294
11.4. METHOD DEVELOPMENT
For developing the method (as described in chapter 1 and 2), a systematic study of
the effect of various factors was undertaken by varying one parameter at a time and
keeping all other conditions constant. Method development consists of selecting the
appropriate wave length and choice of stationary and mobile phases. The following
studies were conducted for this purpose.
11.4.1. Detection wavelength
The spectrum of 10ppm solution of the Diacerien in methanol was recorded
separately on UV spectrophotometer. The peak of maximum absorbance wavelength was
observed. The spectra of Diacerien were showed maximum absorbance at 250nm.
11.4.2. Choice of stationary phase
Preliminary development trials have performed with octadecyl columns with
different types, configurations and from different manufacturers. Finally the expected
separation and peak shapes were obtained on Chromosil C18 (250 mm x 4.6 mm, 5μm)
column.
11.4.3. Selection of the mobile phase
In order to get sharp peak, low tailing factor and base line separation of the separation of
the components, a number of experiments were carried out by varying the composition of
various solvents and flow rate. To have an ideal separation of the drug under isocratic
conditions, mixtures of solvents like methanol, water and Acetonitrile with or without
different buffers indifferent combinations were tested as mobile phases on a Chromosil
C18 column. A mixture of Methanol : Water in the ratio of 80:20 v/v was proved to be
the most suitable of all the combinations since the chromatographic peak obtained was
better defined and resolved and almost free from tailing.
11.4.4. Flow rate
Flow rates of the mobile phase were changed from 0.5 – 1.5 mL/min for optimum
separation. A minimum flow rate as well as minimum run time gives the maximum
saving on the usage of solvents. It was found from the experiments that 0.5 mL/min flow
rate was ideal for the successful elution of the analyte.

295
11.4.5. Optimized chromatographic conditions
Chromatographic conditions as optimized above were shown in Table 11.2. These
optimized conditions were followed for the determination of Diacerien in bulk samples
and in its Formulations. The chromatogram of standard (3ppm) shown in Figure 11.B
Mobile phase Methanol :Water 80:20 v/v
Pump mode Isocratic
Mobile phase PH 7.5
Diluent Mobile phase
Column chromosil C18 column (250 mm x 4.6
mm, 5μ)
Column Temp Ambient
Wavelength
250 nm
Injection Volume 20 μl
Flow rate 0.5 mL/min
Run time 10 min
Retention Time 8.29 min
Table 11.2: Optimized chromatographic conditions for estimation Diacerien

296
Figure 11.B: Chromatogram of standard solution
297
11.5. VALIDATION OF THE PROPOSED METHOD
The proposed method was validated (as described in chapter 1 and 2) as per ICH
guidelines. The parameters studied for validation were specificity, linearity, precision,
accuracy, robustness, system suitability, limit of detection, limit of quantification, and
solution stability.
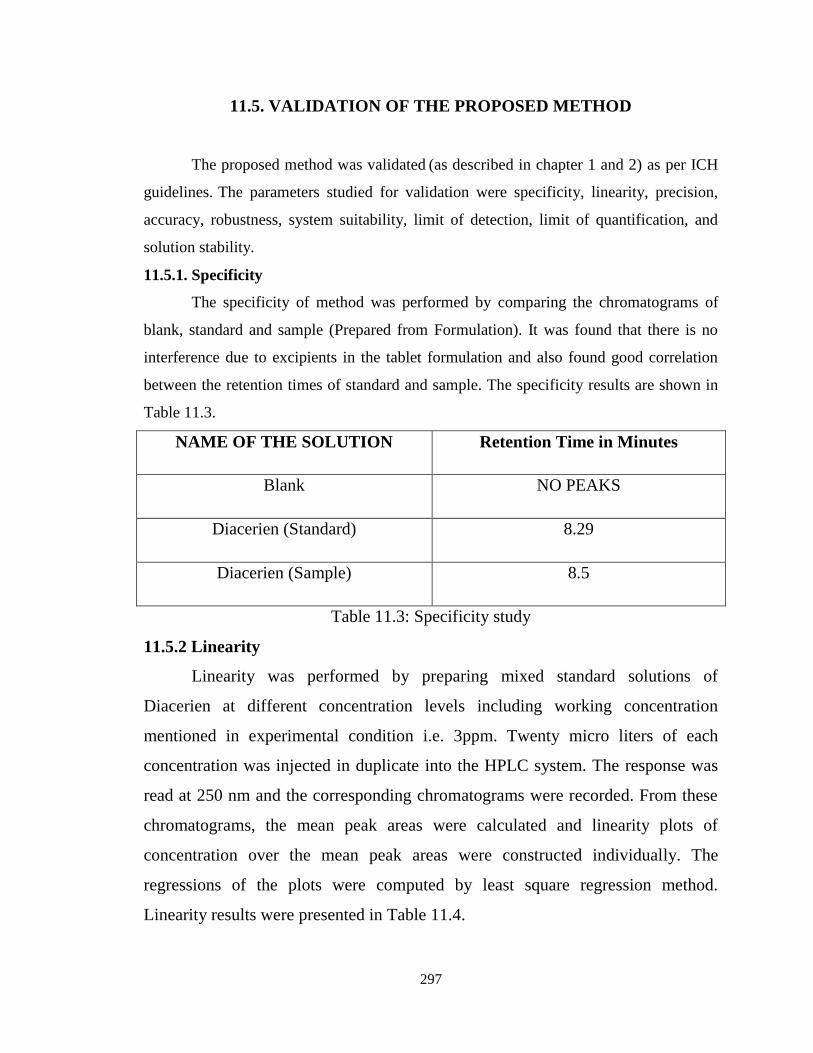
11.5.1. Specificity
The specificity of method was performed by comparing the chromatograms of
blank, standard and sample (Prepared from Formulation). It was found that there is no
interference due to excipients in the tablet formulation and also found good correlation
between the retention times of standard and sample. The specificity results are shown in
Table 11.3.
NAME OF THE SOLUTION Retention Time in Minutes
Blank NO PEAKS
Diacerien (Standard) 8.29
Diacerien (Sample) 8.5
Table 11.3: Specificity study
11.5.2 Linearity
Linearity was performed by preparing mixed standard solutions of
Diacerien at different concentration levels including working concentration
mentioned in experimental condition i.e. 3ppm. Twenty micro liters of each
concentration was injected in duplicate into the HPLC system. The response was
read at 250 nm and the corresponding chromatograms were recorded. From these
chromatograms, the mean peak areas were calculated and linearity plots of
concentration over the mean peak areas were constructed individually. The
regressions of the plots were computed by least square regression method.
Linearity results were presented in Table 11.4.

298
Level Concentration of
Diacerien in ppm
Mean peak area
Level -1 1 54378.9
Level -2 2 104301.4
Level -3 3 158610.9
Level -4 4 209028.0
Level -5 5 261072.4
Range: 1-5ppm Slope
Intercept
Correlation coefficient
51811.36
2044.24
0.999
Table 11.4: Linearity Results
Figure 11.C: On X axis concentration of sample, On Y axis peak area response
0
50000
100000
150000
200000
250000
300000
0 1 2 3 4 5 6
Are
a
Concentration
Diacerein

299
11.5.3. Precision
Precision is the degree of repeatability of an analytical method under normal
Operational conditions. Precision of the method was performed as intraday precision,
Inter day precision.
11.5.3.1. Intraday precision
To study the intraday precision, six replicate standard solutions (5ppm) of
Diacerien were injected. The percent relative standard deviation (% RSD) was calculated
and it was found to be 0.916, which are well within the acceptable criteria of not more
than 2.0. Results of system precision studies are shown in Table 11.5.
SAMPLE
CONC(PPM) INJECTION No. PEAKS
AREA
R.S.D
(Acceptance
criteria ≤ 2.0%)
Diacerien
5
1 49266.99
0.916
2 47785.14
3 49185.61
4 48990.49
5 49161.94
6 48140.86
Table 11.5: System Precision (Intra Day)
11.5.3.2. Inter Day precision
To study the interday precision, six replicate standard solution of Diacerien was
injected on third day of sample preparation. The percent relative standard deviation (%
RSD) was calculated and it was found to be 0.399, which are well within the acceptable
criteria of not more than 2.0. Results of system precision studies are shown in Table 11.6.

300
SAMPLE
CONC (PPM) INJECTION No. PEAKS
AREA
R.S.D
(Acceptance
criteria ≤ 2.0%)
Diacerien
5
1 48327.10
0.399
2 48368.06
3 47640.57
4 48268.82
5 47869.36
6 48218.26
Table 11.6: System Precision (Inter Day)
11.5.4. Accuracy
The accuracy of the method was determined by standard addition method. A
known amount of standard drug was added to the fixed amount of pre-analyzed tablet
solution. Percent recovery was calculated by comparing the area before and after the
addition of the standard drug. The standard addition method was performed at 50%,
100% and 150% level of 2ppm. The solutions were analyzed in triplicate at each level as
per the proposed method. The percent recovery and % RSD was calculated and results
are presented in Table 11.7 Satisfactory recoveries ranging from 99.0 to 102.0 were
obtained by the proposed method. This indicates that the proposed method was accurate.

301
Level Amount of
Diacerien spiked
(ppm)
Amount of
Diacerien
recovered(ppm)
% Recovery
%RSD
50 %
3 3.01 100.3
0.678 3 2.97 99.00
3 2.98 99.33
100%
4 3.96 99.00
0.901 4 4.01 100.25
4 4.03 100.75
150%
5 4.96 99.2
0.759 5 4.97 99.4
5 5.03 100.6
Mean % of
recovery 99.75
Mean RSD =
0.779
Table11.7: Percentage Recovery and % RSD
11.5.5. Robustness
The robustness study was performed by slight modification in flow rate of Mobile
phase, pH of the buffer and composition of the mobile phase. Diacerien at 4 ppm
concentration was analyzed under these changed experimental conditions. It was
observed that there were no marked changes in chromatograms, which demonstrated that
the developed method was robust in nature. The results of robustness study are shown in
Table 11.8.

302
Condition Mean area % assay % difference
Unaltered 209028.0 100.0 0.0
Flow rate at 0.4 mL/min
Flow rate at 0.6mL/min
209441.6
208145.3
100.19
99.57
0.19
0.43
Mobile phase:
MEOH: Water
75% 25%
85% 15%
209047.2
208941.5
100.009
99.95
0.009
0.05
pH of mobile phase at 7.3 207922.5 99.47 0.53
pH of mobile phase at 7.7 208842.1 99.91 0.09
Table 11.8: Robustness
11.5.6. System suitability
System suitability was studied under each validation parameters by injecting six
replicates of the standard solution 2 ppm). The results obtained were within acceptable
limits (Tailing factor ≤2 and Theoretical plate’s ≥2000) and are represented in Table
11.9. Thus, the system meets suitable criteria.
Parameter Tailing factor Theoretical plates
Specificity study 1.54 41802
Linearity study 1.34 69829
Precision study 1.46 47785
Table 11.9: System Suitability
11.5.7. Limit of detection and Limit of quantification
Limit of detection (LOD) is defined as the lowest concentration of analyte that
gives a detectable response. Limit of quantification (LOQ) is defined as the lowest
Concentration that can be quantified reliably with a specified level of accuracy and

303
Precision. For this sample was dissolved by using Mobile Phase and injected until peak
was disappeared. After 15ng/ml dilution, Peak was not clearly observed. So it confirms
that 0.06ppm is limit of Detection and 0.18ppm dilution is Limit of Quantification. For
this study six replicates of the analyte at lowest concentration were Measured and
quantified. The LOD and LOQ of Diacerien are given in Table 11.10.
parameter Measured volume
Limit of Quantification 0.18ppm
Limit of Detection 0.06ppm
Table 11.10: LOQ and LOD
Formulation:
For assay 20 Diacerein (DICERIN - 50mg) tablets were weighing and calculate
the average weight. Accurately weigh and transfer the sample equivalent to 10mg of
Diacerein in to a 10ml volumetric flask. Add diluent and sonicate to dissolve it
completely and make volume up to the mark with diluents. Mix well and filter through
0.45um filter. Further pipette 1ml of the above stock solution into a 10ml volumetric
flask and dilute up to mark with diluents and finally 3 ppm were prepared. Mix well and
filter through 0.45um filter. An aliquot of this solution was injected into HPLC system.
Peak area of Diacerein was measured for the determination.

304
11.6. RESULTS AND DISCUSSION
Proper selection of the stationary phase depends up on the nature of the
sample, molecular weight and solubility. The drug Diacerein in non-polar. Non-polar
compounds preferably analyzed by reverse phase columns. Among C8 and C18, C18
column was selected. Non-polar compound is very attractive with reverse phase columns.
So the elution of the compound from the column was influenced by polar mobile phase.
Mixture of water and methanol was selected as mobile phase and the effect of
composition of mobile phase on the retention time of Diacerein was thoroughly
investigated. The concentration of the water and methanol were optimized to give
symmetric peak with short run time (Figure 11.B). A system suitability test was applied
to representative chromatograms for various parameters. The results obtained were within
acceptable limits and are represented in Table 11.9. Thus, the system meets suitable
criteria.
Five points graphs was constructed covering a concentration range 1ppm –
5ppm (Three independent determinations were performed at each concentration). Linear
relationships between the peak area signals of Diacerein the corresponding drug
concentration was observed. The linearity range of Diacerien with coefficient of
correlation, (r= 0.9999), Intercept (2044.24), Slope (51811.36) were found. ). The data of
regressing analysis of the calibration curves are shown in Table 11.4. Precision was
evaluated by carrying out six independent sample preparation of a single lot of
formulation. The sample solution was prepared in the same manner as described in
sample preparation. Percentage relative standard deviation (%RSD) was found for
Intraday-0.916, Interday-0.399) to be less than 2% for within a day and day to day
variations, which proves that method is precise. Results are shown in Table 11.5, 11.6.
To check the degree of accuracy of the method, recovery studies were
performed in triplicate by standard addition method at 50%, 100% and 150%. Known
amounts of standard were added to pre-analyzed samples and were subjected to the
proposed HPLC method. Results of recovery studies are shown range 99.00-101.45%.
The mean recovery data obtained for each level as well as for all levels combined (Table

305
11.7) were within 2.0% of the label claim for the active substance with an R.S.D. < 2.0%,
which satisfied the acceptance criteria set for the study.
The proposed method has been applied to the assay of commercial tablets
(DYCERIN - 50 mg) containing Diacerien. Sample was analyzed for five times after
extracting the drug as mentioned in assay sample preparation of the experimental section.
After analysis test result assay of Diacerien in Tablet is 15.7% and is very close to the
labeled amount.
Statistical analysis of the results has been carried out revealing high accuracy
and good precision. The RSD for all parameters was found to be less than two, which
indicates the validity of method and assay results obtained by this method are in fair
agreement. The developed method can be used for routine quantitative simultaneous
estimation of Diacerein in multi component pharmaceutical preparation. The proposed
method is simple, sensitive and reproducible and hence can be used in routine for
simultaneous determination of Diacerein in bulk as well as in pharmaceutical
preparations.

306
11.7. BIBILOGRAPHY
1. Fidelix TS, Soares BG, Trevisani VF (2006); "Diacerein for osteoarthritis".
Cochrane database of systematic reviews (Online) (1): CD005117.
doi:10.1002/14651858.CD005117.pub2. PMID 16437519.
2. Neuman M. Clinical; “Biological and gastric fibroscopic tolerance of a new non
steroidal anti-inflammatory analgesic, Diacerein”; Drugs, Exp Clin Res; 1980; 6:
53- 64.
3. A. Mahajan, K Singh, V.R. Tandon, S. Kumar, H. Kumar; J.K. Sci. J. Med. Edu;
2006; 8: 173-175.
4. M. Solignac, Presse. Med; 2004; 33: 10-12.
5. J.P. Pelletier, F. Mineau, J.C. Fernandes, N. Duval, J. Martel-Pelletier, J.
Rheumatol; 1998; 25: 2417- 2424.
6. G. La Villa, F. Marra, G. Laffi, B. Belli, E. Meacci, P. Fascetti, P. Gentilini, Eur.
J. Clin. Pharmacol. 1989, 37: 1-5.
7. P. Nicolas, M. Tod, C. Padoin, O. Petitjean; Clin. Pharmacokinetic; 1998; 35:
347-359.
8. "Diacerein"; BIAM; 1999-03-24. Retrieved 2007-06-13.
9. “Development and validation of a RP-HPLC method for simultaneous
determination of Diacerein and aceclofenac in tablet dosage form”; Research
Journal of Pharmaceutical, Biological and Chemical Sciences; 2010; 1(2): 418-
423.
10. “Development and validation of UV- Spectrophotometric method for the
determination of Diacerein in capsules”; Digest Journal of Nanomaterials and
Biostructures; 2010; 5(1): 113 – 118.
11. “Analytical method development and validation of Diacerein tablets by RP-
HPLC; International Journal of ChemTech Research; 2010; 2(1): 143-148.
12. “A Stability-Indicating High Performance Liquid Chromatographic Method for
the Determination of Diacerein in Capsules”; Indian J Pharm Sci; 2009; 71(1):
24–29.
13. Sarika Narade et al /J. Pharm. Sci. & Res; 2010; .2(2): 137-142.

307
14. Eurasian J. Anal. Chem; “A Simple HPLC Method for Quantitation of Diacerein
in Tablet Dosage Form”; 2010; 5(1): 81-88.
15. “Validated RP-HPLC method for the simultaneous estimation of Aceclofenac and
Diacerein in bulk and formulation”; International Journal of PharmTech
Research; 2010; 2(1): 940-944.
16. “HPLC Method Development for Glucosamine Sulphate and Diacerein
Formulation”; Journal of Pharmacy Research; 2010; 3(2): 361-63.
17. “Simultaneous HPLC–UV determination of rhein and aceclofenac in human
plasma”; Journal of Chromatography B; 2009; 877(11-12, 15): 1145-1148.


![Digital Conductivity Transmitter Type 8225 - iProcesSmart · Digital Conductivity Transmitter Type 8225 Dimensions [mm (inch)] Sensor Short Distance Conductivity-Sensor Type 8200](https://img.dokumen.tips/doc/110x75/5c71f2f909d3f285208b52c9/digital-conductivity-transmitter-type-8225-digital-conductivity-transmitter.jpg)