Embed Size (px)
Citation preview

308
CHAPTER 11
COMMUNITY DISASTER RECOVERY
This chapter defines disaster recovery in terms of its distinctive activities and explains how it differs from activities that take place during other phases of the emergency management cycle. The chapter begins with a brief description of the routine functioning of US communities and then turns to the housing, economic, and psychological recovery of households and the operational recovery of businesses. The chapter then turns to the recovery assistance that can be expected from state and federal government and from insurance. The chapter concludes with a discussion of local government’s preimpact recovery planning and the implementation and improvisation of that plan during a disaster’s aftermath.
The Routine Functioning of US Communities
The process of community recovery from disaster cannot be properly understood without
understanding how communities function before a disaster strikes. First, a community is commonly
understood to be a specific geographic area and is frequently considered to be equivalent to a political
jurisdiction such as a town, city, or county. However, a community also has two additional elements—
psychological ties and social interaction (Poplin, 1972). Psychological ties involve a sense of shared
identity that arises from common goals, values, and behavioral norms (shared expectations of appropriate
behavior) that lead “insiders” to distinguish themselves from “outsiders” (Lindell & Perry, 2004).
Moreover, insiders interact with each other more frequently with each other than they do with outsiders
and these interactions involve differentiated roles (e.g., parent-child, supplier-customer, citizen-
bureaucrat) that involve the exchange of resources. Communities are ecological networks (Bates &
Pelanda, 1994; Peacock & Ragsdale, 1997) in which the basic types of units are households, businesses,
and government agencies. Each social unit has people (family members in the case of households and
employees in the case of businesses and government agencies) and resources. As Figure 11-1 indicates,
households supply labor to businesses in exchange for money. In turn, households pay money to obtain
goods and services from private suppliers (ranging from grocers to doctors), infrastructure (water, sewer,
electric power, fuel, transportation, telecommunications), and government services (e.g., fire protection,
education, parks). In addition to these economic exchanges, households engage in behavioral interaction
with peers such as friend, relatives, neighbors, and coworkers. These exchanges sometimes involve goods
and services, but they are more frequently characterized by exchanges of affection and emotional support.
Businesses use the labor they receive from households to produce goods or services, which they
then sell (to the degree they are more successful than their competitors) to their customers. As is the case
with households, businesses use the money they obtain from customers to pay suppliers, infrastructure,
and government. (For-profit) businesses provide goods and services for a fee and government provides
them in exchange for taxes. However, there are also (nonprofit) NGOs that provide goods and services at
or below cost—and sometimes free. For example, Habitat for Humanity relies substantially on donated
materials and volunteer labor to construct affordable housing. The American Red Cross and other NGOs
use donated money, goods, and services to provide shelter, food, clothing, medicine, and financial grants
to those in distress. The steady flow of money in exchange for goods and services, known as cash flow, is
critically important to social units that have insufficient savings.
In a free market economy, government establishes broad rules within which individual parties can
freely establish contracts for the exchange of resources. For example, government declares certain goods
(e.g., heroin) and services (e.g., prostitution) to be unacceptable and, therefore, illegal. It also requires
private parties to undertake certain activities (e.g., obtain a license to practice medicine; provide an

309
accurate accounting and annual statement of corporate assets) and provides some services that the private
sector cannot or will not otherwise provide at acceptable cost (e.g., rural electrification, routine mail
delivery). It is important to recognize that the units in the community network differ in their resources
and, thus, their power. Thus, units with more social, economic, and political power can force less
powerful units to accept less favorable outcomes.
Figure 11-1. Routine Relationships Among Social Units.
Moreover, these basic community units act in cooperation, competition, and conflict (Poplin,
1972; Thomas, 1992). Cooperation refers to activities that result in mutual benefit. A prime economic
example is a business relationship in which a supplier provides a good or service to a customer in
exchange for money. Competition exists when two parties strive toward a goal that only one can achieve.
In fair competition, the parties abide by methods of goal achievement that are mutually accepted as
legitimate. For example, two businesses compete to sell a product to customers on the basis of quality and
price. Conflict occurs when one party attempts to directly frustrate the goal achievement of another. For
example, one business might attempt to use its greater resources to force its suppliers to refuse to serve its
competitor. There are many social institutions, such as schools and churches, that seek to promote
agreement on basic values and legitimate methods of goal achievement by socializing their members.
Complete consensus is never reached, so political institutions exist to resolve differences and to provide
an authoritative allocation of public resources.
Within each of these three categories, social units vary in their assets. Households, businesses,
and government agencies have human assets such as cognitive, psychomotor, physical abilities, and
personality characteristics which, together with their time and effort, constitute what economists consider
to be labor (Schneider & Schmitt, 1986). In addition, they have physical assets such as land, buildings,
equipment, furniture, clothes, vehicles, crops, and animals, which economists classify as goods. Finally,
they have financial (capital) assets such as cash, stocks, bonds, savings, insurance. In many cases, these
assets were accumulated by incurring financial liabilities such as loans, mortgages, and credit card debt.
However, the assets they have accumulated generate income from employment, rental of physical assets,
interest or dividends from financial assets. (Of course, government derives most of its income from
taxes.) This income must be balanced against expenses for consumption (e.g., households’ purchases of
shelter, food, clothing, medical care, entertainment and other goods and services), and production (e.g.,
businesses’ and government agencies’ payments for raw materials, infrastructure, and employees’ labor),
Infrastructure Government
Affection
Goods/ services
Peers Money
Labor
Money Customers Households Businesses
Goods/ services
Suppliers Competitors

310
as well as investment in additional assets (e.g., training/education to increase human assets, equipment to
provide more efficient production). Finally, social units vary in the amounts of resources they possess. As
noted in Chapter 6, households with certain demographic characteristics such as ethnic minorities, aged,
and female-headed status frequently have fewer resources. Similarly, small businesses (i.e., those with
few employees) and small local jurisdictions (i.e., those with small tax revenues) also have fewer
resources. This makes it difficult for them to withstand an extended disruption of the community system
that is, as Chapter 6 indicated, precisely what a major disaster produces.
Household Activities
Households engage in a variety of activities over the course of the day and the amount of time
spent in different activities can be described in term of their time budgets. Table 11-1 reports the results of
a recent time budget study conducted by Wiley, et al. (1991). The table lists 26 different categories of
activities that were combined from a larger list of nearly 100. The activities are listed in terms of their
population means (averages) for minutes per day. Some activities are performed by all people (e.g.,
sleeping) whereas others are performed by only a small part of the population (e.g., singing and dancing),
so the mean number of minutes per day is listed separately for the entire population and doers (i.e., those
who engage in the activity).
Table 11-1. Community Residents’ Activities.
Activity Population mean (min)
Doer
mean (min)* Activity Population mean (min)
Doer
mean (min)*
Sleeping 504 506 Child care 18 79
Working 194 424 Active sports 16 88
Electronic media 143 184 Outdoor recreation 11 134
Travel 109 118 Cultural events 10 143
Eating 89 93 Errands 8 41
Socializing 56 115 Car repair 6 48
Personal care 50 58 Hobbies 5 114
Reading/writing 48 104 Bars/lounges 4 101
Education 46 237 Animal care 3 33
Cooking 38 73 Singing/dancing 3 106
House cleaning 34 87 Other 2 29
Shopping 25 66 Dry cleaners 1 73
Yard work 20 111 Services 1 83
Adapted from Wiley, et al. (1991).
These time budget data reveal two significant aspects of people’s daily activities. First, some
activities such as sleeping and eating are essential, as indicated by small differences between population
means and doer means. By contrast, other activities such as cultural events and singing/dancing are highly
discretionary, as indicated by large differences between population means and doer means. Discretionary
activities can be substantially reduced or eliminated when the need arises. Second, some of the activities
with large differences between population means and doer means arise from the household division of
labor in which some activities are age or gender stereotyped. For example, adult males are more likely to
be the household members involved in yard work and car repair, whereas adult females are more likely to
be the ones involved in shopping and child care. In recent years, it is increasingly likely for both adult
males and females to be involved in work outside the home. However, children of both genders
participate in education. As will be seen later, households attempt to maintain their normal patterns of

311
daily activities in the face of disasters—especially what are considered to be the most essential
activities—as well as household members’ division of labor in performing those activities.
Business Activities
The businesses in most towns and cities produce a wide variety of goods and services. The
Bureau of the Census devised the North American Industry Classification System (NAICS, revised in
2002), which was formerly known as the Standard Industrial Classification (SIC). NAICS categorizes all
businesses into 20 industries and assigns a numerical code to each. Table 11-2 shows the two digit codes
for these industries, but this is a very coarse grouping. These broad industrial classes are divided into finer
categories that are identified by six digit codes (see www.census.gov/epcd/naics02/).
Table 11-2. North American Industry Classification System (2002).
Code Activity Code Activity
11 Agriculture, Forestry, Fishing & Hunting 53 Real Estate & Rental & Leasing
21 Mining 54 Professional, Scientific, and Technical Services
22 Utilities 55 Management of Companies and Enterprises
23 Construction 56 Administrative and Support and Waste Management and Remediation Services
31-33 Manufacturing 61 Educational Services
42 Wholesale Trade 62 Health Care and Social Assistance
44-45 Retail Trade 71 Arts, Entertainment, and Recreation
48-49 Transportation & Warehousing 72 Accommodation and Food Services
51 Information 81 Other Services
(except Public Administration)
52 Finance and Insurance 92 Public Administration
Each community has its own pattern of reliance on these 20 industries, which can be assessed in terms of
its location quotient,
LQ = (ei/et)/(Ei/Et)
where ei is local employment in industry i, et is total local employment, Ei is national employment in
industry i, and Et is total national employment (Blair & Bingham, 2000). Some of the industries in Table
11-2 generate more exports from the community to other areas of the country and, thus, define its
economic base.
More specifically, the economic base model identifies the relative amount of the community’s
production of goods and services that is derived from basic (export) economic activities, internal
investment, and internal consumption (Chapin & Kaiser, 1985). More money is available for internal
investment and consumption when exports, the sale of goods and services outside the community, exceed
imports. Indeed, a multiplier effect is set in motion when money that is received from outside the
community is spent inside the community. As a result, urban areas obtain between $1.50 and $2.50 in
induced local income for every dollar of revenue from exports (Blair & Bingham, 2000). The size of the
multiplier for any given region can be determined from input-output analyses that use detailed
information about the degree to which the firms in each sector obtain their inputs (raw materials and
infrastructure) from inside the community and export their outputs to firms outside the community. This
is modified by the size of each economic sector in that region. In general, mining, manufacturing,
wholesale and retail trade, banking and finance, and high quality service facilities (e.g., nationally
renowned medical clinics) are considered to be significant contributors to a community’s economic base.
However, there can be exceptions to this rule and it can be difficult to clearly classify businesses as basic

312
or service activities, to define the base area, and to measure the size of the base and service sectors
(Chapin & Kaiser, 1985).
These economic concepts also have significant implications for disaster recovery. First,
communities having a weak economic base characterized by low exports, low investments, and high
internal consumption will need considerable assistance in recovering from a disaster. Second, basic
industries that produce exports should receive immediate attention in the disaster aftermath so they can
generate income whose multiplier effect will stimulate local investment and consumption. This will
spread the recovery to other community industries.
Government activities. The governments of most local jurisdictions—towns, cities, and
counties—perform a variety of functions that cannot reasonably be performed by businesses in the private
sector (Caiden, 1982; Graham & Hays, 1993; Nigro & Nigro, 1980). Each function is assigned to
governmental subunit called an agency or department. All of the departments report to the jurisdiction’s
CAO, who might be a mayor, city manager, or Chair of the County Board of Supervisors. Figure 11-2
displays an organization chart listing the departments typically found in local jurisdictions and indicates
the direct reporting relationship by the solid line connecting each department directly to the CAO.
Figure 11-2. Sample Jurisdictional Organization Chart.
The seven departments at the bottom are usually called line agencies, whereas the six
departments at the top of the organization chart are labeled staff agencies. In general, line agencies deliver
services directly to the public, whereas staff agencies provide services to the line agencies and each other.
By this point, it should be clear what Emergency Management does, so that department will not be
discussed further. Among the other staff agencies, Intergovernmental/Public Relations provides
information about the jurisdiction’s activities to those outside the organization. The Human Resources
department develops and oversees the jurisdiction’s systems for personnel recruitment, selection, training,
Chief Administrative
Officer
Social Services
Building Construction
Planning Legal
Counsel
Public Health
Public Works
Parks & Recreation
Fire/ Rescue
Finance & Administration
Law Enforcement
Human Resources
Intergovernmental/ Public Relations
Emergency Management

313
and performance evaluation. Finance & Administration is responsible for budget preparation and control,
accounting, property assessment, taxes and licenses, procurement, and property and records management.
Planning assesses population and economic trends, develops the comprehensive plan and the capital
improvements plan, formulates policies for land use regulation, and grants permits for land development.
Legal Counsel is responsible for drafting ordinances, resolutions, and business contracts, as well as
rendering legal opinions about proposed administrative actions and representing the jurisdiction in
lawsuits.
Among the line agencies, Law Enforcement conducts patrols and criminal investigations, and
operates jails. Fire/Rescue is responsible for fire prevention, fire suppression, hazmat response, and EMS.
Public Works is responsible for constructing and maintaining public buildings, streets, and lights; traffic
engineering; sewers and storm drains; and garbage and trash collection. The Social Services department
administers public housing and welfare programs such as Aid to Families with Dependent Children and
food stamps. Public Health monitors environmental contamination, epidemics, and immunizations. Parks
& Recreation maintains public parks and administers programs for children’s athletics and some
noncredit adult education. The department of Building Construction reviews and approves building
blueprints, inspects new construction at critical points in the construction process, and inspects existing
buildings to determine if they must be condemned as unsafe for habitation. In some communities, an
Electric Utility that purchases power and operates the electric distribution system would be added to this
organization chart. The figure includes no Education department because this function is usually
performed by an independent school district.
An Overview of Community Disaster Recovery
Disaster recovery is the phase of the emergency management cycle that begins with the
stabilization of the incident and ends when the community has recovered from the disaster’s impacts. The
term incident stabilization refers to the point in time at which the immediate threats to human safety and
property resulting from the physical impacts of the primary and secondary hazard agents have been
resolved. Thus, the sense of uncertainty and urgency that is the hallmark of the emergency response is
beginning to be replaced by thoughts about how to rebuild damaged structures, restore infrastructure
services, and return the community to its normal patterns of activity. For example, earthquake recovery
could be said to begin after most buried victims have been extricated, buildings in danger of collapse have
been shored up, and fires have been extinguished.
As Chapter 6 indicated, most people’s objective in disaster recovery is to restore the patterns of
household, business, and government activity exactly as they existed before the disaster struck. To do
this, they typically assume they must rebuild the buildings and infrastructure as it was. Of course, it is
now understood that restoring the community to its previous status will also reproduce the hazard
exposure, physical vulnerability, and social vulnerability that led to the disaster. Thus, there are four
questions that must be addressed. First, do stricken communities recover from disasters and, if so, how do
they acquire the resources needed to replace those that were destroyed? Second, what happens to
households, businesses, and government agencies as they struggle to recover? Third, can communities do
to promote a more rapid, complete, and equitable recovery? Finally, what can communities do to reduce
their hazard exposure and make themselves more resilient when extreme environmental events occur?
The answer to the first question is that US communities clearly do recover relatively quickly from
disasters. There is general agreement with the explanation offered by Friesma, et al. (1979) that the local

314
economic costs of disasters are redistributed over the entire country by means of an extensive network of
social, economic, and political linkages. The paths to recovery appear to be determined by the physical
characteristics of the disaster agent, the types and quantities of community resources that survive the
disaster, the external aid the community can obtain, and the reconstruction strategies these communities
adopt and implement. However, the fact that communities as a whole recover does not mean that specific
neighborhoods or households within those neighborhoods recover at the same rate or even at all.
Similarly, it does not mean specific economic sectors or individual businesses within those sectors will be
able to maintain or even resume operations. Thus, it is important to anticipate which population segments
and economic sectors will have the most difficulty in recovering. This will enable community authorities
to intervene with technical and financial assistance when it is needed, monitor their recovery, and
encourage them to adopt hazard mitigation measures to reduce their hazard vulnerability.
Disaster recovery has both physical and social dimensions that arise from the physical and social
impacts described in Chapter 6. Thus, disaster recovery includes actions taken to cope with casualties—
households must find emotion focused strategies for dealing with the loss of affective support from loved
ones, as well as problem focused strategies for coping with the loss of physical resources needed to
generate an income, manage the home, and rear the children. Moreover, injuries can add the emotional
strain of reassuring those who have been hurt and the financial strain of their medical care. Similarly,
businesses must cope with the unavailability of trained personnel who might be dead, injured,
overwhelmed with caring for families and friends, or simply trying to find a place for their households to
eat, sleep, and resume a semblance of a normal life.
Disaster recovery also includes actions taken to cope with property damage. Thus, households
must repair minor damage and rebuild substantially damaged property. Businesses and government
agencies repair commercial and industrial structures, critical facilities such as hospitals, police stations
and fire stations, and infrastructure such as water, sewer, electric power, fuel, transportation, and
telecommunications.
Perhaps the most distinctive, but unfortunately elusive, aspect of disaster recovery is the
restoration of disrupted community social routines and economic activities. The process of “getting back
to normal” involves restoring people’s psychological stability, learning positive lessons from the disaster
experience, and restoring satisfying patterns of interaction with family, friends, relatives, neighbors, and
coworkers. It also involves returning to full-time employment that provides at least a preimpact level of
income and reestablishing normal patterns of community governance.
Unfortunately, “normal” is almost inevitably what got the community in trouble in the first place.
When cities allow too much development in floodplains, or in fireprone foothills, or allow substandard
housing to be built that collapses in an earthquake, “normal” is an unsustainable condition. Consequently,
a disaster resilient community learns from its harsh experience which areas of the community have
excessive levels of hazard exposure. It also identifies the types of buildings, infrastructure, and critical
facilities that have inadequate designs, construction methods, and construction materials. Finally, it
recognizes which households, businesses, and government agencies have inadequate resources, lifestyles,
or operational patterns that make them unable to recover effectively from a disaster.
Moreover, a disaster resilient community learns how to use the disaster as a focusing event that
changes people’s beliefs about their hazard vulnerability, the availability of hazard adjustments to reduce
that vulnerability, and the portfolio of hazard adjustments that is likely to be most suitable for their
community. In addition, a disaster resilient community develops effective mechanisms for mobilizing
315
community support to change development policies as well as government capacity and commitment for
implementing those policies effectively.
The Recovery Process
This section begins by examining the most prominent typologies of disaster phases—periods of
time that are characterized by specific types of activities. Next, it describes the typical processes involved
in household and business recovery.
Phases of Disaster Recovery
Researchers have divided disaster recovery into a number of stages, but these definitions vary.
Kates and Pijawka’s (1977) frequently cited four phase model begins with the emergency period, which
lasts for a period that ranges from a few days to a few weeks and encompasses the emergency response
period when the EOP is implemented. Next comes the restoration period, when repairs to utilities are
made, debris is removed, evacuees return, and residential, commercial, and industrial structures are
repaired. This period can take weeks to months. The third phase, the reconstruction replacement period,
involves rebuilding capital stocks and returning the economy to predisaster levels. This period can take
months to years. Finally, there is the development phase, when commemorative structures are built,
memorial dates are institutionalized, and attempts are made to improve the community. Sullivan (2003)
used a similar typology consisting of four “intra-recovery elements”. These include post-impact,
restoration, replacement/reconstruction, and commemorative, betterment, and developmental
reconstruction.
Others have divided the recovery period into somewhat different phases. United Nations Disaster
Relief Organization (UNDRO, 1984) called the period from the disaster impact to Day 5 the immediate
relief period, followed by the rehabilitation (Day 5 to Month 3) and reconstruction (Month 3 onward)
periods. Schwab and his colleagues (1998) adopted a similar three phase typology that broadly
distinguished among emergency response, short term recovery, and long term recovery. Alexander (1993)
described three stages of disaster recovery, with the first, the rehabilitation stage, involving the
continuing care of victims. During the temporary reconstruction stage, temporary bracing is installed for
unstable buildings and bridges and prefabricated or other temporary housing is established. Finally, the
permanent reconstruction stage relies on good administration and management to achieve full community
recovery.
As was the case with conceptualizing emergency management as a sequence of phases—hazard
mitigation, emergency preparedness, emergency response, and disaster recovery—defining disaster
recovery as a sequence of phases is also problematic. Even the early formulations noted that these phases
often overlap in practice, shortening the whole recovery period (Kates, 1977). It is now generally
accepted that disaster recovery encompasses multiple activities, some implemented sequentially and
others implemented simultaneously. At any one time, some households might be engaged in one set of
recovery activities while others are engaged in other recovery activities. Indeed, some households might
be fully recovered months or years after others and there might be households or businesses that never
recover at all. Thus, attempts to define finely differentiated phases of disaster recovery are inherently
limited in their validity. Because of the simple and self explanatory nature of their typology, Schwab and
his colleagues’ (1998) very broad distinctions among emergency response, short term recovery, and long
term recovery will be used to organize the discussion in the rest this chapter. However, the sections that
follow begin with a description of what happens to two basic social units—households and businesses.

316
Facilitating Conditions for Disaster Recovery
Rubin (1991) found that community recovery depends upon a number of variables. Three of these
variables cannot be controlled by local government. These are federal influences and conditions, state
influences and conditions, and community based needs and demands for action. By contrast, local
governments do have some control over personal leadership, ability to act, and knowing what to do. One
important commonality among the 14 cases Rubin, et al. (1985) studied is that the speed, efficiency, and
equity of community recovery depended significantly upon local government’s ability to improvise
effective recovery strategies. That is, communities recovered more quickly and effectively if they could
identify and respond to the specific problems that arose from its unique circumstances.
Rubin and her colleagues’ (Rubin, 1991; Rubin, et al., 1985) research on disaster recovery is
consistent with other researchers’ (see Drabek, 1986; Tierney, et al., 2001) findings on emergency
response in suggesting that disaster recovery will be facilitated if local government agencies anticipate the
most significant recovery demands in terms of their likelihood of occurrence and criticality to the
recovery process. Anticipating recovery demands allows local agencies to plan their organizational
structures and general strategies before disaster impact and improvise their tactics during recovery rather
than improvise the entire recovery effort—organizational structures, strategies, tactics, and operational
procedures—during the midst of the emergency response. Similarly, disaster recovery is facilitated if the
recovery organization identifies the resources it will need, and the sources of those personnel, equipment,
and supplies. Thus, preimpact recovery preparedness will increase emergency managers’ ability to act and
enhance the personal leadership exercised during disaster recovery.
Predisaster planning is an excellent way to direct people’s attention to the demands of disaster
recovery (Schwab, et al., 1998). These scholars view the recovery process as a set of sequenced tasks that
are performed in different locations, rather than distinct phases. There are short term decisions such as
where to locate displaced households and how to remove and dispose of debris. There are also long term
decisions such as how to finance reconstruction, where to allow rebuilding, and how to revitalize the local
economy. According to Schwab, et al. (1998), timely and effective recovery decisions benefit from a
predisaster recovery preparedness process that is undertaken at the same time as emergency preparedness,
comprehensive planning, and mitigation planning (see Figure 11-3).
Developing preimpact plans for disaster recovery allows a community to ensure hazard mitigation
and sustainable development are incorporated into recovery. Preimpact recovery plans can help local
officials resist postimpact pressure to restore their community to the status quo ante that caused the
disaster’s physical and social impacts. By developing disaster resilience, communities can minimize
disaster impacts, strengthen their ability to recover with minimal outside assistance, and facilitate the
recovery of all population segments and economic sectors. These are complex issues that require time and
preparation, both of which are in short supply immediately after a disaster. Preimpact recovery planning
provides an excellent opportunity to incorporate sustainable development goals through a process termed
“holistic disaster recovery” (Natural Hazards Research and Applications Information Center, 2001).
Disaster Recovery Functions
The strategic contingencies involved in the recovery process can be represented in terms of a
network of tasks that need to be performed by community subunits. As Path A in Figure 11-4 indicates,
affected households go through a process that can be described in terms of their movement through
emergency shelter, temporary shelter, temporary housing, and permanent housing (Quarantelli, 1982).

317
Figure 11-3. The Relationship of Disaster Recovery to other Hazard Management Activities.
As Path D indicates, affected businesses pass through a slightly different sequence because they
can suspend operations (represented as a dashed line) until they find a temporary operating location. As
Path B indicates, households and businesses need utilities such as water/wastewater, electric power, fuel,
transportation, and telecommunications before they can resume normal operations. Finally, Path C is
especially important because disaster assessment and a federal disaster declaration are preconditions for
the federal financial aid that the most severely stricken communities need to support the restoration of
public infrastructure and the recovery of households and businesses. To explain this figure more
completely, the following sections examine household recovery, business recovery, infrastructure
restoration, and the disaster declaration process.
Household Recovery
There are three basic components to household recovery. These are housing recovery,
employment recovery, and psychological recovery (Bolin & Trainer, 1978). All three of these
components require resources to recover. However, households must invest time to obtain these
resources. This includes time to find and purchase alternate shelter, clothing, food, furniture, and
appliances to support daily living (Yelvington, 1997). Time is also needed to file insurance claims, apply
for loans and grants, and search for jobs. The time required for these tasks is increased by multiple trips to
obtain required documentation and understaffing of providers (Morrow, 1997). FEMA provides telephone
registration, but its value was undercut by loss of telephone service after Hurricane Andrew. Moreover,
there will be increased commuting time to work, shopping, and services if cars, street signs, traffic
signals, and landmarks are destroyed and no public transit is available for weeks. Adding to the time
burden is increased cost for many items due to supply scarcities. Finally, victims needed skill and self
confidence to cope with the disaster assistance bureaucracy (Morrow, 1997).
Mitigation
Disaster
Comprehensive planning Mitigation planning Recovery planning • Gain support • Organize • Set goals • Develop policies • Begin implementation
Day 0 Day 3 Day 21
Emergency Response
Short –term Recovery
Long-term
Recovery/Reconstruction
Recovery Preparedness
Emergency Preparedness
Adapted from Schwab, et al. (1998)

318
Figure 11-4. The Recovery Management Process.
Housing Recovery
Households typically use four types of housing recovery following a disaster (Quarantelli,
1982a). The first type, emergency shelter, consists of unplanned and spontaneously sought locations that
are intended only to provide protection from the elements, typically open yards and cars after earthquakes
(Bolin & Stanford, 1991, 1998). The second type is temporary shelter, which includes food preparation
and sleeping facilities that usually are sought from friends and relatives or are found in commercial
lodging, although mass care facilities in school gymnasiums or church auditoriums are acceptable as a last
resort. The third type is temporary housing, which allows victims to reestablish household routines in
nonpreferred locations or structures. The last type is permanent housing, which reestablishes household
routines in preferred locations and structures. The process of housing recovery can, in principle, be
described as a stochastic process in which there is a specific probability that a household will move from
one housing type to another in a given period of time (Coleman, 1964). This produces a table in which the
rows indicate the current housing type, the columns indicate the housing type to which households move,
and the cell values are the conditional probabilities of households moving from the row type to the
column type (see Table 11-3). These conditional probabilities are represented by the mathematical
notation P(B│A), where the symbol P (X) indicates the probability of event X, A is the housing type from
which the household moves, B is the housing type to which it moves, and the vertical bar indicates that
this is the probability of a household being in type B, given that it previously was in type A.
Unfortunately, none of the studies of housing recovery following disasters has yet estimated the
transition probabilities associated with this process, but qualitative descriptions of the occupancy levels in
each of Quarantelli’s four housing types suggests that two distinct transition probability matrices
distinguish the first week after a major disaster from later time periods. After a disaster strikes, a
substantial number of households are forced to seek emergency shelter (ES) and in the following days
most of them remain in that type of housing. Thus, according to the hypothetical probabilities in the table,
the probability of remaining in emergency shelter is P(ES│ES) = 0.6). However, a significant proportion
of the households move on to temporary shelter (TS), making P(TS│ES) = 0.4. None of the households is
expected to move directly from emergency shelter to temporary housing (TH) or permanent housing
(PH), so P(TH│ES) = P(PH│ES) = 0.0. In addition, the vast majority of those in temporary shelter
remain in that housing type, so P(TS│TS) = 0.9, but a small fraction of them move to temporary housing,
A
B
Disaster Impact
C
D
Household emergency
shelter
Household temporary
shelter
Household temporary housing
Household permanent
housing
Disaster declaration
Disaster assessment
Federal assistance
Infrastructure restoration
Business temporary operation
Business permanent operation

319
so P(TH│TS) = 0.1. Similarly, the vast majority of those in temporary housing remain in that status
[P(TH│TH) = 0.1], but a small fraction of them move to permanent housing [P(PH│TH) = 0.1]. A small
fraction of those in permanent housing move from that status to emergency shelter or temporary shelter
because of occupants’ fears about structural stability or because building inspections have determined that
the structures are indeed unsafe.
Table 11-3. Hypothetical Daily Housing Status Transition Probabilities.
Week 1 Week 2 and beyond
Emer-gency Shelter
Temp-orary
Shelter
Temp-orary
Housing
Perm-anent
Housing
Emer-gency Shelter
Temp-orary
Shelter
Temp-orary
Housing
Perm-anent
Housing
Emergency
Shelter .60 .40 .00 .00 .50 .50 .00 .00
Temporary
Shelter .00 .90 .10 .00 .00 .90 .10 .00
Temporary
Housing .00 .00 .95 .05 .00 .00 .95 .05
Permanent
Housing .03 .05 .00 .92 .00 .00 .00 1.00
According to these hypothetical probabilities, Weeks 2 and beyond differ from Week 1 in two
respects. First, the rate at which households move from emergency shelter to temporary shelter is higher
in Week 2 than in Week 1. Second, the rates at which households move from permanent housing to
emergency shelter and temporary shelter is lower than in Week 1. These transition probabilities can be
used to generate a distribution over time of the postdisaster housing status of the impact area population
(see Figure 11-5).
This figure shows that the utilization of emergency shelter peaks on the day of the disaster and
declines rapidly thereafter. However, this decrease in the utilization of emergency shelter does not
produce immediate increases in occupancy rates for permanent shelter. Indeed, the proportion of the
affected population in permanent shelter continues to decline because many households must move to this
state through the two intermediate housing types. Thus, the transition probabilities in Table 11-3 result in
the displaced population continuing to rise, reaching a delayed peak some days after impact. These results
are generally consistent with Bolin’s (1993) finding that it took nine days for shelter occupancy to peak
after the Whittier Narrows earthquake. Other support can be found in data from Hurricane Andrew.
Yelvington (1997) reported that temporary shelters experienced increased demand as buildings were
condemned by authorities or landlords begin reconstruction on damaged structures. On 4 September, 10
days after Hurricane Andrew, there were 41 people at Harris Field and 58 people at Florida City. Three
days later the figures were 1125 and 467, respectively. By the end of September, there were more than
4000 people in four tent cities.
Sites for temporary shelter include homes of friends and relatives, commercial facilities such as
hotels and motels, and mass care facilities such as Red Cross shelters. Lindell, et al. (2004) reported that
during Hurricane Lili 3% of evacuees stayed in Red Cross shelters, 30% in hotels and motels, and 53%
with friends and relatives. The percentage staying in shelters averages 15% but ranges from less than 1%
to over 43% (Mileti, et al., 1992). The location where a household seeks temporary shelter is relatively
predictable. Severity of damage and the availability of relatives nearby predict who stays with relatives,
whereas income, homeownership, and availability of relatives nearby predicts who accepts relatives

320
(Morrow, 1997). Moreover, kin networks are likely to seek temporary shelter together, especially if all
relatives became victims because they lived so close together (Yelvington, 1997). Households with higher
incomes who lack nearby friends and relatives with undamaged homes seek commercial facilities,
whereas lower income households in such conditions are forced to accept mass care facilities.
Figure 11-5. Impact Area Residents’ Changes in Housing Status over Time.
Areas with large minority populations can pose problems for disaster assistance administrators
because of their extended households (Bolin, 1993; Yelvington, 1997). Some are multigenerational
(grandparents, parents, and children), whereas others are multinuclear kinship (linked by siblings) or
multinuclear friendship (originating from the same town or province). These complex household
structures create problems in identifying a single head of household to whom an assistance check can be
issued. In addition to the normal reluctance to seek mass shelter and housing, some victims hesitate to
approach authorities because they have no immigration documents (Yelvington, 1997).
Similarly, sites for temporary housing include homes of friends and relatives, commercial
facilities such as rental houses and apartments, and mass facilities such as trailer parks. Some of these
sites are in or near the stricken community, but others are hundreds or even thousands of miles away.
Lack of alternative housing within an acceptable distance of jobs or peers led some households to leave
the Miami area after Hurricane Andrew. The population loss was 18% in South Dade County, 33% in
Florida City, and 31% in Homestead (Dash, Peacock & Morrow, 1997). Other households remained in
severely damaged units—or even condemned units—without electric power or telephone service for
months (Yelvington, 1997) or doubled up with relatives (Morrow, 1997).
The loss of housing in a disaster can be extremely problematic in a tight housing market. After
Hurricane Andrew, housing availability dropped to 1.6% from 5.5% a year earlier. This shortage
increased rents by 15-20%, which priced low income victims out of the market (Yelvington, 1997). Even
when temporary housing can be found, the return to permanent housing can be long. In one working class
neighborhood, the average length of displacement was 95 days and the percentage of returnees was still
only 62% nearly a year after the disaster (Morrow, 1997).
Households encounter many problems during reconstruction, including high prices for repairs,
poor quality work, and contract breaches (Bolin, 1993). The rebuilt structures do benefit from improved
0%
20%
40%
60%
80%
100%
-1 2 5 8 11 14 17 20 24 27 30
Time (days)
Percent of Population
Permanent Housing
Temporary Housing
Temporary Shelter
Emergency Shelter
Pe
rce
nta
ge
of
ho
use
ho
lds

321
quality and hazard resistance (Bolin, 1993, indicates 50% of respondents reported this) and this is
especially true for public housing (Morrow, 1997). However, few victims think the improvements are
worth the inconvenience they experienced.
As noted in Chapter 6, lower income households tend to have higher hazard exposure because
they live in more hazard prone locations. They also have higher physical vulnerability because they live
in structures that were built according to older, less stringent building codes, used lower quality
construction materials and methods, and have been less well maintained (Bolin & Bolton, 1986). Because
lower income households have fewer resources on which to draw for recovery, they also take longer to
return to permanent housing, sometimes remaining for extended periods of time in severely damaged
homes (Girard & Peacock, 1997). Indeed, they sometimes are forced to accept as permanent what
originally was intended as temporary housing (Peacock, et al., 1987). Consequently, there might still be
low income households in temporary sheltering and temporary housing even after high income
households all have relocated to permanent housing (Berke, et al., 1993; Rubin, et al., 1985).
Employment Recovery
Insurance coverage varies by hazard agent, with Bolin and Bolton (1986) reporting 86% coverage
for a tornado and Bolin (1993) reporting 25% for an earthquake. Risk area residents are particularly likely
to forego earthquake insurance because they consider premiums to be too high and deductibles too large
(Palm, et al., 1990). Income, education, and occupational status all correlate with earthquake insurance
purchase (Bolin, 1993).
Strategies for coping with uninsured losses include obtaining SBA or commercial loans,
obtaining FEMA or NGO grants, withdrawing savings, and deciding not to replace damaged items (Bolin,
1993). SBA loans can be problematic because they involve long term debt that takes many years to repay
(Bolin, 1993). FEMA grants require households to meet specific standards, including proof that they are
indeed residents of the disaster impact area. However, there can be problems in registering people who
evacuated or were rescued without identification (Yelvington, 1997). Relaxed standards seem humane but
can allow the chronically homeless and out of area construction workers to obtain access to services
intended only for disaster victims. In turn, resentment toward “freeloaders” can curtail services to victims.
Some households’ economic recovery takes place quickly, but others’ takes much longer. For
example, the percentage of households reporting complete economic recovery after the Whittier
earthquake was 50% at the end of the first year but 21% reported little of no recovery even at the end of
four years (Bolin, 1993). Economic recovery was positively related to household income and negatively
related to structural damage, household size, and the total number of moves (Bolin, 1993). In some cases,
this is due to the loss of permanent jobs that are replaced only by temporary jobs in temporary shelter
management, debris cleanup, and construction—or are not replaced at all (Yelvington, 1997).
There are systematic differences in the rate of economic recovery among ethnic groups. For
example, Bolin and Bolton (1986) found that Black households (30%) lagged behind Whites (51%) in
their return to preimpact economic conditions eight months after the 1982 Paris, Texas, tornado.
However, the variables affecting economic recovery were relatively similar for Black and White families
(see Figure 11-6). In both ethnic groups, economic recovery was negatively related to family size (larger
families had lower levels of recovery), but positively related to socioeconomic status (SES—education,
profession, and income), use of disaster assistance, insurance adequacy, and aid adequacy. In addition,
Black household recovery was negatively related to primary group aid and the number of household
moves. The direct effect of family size and SES on economic recovery was compounded by the indirect

322
effects of these variables via their impacts on the use of disaster assistance, insurance adequacy, aid
adequacy, and household moves. The variables that had positive direct effects on economic recovery (use
of disaster assistance, insurance adequacy, aid adequacy) were negatively related to family size and
positively related to SES. That is, larger households were less likely—and higher SES households were
more likely—to use disaster assistance, have adequate insurance, or receive adequate aid. Moreover, these
variables were positively related to family size and negatively related to SES. That is, larger households
made more moves and higher SES households made fewer moves. The overall effect of this complex
pattern of relationships is for large poor households to be doubly handicapped in their economic recovery.
Figure 11-6. Patterns of Household Economic Recovery.
Source: Bolin and Bolton (1986)
Psychological Recovery
Few victims develop major psychological problems from disaster impacts. Indeed, Gerrity and
Flynn (1997, p. 108) proposed “the overarching principle of mental health services after disasters is that
the recipients of services are normal people, responding normally, to a very abnormal situation.”
Consequently, the vast majority of disaster victims experience mild psychological distress. For example,
Bolin and Bolton (1986) found negative impacts such as upsets with storms (61%), time pressures (48%),
lack of patience (38%), and strained family relationships (31%) after the Paris Texas tornado. However,
victims also experienced positive impacts including strengthened family relationships (91%), decreased
importance of material possessions (62%), and increased family happiness (23%). The data showed only
minor differences between Blacks and Whites in the prevalence of psychosocial impacts.
Similarly, roughly 35% of affected households reported one or more symptoms of psychological
distress attributable to the Whittier earthquake (Bolin, 1993). These included startle response (60%),
sadness (38%), avoidant thinking (36%), vivid upsetting memories (33%), unexplained agitation (29%),
social isolation (25%), bad dreams (20%), and sleep disturbances (15%). Degree of emotional recovery
was positively related to age, male gender, previous disaster experience, social integration, and receipt of
aid from primary groups.
Family size (- for all variables but
Household moves)
Socioeconomic status (+ for all variables but
Household moves)
Aid adequacy (+)
Use of disaster assistance (+)
Primary group aid (- Blacks only)
Insurance
adequacy (+)
Household economic recovery
Household moves (- Blacks only)

323
Researchers have also examined public records in their search for psychological impacts of
disasters. For example, Morrow’s (1997) examination of vital statistics (births, marriages, deaths, and
divorce applications) had no significant long term trends due to Hurricane Andrew. However, domestic
violence rates remained constant for about six months after the hurricane but increased about 50% for
nearly two years after that. In all, only 12% of the households affected by Hurricane Andrew expressed a
need for counseling (Morrow, 1997). After the Whittier earthquake, Disaster Assistance Centers referred
only 5% of victims to mental health counseling (Bolin, 1993). The effects most of these victims have
experienced are usually not debilitating but are, rather, part of the normal process of grieving people use
to understand and assimilate important, traumatic events. Moreover, victims accumulate many minor and
major frustrations throughout the disaster recovery. This is especially true for those who must interact
repeatedly with public (governmental) and private (e.g., insurance companies) bureaucracies.
Nonetheless, there are especially vulnerable groups that might need extra attention if they show
signs of long standing problems due to the disaster. It should be obvious that people with preexisting
mental conditions are likely to need postdisaster psychological support. Moreover, victims who have
witnessed the death or severe injury of loved ones should have professional psychological services
available (Perry & Lindell, 1978). Single female heads of household experienced extremely high levels of
stress in their relationships with significant others, children, and relatives and friends (Morrow, 1997). In
a community where the schools were on half day sessions, children in one third of families displayed
behavioral problems (Morrow, 1997). Moreover, approximately 50% of children displayed symptoms of
moderate to severe PTSD after Hurricane Andrew (Vernberg, LaGreca, Silverman & Prinstein, 1996).
Finally, professionals involved in particularly difficult search operations and medical personnel who
handle extraordinary work loads during disaster periods might also benefit from postdisaster counseling.
In summary, the majority of victims and responders recover relatively quickly from the stress of
disasters without psychological interventions. Those who suffer the greatest losses to their material
resources (e.g., the destruction of their homes) and their social networks (e.g., spouses and other family
members) are likely to experience the most psychological distress, but not necessarily an amount that is
personally unmanageable. Thus, the appropriate strategy for psychological recovery by victims and first
responders seems to be one of minimal intervention to provide information about sources of material
support (for victims) and to facilitate optional involvement in social and emotional support groups (for
victims and first responders).
Sources of household recovery assistance. Household recovery can also be defined in terms of the
sources of assistance. Bolin and Trainer (1978) defined these sources as the family structure (stage in the
family lifecycle) and resources (socioeconomic status), the kinship network (cohesiveness), and the
community resource (financial, human, and material resources) and normative (beliefs about appropriate
policies for distributing postdisaster aid) structure. The extent to which households rely on one or another
of these sources of recovery assistance defines their mode of recovery as autonomous, kinship, or
institutional—although few households actually rely on only one source.
Autonomous recovery depends on the household’s available human, material, and financial
resources. Human resources are available to the extent the household members have come through the
disaster alive, uninjured, and with a sense of optimism that they can recover. Household recovery also
depends on the degree to which members can continue to derive generate income from employment,
rental of physical assets, or interest/dividends from financial assets. Moreover, household recovery
depends on the degree to which material resources are available. This includes the extent to which its

324
possessions—land, buildings, equipment, furniture, clothes, vehicles, crops, and animals—are undamaged
or can be restored at reasonable expense. A household’s recovery also depends on the degree to which its
financial resources are available. This includes an ability to withdraw savings quickly from banks, to
quickly liquidate stocks and bonds at a fair price, and to receive adequate compensation from its insurer.
In some cases, household recovery also depends on the degree to which creditors will accept delayed
payments on financial liabilities such as loans, mortgages, and credit card debt. Finally, household
recovery depends on the degree to which members can reduce consumption such as purchases of shelter,
food, clothing, medical care, entertainment, and other goods and services).
Kinship recovery depends on the physical proximity of other nuclear families in the kin network,
the closeness of the psychological ties within the network, the assets of the other families and, of course,
the extent to which those families also suffered losses. Institutional recovery quite obviously depends on
whether victims meet the qualification standards, usually documented residence in the impact area and
proof of loss. However, institutional recovery depends more subtly on households’ ability to devote the
time and effort required to travel to assistance centers and wait to process any applications, the
availability of transportation and child care needed to free that time from other activities, and the ability to
fill out the paperwork and cope with the impersonal bureaucratic requirements of the recovery system.
Some aspects of household recovery are relatively similar across ethnic groups, but others reveal
distinct differences. For example, Table 11-4 shows Anglos, Blacks, and Hispanics experienced similar
levels of frustration in coping with the challenges of living in damaged homes, job relocation, dealing
with agencies, behavioral problems with children, and loss of household members. However, most of
these commonalities were for relatively infrequently experienced problems (the ones listed at the bottom
of the table). By contrast, there were significant differences in the experience of other problems, many of
which were frequently experienced. For some problems, the Anglos reported the greatest frequency of
frustration, whereas for other problems it was Hispanics experiencing the greatest frustrations. In general,
Blacks had the highest level of frustration with more problems than either of the other two groups.
Business Recovery
Several studies of the economic impacts of environmental disasters have examined the ways in
which individual businesses prepare for, are disrupted by, and recover from these events. Dahlhamer and
D’Souza (1997), Dahlhamer and Reshaur (1996), Drabek (1991c, 1995), Lindell and Perry (1998),
Tierney (1997a, 1997b), Tierney and Dahlhamer (1998), and Whitney, et al. (2001) studied the adoption
of hazard adjustment (hazard mitigation, emergency preparedness, and disaster recovery preparedness)
measures for environmental hazards. These studies found older, larger (measured by the number of
employees), and more financially stable businesses are more likely to adopt hazard adjustments, as are
businesses in the manufacturing, professional services, and finance, insurance and real estate sectors.
These studies have found disasters disrupt business operations through a variety of mechanisms
(Alesch, et al., 1993; Kroll, et al., 1990; Tierney, 1997b; Tierney & Nigg, 1995; Webb, et al., 2000).
Direct physical damage to buildings, equipment, vehicles, and inventories has obvious effects on business
operations. However, it might be less obvious that disruption of infrastructure such as water/sewer,
electric power, fuel, transportation, and telecommunications frequently forces businesses to shut down in
the aftermath of a disaster. For example, Tierney (1997b) reported that extensive lifeline service
interruption after the 1993 Midwest floods caused a large number of business closures in Des Moines,
Iowa, even though the physical damage was confined to a relatively small area.

325
Table 11-4. Household Recovery Problems, by Ethnic Group.
Problem Perceived To Be Large Anglo Black Hispanic Total
Dealing with mortgage companies about insurance money 68 49 68 64*
Dealing with building inspectors 52 38 76 63*
Living in damaged home 59 63 59 60
Neighborhood conditions 55 60 39 47*
Living in temporary quarters 45 61 38 46*
Dealing with insurance companies 33 26 48 40*
Dealing with contractors 38 18 45 37*
Unemployment 11 29 30 25*
Household finances 14 40 20 22*
Neighborhood crime 34 23 16 22*
Transportation 2 28 17 16*
Job relocation 7 21 17 15
Dealing with agencies 11 20 13 15
Behavioral problems with children 19 18 10 14
Family violence 17 11 5 9*
Gain of member(s) 14 0 4 5*
Loss of member(s) 4 0 13 4
Source: Morrow (1997) Difference between highest and lowest percentage significant at p < .05.
Small businesses are more physically vulnerable because they are more likely than large
businesses to be located in nonengineered buildings and are less likely to have the capacity to design and
implement hazard management programs to reduce this physical vulnerability. Thus, in this respect, small
businesses are equivalent to the most physically vulnerable households—ones that are poor, female
headed, or members of ethnic minorities. At the same time as they face increased costs to repair structures
and replace contents, these businesses also face reduced patronage if they must move far from their
previous locations. Three years after the Whittier earthquake, 50% of destroyed commercial space and
100% of damaged commercial space had been replaced (Bolin, 1993). In the meantime, however, a
number of businesses in the old central business district—predominantly located in unreinforced masonry
structures—were forced to relocate. Because Whittier is located within the Los Angeles metropolitan
area, local residents could readily obtain the goods and services they needed from undamaged businesses
in adjacent communities. Thus, by the time the space is available for reoccupancy, it must be leased to
new tenants because the old ones did not have the resources to wait that long.
Perhaps the least obvious effects of disaster impact are population dislocation, losses in
discretionary income among those victims who remain in the impact area—which can weaken market
demand for many products and services—and competitive pressure from large outside businesses. All of
these indirect effects cause small local businesses to experience a high rate of failure in the aftermath of a
disaster (Alesch & Holly, 1996; Alesch, Holly, Mittler & Nagy, 2001). Indeed, these factors can produce
business failures long after the precipitating event, especially if the community was already in economic
decline before the event (Bates & Peacock, 1993; Durkin, 1984; Webb, et al., 2002). Thus, businesses that
were marginally profitable before a disaster strikes are more likely to close immediately after the event.
There also is variation among business sectors in their patterns of recovery. Whereas wholesale
and retail businesses generally report experiencing significant sales losses, manufacturing and
construction companies often show gains following a disaster (Durkin, 1984; Kroll, et al., 1990; Webb, et
326
al., 2000). Moreover, businesses that serve a large (e.g. regional or international) market tend to recover
more rapidly than those that only serve local markets (Webb, et al., 2002). Small businesses, in particular,
have been found to experience more obstacles than large firms and chains in their attempts to regain their
predisaster levels of operations. Compared to their large counterparts, small firms are more likely to
depend primarily on neighborhood customers, lack the financial resources needed for recovery, and lack
access to governmental recovery programs (Alesch & Holly, 1996; Alesch, et al., 2001; Dahlhamer &
Tierney, 1998; Durkin, 1984; Kroll, et al., 1990). Thus, business sector and business size can be seen as
indicators of operational vulnerability that are equivalent to the demographic indicators of social
vulnerability in households.
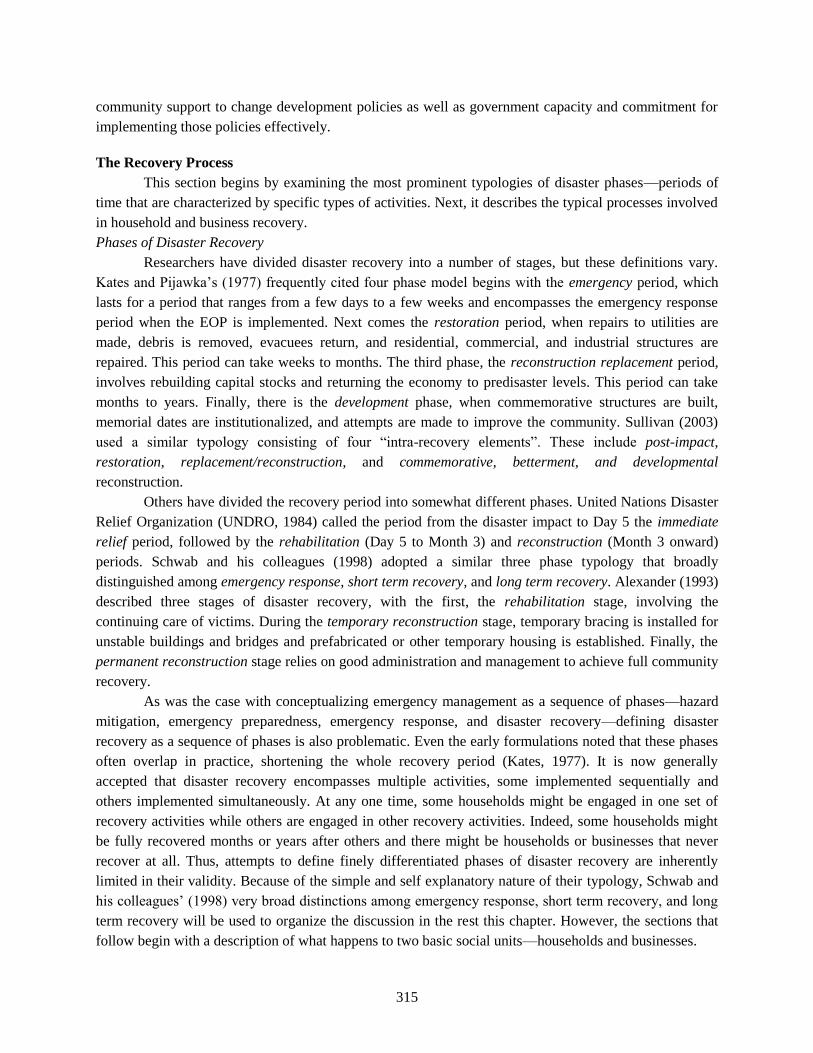
Businesses’ hazard vulnerability explains the changes a disaster causes in businesses’ production,
sales, and profits and, thus, the dynamics of business recovery. In particular, four cases can be used to
illustrate firms’ variation in their postdisaster sales levels (Zhang, Lindell & Prater, 2004). According to
Figure 11-7, gains and losses in sales (the vertical axis) over time (the horizontal axis) are defined by the
area enclosed within the (vertical) disaster line, the (horizontal) predisaster sales level, and the (diagonal)
recovery curve. Gains are represented by the size of the area above the predisaster sales level and losses
are represented by the size of the area below the predisaster sales level (the shaded area in each panel).
Figure 11-7. Patterns of Business Sales Changes after Environmental Disasters.
Source: Zhang, et al. (2004)
Panel a Panel b
Panel c Panel d
Sales
Pre-disaster sales level
Time Disaster
0%
100%
Sales
Pre-disaster sales level
Time Disaster
0%
100%
Sales
Pre-disaster sales level
Time Disaster
0%
100%
Time Disaster
Sales
Pre-disaster sales level
0%
100%

327
The first case is defined by businesses in the impact area that have minimal hazard vulnerability.
Such businesses—professional services are an example—experience only small decreases in sales after
disaster impact and return quickly to their predisaster levels (Figure 11-7a). The second case consists of
businesses that also are in the impact area, but have moderate vulnerability. Such businesses—large
manufacturers, for example—experience a larger initial drop in their sales levels and their recovery takes
a longer time (Figure 11-7b). Tourism oriented businesses may also suffer initial losses and take some
time to recover to their prior level of profitability because they may be stigmatized in the aftermath of a
disaster and can take several seasons to shed the image of danger and destruction.
By contrast, the third case consists of businesses that experience initial sales losses because they
are inside (thus experiencing direct losses) or near (thus experiencing indirect losses) the impact area.
However, they later experience an increase in demand for their products/services during disaster
aftermath (Figure 11-7c). Recovery–related businesses in the building construction, construction
materials, and hospitality (e.g., hotels and restaurants) industries exemplify a pattern in which an initial
loss (e.g., due to minor damage or infrastructure disruption) is rapidly restored and followed by increased
sales. The final case describes recovery related businesses that are just outside the impact area. Not only
do they avoid any initial losses, but they also can take advantage of expanded demand in the disaster
stricken community and reap gains in the aftermath of the disaster (Figure 11-7d).
Although the available data are limited, some of these principles are revealed in data from
business recovery in two communities affected by Hurricane Andrew (Dash, et al., 1997). Homestead had
a larger population, a higher per capita income, and a higher average home value than Florida City.
Homestead was 42% Anglo and 35% Hispanic, whereas Florida City was 61% Black and 37% Hispanic.
Even though Florida City is slightly farther from the point at which the hurricane eye made landfall, there
was essentially no initial difference in the hurricane’s impact on the two city’s businesses. The overall
commercial property loss after the hurricane was 29% in Homestead and 32% in Florida City. However,
Table 11-5 describes the business impacts of the hurricane in terms of the changes in the number of
businesses, number of employees, and sales volume in each of the industries operating in these cities.
Overall, there were significant differences in the two communities over the next year. For
example, total sales volume declined 83% in Florida City but only 1.1% in Homestead. However,
inspection of Table 11-5 reveals that there are distinct differences from one industry to another and the
magnitude of the impact depends on whether one examines the change in the number of businesses, the
number of employees, or sales volume. For example, Florida City shows dramatic declines for agriculture
on all three indicators but no change or even modest increases in construction. By contrast, Homestead
showed a slight increase in the number of agricultural businesses, but significant increases in the number
of agricultural jobs and sales volume. Moreover, it experienced significant declines for all three indicators
in construction—almost the opposite pattern of Florida City. These differences in business impacts
indicate local authorities should carefully assess the businesses in their communities before a disaster
strikes and monitor their economic viability in the disaster’s aftermath to determine if government
intervention is needed.
The Role of State and Federal Governments
State and federal agencies can play significant roles in disaster recovery, but the burden most
frequently falls on local governments because only about 19% of all disasters receive state disaster
declarations and 1% qualify for Presidential Disaster Declarations (PDDs). Thus, local governments

328
should prepare to undertake a variety of functions during a disaster recovery process, understanding that
they might not receive any aid from higher levels of government for minor disasters. The main factor
affecting the level of involvement of state and federal government is the scope of the event. After a major
disaster, a PDD opens a broad range of programs for relief and reconstruction. In such cases, the state
plays a coordinating role, working with both federal and local governments. Moreover, disaster response
might be mostly over before the PDD is granted, but federal assistance is certainly welcome when it
finally arrives. The Recovery Function Annex of the National Response Plan of January 2003, available
on the DHS Web site (www.dhs.gov/dhspublic/), lists 71 federal disaster recovery programs that are
administered directly by the DHS or by dozens of other federal and volunteer organizations. The
following discussion is not exhaustive, but gives an overview of some of the key programs.
Table 11-5. Changes in the Number of Businesses, Employees, and Sales Volume after Hurricane
Andrew.
Businesses Change (%) Employees Change (%) Sales Volume Change (%)
Industry Florida City Homestead Florida City Homestead Florida City Homestead
Agriculture -71 +4 -92 +74 -93 +66
Construction 0 -20 +12 -20 +12 -59
Manufacturing 0 -12 -67 -19 -59 -32
Transportation/
communication
-50 +9 -100 +4 -26 +51
Wholesale trade -60 -4 -50 +6 -84 +57
Retail trade -64 -2 -84 +16 -84 -5
Finance/
insurance/real estate
-20 0 -59 -1 -32 -32
Business services -63 +6 -94 -5 -65 -14
Professional services -45 -3 -73 +16 -69 +1
Public administration -50 +38 -69 +7 n/a* n/a*
Source: Dash, et al. (1997), Sales volume is not applicable to public sector organizations.
The lead agency at the federal level is FEMA, renamed the Emergency Preparedness and
Response Directorate when it was placed in the new Department of Homeland Security in 2002. Other
federal agencies might be called upon when a PDD is granted, including the Small Business
Administration, the US Army Corps of Engineers, the Department of Housing and Urban Development,
the National Oceanographic and Atmospheric Administration, and the Economic Development
Administration, among others. Each of these agencies funds specific disaster recovery programs.
The National Response Plan provides for the establishment of Disaster Field Offices (DFOs) in
the vicinity of the disaster. Emergency Response Teams (ERTs) are located in the DFOs. These include
an Operations Section that coordinates federal, state, and voluntary efforts. The ERT Operations Section
has a Human Services Branch that is responsible for many tasks including needs assessment;
establishment of Disaster Recovery Centers; initiation, coordination, and delivery of recovery programs
authorized by the Stafford Act; and managing DHS and state grant programs. Finally, there is an
Infrastructure Support Branch to facilitate restoration of public utilities and other infrastructure services.
There is also a Deputy Field Coordinating Officer for Mitigation who coordinates with the Infrastructure
Support Branch and otherwise promotes mitigation and preparedness activities.
329
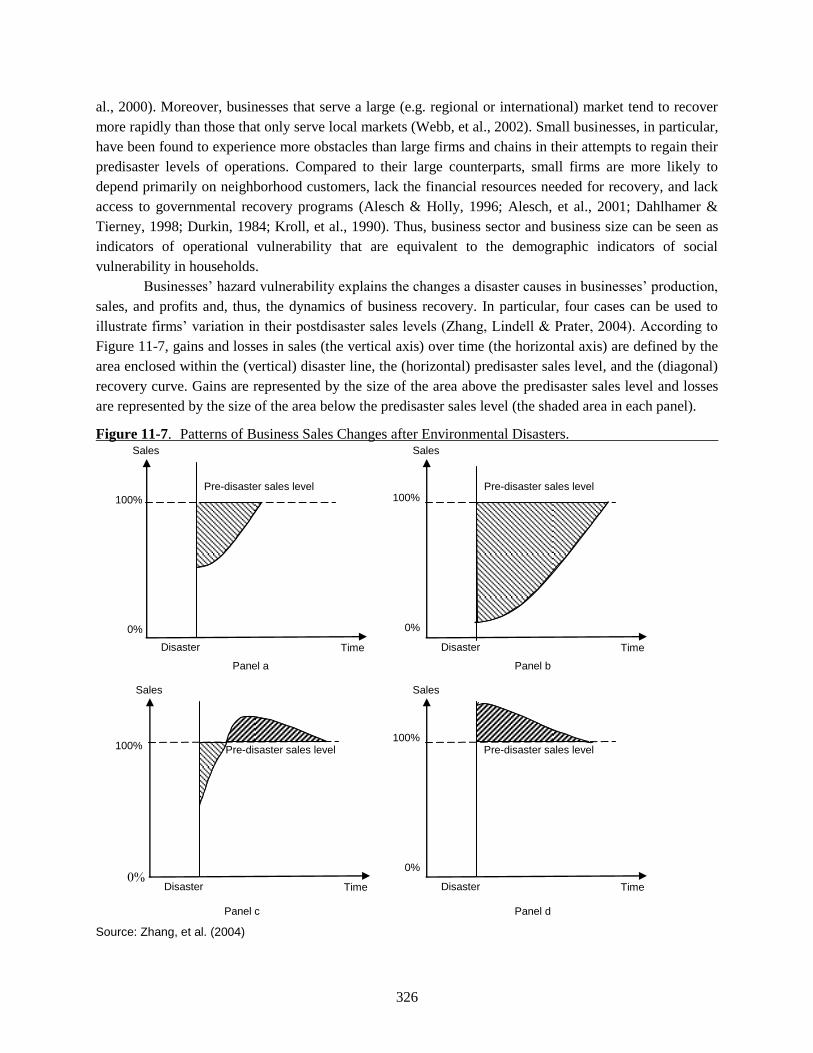
The main types of programs providing recovery assistance are Individual Assistance,
Infrastructure Support (formerly Public Assistance), and Hazard Mitigation Grant Program. Individual
Assistance is available to households through the Temporary Housing Assistance program, Individual and
Family Grants, Disaster Unemployment assistance, legal services, special tax considerations, and crisis
counseling programs. Individuals and businesses can receive aid through the Small Business
Administration Disaster Loans program, which can provide loans for repairs to housing and businesses,
and also for operating expenses. In the past, many loan programs have been inaccessible to low income
households, which tend to rent rather than own their housing. Thus, they failed to qualify for loans
because of their low incomes and lack of collateral. The Individual and Family Grant Program was
intended to fill the need for a program targeting those whose needs were not being met by the SBA loan
program, private insurance, or NGO assistance. However, the amounts awarded tend to be small.
Public Assistance programs offered through the Infrastructure Support Branch are targeted at
state and local governments, certain nonprofit organizations that provide emergency services, and Indian
tribes. These programs provide funds for the repair or replacement of public facilities damaged by
disaster. They may be classified as Emergency Work under Category A (Debris Removal) or Category B
(Emergency Protective Measures) or Permanent Work, under Category C (Roads and Bridges), Category
D (Water Control Facilities), Category E (Buildings and Equipment), Category F (Utilities), or Category
G (Parks, Recreational Facilities, and Other Items).
Assistance provided under the Hazard Mitigation Grant Program has increased in importance
since the passage of the Disaster Mitigation Act of 2000. This legislation requires local governments to
identify potential mitigation measures that could be incorporated into the repair of damaged facilities in
order to be eligible for pre- and postdisaster funding. This policy represents a significant shift from
previous FEMA policies that inhibited the implementation of mitigation measures because repairs were
only funded to the level of predisaster conditions. The recent shift is putting more emphasis on activities
eligible under Section 406 of the Stafford Act, known as 406 mitigation. These activities include hazard
mapping, mitigation planning, development of building codes, development of training and public
education programs, establishing Reconstruction Information Centers, and assisting communities to
promote sustainable development.
State governments vary widely in the level of attention and resources they devote to planning for
and implementing disaster recovery. Some states have established programs providing assistance to
households and local governments for recovery from disasters that do not receive a PDD. In order to
support these programs, some states have created state disaster funds and designated several state level
departments to provide resources and expertise that are available during recovery. One example is a state
planning or community development department, which can provide data or guidance on integration of
sustainable development and recovery. Other examples are state environment departments, which might
have coastal management programs or water quality programs, and state economic development agencies,
which might administer Community Development Block Grants that can fund repairs to low income
housing.
States can fund their programs through the creation of state disaster funds, but only about half of
the states have done so. Typically, state legislatures have appropriated funds after disasters on the basis of
need. Another type of disaster fund is a disaster trust fund, which creates revenue by dedicating a
percentage of sales taxes or other revenues to the fund. For a more detailed discussion of federal and state
disaster recovery programs, see Smith (2004).

330
The Role of Hazard Insurance
As noted in Chapter 7, hazard insurance is a preimpact recovery preparedness action. As such, it
has the potential for completely replacing current programs of disaster relief. In addition, hazard
insurance decreases government workload and expense after disasters by shifting part of the
administrative burden for evaluating damage to insurance companies in the private sector. Finally, hazard
insurance defines the terms of coverage in advance, thus reducing opportunities for politicians to increase
benefits after disaster. The desire to appear to be generous creates a temptation to vote for “pork barrel”
projects. The problem is that generous aid for uninsured victims angers those who had the foresight to
purchase insurance in advance and, thus, provides a disincentive to purchase insurance in the future.
Unfortunately, the potential contribution of hazard insurance remains to be fully realized. There
are many difficulties in developing and maintaining an actuarially sound hazard insurance program. The
National Flood Insurance Program has made significant strides over the past 30 years, but it continues to
require operational subsidies. One of the basic problems is that those who are most likely to purchase
flood insurance are, in fact, those who are most likely to file claims (Kunreuther, 1998). This problem of
adverse selection makes it impossible to sustain a market in private flood insurance. The federal
government has tried to solve this problem by requiring flood insurance for structures located in the 100
year flood plain that are purchased with federally backed mortgages. Unfortunately, homeowners
frequently allow their policies to lapse after the first year and the program has no effect on those who
purchase their homes without a mortgage or have paid off their mortgages. Consequently, some homes
are rebuilt soon after a disaster because their owners have high quality insurance coverage, whereas other
homes take much longer because they are only partially insured. In some cases, the homeowners lack any
insurance because they cannot afford quality insurance or were denied access to it because of “redlining”
(Peacock & Girard, 1997).
In addition to these institutional problems, there are cognitive obstacles to developing a
comprehensive hazard insurance program. Building on earlier hazards research (see Burton, et al., 1993,
for a summary) and psychological research on judgment and decisionmaking (see Slovic, et al., 1974, for
an early statement and Baron, 2000, or Gilovich, Griffin & Kahneman, 2002, for more recent summaries),
researchers have identified numerous logical deficiencies in the ways people process information in
laboratory studies of risk.
One important issue concerns what economists call moral hazard and psychologists refer to as a
felt lack of personal responsibility for protection. The concept of moral hazard/felt responsibility for
personal protection has important policy implications because the Interagency Floodplain Management
Review Committee (1994) report concluded federal disaster relief policy creates this condition by
relieving households of the responsibility for providing their own disaster recovery resources. This might
be a significant reason why only 20% of structures affected by the 1993 Mississippi floods were insured.
However, there appears to be no data on the extent to which households explicitly consider the
availability of disaster relief in making decisions about whether to purchase hazard insurance and adopt
other hazard adjustments.
Non Governmental Organizations and Community Based Organizations
The role of NGOs such as the American Red Cross, Salvation Army, and Mennonite Disaster
Service is widely publicized and the role of CBOs such as local churches and service organizations is
increasingly recognized. These organizations provide housing, food, clothing, medicine, and financial

331
assistance to disaster victims. In most cases, the existing government social service agencies are
supplemented by NGOs that expand their membership to perform the tasks they are expected to perform
during disaster recovery (Dynes, 1970). By contrast, existing CBOs typically extend themselves beyond
their normal tasks to perform novel activities. In addition, there are situations in which existing,
expanding, and extending organizations cannot successfully meet the recovery needs of disaster victims.
In such cases, government agencies, NGOs, and CBOs form an Unmet Needs Committee, which is an
emergent organization that is designed to serve those whose needs are not being addressed by existing
programs.
In some cases, the need for such emergent organizations arises from political organization and
activism by population segments that believe they are being neglected (Morrow & Peacock, 1997;
Phillips, 1993a). Local authorities should anticipate recovery demands, plan for an Unmet Needs
Committee, and communicate its existence throughout the community. When emergent organizations do
arise, they can be incorporated into the ongoing recovery management process in order to learn from their
knowledge about the unmet needs and ensure that there is an equitable distribution of disaster recovery
resources. For a more detailed discussion of NGO activities in disaster recovery, see Smith (2004).
Local Government Recovery Functions
After a disaster, local government needs to perform many tasks very quickly, and many of these
must be performed simultaneously. It is therefore critical to plan for disaster recovery, as well as for
disaster response (Schwab, et al., 1998). The line between emergency response and disaster recovery is
not clear because some sectors of the community might be in response mode while others are moving into
recovery, and some organizations will be carrying on both types of activity at the same time. This means
that there will be little time to plan for disaster recovery once the emergency response has begun. By
planning for recovery before disaster strikes, resources can be allocated more effectively and efficiently,
increasing the probability of a rapid and full recovery. The following discussion is based on the concept
of preimpact planning for disaster recovery because a lack of planning will delay decisions about the
allocation of recovery resources and the procedures by which they will be used. A lack of preimpact
planning can also increase the probability of conflicts arising due to competition over scarce resources
during the recovery period.
The previous sections of this chapter have described the tasks that households and businesses
perform during disaster recovery and the resources they use to implement this recovery. When households
and businesses lack the knowledge of how to recover or the resources needed to recover, government can
provide assistance. Local government must also perform specific tasks during disaster recovery, some of
which involve restoring services it performed before the disaster (e.g., providing functioning roads, street
lights and signs, and traffic control devices). In addition, local government must rebuild any critical
facilities (e.g., police and fire stations) that were damaged or destroyed. Finally, local government has a
heightened need to perform its regulatory functions regarding land use and building construction. These
two functions require rapid action under conditions of a greatly multiplied workload, so special provisions
are required to expedite the procedures for reviewing and approving the (re)development of private
property.
In approaching the task of preimpact recovery planning, a community must overcome three major
misconceptions about disaster recovery. The first misconception is that the entire recovery effort can be
improvised after the emergency response is complete. In fact, a timely and effective disaster recovery

332
requires a significant amount of data collection and planning that will delay the recovery if they are
postponed until after the emergency response is over. It is important to recognize that the disaster
response phase’s uncertainty and urgency about human safety has been replaced by households’ and
businesses’ urgency to return to normal patterns of functioning and government agencies’ uncertainty
about how to organize the community to accomplish this.
The second misconception is that there will be ample time to collect data and plan the recovery
during the emergency response. It is true that some recovery relevant data must be collected during the
emergency response. However, an assessment of “lessons learned” from the disaster impact should be
used to guide a recovery process that has been designed before the disaster strikes. Finally, the third
misconception is that the objective of disaster recovery should be to restore the community to the
conditions that existed before the disaster. As noted earlier, this will simply reproduce the community’s
existing disaster vulnerability.
In many ways, the process of preparedness for disaster recovery is quite similar to the process of
preparedness for emergency response. Thus, the community should establish a Recovery/Mitigation
Committee before disaster strikes that will establish a vision of community disaster recovery and
articulate the basic strategies that will be implemented before and after disaster impact. In addition, the
committee should assign each recovery function to a specific organization, develop a Recovery
Operations Plan (ROP), and acquire any necessary resources to implement it. Finally, the committee
should conduct the training and tabletop exercises needed to ensure the ROP can be implemented
effectively.
The Recovery/Mitigation Committee
The LEMC’s Recovery/Mitigation Committee can be an important part of an effective, rapid
disaster recovery process. As noted in Chapter 3, this committee should be established before a disaster
during the preimpact recovery planning process. Personnel should be designated to serve on this
committee, including a chairperson and a lead agency, usually the local planning department. The
jurisdiction’s Chief Administrative Officer, usually the city mayor or the county executive, should publish
a planning directive, and the Recovery/Mitigation Committee chairperson should establish a planning
schedule. Many government agencies should participate in the Recovery/Mitigation Committee, including
the directors of the local planning, building, public works, engineering, parks and recreation, economic
development, finance, housing, and social services departments, as well as the jurisdiction’s PIO
(Schwab, et al., 1998). In addition, there should be representatives from local utility companies, other
local business organizations, religious and charitable organizations, and representatives of neighborhood
associations.
The Recovery/Mitigation Committee should examine the findings from the community HVA to
identify the locations having the highest levels of hazard exposure, physical vulnerability, and social
vulnerability. The committee should begin to work with the rest of the community, and especially with
those at greatest risk, to formulate a vision of the disaster recovery it intends to implement.
Next, the committee should develop an ROP that integrates the likely disaster impacts,
community goals, and public and private sector capabilities within the community. In addition, the ROP
should identify external sources of assistance (federal, state, NGO), recognize their loan/grant
requirements, and integrate these into a comprehensive program of disaster assistance. The committee
should also develop a financial plan for responding to the disaster. Bolin (1993) reported that city
revenues from a heavily damaged central business district were 5% of total revenues before the

333
earthquake, declined sharply in the year after the earthquake, and took about four years to return to
previous level. This clearly affects the jurisdiction’s tax revenues.
Moreover, the committee should establish agreements with NGOs and CBOs (especially local
churches, neighborhood associations, and other citizens’ groups) for support in disaster recovery because
these organizations provide financial and in-kind support, as well as legal and technical assistance. After a
disaster strikes, the Recovery/Mitigation Committee should ensure that organizations respond within the
scope of their responsibilities to implement the ROP.
Envisioning a Community Recovery Strategy
The Recovery/Mitigation Committee needs to work with the community before and after a
disaster to articulate a vision of community disaster recovery. The recovery process needs to strike a
balance between corporate centered and community based economic development (Bingham, 2000).
According to a corporate centered economic development, usually advocated by the local business
community, government provides resources such as land and money to the private sector to invest without
any restrictions. This market based strategy tends to produce results that are good in aggregate but
produces an inequitable recovery. By contrast, community based economic development involves active
participation by government to ensure that the benefits of recovery will also be shared by economically
disadvantaged segments of the community.
The short term recovery following a major disaster can generate an economic boom as state and
federal money flows into the community to reconstruct damaged buildings and infrastructure. These funds
are used to pay for construction materials and the construction workforce and, to the extent that the
materials and labor are acquired locally, they generate local revenues. In addition, the building suppliers
hire additional workers and these, along with the construction workers, spend their wages on places to
live, food to eat, and entertainment. Unless there are undamaged communities within commuting distance
that can compete for this money, it will all be spent within the community.
Communities must also consider the long term economic consequences of disaster recovery.
What will happen after the reconstruction boom is over? They can attract new businesses if they have a
skilled labor pool and good schools—especially colleges whose faculty and students can support
knowledge based industries. Other assets include low crime rates, low cost of living, good housing, and
environmental amenities such as mountains, rivers, or lakes (Blakely, 2000). A community can also
enhance its economic base if it can attract businesses that are compatible with the ones that are already
there. Such firms can be identified by asking existing firms to identify their suppliers and distributors.
These new firms might be attracted by the newer buildings and enhanced infrastructure that has been
produced during disaster reconstruction.
If a disaster stricken community does not already have such assets, they can invest in four
fundamental components of economic development—locality development, business development,
human resources development, and community development. Locality development enhances a
community’s existing physical assets by improving roads or establishing parks on river and lakefronts.
Business development involves efforts to retain existing businesses or attract new ones. Although it is not
easy, this can be accomplished working with businesses to identify their critical needs. In some cases, this
might involve establishing a business incubator that allows startup companies to obtain low cost space
and share meetings rooms. Human resources development expands the skilled workforce, possibly
through customized worker training. Finally, community development utilizes NGOs, CBOs, and local
firms that will hire current residents of the community whose household incomes are below the poverty

334
level. For example, a comprehensive program for developing small businesses, affordable housing,
community health clinics, and inexpensive child care can help to eliminate some of what new businesses
might consider to be one of the risks of relocating to the community.
Developing a Recovery Operations Plan
As was the case with emergency response, the demands of disaster recovery imply that specific
functions be performed. Table 11-6 identifies four principal disaster recovery functions—disaster
assessment, short term recovery, long term reconstruction, and recovery management. The recovery
phase’s disaster assessment function should be integrated with the emergency response phase’s
emergency assessment function in identifying the physical impacts of the disaster. Short term recovery
focuses on the immediate tasks of securing the impact area, housing victims, and establishing conditions
under which households and businesses can begin the process of recovery. Long term reconstruction
actually implements the reconstruction of the disaster impact area and manages the disaster’s
psychological, demographic, economic, and political impacts. Finally, recovery management monitors the
performance of the disaster assessment, short term recovery, and long term reconstruction functions. It
also ensures they are coordinated and provides the resources needed to accomplish them. The following
section describes each of these functions in greater detail.
Table 11-6. Disaster Recovery Functions.
Disaster Assessment
Rapid assessment Victims’ needs assessments
Preliminary damage assessment “Lessons learned”
Site assessment
Short Term Recovery
Impact area security Emergency demolition
Temporary shelter/housing Repair permitting
Infrastructure restoration Donations management
Debris management Disaster assistance
Long Term Reconstruction
Hazard source control and area protection Infrastructure resilience
Land use practices Historic preservation
Building construction practices Environmental recovery
Public health/mental health recovery Disaster memorialization
Economic development
Recovery Management
Agency notification and mobilization Public information
Mobilization of recovery facilities and equipment Recovery legal authority and financing
Internal direction and control Administrative and logistical support
External coordination Documentation
Disaster Assessment
Disaster assessment includes both physical and social impact assessment. Physical impact
assessment, which is usually called damage assessment, must address residential, commercial, and
industrial buildings. In addition, there is a need to conduct damage assessment for infrastructure such as
water, sewer, electric power, fuel, transportation, and telecommunications systems. Finally, damage
assessment also must address critical facilities such as hospitals, police stations, and fire stations. In

335
addition, there is a need for social impact assessment, usually called victims’ needs assessment to assure
that the available recovery programs are meeting victims’ needs. Finally, “lessons learned” examines the
disaster’s physical and social impacts to identify ways in which the mitigation actions can be taken to
reduce the community’s hazard vulnerability.
Damage assessment. There are three basic types of damage assessment (FEMA, 1995c). The first
type, rapid assessment, is usually conducted during the emergency response, preferably within the first 24
hours (Schwab, et al., 1998). The purpose of rapid assessment is to identify the areas affected by the
disaster and the approximate magnitude of the disaster’s physical impacts. It is especially important to
assess the need for lifesaving activities very quickly, so rapid assessment should be completed within one
to three hours after disaster impact. In turn, this allows emergency managers to determine where there are
collapsed buildings requiring search and rescue operations and whether there is a potential for secondary
impacts such as hazmat releases after an earthquake. Rapid assessment also provides information about
the status of infrastructure and critical facilities, as well as whether there is likely to be a need for
assistance from other local jurisdictions or other levels of government. A rapid assessment is performed
by available police, fire, and public works personnel—both on shift and recalled to duty—to conduct
assessments in predetermined geographic sectors of the community. Supplementary data can be provided
for a rapid assessment from the private sector organizations that own or operate lifelines and critical
facilities.
The second type of assessment is the preliminary damage assessment, which is designed to
produce counts of destroyed, severely damaged, moderately damaged, and slightly damaged structures.
This level of assessment should be completed within a 3-4 days, depending on the size and accessibility
of the impact area and the number and prior training of the damage assessment teams. The data from the
preliminary damage assessment are used to support requests for state and federal disaster declarations. A
preliminary damage assessment is performed by having local government personnel perform windshield
surveys by driving along all of the streets in the impact area (as the name suggests, they do not get out of
their cars). Inspectors tally counts of damaged structures, with residential structures being classified by
income levels and structural categories (single family, mobile home, multifamily residential structures).
Buildings can then be tagged red, yellow, or green depending on the level of damage and occupant safety,
with red tagged buildings being unsuitable for occupancy. A preliminary damage assessment should also
include estimates of percentages of households with insurance coverage because this will affect the speed
with which affected individuals and communities are able to replace their housing.
Finally, a site assessment is meant to produce detailed estimates of the cost to repair or replace
each affected structure. This information is used to support requests for federal assistance to the owners of
the damaged property. It includes estimates of losses to residential properties in order to understand both
the level of need for temporary shelter and temporary housing and for repair assistance. Losses to
commercial and industrial structures are assessed in order to understand the level of need for repair
assistance and economic injury assistance. Losses to public property must be assessed in order for the
community to apply for repair assistance. Site assessments require technically trained personnel such as
architects, structural engineers, and building inspectors for multistory structures such as apartment
buildings. These personnel can usually be drawn from city staff, but additional personnel might be
recruited from other local organizations or obtained from outside the community (e.g., through mutual aid
agreements with other jurisdictions or memoranda of agreement with professional societies). Skilled
construction professionals can be supplemented by volunteers who can conduct site assessments for most

336
single family residences if they have been trained in the use of well designed checklists. A site assessment
might take weeks to complete, depending on the size and accessibility of the impact area as well as the
number and training level of the assessment personnel. These methods of damage assessment can be
compared to the procedures of cost estimation that are used in routine construction projects, as shown in
Table 11-7.
Table 11-7. Types of Postdisaster Damage Assessments.
Damage Assessment Routine Construction Cost Estimation
Rapid Damage Assessment
Preliminary Damage Assessment
Site Assessment Preliminary Cost Estimate
Detailed Cost Estimate
In preparing for the necessary damage assessments, staff from local government departments
should be assigned to Damage Assessment Teams (DATs). Their numbers should be augmented as
needed by staff from local private sector organizations and neighboring jurisdictions through memoranda
of agreement (MOAs) or other contractual arrangements. All DAT members should be trained in a
common assessment procedure in order to speed up the process and generate results that are comparable
across all DATs within the jurisdiction.
Victims’ needs assessment. The effects of disasters are not confined to physical damage. In
addition, affected communities must assess the needs of those individuals and groups who have lost
property, been injured, or lost family members. This procedure, called a victims’ needs assessment,
should begin during the preimpact recovery planning process. The first step is to identify the
community’s vulnerable segments, which may be defined as specific locations and neighborhoods, or
types of households and businesses. The local jurisdiction should assign staff to Victims’ Needs
Assessment Teams (VNATs) and supplement them with staff from other organizations. These
supplementary staff should be assigned by contract with NGOs and CBOs and trained together with the
government staff in methods of victims’ needs assessment.
The need for public assistance to finance household and business recovery is inversely related to
the savings rate. That is, the lower the savings rate, the higher the need for public assistance.
Unfortunately, the savings rate in the US has been extremely low for the past decade, so the VNATs
should be prepared to find large numbers of households and businesses needing recovery assistance. In
addition to housing needs, VNATs should also be prepared to identify households’ needs for employment
and other economic assistance (e.g., food, clothing, and other basic needs), as well as their psychological
needs. If they are given adequate preimpact training, VNAT team members will be knowledgeable about
the availability of local, state, federal, and NGO disaster recovery programs. In turn, this will enable them
to accurately diagnose victims’ needs and refer them to the appropriate recovery programs.
“Lessons learned”. Unless the Recovery/Mitigation Committee establishes evaluation
procedures, few lessons are likely to be learned and applied to improving the community’s resilience.
Therefore, it should establish a “Lessons Learned” subcommittee, procedures for studying the event, and
a well defined scope for its report. The recovery team should use the damage assessment as an
opportunity to determine what are the ways, if any, that the jurisdiction should modify its land use plan,
building code, and other community operations in the light of the disaster impact. Other issues to be
considered should include infrastructure location and replacement, the capital improvements program,

337
and the provisions of the ROP itself. The delivery date of the report should be set fairly early in the
recovery process, perhaps 30 days after the disaster, so its recommendations can be incorporated into the
recovery process. This should be an adequate amount of time to collect data, deliberate the implications,
and make recommendations for policy revision if the jurisdiction has declared a 30 day moratorium on
reconstruction.
Short Term Recovery
Impact area security and reentry. First, there is a need to maintain security in the impact area to
ensure residents do not return before it is safe to do so and also to protect vulnerable property from the
threat of looting. Addressing these issues requires jurisdictions to develop procedures for residents’
reentry. Unfortunately, there is little research on ending evacuations to guide the planning process
(Stallings, 1991), but there is anecdotal evidence of problems that have arisen after disasters. The
available evidence indicates a need to provide for temporary reentry to remove essential items (e.g.,
clothing and medications) and permanent reentry for continuous habitation. In both cases, hazardous
conditions must have abated sufficiently to allow people to enter safely. In some cases, hazard abatement
might include the demolition of severely damaged buildings and the removal of heavy debris. In addition,
proper identification listing a local address is needed to ensure only residents or authorized reconstruction
personnel are allowed to enter. Finally, a jurisdiction must establish basic habitability criteria, such as the
restoration of transportation and sewer systems. It is possible to allow people to return before electric
power is available because some people have their own generators, but the criteria should be established
ahead of time. If the disaster has had a regional impact, reentry should be coordinated with neighboring
jurisdictions.
Temporary population shelter/housing. As indicated in the discussion of households’ housing
recovery, victims first find temporary shelter in the homes of friends and relatives, commercial facilities
such hotels and motels, or mass care facilities such as auditoriums and gymnasiums. The evidence is clear
that the majority of evacuees prefer the homes of friends and relatives. Among those whose friends and
relatives are either too far away or are themselves victims, the more affluent choose commercial facilities
and the poor—usually 10-25% of the evacuees—stay in mass care facilities (Mileti, et al., 1992).
Mass care facilities must accommodate differences due to age (elderly and children), ethnicity,
and physical limitations (e.g., mobility). Such facilities make it difficult to accommodate household
differences in such behaviors as personal sanitation, privacy, child rearing, and hours and loudness of
social interaction. They also place increased demands on time for other tasks, which reduces time for
child care, resulting in loss of control over children. Lack of personal space and privacy consistently
generate ethnic and class tensions among those in mass shelters and closely spaced semiprivate shelters
such as tents (Yelvington, 1997). Operation of mass care facilities can be especially complex after major
disasters in urban areas. In such cases, there will be a need for a large contingent of local multilingual
volunteers to assist in multiethnic communities and enough people to provide continued staffing for a
long duration displacement. Emergency managers can expect thousands of volunteers in first few weeks,
but there are likely to be dramatic drops in volunteerism after the second week (Yelvington, 1997).
Crowding and stress make it important to maintain transparency in making decisions about facility
operation and to establish procedures for coping with predisaster homeless, construction workers, and
others who do not qualify for shelter and housing (Bolin, 1993).
The incentives for moving from temporary shelter to temporary housing should be obvious.
“Doubling up” with friends and relatives eventually causes friction in interpersonal relationships,

338
commercial facilities are a drain on family finances, and mass care facilities are crowded, noisy, and lack
the privacy to which people are accustomed. When the number of displaced households is less than the
vacancy rate for affordable housing within commuting time of jobs, the existing housing market can
accommodate the relocation. To the degree that there are few vacancies, the rental rates are high, or the
commuting time is excessive (either because of the travel distance or because crowded routes decrease
average driving speed), government is likely to be called upon to increase the stock of temporary housing
by bringing in mobile homes.
The ROP should recognize that the need for temporary housing increases in importance as the
size of the socially vulnerable population increases, especially when there is a limited amount of
affordable housing outside the impact area. The number of displaced households will be compounded by
those evicted from undamaged homes because they lost their jobs and could not make rental or mortgage
payments. In a major urban area struck by a large scope disaster, this could be thousands of mobile
homes. Where will these be located—on victims’ lots (utilities already installed, maintains neighborhood
integrity, allows supervision of reconstruction) or in mobile home parks? If trailer parks are established,
local officials should try to reduce social friction by locating people within kin and friendship networks to
the greatest extent possible.
Temporary business operation. Just as households need temporary housing, so too do businesses
need temporary operating locations when their normal locations have been severely damaged or
destroyed. Many small businesses have customers who are loyal enough to travel an extra distance, but
loyalty does have its limits. Consequently, government might need to permit the establishment of
temporary business operations in parking lots or other open spaces that are close to the displaced
businesses’ normal locations. The ROP should also identify sites for temporary housing and temporary
business operations, which may be needed for as much as a year (and even longer in some cases).
Infrastructure restoration. There are often many households and businesses that cannot resume
normal functioning simply because of the lack of potable water, sewer, electric power, fuel,
telecommunications, or transportation—not because of damage to their homes or places of business.
Consequently, there is a need to inspect and repair any damage to pipelines and power lines, as well as
streets, bridges, street signs, and street lights. In addition to returning these households and businesses to
normal functioning, restoration of infrastructure to these areas also provides places where emergency
workers and construction crews can live while they are rebuilding the structures that have been damaged
or destroyed. On the other hand, generating a rapid economic recovery might suggest a different set of
priorities—emphasizing the restoration of infrastructure for the area’s dominant export industries. Thus,
there are likely to be conflicting priorities and few easy decisions. Consequently, priorities must be
established in the preimpact recovery plan with links to the damage assessment procedures that allow the
recovery managers to adapt the predetermined infrastructure restoration priorities to the needs of each
specific situation.
Critical facility operation. It should be quite obvious that there will be a need to quickly repair
critical facilities such as hospitals, police stations, and fire stations. However, a community’s public
infrastructure is also served by other critical facilities such as water treatment plants, transit bus barns,
public works equipment yards, and government offices. There is also privately operated infrastructure that
includes electric power stations, television and radio facilities (both stations and broadcast towers), and
telephone switching facilities. An inventory of these facilities should be available from the
hazard/vulnerability analysis.

339
Debris management. Most of the natural disasters, and explosions among the technological
disasters, can destroy a substantial number of structures. In turn, this can produce an enormous amount of
debris that must be removed. Debris management should designate temporary sites for sorting recyclable
from nonrecyclable materials, with the latter being moved to permanent sites for disposal. Debris
management is complicated in situations where evidence must be gathered in a systematic manner as in
investigations of accidents (e.g., National Transportation Safety Board investigations of airline crashes or
train derailments) or when the site is be considered a possible crime scene (e.g., the bombing of the
Murrah Federal building Oklahoma City). In such cases, debris removal is likely to be delayed, so
temporary sorting sites will be needed to separate out material evidence from useless debris. Ultimately, a
catastrophic event such as the World Trade Center collapse or Hurricane Katrina can produce millions of
tons of debris that can overwhelm landfill capacity.
Emergency demolition. It is likely that some structures will be damaged severely enough to pose a
threat of collapse, so procedures are needed to rapidly assess their stability and determine if they should
be reinforced and rebuilt or demolished. This assessment clearly requires competent structural
engineering assistance, but historic preservationists should also be consulted if the building has cultural
significance (Donaldson, 1998). Indeed, historic structures should be surveyed and inventoried before
disaster strikes and postimpact damage assessment procedures should be developed to avoid unnecessary
demolition of damaged historic structures (Kariotis, 1998; Kimmelman, 1998). The ROP should establish
policies that include criteria for emergency demolition of severely damaged structures and adequate
notification for owners who might have evacuated. In addition, the implementing procedures should
contain samples of the contracts to be signed with demolition companies. These contracts require the
involvement of the jurisdiction’s legal counsel to ensure the administrative process respects personal
property rights.
Repair permitting. The ROP should contain criteria for determining which structures will be
eligible for reoccupancy based upon the percent damage to the different elements of the building—
foundation, wall, and roof systems, exterior walls, interior walls, floors and flooring materials, plumbing,
electrical systems, HVAC systems. The large number of requests for building repair permits following a
disaster can overwhelm a local code enforcement department (Schwab, et al., 1998). In preparation for
this eventuality, the permit office staff should be augmented with staff from other jurisdictions and the
private sector as needed. In addition, the ROP should establish an emergency permitting process that
includes 10 day moratorium on minor repairs and a 30 day moratorium on permits for substantial repairs
involving 50% or more of the preimpact property assessment. This allows time for the city to acquire
enough staff to evaluate the properties and areas involved and establish policies for improving the
building stock as needed. Of course, exemptions may be needed for reconstruction of critical facilities.
The process should be streamlined as much as possible by, for example, placing permit staff in a DAC.
The streamlined process should be continued for a limited time period, often 90 days after impact, that
has been defined in the ROP. Local jurisdictions should consider deferring application fees during this
period.
ROPs for urban areas should anticipate the possibility of developers purchasing many damaged
single family residences in the expectation of replacing them with apartment buildings. To avoid this
problem, one city established a five month moratorium on applications for construction of new
apartments. It also established restrictions on new buildings to ensure a Design Review Board could

340
exclude building designs that were incompatible with the character of the neighborhoods in which they
were to be constructed.
Donations management. Major disasters frequently produce an outpouring of material (rather
than financial) assistance from households and businesses outside the impact area. There is usually a
substantial amount of useful material in these donations, but there also is a substantial amount of junk.
Dynes (1970) and others have listed donations such as women’s formal gowns, parkas (after summer
disasters in the South), outdated medicines, and other items that impede the recovery by diverting
personnel to the task of sorting through the donations. Even useful items must be sorted. For example,
donated clothing must be sorted by category, gender appropriateness, and size. It is common for victims
to reject food donations because these items are incompatible with local tastes and to refuse specific types
of temporary housing because the buildings are incompatible with local cultural preferences or climatic
conditions. Another problem with donations is that an influx of useful material resources precludes the
need to buy from local businesses, thus threatening their revenues. Thus, in most cases, financial
donations are preferable to material donations. Since material donations will inevitably arrive, local
emergency managers need procedures to manage them. One important component of a donations
management procedure is to establish a staging area outside the impact area where incoming donations
can be received, sorted, and prepared for delivery to locations where they will be made available to
disaster victims.
Disaster assistance. Under normal circumstances, people rarely need to visit government
agencies. Moreover, when they do make these visits, they only need to visit one agency. During disaster
recovery, however, people often need to contact multiple agencies within a short period of time.
Moreover, the large number of other people attempting to visit each of those agencies and the small
number of staff available to process the contacts results in long lines. In some disasters, these problems
have been compounded by the periodic movement of agencies field offices from one location to another
during the course of the disaster recovery. Consequently, it is important for local emergency managers to
provide “one-stop shopping” so victims can resolve all of their needs at a single location that is
maintained throughout the short term recovery period. It is also important that the location be readily
accessible by public transportation and that additional staff be recruited and trained to minimize victims’
processing delays. The ROP should also designate DAC sites that are capable of housing financial aid
assistance (including grants, loans, and tax deductions/deferrals), in-kind assistance (food, clothes,
bedding), and legal and technical assistance. The ROP should identify primary and augmentation staff for
all of these sites, including the donations management, debris sorting, debris disposal sites, and the
DACs.
Long Term Reconstruction
As Chapter 3 indicated, a disaster usually opens a window of opportunity for changes in
environmental hazard management policy (Prater & Lindell, 2000). If the Recovery/Mitigation
Committee has “done its homework”, it will already have assessed the community’s hazard exposure,
physical vulnerability, and social vulnerability. In addition, it will be well prepared with suggestions for
ways in which to reduce future risks by integrating hazard mitigation into disaster recovery (Schwab, et
al., 1998; Wu & Lindell, 2004). Finally, the committee should identify sources of funding for the
mitigation projects they propose.
Hazard source control and area protection. The Recovery/Mitigation Committee should have
begun to examine the prospects for hazard source control and area protection before a disaster strikes and

341
continue this effort in the immediate aftermath. As indicated in Chapter 7, these mitigation strategies are
not feasible for some hazards. The committee should anticipate induced growth in the protected area if
hazard source control or area protection measures are implemented. However, linking the new source
control or area protection measures to changes in the land use and building construction practices within
the affected areas can avoid the expected increase in future vulnerability.
Land use practices. Implementation of long term reconstruction planning means setting in motion
any changes in land use policies that were developed during the preimpact recovery planning process.
This is also an opportune time to reexamine the community’s existing land use plans and to pass new
ordinances that will reduce hazard exposure. Alternative land uses can reduce the total population and
property at risk, sometimes by reducing development in high hazard areas. This can be accomplished by
purchasing private property, purchasing development rights, relocating public facilities and other
infrastructure away from hazardous areas, and redirecting new capital improvements away from
hazardous areas. Road width and access regulations might also need to be established or revised at this
stage. Lot restrictions can be used to reduce population densities by downzoning and setbacks can be used
to maximize distances from hazards. Landscaping and vegetation requirements can be established to
reduce the potential for flooding, landslides, or fires. Moreover, as discussed in Chapter 7, the ROP
should provide guidance on the reconstruction of nonconforming uses, which are structures that do not
meet the zoning requirements for their geographic areas. Usually these are older structures whose
construction preceded the establishment of the current zoning requirements and, thus, are
“grandfathered”.
Building construction practices. The ROP should also address the implementation of new
mitigation requirements such as elevating structures located in floodplains. Other building codes can also
reduce the physical impact of a disaster on structures located in risk areas. These include increasing
disaster resistance of the building structure and increasing the resistance of “soft spots” in the structure. In
addition to addressing new code requirements, the ROP should also address the building construction
process. In particular, virtually every disaster produces complaints about out of area building contractors
who receive advance payment for work that never performed. Thus, the ROP should address the need to
monitor them—especially by registering out-of-area contractors and providing contract advice to owners
of damaged property. Care should be taken to ensure regulation of outside contractors and construction
workers does not impede the ability of NGOs such as Habitat for Humanity to use volunteer labor from
out of the area to assist in the reconstruction effort. The ROP needs to balance the legitimate interests of
local contractors against the needs of the community for rapid provision of affordable housing for low
income residents (Peacock & Ragsdale, 1997).
Public health/mental health recovery. Most natural disasters in the US have had minimal public
health consequences because the country has few endemic diseases whose incidence is likely to increase
after a disaster. Contrary to many people’s beliefs, dead bodies are a public health threat only if those who
died had communicable diseases when they were alive. Death itself does not spontaneously generate
disease. Waterborne illnesses are a problem if survivors drink from, wash food in, or bathe in water
sources that have been contaminated by raw sewage or chemical spills. Of course, such exposures can be
avoided by having survivors use bottled water or by evacuating the impact area until infrastructure has
been restored. Disease vectors other than ingestion must also be controlled in areas where pests harbor
diseases. For example, mosquito control has become increasingly important as mosquito transmitted
diseases, such as West Nile virus, have become increasingly prevalent.

342
Similarly, natural disasters produce minimal mental health consequences. Clinical psychologists
found nearly 20 years ago that few victims use formal psychological services in the aftermath of disaster
(Gist & Stolz, 1982). Since that time, an extensive research has confirmed that finding (Salzer &
Bickman, 1999). This has led many psychologists examine the typical problems victims face and, in so
doing, found that the two most prominent are material resource loss (Freedy, et al., 1992) and disruption
of social networks (Kaniasty & Norris, 1995). The first of these problems, material resource loss, is
addressed by the programs for housing and economic recovery. However, mental health professionals can
facilitate the recovery process by acting as victim advocates, especially for victims who are unaccustomed
to working with white collar bureaucracies (Salzer & Bickman, 1999). Other recommendations include
designing community interventions to provide social support by establishing victim locator systems,
facilitating self-help groups, and community organizing (Salzer & Bickman, 1999)
Nonetheless, others have concluded that the failure to seek formal psychological counseling is a
potential threat to the mental health of victims and even first responders. In connection with the latter,
Mitchell (1983) developed a system called the Critical Incident Stress Debriefing, which involves
preincident training, individual crisis support, demobilization (e.g., informational debriefings as personnel
rotate off duty), defusing (small group discussions about the emotional significance of the event), family
support, and referral to other support services (e.g., psychiatric, psychological, legal, career). Despite its
proponents claims of empirical support for this method, the most rigorous scientific evaluations have
found no evidence of its effectiveness (McNally, Bryant & Ehlers, 2003). One problem seems to be that
establishing a rigid schedule for victims to discuss traumatic events disrupts their ability to control the
alternation between psychological phases of active processing and avoidance (Pennebaker & Harber,
1993). A related problem is the requirement for group discussion with their professional peers shortly
after the event (usually within 12 hours). In the case of emergency responders, this conflicts with their
preference for seeking support from spouses and others outside the workplace (Gist, et al., 1999). Thus,
there appears to be no scientific justification to plan for anything other than routine referrals for
psychological distress.
Economic development. The ROP should provide guidance on the economic development of the
disaster stricken areas. The basic strategy for redevelopment should have been planned during the process
of envisioning the community recovery strategy. Thus, this is the time at which the strategy is
implemented. In communities that are highly dependent on tourism, active promotion is needed to assure
prospective visitors that all facilities are back in operation.
Infrastructure resilience. One opportunity that is likely to arise during disaster recovery is an
opportunity to decrease the physical vulnerability of community infrastructure. In most cases, roads and
bridges can be strengthened. Similarly, aboveground lines can be undergrounded to reduce their
vulnerability to wind and ice. In some cases, pipelines for water, sewer, and fuel and major transmission
lines for electric power and telephone can be rerouted to reduce vulnerability. However, most of these
lifelines must pass through high hazard exposure areas at some point. For example, all lifelines must cross
seismic faults to serve customers on the other side. All of these lifelines are critical to a community’s
disaster resilience, so preimpact planning or postimpact improvisation should provide for rerouting and
strengthening infrastructure to decrease its vulnerability to future disasters.
Historic preservation. The disaster recovery period is an opportune time to examine the physical
vulnerability of undamaged historic structures to determine how to protect them from future disasters
(Cliver, 1998). The federal government has funds, as do many states, for the preservation of historic

343
buildings. However, the affected community must initiate the process by recognizing the value of these
structures and investing time and money into their preservation (Alfaro, 1998).
Environmental remediation. Hazmat spills are an increasing problem during natural disasters and
the process of cleaning up oil and chemical spills could take months (Lindell & Perry, 1997b; Showalter
& Myers, 1994). In most cases, such work will be performed by specialized contractors hired by state or
federal government. However, such efforts should be coordinated with local personnel from the
department of public health, land use planning, or fire/hazmat response.
Disaster memorialization. Disaster recovery is a critical time in the life of a community. In the
case of major loss of life or of major damage to a community’s stock of historic buildings, the sense of
loss can be tremendous. Communities frequently derive some collective solace from the establishment of
a memorial structure or for the definition of a memorial day to be commemorated annually. These disaster
memorials can play an important part in the recovery of a community’s sense of identity and pride. Thus,
they should be considered when a community has suffered a traumatic event. They must be planned and
developed in a carefully designed, transparent, and participatory process in order to be effective
instruments of community healing. In most disasters, the Recovery/Mitigation Committee should seek
representation from a wide range of religious and secular groups. In some cases, the 9/11 World Trade
Center attack being one of many examples, a committee of victims’ families has exerted substantial
influence on the memorialization process.
Recovery Management
Agency notification and mobilization. Unlike the incident management function performed during
emergency response, the recovery management function performed during the disaster recovery does not
require special procedures for agency notification and mobilization because agencies will be well aware
of the disaster by the time recovery is initiated. The rapid assessment noted earlier might seem like a
counterexample, but this task is actually part of the emergency response.
Mobilization of recovery facilities and equipment. Recovery management does require the
mobilization of recovery facilities for donations management, debris management, and disaster assistance
(the DACs). As noted earlier, a community with a large population of displaced victims and a small
housing vacancy rate might need to develop one or more mobile home parks to provide enough temporary
housing. Rapid mobilization of such facilities requires preimpact screening to identify appropriate sites.
Site selection criteria should, of course, include suitable zoning and access to utilities such as
water/sewer, fuel and electricity. In addition, planners should also focus on sites that have access to public
transportation and close proximity to the types of jobs that will be held by a low income population.
Internal direction and control. There is a need for internal direction and control among agencies
within the jurisdiction because many aspects of the recovery process require multiagency coordination.
Disaster recovery typically involves local government agencies in tasks that are more like their normal
duties than is the case for the emergency response. Thus, the ROP’s allocation of recovery functions to
agencies will be relatively simple. In addition, disaster recovery does not require an equivalent to the
Incident Commander who oversees the emergency response. Instead, different departments will usually
be coordinated by the Recovery/Mitigation Committee. Finally, there is less time pressure during the
disaster recovery than during the emergency response, so this committee’s meetings can be scheduled for
daily or, later, weekly frequency. Nonetheless, decisions about recovery programs must often be made
while victims still focused on satisfying basic needs such as food and shelter. Thus, recovery decisions
may need to be made before citizens are ready to participate in a planning process (Smith, 2004).

344
External coordination. There is a need for external coordination, especially in presidentially
declared disasters, because of the presence of personnel from other jurisdictions and other levels of
government. As is the case for internal direction and control, there should be a relatively clear
understanding of which agencies will address each disaster response function. In addition, local agencies
need to understand what are the restrictions associated with different state, federal, NGO, and CBO
programs.
Public information. There is also a need for public information, especially to inform disaster
victims about recovery policies and procedures. However, there is also a need to inform other citizens
about the progress of the recovery. Thus, the ROP should describe the procedure for disseminating public
information during disaster recovery. The procedure should describe which agencies will be the source of
each type of information, what will be the general content of their messages, and what communication
channels they will use. As indicated in Chapter 4, general information about the recovery process and
sources of additional information can be distributed through the mass media. Brochures can be targeted at
individuals and organizations located in vulnerable zones (before a disaster strikes) or impact areas (after
a disaster strikes). Telephone hotlines can be useful for answering questions about the recovery process,
and a full time PIO should be on staff at the DAC during short term recovery. Public meetings should be
held frequently to involve community residents in the reconstruction planning process.
Research on disaster recovery has reported that some victims believe there is favoritism toward
business interests at the expense of households. Similar concerns have arisen in other disasters where
historic preservation, neighborhood, and ethnic organizations mobilized public demonstrations, pressured
administrators in hearings, and filed lawsuits (Bolin, 1993). These organizations can slow recovery and
make it more expensive (Bolin, 1993) unless there is a transparent process as well as clear and consistent
answers to questions such as “Who is eligible for assistance?” and “How will land use change in the
impact area and how will this affect adjacent areas?”
Recovery legal authority and financing. The Recovery/Mitigation Committee needs to obtain
legal authority for a wide range of short term recovery actions including a development moratorium,
temporary repair permits, demolition regulations, and zoning for temporary housing (Schwab, et al.,
1998). They also need to explore the feasibility of an adequate public facility ordinance requiring
developers to pay for extending infrastructure to locations where it does not already exist, increased
participation in the National Flood Insurance Program, and revising annexation procedures for
incorporating additional land. In addition, the Recovery/Mitigation Committee should examine the
adequacy of existing zoning tools including development density controls that limit the number of lots per
acre of developed land, overlay districts that add special restrictions to the customary limitations of type
(residential, commercial, and industrial) of construction, and setback requirements for minimum distances
from hazardous terrain or landscape features. In addition to ensuing adequate legal authority, the
Recovery/Mitigation Committee must identify financial tools for achieving mitigation objectives.
Financing can be obtained by directing Community Development Block Grant funds to mitigation
activities, establishing special assessment districts, and charging impact fees for new development—
especially when it is in a hazard prone area.
Administrative and logistical support. During the recovery period, the pace of operations
decreases so the management of specific emergency response and recovery functions does not need to be
focused at incident scenes or centralized in the EOC. Thus, the activities performed by the Planning,
Logistics, and Administration Sections within the IMS are gradually dispersed back to the jurisdiction’s
345
normal departments listed in Figure 11-2. Nonetheless, special provisions are required to support the
additional staff generated by obtaining mutual aid personnel from other jurisdictions and volunteer
personnel such as architects and engineers used as building inspectors. Moreover, records accumulated by
the Finance Section must be available to provide a justification for expenditures on disaster recovery and
hazard mitigation that are reimbursable by state and federal agencies.
Documentation. As is the case in the emergency response, documentation is needed during
disaster recovery to provide the basis for organizational learning. Maintaining an event log of who took
what actions in response to what conditions will provide the Recovery/ Mitigation Committee with the
information it needs to produce the “Lessons Learned” document and, later, to revise the ROP. In
addition, detailed documentation provides the jurisdiction’s legal counsel with the information that might
be needed to defend against any lawsuits.
Case Study: Disaster Recovery in Wichita Falls
An F-4 tornado struck Wichita Falls on April 10, 1979 that killed 46 people and injured another
3245 (Bolin, 1982). The tornado also destroyed 2500 homes, seriously damaged 879, and slightly
damaged 1659. In addition, it destroyed 1274 apartment units, 85 mobile homes, and 81 businesses. In the
aftermath of the storm, nearly one fifth of the city’s population of 100,000 was homeless. Temporary
housing began to be delivered after four days, telephone service was restored after nine days, and debris
clearance from private lots had begun within two weeks. Although the EOC was deactivated five days
after the storm, the emergency declaration was not lifted for a month. By that time, basic services (water,
sewer, electric power, fuel, telecommunications, and transportation) were restored. Debris clearance was
delayed by the need to obtain permission from property owners who were, understandably, not readily
accessible due to relocation elsewhere. Nearly 50% of all homeless families had temporary housing
within 45 days after the storm and almost all had temporary housing within 90 days. Most major
commercial businesses had resumed operations within 120 days. Housing reconstruction was delayed by
Small Business Administration funding problems, some victims’ lack of insurance and inability to qualify
for federal aid, and the scarcity of building contractors and building materials. Nearly 90% of the lost
housing had been rebuilt by the end of two years, but there were problems in the interim. First, the influx
of construction workers increased pressure on the tight housing market. Second, reconstruction in lower
socioeconomic neighborhoods was only 30% at 18 months when reconstruction in higher socioeconomic
neighborhoods reached 80%. The community faced a number of foreseeable recovery issues for which it
was unprepared. First, the city council reversed itself twice on the issue of siting mobile homes on lots
where owners were attempting to rebuild. Second, the council imposed rent and price controls, but these
only delayed increases that skyrocketed as soon as they were terminated. Third, the city incurred
substantial costs for rebuilding infrastructure at a time when its revenues were down because of the losses
in the property tax base.


![Disaster Recovery Center (Disaster Assistance … Library/Disaster Recovery Center...Disaster Recovery Center (Disaster Assistance Center) Standard Operating Guide [Appendix to: ]](https://img.dokumen.tips/doc/110x75/5b0334ba7f8b9a2d518bd9d9/disaster-recovery-center-disaster-assistance-librarydisaster-recovery-centerdisaster.jpg)