Embed Size (px)
Citation preview
Chapter 10 Monitoring and Chapter 10 Monitoring and TroubleshootingTroubleshooting
10.1 10.1 Network Monitoring
10.2 10.2 Troubleshooting
Chapter 10 Monitor & Troubleshoot
10.1 Network Monitoring
Network monitoring ensures a network to function continuously Aspects include
Server performanceNetwork statisticsHard disk performanceMemory usage CPU utilisation
Chapter 10 Monitor & Troubleshoot
10.1.1 Server Performance
Server performance includes number of queued commands
queued commands = commands awaiting executiontoo high → a bottleneck in the server
• use additional server
• use multiple processors
quality of server sessionsserver session records server-client connection How is the connection broken?
• normal logoff, error, or server timeoutserver timeout → server overloaded
Chapter 10 Monitor & Troubleshoot
10.1.2 Network Statistics
Network statistics include error rate
number of collisions per second• re-transmission after collision
• waiting time will increase greatly
network utilisation
Saturated• utilisation ~100%
• →more collisions
Actual bits transmitted per second
Bandwidth
Chapter 10 Monitor & Troubleshoot
10.1.3 Hard Disk Performance
Hard disk performance includes disk space remaining throughput of the hard disk
Throughput = amount of data transferred per secondthe speed at which requests are serviced.
number of queued requestsbusy or notToo high → hard disk overloaded
Chapter 10 Monitor & Troubleshoot
10.1.4 Memory Usage
Memory usage ← rate of memory swapping Swapping
data not in use are moved from the main memory onto the hard disk to make room for new data
Too many swapping → system slows down
Chapter 10 Monitor & Troubleshoot
10.1.5 CPU Utilisation
CPU utilisation average percentage of CPU activity high (> 90%) → overloaded or, caused by
low memoryimproper configuration
Chapter 10 Monitor & Troubleshoot
10.2 Troubleshooting
Common network problems: response too slow unable to detect the network from a workstation unable to login unable to use resources of the network unable to connect to the Internet unable to execute certain programs
Chapter 10 Monitor & Troubleshoot
10.2 Troubleshooting
Troubleshooting to diagnose and fix problems
The structured steps are establishing the symptoms identifying the affected area establishing what has changed selecting the probable cause implementing the solution testing the results documenting the solution
Chapter 10 Monitor & Troubleshoot
10.2 Troubleshooting
10.2.1 Establishing the symptoms
Symptoms are information about a problem may come from
users• 1. when the problem occurs
• 2. what the user is doing when the problem occurred
• 3. how often the problem occurs
• 4. what has been done to try to correct the problem
• 5. what the system has changed recentlyerror messages or event logs
Chapter 10 Monitor & Troubleshoot
10.2 Troubleshooting
10.2.2 Identifying the affected area
scope a single workstation a network segment (controlled by a hub/bridge/switch) the entire network
involves network infrastructure• malfunctioning hubs or switches
• insufficient bandwidth for the networkhighest priority
Chapter 10 Monitor & Troubleshoot
10.2 Troubleshooting
10.2.3 Establishing what has changed
A network suddenly fails → some changes Consider:
new software or hardware added? positions of hardware on the network changed?
e.g. Moved workstation → cabling related issue
Chapter 10 Monitor & Troubleshoot
10.2 Troubleshooting
10.2.4 Selecting the probable cause
Selecting the probable cause requires isolating the problem tools
If a user is unable to log onto the network, probable causes:
invalid logonfaulty cablebad network cardthe account has been locked
Chapter 10 Monitor & Troubleshoot
10.2 Troubleshooting
10.2.4 Selecting the probable cause
A. Isolating the problem Techniques
removing cables one by oneshutting down services one after the otherpulling out affected system
• check whether it can work as a standalone machinerebooting the network
• last resort
Chapter 10 Monitor & Troubleshoot
10.2 Troubleshooting
10.2.4 Selecting the probable cause
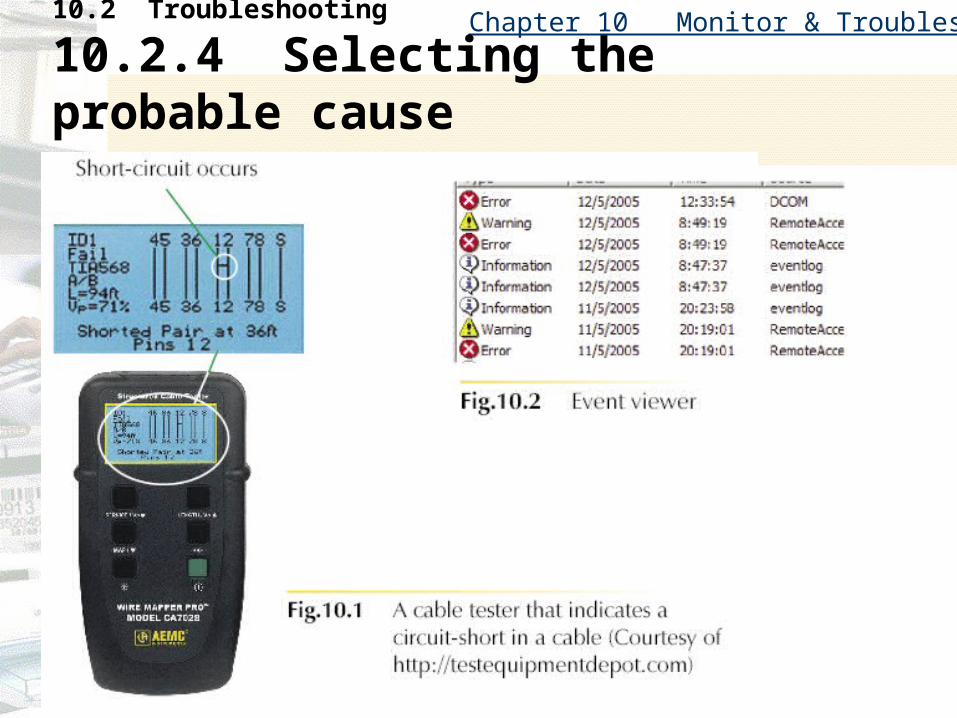
B. Tools Cable tester
a device used in checking a cable
Event viewer a utility program that stores
• security threats
– e.g. failed log on or failed data access
• system activities
• application activities
– tell how well the system is running
Chapter 10 Monitor & Troubleshoot
10.2 Troubleshooting
10.2.4 Selecting the probable cause
Chapter 10 Monitor & Troubleshoot
10.2 Troubleshooting
10.2.4 Selecting the probable cause
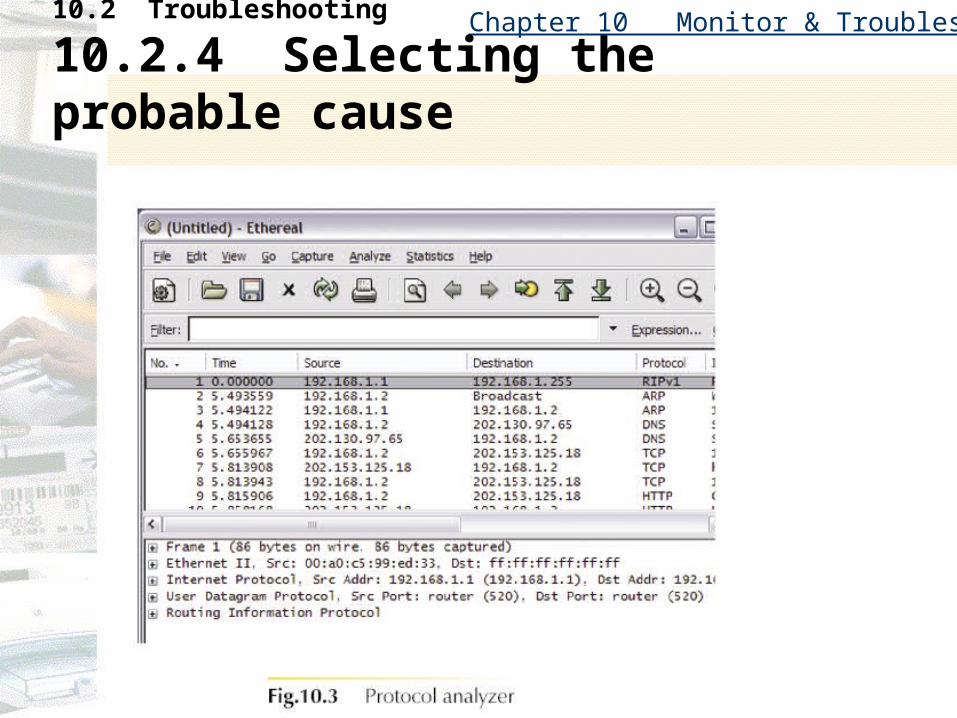
B. Tools (cont’) Protocol Analyzer / Packet Sniffer
is hardware or softwareverifies the working of a protocolcaptures each packet passing over a network
• and decodes its content
Note: packet sniffers may be used by hackers to intercept data
Chapter 10 Monitor & Troubleshoot
10.2 Troubleshooting
10.2.4 Selecting the probable cause
Chapter 10 Monitor & Troubleshoot
10.2 Troubleshooting
10.2.5 Implementing the solution
Common solutions: replacing with a new hardware or reconfiguring the server.
Note: 1. If powering off is required, plan
the time to power offmaking backup
2. Implement solution with one fix at a timeotherwise, difficult to tell what has corrected the problem and
why
Chapter 10 Monitor & Troubleshoot
10.2 Troubleshooting
10.2.6 Testing the results
Testing after implementing the solution to verify that the solution really addressed the problem
Chapter 10 Monitor & Troubleshoot
10.2 Troubleshooting
10.2.7 Documenting the solution
Documentation provides a quick reference for future include
what the problem washow (and when) the solution was implementedother solutions that have been tried out who implemented the solution