Embed Size (px)
Citation preview
201920051985FY1965
2,730
1,773
Cultivating mainly potatoes, domestic production only
Cultivating mainly rice and wheat, domestic production only
Cultivation of dilapidated farmland that can be reused
2,4942,537
1,7541,718
3,141 kcal/person/day
2,056
2,877
2,020Estimated energy requirement level
2,168
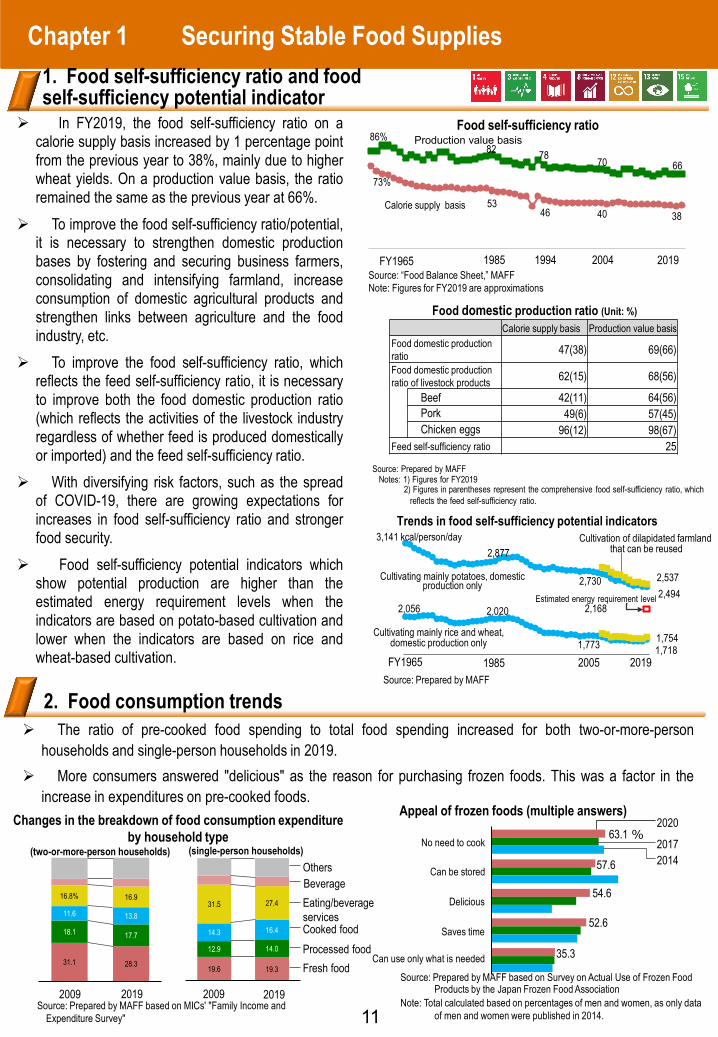
Trends in food self-sufficiency potential indicators
73%
5346 40 38
86%82 78 70 66
Production value basis
Calorie supply basis
Chapter 1 Securing Stable Food Supplies
11
1. Food self-sufficiency ratio and food self-sufficiency potential indicator
In FY2019, the food self-sufficiency ratio on acalorie supply basis increased by 1 percentage pointfrom the previous year to 38%, mainly due to higherwheat yields. On a production value basis, the ratioremained the same as the previous year at 66%.
To improve the food self-sufficiency ratio/potential,it is necessary to strengthen domestic productionbases by fostering and securing business farmers,consolidating and intensifying farmland, increaseconsumption of domestic agricultural products andstrengthen links between agriculture and the foodindustry, etc.
To improve the food self-sufficiency ratio, whichreflects the feed self-sufficiency ratio, it is necessaryto improve both the food domestic production ratio(which reflects the activities of the livestock industryregardless of whether feed is produced domesticallyor imported) and the feed self-sufficiency ratio.
With diversifying risk factors, such as the spreadof COVID-19, there are growing expectations forincreases in food self-sufficiency ratio and strongerfood security.
Food self-sufficiency potential indicators whichshow potential production are higher than theestimated energy requirement levels when theindicators are based on potato-based cultivation andlower when the indicators are based on rice andwheat-based cultivation.
Food self-sufficiency ratio
1985 1994 2004 2019FY1965
Food domestic production ratio (Unit: %)
Source: “Food Balance Sheet,” MAFFNote: Figures for FY2019 are approximations
Source: Prepared by MAFFNotes: 1) Figures for FY2019
2) Figures in parentheses represent the comprehensive food self-sufficiency ratio, which reflects the feed self-sufficiency ratio.
2. Food consumption trends
Changes in the breakdown of food consumption expenditure by household type
The ratio of pre-cooked food spending to total food spending increased for both two-or-more-personhouseholds and single-person households in 2019.
More consumers answered "delicious" as the reason for purchasing frozen foods. This was a factor in theincrease in expenditures on pre-cooked foods.
(two-or-more-person households) (single-person households)
Appeal of frozen foods (multiple answers)
Source: Prepared by MAFF based on MICs' "Family Income and Expenditure Survey"
Fresh foodProcessed foodCooked food
Eating/beverage services
OthersBeverage
31.1 28.3
18.1 17.7
11.6 13.8
16.8% 16.9
2009 2019
19.6 19.3
12.9 14.0
14.3 16.4
31.5 27.4
2009 2019Source: Prepared by MAFF based on Survey on Actual Use of Frozen Food
Products by the Japan Frozen Food AssociationNote: Total calculated based on percentages of men and women, as only data
of men and women were published in 2014.
63.1
57.6
54.6
52.6
35.3
%2020
20172014
No need to cook
Can be stored
Delicious
Saves time
Can use only what is needed
Source: Prepared by MAFF
Calorie supply basis Production value basisFood domestic production ratio 47(38) 69(66)Food domestic production ratio of livestock products 62(15) 68(56)
Beef 42(11) 64(56)Pork 49(6) 57(45)Chicken eggs 96(12) 98(67)
Feed self-sufficiency ratio 25

Chapter 1 Securing Stable Food Supplies
3. Exploration of demand through the creation of new values
Addressing environmental issues such as food loss and wasteAmount and location of food loss and waste (estimated)
Creation of new value chains to meet demand
12
Source: Prepared by Source: Prepared by MAFF, “Comprehensive Survey on AFFrinnovation"
Total annual sales of agricultural production-relatedbusinesses (the processing and direct sales efforts byfarmers, etc.) totaled 2,077.3 billion yen in FY2019,down 26.8 billion yen from the previous year.
To address the issues faced by agriculture, forestry,and fisheries businesses engaged in AFFrinnovation,the government has set up support centers forAFFrinnovation at the national and prefectural levels toprovide advice and support for managementimprovement efforts.
Domestic production value of food industry
Total sales from agricultural production-related businesses
Source: Prepared by MAFF, “Economic relation tables on agriculture and food industries”
Note: Figures for 2019 are approximations
The domestic food industry production value in 2019was 101.5 trillion yen, up 1.0 trillion yen from theprevious year.
Compared to the previous year, increases includedfactory-shipped appetizers, sushi, boxed lunches,breads, etc. in the food manufacturing industry, marginvalue in the retail industry* in relevant distributionindustries, and the sales at restaurants and bars in theeating and beverage services industry.
Promote efforts to improve the productivity of thefood industry by demonstrating the use of advancedtechnologies, including AI-based inspection equipment,and to streamline food distribution by linking productand logistics information data.
Enhancement of competitiveness in the food industries
35.5 36.8 37.2 37.5 37.8 37.9
29.7 32.8 34.7 34.0 34.0 34.7
26.8 27.6 28.1 28.5 28.6 28.9
92.0 trillion yen
100.0 99.9 100.5 101.597.1
Food manufacturing industry
Relevant distribution industry
Eating/beverage services
FY2014 20192016 2017 20182015*Margin value = Sales value - Cost of sales
8,577 8,923 9,141 9,413 9,404 9,468
9,356 9,974 10,324 10,790 10,789 10,534
739 784 811 842 848 770 18,672
(Unit: 100 million yen)19,680 20,275
21,044 21,040 20,773
Agricultural processing
Farmer's markets
Others
FY2014 20182015 2016 2017 2019
Japan's food loss and waste has been on adownward trend in recent years, and in FY2018, it wasestimated to be 6 million tons per year, down 120,000tons from the previous year.
The Government of Japan has promoted therelaxation of delivery deadlines for food retailers and theeasing of expiry date labeling (year/month format, anddate batch format) for food manufacturers.
The government has conducted a survey of food-related businesses regarding the amount of food lossand waste generated in general households due to thespread of COVID-19 after March 2020. As a result,about 60% of the food industry as a whole respondedthat there was no change, while by industry, about 70%of the eating and beverage services industry reported adecrease.
282 289 291 284 276
120 133 133 127 116
144 140 137 121 126
60 67 66 64 6616 18 16
16 16
2014年度 2015 2016 2017 2018
Eating/beverage services
621 t (Unit: 10,000)
General households
Food wholesale industry
Food manufacturing
industry
Food retail industry
612643646 600
FY2014
Source: Prepared by MAFF

4. Strategic exploration of global market
Countries/regions and products for which the ban on exports is lifted or quarantine requirements are
relaxed in FY2020
Source: Prepared by MAFF
Chapter 1 Securing Stable Food Supplies
13
2020
Forest products Fisheries products 656.0
38.1
227.6
Agriculturalproducts
Source: Prepared by MAFF based on Trade Statistics by MOFNote: * indicates figures for 2020, plus small value cargo, etc.
807.1750.2745.1
611.7550.5
906.8 912.1
2014 2016 2018
921.764.3
Small value cargo, etc.
986.0
2012 2020*
449.7 (Unit: billion yen)
*Abbreviation for Global Farmers / Fishermen / Foresters / Food Manufacturers Project.
Due to the global spread of COVID-19,the export value of agricultural, forestry andfisheries products and foods decreased inthe first half of 2020, compared to the sameperiod in the previous year. However, theannual value was 921.7 billion yen, reachinga record high for the eighth consecutive year.The value of exports, including small valuecargo, etc., was 986.0 billion yen.
In April 2020, the government establishedthe Headquarters for the Export ofAgricultural, Forestry and Fishery Productsand Food as a command tower for exportpromotion and formulated a basic policy andaction plan to strategically and efficientlypromote exports.
Due to progress made in animal and plantquarantine consultations, the ban on exportsor the quarantine requirements had beenlifted for seven products from sevencountries/regions in FY2020. This includesthe abolition of the 30-month age limit onbeef destined for Macao, making it possibleto export top-quality, long-term fattened beef.
Of the 54 countries/regions thatintroduced import restrictions and/ormeasures in the wake of the TEPCOFukushima Daiichi nuclear power stationaccident, 39 countries/regions have removedtheir measures.
As of the end of FY2020, there were4,572 registrants for GFP*, which aims tosupport producers, etc. who are willing toengage in export and to promotecooperation among them. Also, 63 GFPglobal production areas that meet overseasneeds and regulations were adopted.
Month Destination country/region Product Contents
APRUSA Pear
Expansion of production areas and removal of restrictions on certain
varietiesMacau Chicken meat Lifting of export ban
MAY Thailand Citrus fruits
Elimination of joint export inspections in some production areas and
field inspection of citrus disease (SOS)
JUNMacau Beef Removal of the 30-month
age limit
Saudi Arabia Beef Lifting of export ban
AUG Australia Strawberries Lifting of export ban
OCT
EUBlack pine bonsai
(including Nishiki-matsu bonsai)
Lifting of export ban
Singapore Meat products
Lifting of export ban on the use of raw materials
imported from third countries
Promoting the exports of agricultural, forestryand fisheries products and foods
Export value of agricultural, forestry and fisheries products and foods
Chapter 1 Securing Stable Food Supplies
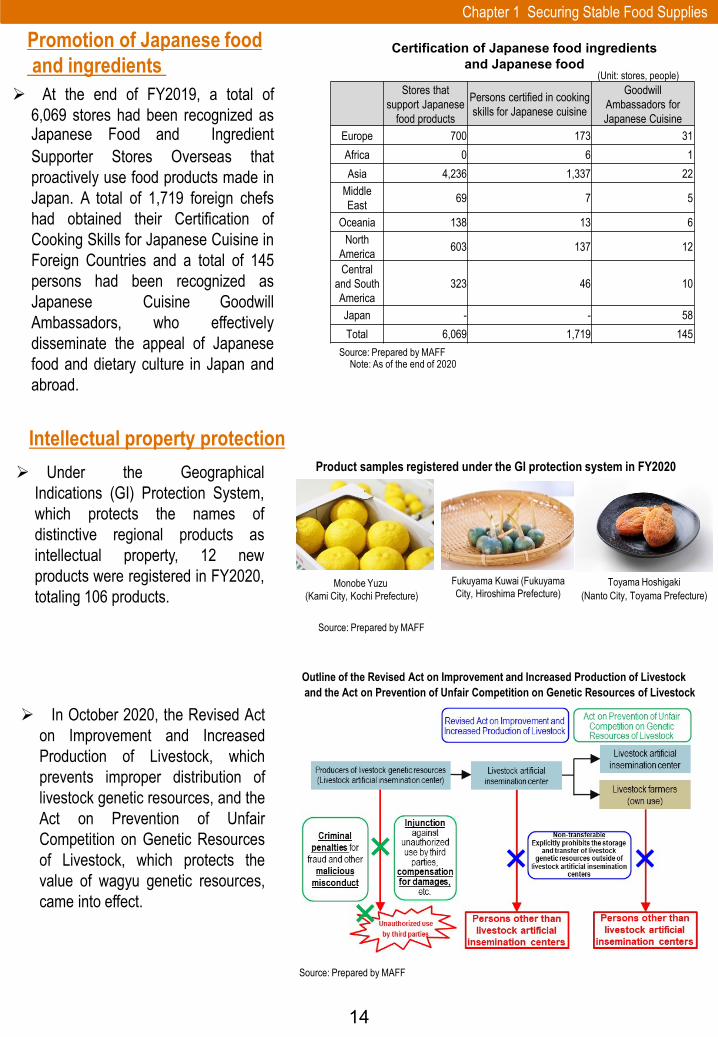
Outline of the Revised Act on Improvement and Increased Production of Livestockand the Act on Prevention of Unfair Competition on Genetic Resources of Livestock
Source: Prepared by MAFF
In October 2020, the Revised Acton Improvement and IncreasedProduction of Livestock, whichprevents improper distribution oflivestock genetic resources, and theAct on Prevention of UnfairCompetition on Genetic Resourcesof Livestock, which protects thevalue of wagyu genetic resources,came into effect.
14
Source: Prepared by MAFF
Product samples registered under the GI protection system in FY2020
Monobe Yuzu (Kami City, Kochi Prefecture)
Fukuyama Kuwai (Fukuyama City, Hiroshima Prefecture)
Toyama Hoshigaki(Nanto City, Toyama Prefecture)
Intellectual property protection Under the Geographical
Indications (GI) Protection System,which protects the names ofdistinctive regional products asintellectual property, 12 newproducts were registered in FY2020,totaling 106 products.
Promotion of Japanese foodand ingredients
At the end of FY2019, a total of6,069 stores had been recognized asJapanese Food and IngredientSupporter Stores Overseas thatproactively use food products made inJapan. A total of 1,719 foreign chefshad obtained their Certification ofCooking Skills for Japanese Cuisine inForeign Countries and a total of 145persons had been recognized asJapanese Cuisine GoodwillAmbassadors, who effectivelydisseminate the appeal of Japanesefood and dietary culture in Japan andabroad.
Certification of Japanese food ingredients and Japanese food
Stores that support Japanese
food products
Persons certified in cooking skills for Japanese cuisine
Goodwill Ambassadors for Japanese Cuisine
Europe 700 173 31Africa 0 6 1Asia 4,236 1,337 22
Middle East 69 7 5
Oceania 138 13 6North
America 603 137 12
Central and South America
323 46 10
Japan - - 58Total 6,069 1,719 145
Source: Prepared by MAFFNote: As of the end of 2020
(Unit: stores, people)

Chapter 1 Securing Stable Food Supplies
15
6. Promotion of shokuiku (food and nutrition education)
5. Deepening of the connection between consumers, food and agriculture
Efforts for local production for local consumption
Total sales value of farmer's market
Protection/transmission ofJapanese food culture
The total sales value of farmer's markets inFY2019 was 1,053.4 billion yen, down 2.4%from the previous year. The annual sales valueof farmer's markets, operated by agriculturalcooperatives, was 878 billion yen, accountingfor 80% of the total.
Kobayashi City, Miyazaki Prefecture, creates opportunities forlearning about local cuisine and healthy cooking through cookingclasses, etc.
<Case Study>Let's learn about "food" through hands-on experience (Miyazaki Prefecture)
In particular, the activities targetingelementary and junior high schoolstudents and their parents are designedto convey the origin of the names oflocal dishes. In addition, the programprovides opportunities to pass on foodculture and rediscover local attractions
Participants in the summer vacation parent-child challenge course
152.7 170.1 180.1 181.2 175.4
844.6 862.3 899.0 897.8 878.0
997.4 1032.4 1079.0 1078.9 1053.4
Agricultural management entities
(Unit: billion yen)
2016 2017 2018 2019
Agricultural cooperatives, etc.
FY2015
Source: Prepared by MAFF
In March 2021, the Fourth Basic Plan for thePromotion of shokuiku was established in light of thesituation surrounding shokuiku, such as the health of thecitizens, changes in the environment with regard to foodand nutrition, and the digitization of society. This plancovers approximately five years, from FY2021 toFY2025.
This plan focuses on the following three areas: (1)Promotion of shokuiku supporting lifetime physical andmental health, (2) Promotion of shokuiku supportingsustainable food and nutrition, and (3) Promotion ofshokuiku in response to the "new normal" anddigitalization.
The government added a new target for the guidanceon local products by diet and nutrition teachers. Also,more assignments of more diet and nutrition teacherswill be promoted.
The “Health Japan 21(the 2nd term)” and “200 gramsof Fruits Every Day!” recommend consumption of 350gof vegetables and 200g of fruits respectively. However,these recommendations have not been met (actualfigures were 280.5g for vegetables and 100.2g for fruitsas of 2019). In order to increase the intake, it isimportant to both promote and raise awareness amongconsumers.
Goals for shokuiku Promotion in the Fourth Basic Plan for the Promotion of shokuiku1. Increase the number of citizens who are interested in Shokuiku.2. Increase the number of "kyoshoku" occasions for breakfast or dinner with family
members.3. Increase the percentage of citizens participating in kyoshoku in communities as
they hope.4. Decrease the percentage of citizens skipping breakfast.5. Increase efforts to use local products in school lunches, etc.6. Increase the number of citizens who adopt dietary habits in consideration of
balanced nutrition.7. Increase the percentage of citizens who put into practice a healthy diet from day
to day where they take care to maintain an appropriate weight and limit salt intake in order to prevent or treat noncommunicable diseases.
8. Increase the percentage of citizens who take time to eat and chew well.9. Increase the number of volunteers engaging in the promotion of shokuiku.10. Increase the number of citizens who have agriculture, forestry, or fishery
experience.11. Increase the number of citizens who choose agricultural, forestry, and fishery
products and foods with an awareness of production areas and the producers.12. Increase the number of citizens who choose environmentally friendly
agricultural, forestry, and fishery products and foods.13. Increase the number of citizens who take action to reduce food loss and waste.14. Increase the percentage of citizens who have received and pass on traditional
cuisines and table manners from their communities or families.15. Increase the percentage of citizens who have basic knowledge on food safety
and are able to make appropriate decisions based on it.16. Increase the percentage of municipalities that have created and implemented
the Municipal Plan for the Promotion of Shokuiku.
Additional and expanded goals
Source: Prepared by MAFF, “Comprehensive Survey on AFFrinnovation"Note: "Agricultural cooperatives, etc." refers to agricultural cooperatives, local governments, the
third sector, producer groups, etc.
Information on 17 prefectures was addedto the database "Our Regional Cuisines -Beloved tastes and flavors we want to passon to the next generation" which containsinformation on the histories, origins, andrecipes of regional cuisines selected by eachregion, thus providing information on 27prefectures.

16
Chapter 1 Securing Stable Food Supplies
8. Strengthen measures for animal and plant quarantine
Source: Prepared by MAFF
Locations of avian influenza outbreaks
Avian influenza
⑮⑱⑲㉝ ㉔㉚ ㉔’ ㉔’
㉖’
㉗⑪⑫㉖
⑨
⑳⑳’ ⑳’ ⑩⑰⑰’ ㉒㉒’ ㉓
⑯㉑
⑥’⑥’ ⑥’⑥’ ㉘’⑬’
➀③④⑤⑥⑦⑧⑬⑭㉕㉘㉛
➁㉙
㉜㉟
㉞
㊱
㊲㊴㊷㊻㊽㊾㊿
㊲’
㊲’
㊲’ ㊲’
㊲’㊲’
㊲’
㊲’ ㊲’
㊳
㊵㊺
㊶
㊷’
㊴’㊸
㊹
㊼
51
52
Source: Prepared by MAFF, based on data from the Consumer Affairs Agency
Source: Prepared by MAFFNotes: 1) As of the end of March 2021
2) Numbers indicate the order of occurrence. Numbers in red indicate farms where outbreaks occurred. The numbers in blue, which are the same as the numbers in red, mean farms where some poultry were culled, identified as “animals suspected to be affected” since epidemiological linkage with affected farms were confirmed, such as movement of poultry, etc.
In November 2020, an outbreak of highlypathogenic avian influenza occurred inKagawa Prefecture for the first time in aboutthree years, and as of the end of March 2021,52 cases had been confirmed on farms in 18prefectures.
SDF cooperated in the culling in affectedfarms in response to requests (28 times as ofthe end of March 2021).
The government notified prefectures acrossthe country to (1) conduct simultaneouschecking for appropriate biosecuritymanagement, (2) conduct simultaneousemergency disinfection nationwide, and (3)conduct emergency quarantine exercises.
Detailed information was disseminatedincluding leaflets with easy-to-understandexplanations of the arrival statuses of wildbirds and the seasonal nature of the virus.
Based on scientific evidence, MAFFdevelops and disseminates measures forpreventing and reducing chemical /microbiological hazards in food at necessarystages throughout the food chain from farm totable.
The Food Labeling Standards were revisedin March 2021 to enable the labeling ofunpolished or polished rice to indicate theplace of production, variety, and year ofproduction, even if the rice has not beencertified by Agricultural products inspection.
7. Ensuring food safety and consumer confidence takinginternational activities into consideration
Example of measures to reduce chemical hazards in food

17
Chapter 1 Securing Stable Food Supplies
The first outbreak of CSF in Japan in 26years occurred in September 2018, with 63cases reported in farms in 12 prefectures asof the end of March 2021.
Based on the Specific Domestic AnimalInfectious Disease Quarantine Guidelinesfor Classical Swine Fever (CSF), thegovernment has designated 30 prefecturesas recommended vaccination areas as ofthe end of March 2021.
A revision of the Biosecurity Standardshas been implemented, includingmandatory measures to establish a manualof biosecurity management at each farm, toprevent wildlife from entering, and stricterheating standards for eco-feed.
Source: Prepared by MAFFNotes: 1) As of the end of March 2021
2) Numbers indicate the order of occurrence. Numbers indicate farms where outbreaks occurred in rearing swine. Alphabetical marks indicate where some pigs were culled, identified as “animals suspected to be affected” since epidemiological linkage with affected farms were confirmed, such as movement of pigs, etc.
CSF (classical swine fever)
A detector dog for animal and plant quarantine
In March 2020, the Act on Domestic AnimalInfectious Diseases Control was partially revised forthe purpose of preventing the introduction oftransboundary animal diseases such as foot-and-mouth disease (FMD) and highly pathogenic avianinfluenza (HPAI) from overseas, both of which haveenormous impacts on the livestock industry. Thequarantine system was strengthened by increasing thenumber of animal quarantine officers and quarantinedetector dogs.
To prevent the entry/spread of plant diseases andpests in Japan, quarantine inspections on importedplants, surveys around points of entry, and emergencycontrol of the entered pests have been implemented.
Since June 2020, a number of detections ofOriental fruit flies (a serious threat to citrus fruit) havebeen reported in Kagoshima prefecture, etc. Inresponse, MAFF, in cooperation with the prefectures,implemented control measures such as installations ofplates that attract and kill male adults.
Plate for attracting and killing adult male Oriental fruit flies

18
Chapter 1 Securing Stable Food Supplies
Understanding and analyzing internationalfood supply and demand
Securing a stable supply of importedgrain and food Japan's agricultural imports in 2020 were
6,212.5 billion yen, year on year decrease of5.8%.
The government has maintained andstrengthened good relations with importpartner countries and collected relevantinformation in order to ensure the stablesupply of the imported major agriculturalproducts upon which Japan depends.
The world grain production increased forthe third consecutive year, mainly due togrowth in crop yields. Consumptionincreased due to population growth, higherincome levels, etc.
The world’s population is projected togrow from 7.8 billion in 2020 to 9.74 billion*by 2050
It is necessary to take all possiblemeasures to ensure food security based onthe trends of international supply anddemand due to the instability of global foodsupply and demand.
*Source: World Population Prospects 2019, United Nations
Source: Based on Trade Statistics by MOFNotes: 1) Final results for CY2020
2) Figures in parentheses are year-on-year basis.
Source: Prepared by MAFF based on “PS&D” and “World Agricultural Supply and Demand Estimates” by USDA (as of March 2021)
Note: 1) Grains are the sum of wheat, coarse grains (corn, barley, etc.), and rice (milled rice)2) Term-end inventory rate = Term-end inventory quantity / Consumption quantity x 100
Global grain production, consumption, term-end inventory rate
9. Establishing comprehensive food security in anticipation of food supply risks
Efforts to prepare for unexpected events in normal times
30.3
19.4 17.0 20.3 21.0 30.1 31.6 29.1
20.3
22.4 24.6
27.4
20.2 22.1
25.2 27.3
2000/01 2005/06 2010/11 2015/16 2020/21
Production
%Consumption
Term-end inventory rate
2006/07 2012/13 2017/18FY
1.87 billion t
1.85 billion t
Japan's overall import ratio of agricultural products by country
Japan's status of EPAs/FTAs, etc.
USA21.9
China10.6
Canada6.6
Thailand6.5 Australia
6.4
Brazil5.2
Others42.7 Import value
6,212.5 billion yen(Down 5.8%)
%
In FY2020, the government conducted risk analyses and assessments of food security for three risk categories:large-scale natural disasters, extreme weather events, infectious diseases in livestock, and new infectiousdiseases such as COVID-19.
In January 2021, "contagious disease epidemics" was added to the "Food Security Guideline in case ofEmergency" as a risk affecting food supply.
10. Status of international negotiations
As of the end of FY2020, 21EPAs/FTAs, etc. have been put intoforce or signed.
In November 2020, the RCEPAgreement was signed, and inJanuary 2021, the UK-Japan EPAcame into effect.
*The Japan-United States Trade Agreement between Japan and the United States came into effect on January 1, 2020.
Source: Prepared by MAFFNote:As of the end of MAR 2021