Embed Size (px)
Citation preview

What is Statistics?Analyzing Distributions
Chapter 1: Picturing Distributions with Graphs
Math 2200: Elementary Statistics
June 24, 2013
Moore Chapter 1
What is Statistics?Analyzing Distributions
The Basic DefinitionsQualitative vs. QuantitativeDiscrete and Continuous Data
The Foundation
Statistics is the science of the collection, analysis, andpresentation of data.
The objects described by a set of data are called individuals.
A variable describes some characteristic of an individual.
Moore Chapter 1
What is Statistics?Analyzing Distributions
The Basic DefinitionsQualitative vs. QuantitativeDiscrete and Continuous Data
Identifying Individuals and Variables
Suppose you wish to collect data from the graduates of ArmstrongAtlantic State University that majored in mathematics with a focuson statistics. You want to find the industry in which theaforementioned graduates were employed. The responses includedgenetics, risk assessment, law, insurance, marketing, andpharmacology.
What are the individuals in this data set?
The individuals are the graduates of Armstrong Atlantic StateUniversity that majored in mathematics with a focus onstatistics.
For each individual, what is the variable?
The variable is the industry in which the graduates areemployed.
Moore Chapter 1

What is Statistics?Analyzing Distributions
The Basic DefinitionsQualitative vs. QuantitativeDiscrete and Continuous Data
Understanding Individuals and Variables
Must individuals always be represented by people?
No, individuals can be people, but individuals could also bedogs, lions, tigers, bears, stocks, bonds, candles, years,televisions, trees, crayons, etc.
Does each individual have only one associated variable?
Actually, for each individual, the data give values for one ormore variables.
An example of an individual that could havemore than one variable can be seen in collecting data ofpeople entering the emergency room. Variables could includesex, height, weight, systolic pressure, diastolic pressure, pulse,and temperature.
Moore Chapter 1

What is Statistics?Analyzing Distributions
The Basic DefinitionsQualitative vs. QuantitativeDiscrete and Continuous Data
Understanding Individuals and Variables
Must individuals always be represented by people?
No, individuals can be people, but individuals could also bedogs, lions, tigers, bears, stocks, bonds, candles, years,televisions, trees, crayons, etc.
Does each individual have only one associated variable?
Actually, for each individual, the data give values for one ormore variables. An example of an individual that could havemore than one variable can be seen in collecting data ofpeople entering the emergency room. Variables could includesex, height, weight, systolic pressure, diastolic pressure, pulse,and temperature.
Moore Chapter 1
What is Statistics?Analyzing Distributions
The Basic DefinitionsQualitative vs. QuantitativeDiscrete and Continuous Data
Types of Variables
Two types of variables are qualitative (categorical) andquantitative (numerical).
A qualitative (categorical) variable places each individualinto a category.
A quantitative (numerical) variable has numerical valuesthat measure some characteristic of each individual.
Moore Chapter 1
What is Statistics?Analyzing Distributions
The Basic DefinitionsQualitative vs. QuantitativeDiscrete and Continuous Data
Distinguishing Between Qualitative and QuantitativeVariables
Recall the example that collected data from the graduates ofArmstrong Atlantic State University that majored in mathematicswith a focus on statistics. We then found the industry in which theaforementioned graduates were employed.Question: What type of variable is the industry in which thegraduates are employed?
Answer: The industry in which the graduates are employed is aqualitative variable with the categories being genetics, riskassessment, law, insurance, marketing, and pharmacology (thesewere the responses given in the original experiment).
Moore Chapter 1

What is Statistics?Analyzing Distributions
The Basic DefinitionsQualitative vs. QuantitativeDiscrete and Continuous Data
Distinguishing Between Qualitative and QuantitativeVariables
Recall the example that collected data from the graduates ofArmstrong Atlantic State University that majored in mathematicswith a focus on statistics. We then found the industry in which theaforementioned graduates were employed.Question: What type of variable is the industry in which thegraduates are employed?Answer: The industry in which the graduates are employed is aqualitative variable with the categories being genetics, riskassessment, law, insurance, marketing, and pharmacology (thesewere the responses given in the original experiment).
Moore Chapter 1
What is Statistics?Analyzing Distributions
The Basic DefinitionsQualitative vs. QuantitativeDiscrete and Continuous Data
Identifying Variables
Now consider the example of an individual entering the emergencyroom with variables being sex, height, weight, systolic pressure,diastolic pressure, pulse, and temperature.
Question: What are the qualitative variables?Answer: Sex is the only qualitative variable with the categoriesbeing male or female. Height, weight, systolic pressure, diastolicpressure, pulse, and temperature all given numerical values asoutputs, implying these variables are all quantitative.
Moore Chapter 1

What is Statistics?Analyzing Distributions
The Basic DefinitionsQualitative vs. QuantitativeDiscrete and Continuous Data
Identifying Variables
Now consider the example of an individual entering the emergencyroom with variables being sex, height, weight, systolic pressure,diastolic pressure, pulse, and temperature.Question: What are the qualitative variables?
Answer: Sex is the only qualitative variable with the categoriesbeing male or female. Height, weight, systolic pressure, diastolicpressure, pulse, and temperature all given numerical values asoutputs, implying these variables are all quantitative.
Moore Chapter 1
What is Statistics?Analyzing Distributions
The Basic DefinitionsQualitative vs. QuantitativeDiscrete and Continuous Data
Identifying Variables
Now consider the example of an individual entering the emergencyroom with variables being sex, height, weight, systolic pressure,diastolic pressure, pulse, and temperature.Question: What are the qualitative variables?Answer: Sex is the only qualitative variable with the categoriesbeing male or female.
Height, weight, systolic pressure, diastolicpressure, pulse, and temperature all given numerical values asoutputs, implying these variables are all quantitative.
Moore Chapter 1
What is Statistics?Analyzing Distributions
The Basic DefinitionsQualitative vs. QuantitativeDiscrete and Continuous Data
Identifying Variables
Now consider the example of an individual entering the emergencyroom with variables being sex, height, weight, systolic pressure,diastolic pressure, pulse, and temperature.Question: What are the qualitative variables?Answer: Sex is the only qualitative variable with the categoriesbeing male or female. Height, weight, systolic pressure, diastolicpressure, pulse, and temperature all given numerical values asoutputs, implying these variables are all quantitative.
Moore Chapter 1
What is Statistics?Analyzing Distributions
The Basic DefinitionsQualitative vs. QuantitativeDiscrete and Continuous Data
Discrete and Continuous Data
Definition
A data set is called discrete if there are only a finite number ofvalues possible or if there is a space on the number line betweeneach two possible values.
Definition
A data set is called continuous if the values belonging to it maytake on any value within a finite or infinite interval.
Moore Chapter 1

What is Statistics?Analyzing Distributions
The Basic DefinitionsQualitative vs. QuantitativeDiscrete and Continuous Data
Differences of Discrete and Continuous Data
Suppose you want to collect data on the city of Savannah. Theinformation you wish to collect about the city involves the numberof people, the average height above sea level, and the age of theoldest building.
Determine the discrete and continuous data of theprevious experiment.
The discrete data is given by the number of people inSavannah since we can just count the people in a city.
The average height above sea level and age of the oldestbuilding are continuous data since the height and age aredependent upon the accuracy of our measuring device. Forexample, all of the following could be valid measurementsabove sea level: 38 inches, 38.2 inches, 38.24 inches, or38.249 inches. Meanwhile, the age is dependent uponmeasurements in terms of years, days, or seconds.
Moore Chapter 1
What is Statistics?Analyzing Distributions
The Basic DefinitionsQualitative vs. QuantitativeDiscrete and Continuous Data
Differences of Discrete and Continuous Data
Suppose you want to collect data on the city of Savannah. Theinformation you wish to collect about the city involves the numberof people, the average height above sea level, and the age of theoldest building. Determine the discrete and continuous data of theprevious experiment.
The discrete data is given by the number of people inSavannah since we can just count the people in a city.
The average height above sea level and age of the oldestbuilding are continuous data since the height and age aredependent upon the accuracy of our measuring device. Forexample, all of the following could be valid measurementsabove sea level: 38 inches, 38.2 inches, 38.24 inches, or38.249 inches. Meanwhile, the age is dependent uponmeasurements in terms of years, days, or seconds.
Moore Chapter 1
What is Statistics?Analyzing Distributions
The Basic DefinitionsQualitative vs. QuantitativeDiscrete and Continuous Data
Differences of Discrete and Continuous Data
Suppose you want to collect data on the city of Savannah. Theinformation you wish to collect about the city involves the numberof people, the average height above sea level, and the age of theoldest building. Determine the discrete and continuous data of theprevious experiment.
The discrete data is given by the number of people inSavannah since we can just count the people in a city.
The average height above sea level and age of the oldestbuilding are continuous data since the height and age aredependent upon the accuracy of our measuring device.
Forexample, all of the following could be valid measurementsabove sea level: 38 inches, 38.2 inches, 38.24 inches, or38.249 inches. Meanwhile, the age is dependent uponmeasurements in terms of years, days, or seconds.
Moore Chapter 1
What is Statistics?Analyzing Distributions
The Basic DefinitionsQualitative vs. QuantitativeDiscrete and Continuous Data
Differences of Discrete and Continuous Data
Suppose you want to collect data on the city of Savannah. Theinformation you wish to collect about the city involves the numberof people, the average height above sea level, and the age of theoldest building. Determine the discrete and continuous data of theprevious experiment.
The discrete data is given by the number of people inSavannah since we can just count the people in a city.
The average height above sea level and age of the oldestbuilding are continuous data since the height and age aredependent upon the accuracy of our measuring device. Forexample, all of the following could be valid measurementsabove sea level: 38 inches, 38.2 inches, 38.24 inches, or38.249 inches.
Meanwhile, the age is dependent uponmeasurements in terms of years, days, or seconds.
Moore Chapter 1
What is Statistics?Analyzing Distributions
The Basic DefinitionsQualitative vs. QuantitativeDiscrete and Continuous Data
Differences of Discrete and Continuous Data
Suppose you want to collect data on the city of Savannah. Theinformation you wish to collect about the city involves the numberof people, the average height above sea level, and the age of theoldest building. Determine the discrete and continuous data of theprevious experiment.
The discrete data is given by the number of people inSavannah since we can just count the people in a city.
The average height above sea level and age of the oldestbuilding are continuous data since the height and age aredependent upon the accuracy of our measuring device. Forexample, all of the following could be valid measurementsabove sea level: 38 inches, 38.2 inches, 38.24 inches, or38.249 inches. Meanwhile, the age is dependent uponmeasurements in terms of years, days, or seconds.
Moore Chapter 1

What is Statistics?Analyzing Distributions
What is a Distribution?Distribution of a Categorical VariableDistribution of a Quantitative Variable
Describing Distributions
Definition
The distribution of a variable describes what values the variabletakes and how often it takes these values.
We often use pictures to help us describe the distribution of avariable.
Moore Chapter 1

What is Statistics?Analyzing Distributions
What is a Distribution?Distribution of a Categorical VariableDistribution of a Quantitative Variable
Distribution of Categorical Variables
The distribution of a categorical variable lists the categories andgives either the count (frequency) or the percent (relativefrequency) of individuals who fall in each category.
The distribution of a categorical variable can be given in the formof a frequency table or a relative frequency table.
Moore Chapter 1

What is Statistics?Analyzing Distributions
What is a Distribution?Distribution of a Categorical VariableDistribution of a Quantitative Variable
Frequency and Relative Frequency
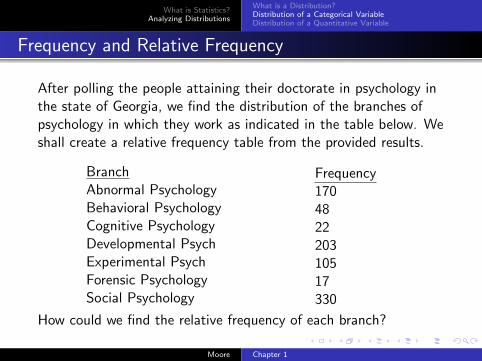
After polling the people attaining their doctorate in psychology inthe state of Georgia, we find the distribution of the branches ofpsychology in which they work as indicated in the table below. Weshall create a relative frequency table from the provided results.
BranchAbnormal PsychologyBehavioral PsychologyCognitive PsychologyDevelopmental PsychExperimental PsychForensic PsychologySocial Psychology
Frequency170482220310517330
How could we find the relative frequency of each branch?
Moore Chapter 1
What is Statistics?Analyzing Distributions
What is a Distribution?Distribution of a Categorical VariableDistribution of a Quantitative Variable
Frequency and Relative Frequency
After polling the people attaining their doctorate in psychology inthe state of Georgia, we find the distribution of the branches ofpsychology in which they work as indicated in the table below. Weshall create a relative frequency table from the provided results.
BranchAbnormal PsychologyBehavioral PsychologyCognitive PsychologyDevelopmental PsychExperimental PsychForensic PsychologySocial Psychology
Frequency170482220310517330
How could we find the relative frequency of each branch?
Moore Chapter 1
What is Statistics?Analyzing Distributions
What is a Distribution?Distribution of a Categorical VariableDistribution of a Quantitative Variable
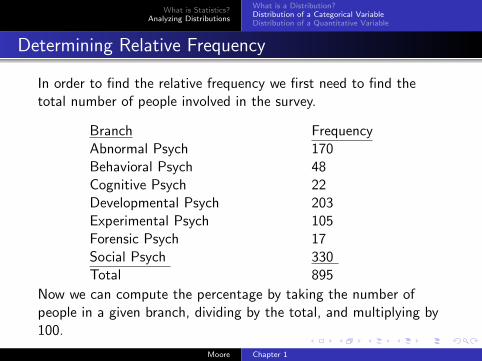
Determining Relative Frequency
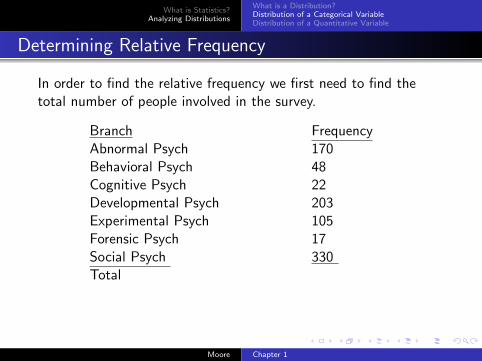
In order to find the relative frequency we first need to find thetotal number of people involved in the survey.
BranchAbnormal PsychBehavioral PsychCognitive PsychDevelopmental PsychExperimental PsychForensic PsychSocial PsychTotal
Frequency170482220310517330895
Now we can compute the percentage by taking the number ofpeople in a given branch, dividing by the total, and multiplying by100.
Moore Chapter 1
What is Statistics?Analyzing Distributions
What is a Distribution?Distribution of a Categorical VariableDistribution of a Quantitative Variable
Determining Relative Frequency
In order to find the relative frequency we first need to find thetotal number of people involved in the survey.
BranchAbnormal PsychBehavioral PsychCognitive PsychDevelopmental PsychExperimental PsychForensic PsychSocial PsychTotal
Frequency170482220310517330
895
Now we can compute the percentage by taking the number ofpeople in a given branch, dividing by the total, and multiplying by100.
Moore Chapter 1

What is Statistics?Analyzing Distributions
What is a Distribution?Distribution of a Categorical VariableDistribution of a Quantitative Variable
Determining Relative Frequency
In order to find the relative frequency we first need to find thetotal number of people involved in the survey.
BranchAbnormal PsychBehavioral PsychCognitive PsychDevelopmental PsychExperimental PsychForensic PsychSocial PsychTotal
Frequency170482220310517330895
Now we can compute the percentage by taking the number ofpeople in a given branch, dividing by the total, and multiplying by100.
Moore Chapter 1
What is Statistics?Analyzing Distributions
What is a Distribution?Distribution of a Categorical VariableDistribution of a Quantitative Variable
Determining Relative Frequency
In order to find the relative frequency we first need to find thetotal number of people involved in the survey.
BranchAbnormal PsychBehavioral PsychCognitive PsychDevelopmental PsychExperimental PsychForensic PsychSocial PsychTotal
Frequency170482220310517330895
Now we can compute the percentage by taking the number ofpeople in a given branch, dividing by the total, and multiplying by100.
Moore Chapter 1
What is Statistics?Analyzing Distributions
What is a Distribution?Distribution of a Categorical VariableDistribution of a Quantitative Variable
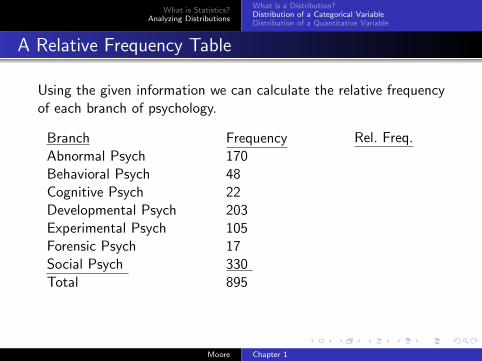
A Relative Frequency Table
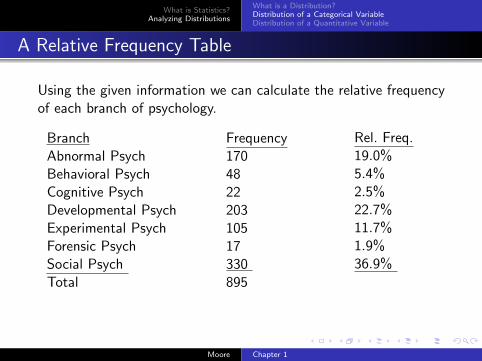
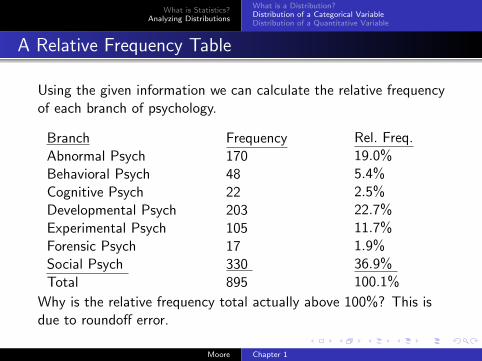
Using the given information we can calculate the relative frequencyof each branch of psychology.
BranchAbnormal PsychBehavioral PsychCognitive PsychDevelopmental PsychExperimental PsychForensic PsychSocial PsychTotal
Frequency170482220310517330895
Rel. Freq.
19.0%5.4%2.5%22.7%11.7%1.9%36.9%100.1%
Why is the relative frequency total actually above 100%? This isdue to roundoff error.
Moore Chapter 1

What is Statistics?Analyzing Distributions
What is a Distribution?Distribution of a Categorical VariableDistribution of a Quantitative Variable
A Relative Frequency Table
Using the given information we can calculate the relative frequencyof each branch of psychology.
BranchAbnormal PsychBehavioral PsychCognitive PsychDevelopmental PsychExperimental PsychForensic PsychSocial PsychTotal
Frequency170482220310517330895
Rel. Freq.19.0%
5.4%2.5%22.7%11.7%1.9%36.9%100.1%
Why is the relative frequency total actually above 100%? This isdue to roundoff error.
Moore Chapter 1
What is Statistics?Analyzing Distributions
What is a Distribution?Distribution of a Categorical VariableDistribution of a Quantitative Variable
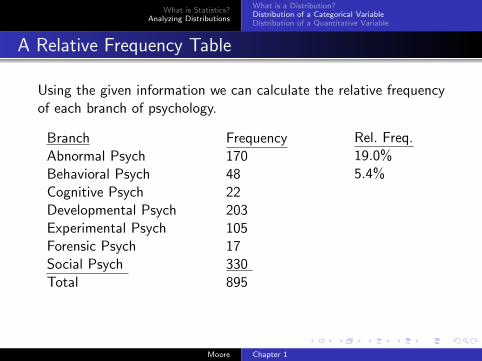
A Relative Frequency Table
Using the given information we can calculate the relative frequencyof each branch of psychology.
BranchAbnormal PsychBehavioral PsychCognitive PsychDevelopmental PsychExperimental PsychForensic PsychSocial PsychTotal
Frequency170482220310517330895
Rel. Freq.19.0%5.4%
2.5%22.7%11.7%1.9%36.9%100.1%
Why is the relative frequency total actually above 100%? This isdue to roundoff error.
Moore Chapter 1

What is Statistics?Analyzing Distributions
What is a Distribution?Distribution of a Categorical VariableDistribution of a Quantitative Variable
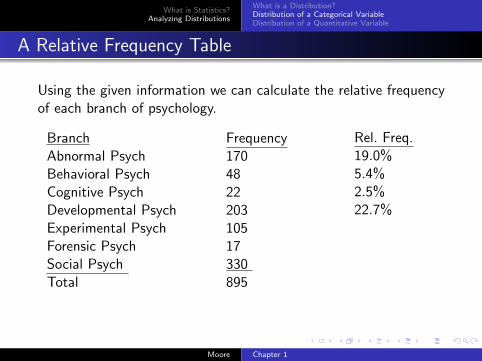
A Relative Frequency Table
Using the given information we can calculate the relative frequencyof each branch of psychology.
BranchAbnormal PsychBehavioral PsychCognitive PsychDevelopmental PsychExperimental PsychForensic PsychSocial PsychTotal
Frequency170482220310517330895
Rel. Freq.19.0%5.4%2.5%
22.7%11.7%1.9%36.9%100.1%
Why is the relative frequency total actually above 100%? This isdue to roundoff error.
Moore Chapter 1
What is Statistics?Analyzing Distributions
What is a Distribution?Distribution of a Categorical VariableDistribution of a Quantitative Variable
A Relative Frequency Table
Using the given information we can calculate the relative frequencyof each branch of psychology.
BranchAbnormal PsychBehavioral PsychCognitive PsychDevelopmental PsychExperimental PsychForensic PsychSocial PsychTotal
Frequency170482220310517330895
Rel. Freq.19.0%5.4%2.5%22.7%
11.7%1.9%36.9%100.1%
Why is the relative frequency total actually above 100%? This isdue to roundoff error.
Moore Chapter 1

What is Statistics?Analyzing Distributions
What is a Distribution?Distribution of a Categorical VariableDistribution of a Quantitative Variable
A Relative Frequency Table
Using the given information we can calculate the relative frequencyof each branch of psychology.
BranchAbnormal PsychBehavioral PsychCognitive PsychDevelopmental PsychExperimental PsychForensic PsychSocial PsychTotal
Frequency170482220310517330895
Rel. Freq.19.0%5.4%2.5%22.7%11.7%
1.9%36.9%100.1%
Why is the relative frequency total actually above 100%? This isdue to roundoff error.
Moore Chapter 1

What is Statistics?Analyzing Distributions
What is a Distribution?Distribution of a Categorical VariableDistribution of a Quantitative Variable
A Relative Frequency Table
Using the given information we can calculate the relative frequencyof each branch of psychology.
BranchAbnormal PsychBehavioral PsychCognitive PsychDevelopmental PsychExperimental PsychForensic PsychSocial PsychTotal
Frequency170482220310517330895
Rel. Freq.19.0%5.4%2.5%22.7%11.7%1.9%
36.9%100.1%
Why is the relative frequency total actually above 100%? This isdue to roundoff error.
Moore Chapter 1
What is Statistics?Analyzing Distributions
What is a Distribution?Distribution of a Categorical VariableDistribution of a Quantitative Variable
A Relative Frequency Table
Using the given information we can calculate the relative frequencyof each branch of psychology.
BranchAbnormal PsychBehavioral PsychCognitive PsychDevelopmental PsychExperimental PsychForensic PsychSocial PsychTotal
Frequency170482220310517330895
Rel. Freq.19.0%5.4%2.5%22.7%11.7%1.9%36.9%
100.1%
Why is the relative frequency total actually above 100%? This isdue to roundoff error.
Moore Chapter 1

What is Statistics?Analyzing Distributions
What is a Distribution?Distribution of a Categorical VariableDistribution of a Quantitative Variable
A Relative Frequency Table
Using the given information we can calculate the relative frequencyof each branch of psychology.
BranchAbnormal PsychBehavioral PsychCognitive PsychDevelopmental PsychExperimental PsychForensic PsychSocial PsychTotal
Frequency170482220310517330895
Rel. Freq.19.0%5.4%2.5%22.7%11.7%1.9%36.9%100.1%
Why is the relative frequency total actually above 100%?
This isdue to roundoff error.
Moore Chapter 1
What is Statistics?Analyzing Distributions
What is a Distribution?Distribution of a Categorical VariableDistribution of a Quantitative Variable
A Relative Frequency Table
Using the given information we can calculate the relative frequencyof each branch of psychology.
BranchAbnormal PsychBehavioral PsychCognitive PsychDevelopmental PsychExperimental PsychForensic PsychSocial PsychTotal
Frequency170482220310517330895
Rel. Freq.19.0%5.4%2.5%22.7%11.7%1.9%36.9%100.1%
Why is the relative frequency total actually above 100%? This isdue to roundoff error.
Moore Chapter 1
What is Statistics?Analyzing Distributions
What is a Distribution?Distribution of a Categorical VariableDistribution of a Quantitative Variable
Picturing Distributions of Qualitative Variables
Pie charts and bar graphs display the distribution of a qualitativevariable.
Definition
A pie chart is a circular chart that is divided into sectors, whichindicates the proportion of a given category.
Definition
A bar graph is a chart with rectangular bars with lengthsproportional to the values each category represents.
Moore Chapter 1
What is Statistics?Analyzing Distributions
What is a Distribution?Distribution of a Categorical VariableDistribution of a Quantitative Variable
Pie Charts
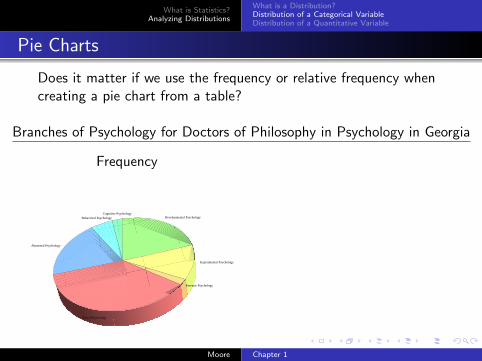
Does it matter if we use the frequency or relative frequency whencreating a pie chart from a table?
Branches of Psychology for Doctors of Philosophy in Psychology in Georgia
Frequency
Abnormal Psychology
Behavioral PsychologyCognitive Psychology
Developmental Psychology
Experimental Psychology
Forensic Psychology
Social Psychology
Relative Frequency
Abnormal Psychology
Behavioral PsychologyCognitive Psychology
Developmental Psychology
Experimental Psychology
Forensic Psychology
Social Psychology
Moore Chapter 1

What is Statistics?Analyzing Distributions
What is a Distribution?Distribution of a Categorical VariableDistribution of a Quantitative Variable
Pie Charts
Does it matter if we use the frequency or relative frequency whencreating a pie chart from a table?
Branches of Psychology for Doctors of Philosophy in Psychology in Georgia
Frequency
Abnormal Psychology
Behavioral PsychologyCognitive Psychology
Developmental Psychology
Experimental Psychology
Forensic Psychology
Social Psychology
Relative Frequency
Abnormal Psychology
Behavioral PsychologyCognitive Psychology
Developmental Psychology
Experimental Psychology
Forensic Psychology
Social Psychology
Moore Chapter 1
What is Statistics?Analyzing Distributions
What is a Distribution?Distribution of a Categorical VariableDistribution of a Quantitative Variable
Bar Graphs
Since pie charts and bar graphs both display distribution of aqualitative variable, we can use a bar graph to display theinformation depicted in the previous slide.
0
100
200
300
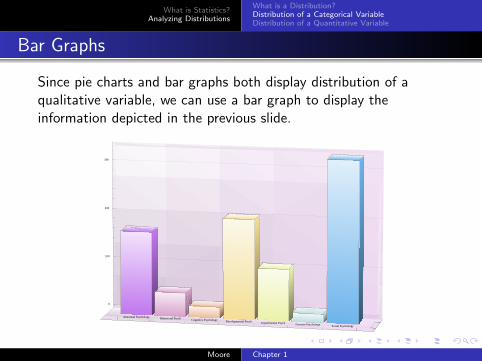
Abnormal Psychology Behavioral Psych Cognitive Psychology Developmental Psych Experimental Psych Forensic Psychology Social Psychology
Moore Chapter 1
What is Statistics?Analyzing Distributions
What is a Distribution?Distribution of a Categorical VariableDistribution of a Quantitative Variable
Bar Graphs
Since pie charts and bar graphs both display distribution of aqualitative variable, we can use a bar graph to display theinformation depicted in the previous slide.
0
100
200
300
Abnormal Psychology Behavioral Psych Cognitive Psychology Developmental Psych Experimental Psych Forensic Psychology Social Psychology
Moore Chapter 1

What is Statistics?Analyzing Distributions
What is a Distribution?Distribution of a Categorical VariableDistribution of a Quantitative Variable
Differences Between Pie Charts and Bar Graphs
The Good, The Bad, and The Ugly
Although both pie charts and bar graphs allow us to display thedistribution of a qualitative variable, a bar graph allows us tocompare the actual values between different categories whereas apie chart can only display the proportions.
Moore Chapter 1
What is Statistics?Analyzing Distributions
What is a Distribution?Distribution of a Categorical VariableDistribution of a Quantitative Variable
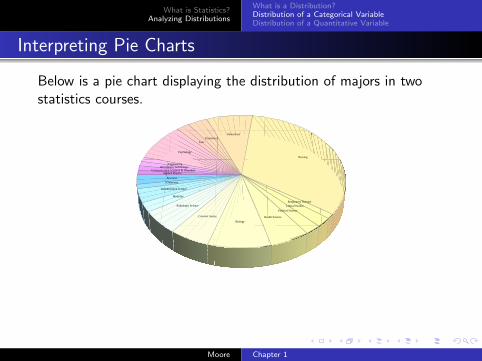
Interpreting Pie Charts
Below is a pie chart displaying the distribution of majors in twostatistics courses.
Applied PhysicsCommunication Sciences & Disorders
Information TechnologyEngineering
Psychology
LawEconomics
Undeclared
Nursing
Respiratory Therapy
Liberal Studies
Political Science
Health Science
Biology
Criminal Justice
Radiologic Science
Medicine
Rehabilitation Science
Chemistry
Business
Question: Which major has the most students in these twostatistics courses? Answer: Nursing has the most students inthese two courses.
Moore Chapter 1

What is Statistics?Analyzing Distributions
What is a Distribution?Distribution of a Categorical VariableDistribution of a Quantitative Variable
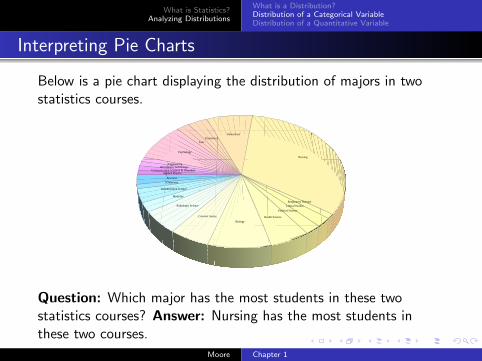
Interpreting Pie Charts
Below is a pie chart displaying the distribution of majors in twostatistics courses.
Applied PhysicsCommunication Sciences & Disorders
Information TechnologyEngineering
Psychology
LawEconomics
Undeclared
Nursing
Respiratory Therapy
Liberal Studies
Political Science
Health Science
Biology
Criminal Justice
Radiologic Science
Medicine
Rehabilitation Science
Chemistry
Business
Question: Which major has the most students in these twostatistics courses?
Answer: Nursing has the most students inthese two courses.
Moore Chapter 1
What is Statistics?Analyzing Distributions
What is a Distribution?Distribution of a Categorical VariableDistribution of a Quantitative Variable
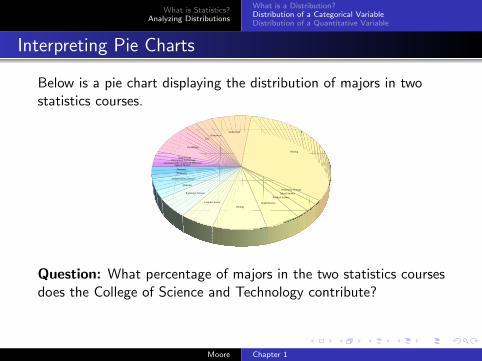
Interpreting Pie Charts
Below is a pie chart displaying the distribution of majors in twostatistics courses.
Applied PhysicsCommunication Sciences & Disorders
Information TechnologyEngineering
Psychology
LawEconomics
Undeclared
Nursing
Respiratory Therapy
Liberal Studies
Political Science
Health Science
Biology
Criminal Justice
Radiologic Science
Medicine
Rehabilitation Science
Chemistry
Business
Question: Which major has the most students in these twostatistics courses? Answer: Nursing has the most students inthese two courses.
Moore Chapter 1
What is Statistics?Analyzing Distributions
What is a Distribution?Distribution of a Categorical VariableDistribution of a Quantitative Variable
Interpreting Pie Charts
Below is a pie chart displaying the distribution of majors in twostatistics courses.
Applied PhysicsCommunication Sciences & Disorders
Information TechnologyEngineering
Psychology
LawEconomics
Undeclared
Nursing
Respiratory Therapy
Liberal Studies
Political Science
Health Science
Biology
Criminal Justice
Radiologic Science
Medicine
Rehabilitation Science
Chemistry
Business
Question: What percentage of majors in the two statistics coursesdoes the College of Science and Technology contribute?
Answer:It is extremely difficult to determine this from a pie chart, but arough estimate would be about 30%.
Moore Chapter 1
What is Statistics?Analyzing Distributions
What is a Distribution?Distribution of a Categorical VariableDistribution of a Quantitative Variable
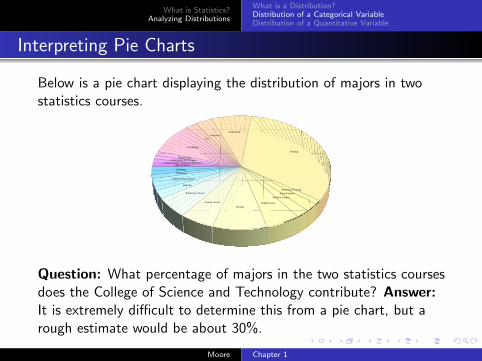
Interpreting Pie Charts
Below is a pie chart displaying the distribution of majors in twostatistics courses.
Applied PhysicsCommunication Sciences & Disorders
Information TechnologyEngineering
Psychology
LawEconomics
Undeclared
Nursing
Respiratory Therapy
Liberal Studies
Political Science
Health Science
Biology
Criminal Justice
Radiologic Science
Medicine
Rehabilitation Science
Chemistry
Business
Question: What percentage of majors in the two statistics coursesdoes the College of Science and Technology contribute? Answer:It is extremely difficult to determine this from a pie chart, but arough estimate would be about 30%.
Moore Chapter 1
What is Statistics?Analyzing Distributions
What is a Distribution?Distribution of a Categorical VariableDistribution of a Quantitative Variable
Picturing a Distribution of a Quantitative Variable
Histograms and stemplots display the distribution of a quantitativevariable.
Definition
A histogram is a diagram that uses rectangles to representfrequency along the vertical axis, and the horizontal axis marksunits of measurement for the quantitative variable.
Definition
A stemplot contains two columns separated by a vertical line withthe stems, consisting of all but the final rightmost digit, appearingin the left column and the leaves, the final digit, appearing in theright column.
Moore Chapter 1
What is Statistics?Analyzing Distributions
What is a Distribution?Distribution of a Categorical VariableDistribution of a Quantitative Variable
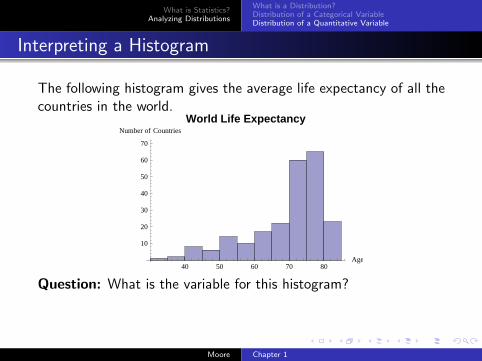
Interpreting a Histogram
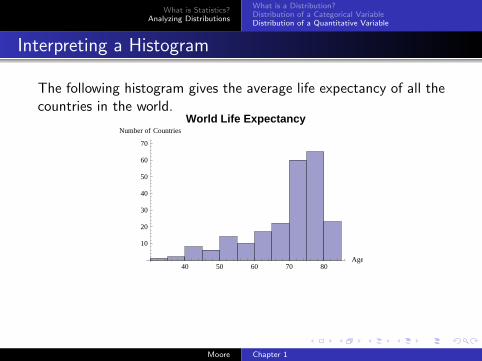
The following histogram gives the average life expectancy of all thecountries in the world.
40 50 60 70 80Age
10
20
30
40
50
60
70
Number of Countries
World Life Expectancy
Question: What is the variable for this histogram?Answer: The average life expectancy of a person from a givencountry.
Moore Chapter 1
What is Statistics?Analyzing Distributions
What is a Distribution?Distribution of a Categorical VariableDistribution of a Quantitative Variable
Interpreting a Histogram
The following histogram gives the average life expectancy of all thecountries in the world.
40 50 60 70 80Age
10
20
30
40
50
60
70
Number of Countries
World Life Expectancy
Question: What is the variable for this histogram?
Answer: The average life expectancy of a person from a givencountry.
Moore Chapter 1

What is Statistics?Analyzing Distributions
What is a Distribution?Distribution of a Categorical VariableDistribution of a Quantitative Variable
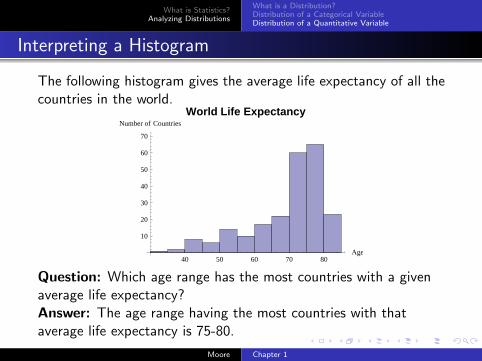
Interpreting a Histogram
The following histogram gives the average life expectancy of all thecountries in the world.
40 50 60 70 80Age
10
20
30
40
50
60
70
Number of Countries
World Life Expectancy
Question: What is the variable for this histogram?Answer: The average life expectancy of a person from a givencountry.
Moore Chapter 1

What is Statistics?Analyzing Distributions
What is a Distribution?Distribution of a Categorical VariableDistribution of a Quantitative Variable
Interpreting a Histogram
The following histogram gives the average life expectancy of all thecountries in the world.
40 50 60 70 80Age
10
20
30
40
50
60
70
Number of Countries
World Life Expectancy
Question: Which age range has the most countries with a givenaverage life expectancy?
Answer: The age range having the most countries with thataverage life expectancy is 75-80.
Moore Chapter 1
What is Statistics?Analyzing Distributions
What is a Distribution?Distribution of a Categorical VariableDistribution of a Quantitative Variable
Interpreting a Histogram
The following histogram gives the average life expectancy of all thecountries in the world.
40 50 60 70 80Age
10
20
30
40
50
60
70
Number of Countries
World Life Expectancy
Question: Which age range has the most countries with a givenaverage life expectancy?Answer: The age range having the most countries with thataverage life expectancy is 75-80.
Moore Chapter 1
What is Statistics?Analyzing Distributions
What is a Distribution?Distribution of a Categorical VariableDistribution of a Quantitative Variable
Interpreting a Histogram
The following histogram gives the average life expectancy of all thecountries in the world.
40 50 60 70 80Age
10
20
30
40
50
60
70
Number of Countries
World Life Expectancy
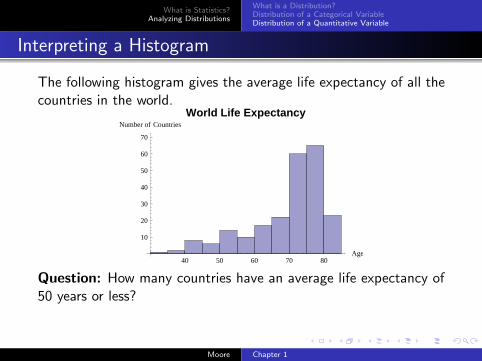
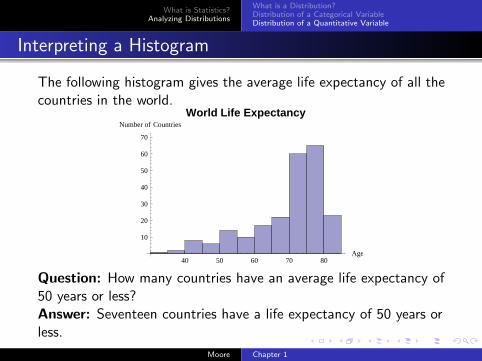
Question: How many countries have an average life expectancy of50 years or less?
Answer: Seventeen countries have a life expectancy of 50 years orless.
Moore Chapter 1
What is Statistics?Analyzing Distributions
What is a Distribution?Distribution of a Categorical VariableDistribution of a Quantitative Variable
Interpreting a Histogram
The following histogram gives the average life expectancy of all thecountries in the world.
40 50 60 70 80Age
10
20
30
40
50
60
70
Number of Countries
World Life Expectancy
Question: How many countries have an average life expectancy of50 years or less?Answer: Seventeen countries have a life expectancy of 50 years orless.
Moore Chapter 1

What is Statistics?Analyzing Distributions
What is a Distribution?Distribution of a Categorical VariableDistribution of a Quantitative Variable
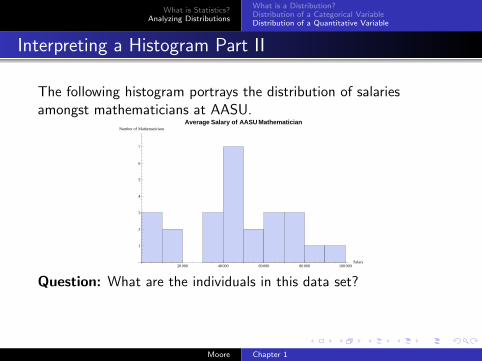
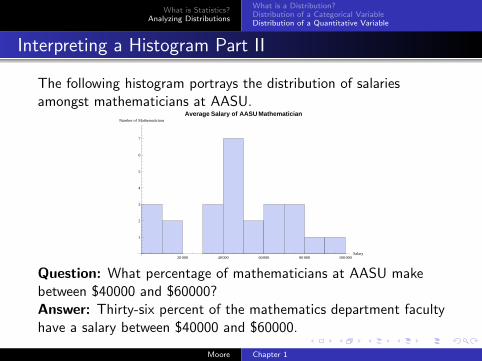
Interpreting a Histogram Part II
The following histogram portrays the distribution of salariesamongst mathematicians at AASU.
20 000 40 000 60 000 80 000 100 000Salary
1
2
3
4
5
6
7
Number of Mathematicians
Average Salary of AASU Mathematician
Question: What are the individuals in this data set?Answer: The people in the math department at AASU are theindividuals.
Moore Chapter 1
What is Statistics?Analyzing Distributions
What is a Distribution?Distribution of a Categorical VariableDistribution of a Quantitative Variable
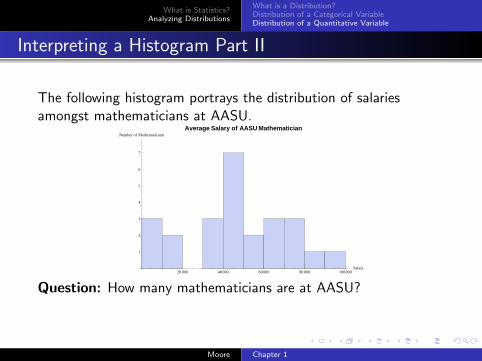
Interpreting a Histogram Part II
The following histogram portrays the distribution of salariesamongst mathematicians at AASU.
20 000 40 000 60 000 80 000 100 000Salary
1
2
3
4
5
6
7
Number of Mathematicians
Average Salary of AASU Mathematician
Question: What are the individuals in this data set?
Answer: The people in the math department at AASU are theindividuals.
Moore Chapter 1

What is Statistics?Analyzing Distributions
What is a Distribution?Distribution of a Categorical VariableDistribution of a Quantitative Variable
Interpreting a Histogram Part II
The following histogram portrays the distribution of salariesamongst mathematicians at AASU.
20 000 40 000 60 000 80 000 100 000Salary
1
2
3
4
5
6
7
Number of Mathematicians
Average Salary of AASU Mathematician
Question: What are the individuals in this data set?Answer: The people in the math department at AASU are theindividuals.
Moore Chapter 1
What is Statistics?Analyzing Distributions
What is a Distribution?Distribution of a Categorical VariableDistribution of a Quantitative Variable
Interpreting a Histogram Part II
The following histogram portrays the distribution of salariesamongst mathematicians at AASU.
20 000 40 000 60 000 80 000 100 000Salary
1
2
3
4
5
6
7
Number of Mathematicians
Average Salary of AASU Mathematician
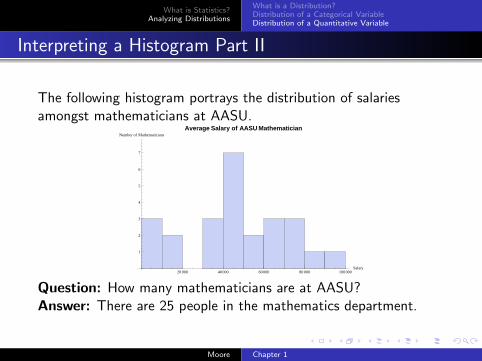
Question: How many mathematicians are at AASU?
Answer: There are 25 people in the mathematics department.
Moore Chapter 1
What is Statistics?Analyzing Distributions
What is a Distribution?Distribution of a Categorical VariableDistribution of a Quantitative Variable
Interpreting a Histogram Part II
The following histogram portrays the distribution of salariesamongst mathematicians at AASU.
20 000 40 000 60 000 80 000 100 000Salary
1
2
3
4
5
6
7
Number of Mathematicians
Average Salary of AASU Mathematician
Question: How many mathematicians are at AASU?Answer: There are 25 people in the mathematics department.
Moore Chapter 1
What is Statistics?Analyzing Distributions
What is a Distribution?Distribution of a Categorical VariableDistribution of a Quantitative Variable
Interpreting a Histogram Part II
The following histogram portrays the distribution of salariesamongst mathematicians at AASU.
20 000 40 000 60 000 80 000 100 000Salary
1
2
3
4
5
6
7
Number of Mathematicians
Average Salary of AASU Mathematician
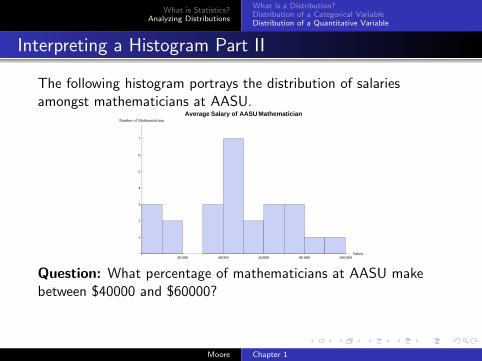
Question: What percentage of mathematicians at AASU makebetween $40000 and $60000?
Answer: Thirty-six percent of the mathematics department facultyhave a salary between $40000 and $60000.
Moore Chapter 1
What is Statistics?Analyzing Distributions
What is a Distribution?Distribution of a Categorical VariableDistribution of a Quantitative Variable
Interpreting a Histogram Part II
The following histogram portrays the distribution of salariesamongst mathematicians at AASU.
20 000 40 000 60 000 80 000 100 000Salary
1
2
3
4
5
6
7
Number of Mathematicians
Average Salary of AASU Mathematician
Question: What percentage of mathematicians at AASU makebetween $40000 and $60000?Answer: Thirty-six percent of the mathematics department facultyhave a salary between $40000 and $60000.
Moore Chapter 1
What is Statistics?Analyzing Distributions
What is a Distribution?Distribution of a Categorical VariableDistribution of a Quantitative Variable
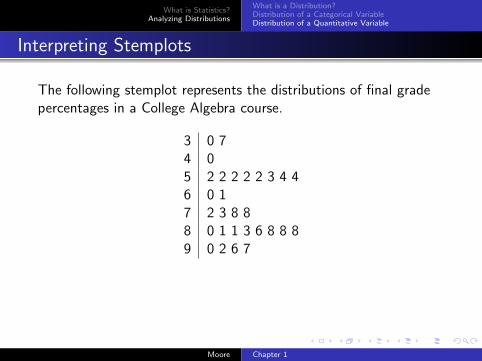
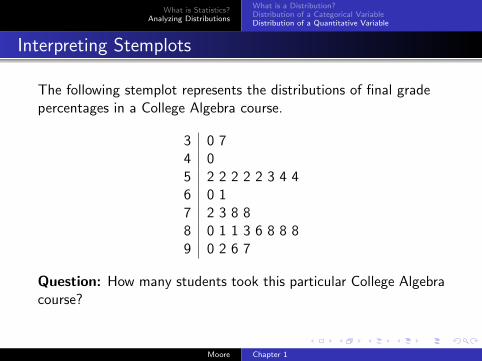
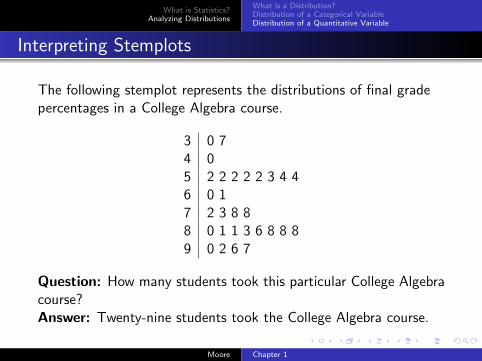
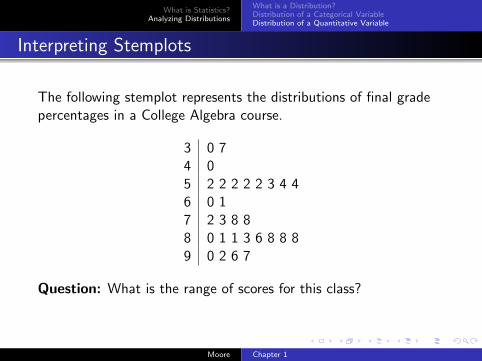
Interpreting Stemplots
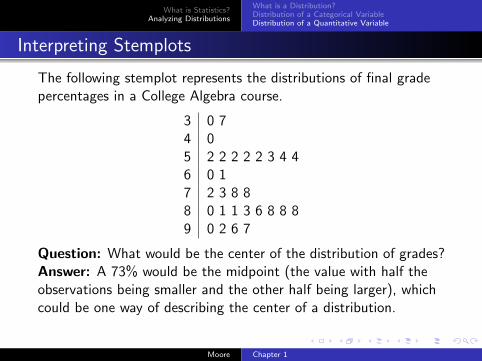
The following stemplot represents the distributions of final gradepercentages in a College Algebra course.
3 0 74 05 2 2 2 2 2 3 4 46 0 17 2 3 8 88 0 1 1 3 6 8 8 89 0 2 6 7
Question: How many students took this particular College Algebracourse?Answer: Twenty-nine students took the College Algebra course.
Moore Chapter 1
What is Statistics?Analyzing Distributions
What is a Distribution?Distribution of a Categorical VariableDistribution of a Quantitative Variable
Interpreting Stemplots
The following stemplot represents the distributions of final gradepercentages in a College Algebra course.
3 0 74 05 2 2 2 2 2 3 4 46 0 17 2 3 8 88 0 1 1 3 6 8 8 89 0 2 6 7
Question: How many students took this particular College Algebracourse?
Answer: Twenty-nine students took the College Algebra course.
Moore Chapter 1
What is Statistics?Analyzing Distributions
What is a Distribution?Distribution of a Categorical VariableDistribution of a Quantitative Variable
Interpreting Stemplots
The following stemplot represents the distributions of final gradepercentages in a College Algebra course.
3 0 74 05 2 2 2 2 2 3 4 46 0 17 2 3 8 88 0 1 1 3 6 8 8 89 0 2 6 7
Question: How many students took this particular College Algebracourse?Answer: Twenty-nine students took the College Algebra course.
Moore Chapter 1
What is Statistics?Analyzing Distributions
What is a Distribution?Distribution of a Categorical VariableDistribution of a Quantitative Variable
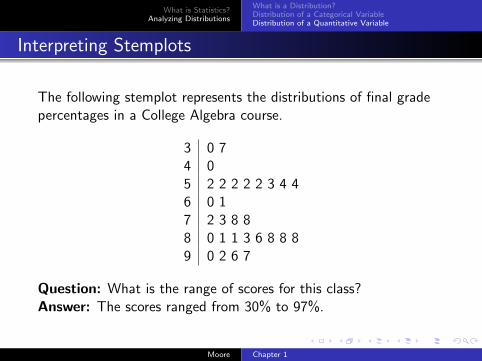
Interpreting Stemplots
The following stemplot represents the distributions of final gradepercentages in a College Algebra course.
3 0 74 05 2 2 2 2 2 3 4 46 0 17 2 3 8 88 0 1 1 3 6 8 8 89 0 2 6 7
Question: What is the range of scores for this class?
Answer: The scores ranged from 30% to 97%.
Moore Chapter 1
What is Statistics?Analyzing Distributions
What is a Distribution?Distribution of a Categorical VariableDistribution of a Quantitative Variable
Interpreting Stemplots
The following stemplot represents the distributions of final gradepercentages in a College Algebra course.
3 0 74 05 2 2 2 2 2 3 4 46 0 17 2 3 8 88 0 1 1 3 6 8 8 89 0 2 6 7
Question: What is the range of scores for this class?Answer: The scores ranged from 30% to 97%.
Moore Chapter 1

What is Statistics?Analyzing Distributions
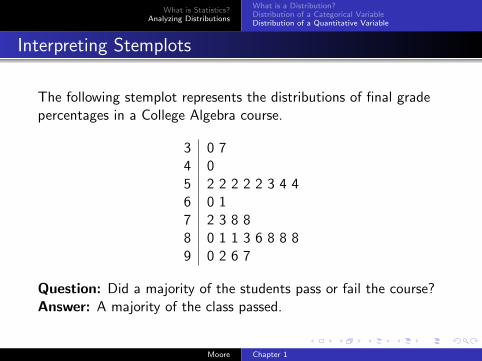
What is a Distribution?Distribution of a Categorical VariableDistribution of a Quantitative Variable
Interpreting Stemplots
The following stemplot represents the distributions of final gradepercentages in a College Algebra course.
3 0 74 05 2 2 2 2 2 3 4 46 0 17 2 3 8 88 0 1 1 3 6 8 8 89 0 2 6 7
Question: Did a majority of the students pass or fail the course?
Answer: A majority of the class passed.
Moore Chapter 1
What is Statistics?Analyzing Distributions
What is a Distribution?Distribution of a Categorical VariableDistribution of a Quantitative Variable
Interpreting Stemplots
The following stemplot represents the distributions of final gradepercentages in a College Algebra course.
3 0 74 05 2 2 2 2 2 3 4 46 0 17 2 3 8 88 0 1 1 3 6 8 8 89 0 2 6 7
Question: Did a majority of the students pass or fail the course?Answer: A majority of the class passed.
Moore Chapter 1
What is Statistics?Analyzing Distributions
What is a Distribution?Distribution of a Categorical VariableDistribution of a Quantitative Variable
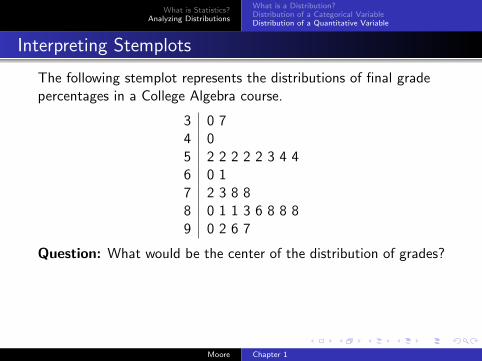
Interpreting Stemplots
The following stemplot represents the distributions of final gradepercentages in a College Algebra course.
3 0 74 05 2 2 2 2 2 3 4 46 0 17 2 3 8 88 0 1 1 3 6 8 8 89 0 2 6 7
Question: What would be the center of the distribution of grades?
Answer: A 73% would be the midpoint (the value with half theobservations being smaller and the other half being larger), whichcould be one way of describing the center of a distribution.However, there exist more than just a midpoint to help us gaugethe center and distribution of a variable.
Moore Chapter 1
What is Statistics?Analyzing Distributions
What is a Distribution?Distribution of a Categorical VariableDistribution of a Quantitative Variable
Interpreting Stemplots
The following stemplot represents the distributions of final gradepercentages in a College Algebra course.
3 0 74 05 2 2 2 2 2 3 4 46 0 17 2 3 8 88 0 1 1 3 6 8 8 89 0 2 6 7
Question: What would be the center of the distribution of grades?Answer: A 73% would be the midpoint (the value with half theobservations being smaller and the other half being larger), whichcould be one way of describing the center of a distribution.
However, there exist more than just a midpoint to help us gaugethe center and distribution of a variable.
Moore Chapter 1

What is Statistics?Analyzing Distributions
What is a Distribution?Distribution of a Categorical VariableDistribution of a Quantitative Variable
Interpreting Stemplots
The following stemplot represents the distributions of final gradepercentages in a College Algebra course.
3 0 74 05 2 2 2 2 2 3 4 46 0 17 2 3 8 88 0 1 1 3 6 8 8 89 0 2 6 7
Question: What would be the center of the distribution of grades?Answer: A 73% would be the midpoint (the value with half theobservations being smaller and the other half being larger), whichcould be one way of describing the center of a distribution.However, there exist more than just a midpoint to help us gaugethe center and distribution of a variable.
Moore Chapter 1
What is Statistics?Analyzing Distributions
What is a Distribution?Distribution of a Categorical VariableDistribution of a Quantitative Variable
Interpreting Distributions of Quantitative Variables
When examining the graph of a quantitative variable, look foran overall pattern and deviations from that pattern.
The overall pattern of the distribution of a quantitativevariable can be described by its shape, center, and spread.
Observations that lie outside the overall pattern of adistribution are called outliers.
Moore Chapter 1

What is Statistics?Analyzing Distributions
What is a Distribution?Distribution of a Categorical VariableDistribution of a Quantitative Variable
The Outsiders
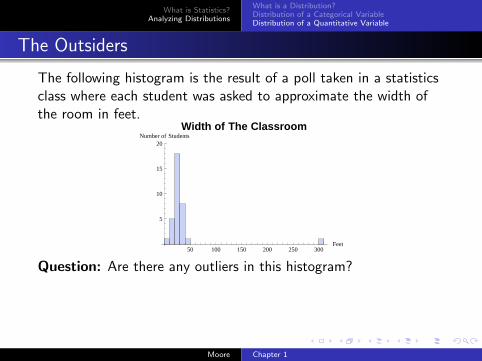
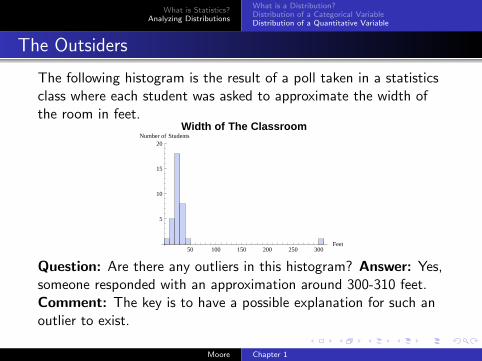
The following histogram is the result of a poll taken in a statisticsclass where each student was asked to approximate the width ofthe room in feet.
50 100 150 200 250 300Feet
5
10
15
20Number of Students
Width of The Classroom
Question: Are there any outliers in this histogram? Answer: Yes,someone responded with an approximation around 300-310 feet.Comment: The key is to have a possible explanation for such anoutlier to exist. In this case, the person was actually thinking theapproximation was in inches, which would be approximately 25 ft.
Moore Chapter 1
What is Statistics?Analyzing Distributions
What is a Distribution?Distribution of a Categorical VariableDistribution of a Quantitative Variable
The Outsiders
The following histogram is the result of a poll taken in a statisticsclass where each student was asked to approximate the width ofthe room in feet.
50 100 150 200 250 300Feet
5
10
15
20Number of Students
Width of The Classroom
Question: Are there any outliers in this histogram?
Answer: Yes,someone responded with an approximation around 300-310 feet.Comment: The key is to have a possible explanation for such anoutlier to exist. In this case, the person was actually thinking theapproximation was in inches, which would be approximately 25 ft.
Moore Chapter 1

What is Statistics?Analyzing Distributions
What is a Distribution?Distribution of a Categorical VariableDistribution of a Quantitative Variable
The Outsiders
The following histogram is the result of a poll taken in a statisticsclass where each student was asked to approximate the width ofthe room in feet.
50 100 150 200 250 300Feet
5
10
15
20Number of Students
Width of The Classroom
Question: Are there any outliers in this histogram? Answer: Yes,someone responded with an approximation around 300-310 feet.
Comment: The key is to have a possible explanation for such anoutlier to exist. In this case, the person was actually thinking theapproximation was in inches, which would be approximately 25 ft.
Moore Chapter 1
What is Statistics?Analyzing Distributions
What is a Distribution?Distribution of a Categorical VariableDistribution of a Quantitative Variable
The Outsiders
The following histogram is the result of a poll taken in a statisticsclass where each student was asked to approximate the width ofthe room in feet.
50 100 150 200 250 300Feet
5
10
15
20Number of Students
Width of The Classroom
Question: Are there any outliers in this histogram? Answer: Yes,someone responded with an approximation around 300-310 feet.Comment: The key is to have a possible explanation for such anoutlier to exist.
In this case, the person was actually thinking theapproximation was in inches, which would be approximately 25 ft.
Moore Chapter 1

What is Statistics?Analyzing Distributions
What is a Distribution?Distribution of a Categorical VariableDistribution of a Quantitative Variable
The Outsiders
The following histogram is the result of a poll taken in a statisticsclass where each student was asked to approximate the width ofthe room in feet.
50 100 150 200 250 300Feet
5
10
15
20Number of Students
Width of The Classroom
Question: Are there any outliers in this histogram? Answer: Yes,someone responded with an approximation around 300-310 feet.Comment: The key is to have a possible explanation for such anoutlier to exist. In this case, the person was actually thinking theapproximation was in inches, which would be approximately 25 ft.
Moore Chapter 1

What is Statistics?Analyzing Distributions
What is a Distribution?Distribution of a Categorical VariableDistribution of a Quantitative Variable
On the Lookout for Distributions
Although it varies from case to case, we often toss out astrong outlier when trying to interpret the results of a givendistribution.
A distribution is symmetric if the observations equidistant (ofthe same distance) from the center have approximately thesame frequencies.
A distribution is skewed if one of its tails is longer than theother.
A distribution is skewed to the left if the direction of the longtail is to the left (or up in the case of a stemplot).A distribution is skewed to the right if the direction of the longtail is to the right (or down in the case of a stemplot).
Moore Chapter 1

What is Statistics?Analyzing Distributions
What is a Distribution?Distribution of a Categorical VariableDistribution of a Quantitative Variable
On the Lookout for Distributions
Although it varies from case to case, we often toss out astrong outlier when trying to interpret the results of a givendistribution.
A distribution is symmetric if the observations equidistant (ofthe same distance) from the center have approximately thesame frequencies.
A distribution is skewed if one of its tails is longer than theother.
A distribution is skewed to the left if the direction of the longtail is to the left (or up in the case of a stemplot).
A distribution is skewed to the right if the direction of the longtail is to the right (or down in the case of a stemplot).
Moore Chapter 1
What is Statistics?Analyzing Distributions
What is a Distribution?Distribution of a Categorical VariableDistribution of a Quantitative Variable
On the Lookout for Distributions
Although it varies from case to case, we often toss out astrong outlier when trying to interpret the results of a givendistribution.
A distribution is symmetric if the observations equidistant (ofthe same distance) from the center have approximately thesame frequencies.
A distribution is skewed if one of its tails is longer than theother.
A distribution is skewed to the left if the direction of the longtail is to the left (or up in the case of a stemplot).A distribution is skewed to the right if the direction of the longtail is to the right (or down in the case of a stemplot).
Moore Chapter 1
What is Statistics?Analyzing Distributions
What is a Distribution?Distribution of a Categorical VariableDistribution of a Quantitative Variable
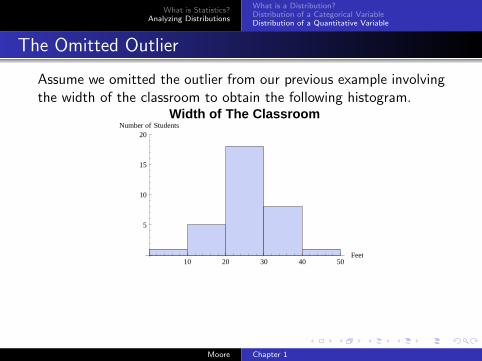
The Omitted Outlier
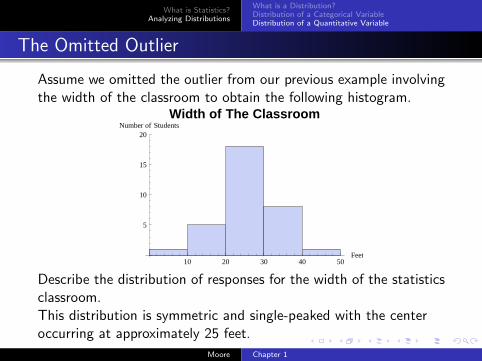
Assume we omitted the outlier from our previous example involvingthe width of the classroom to obtain the following histogram.
10 20 30 40 50Feet
5
10
15
20Number of Students
Width of The Classroom
Describe the distribution of responses for the width of the statisticsclassroom.This distribution is symmetric and single-peaked with the centeroccurring at approximately 25 feet.
Moore Chapter 1
What is Statistics?Analyzing Distributions
What is a Distribution?Distribution of a Categorical VariableDistribution of a Quantitative Variable
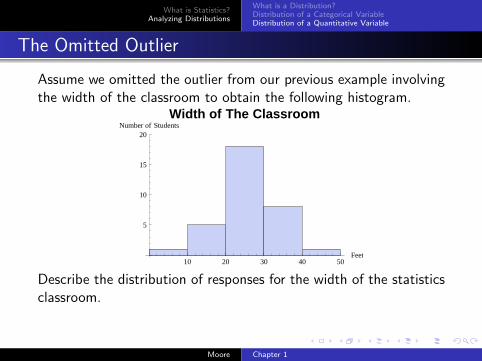
The Omitted Outlier
Assume we omitted the outlier from our previous example involvingthe width of the classroom to obtain the following histogram.
10 20 30 40 50Feet
5
10
15
20Number of Students
Width of The Classroom
Describe the distribution of responses for the width of the statisticsclassroom.
This distribution is symmetric and single-peaked with the centeroccurring at approximately 25 feet.
Moore Chapter 1
What is Statistics?Analyzing Distributions
What is a Distribution?Distribution of a Categorical VariableDistribution of a Quantitative Variable
The Omitted Outlier
Assume we omitted the outlier from our previous example involvingthe width of the classroom to obtain the following histogram.
10 20 30 40 50Feet
5
10
15
20Number of Students
Width of The Classroom
Describe the distribution of responses for the width of the statisticsclassroom.This distribution is symmetric and single-peaked with the centeroccurring at approximately 25 feet.
Moore Chapter 1
What is Statistics?Analyzing Distributions
What is a Distribution?Distribution of a Categorical VariableDistribution of a Quantitative Variable
Describing Distributions
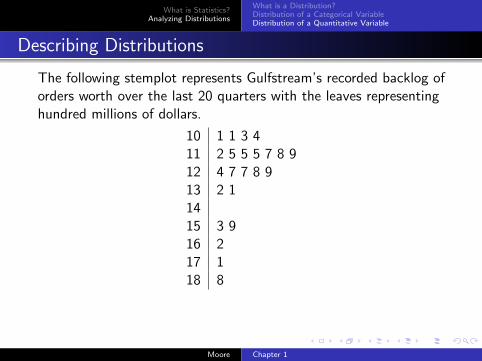
The following stemplot represents Gulfstream’s recorded backlog oforders worth over the last 20 quarters with the leaves representinghundred millions of dollars.
10 1 1 3 411 2 5 5 5 7 8 912 4 7 7 8 913 2 11415 3 916 217 118 8
Describe the distribution for the backlog of orders for Gulfstream’sproducts.This distribution is skewed to the right.
Moore Chapter 1
What is Statistics?Analyzing Distributions
What is a Distribution?Distribution of a Categorical VariableDistribution of a Quantitative Variable
Describing Distributions
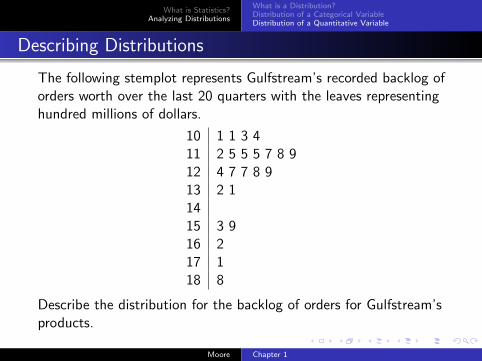
The following stemplot represents Gulfstream’s recorded backlog oforders worth over the last 20 quarters with the leaves representinghundred millions of dollars.
10 1 1 3 411 2 5 5 5 7 8 912 4 7 7 8 913 2 11415 3 916 217 118 8
Describe the distribution for the backlog of orders for Gulfstream’sproducts.
This distribution is skewed to the right.
Moore Chapter 1

What is Statistics?Analyzing Distributions
What is a Distribution?Distribution of a Categorical VariableDistribution of a Quantitative Variable
Describing Distributions
The following stemplot represents Gulfstream’s recorded backlog oforders worth over the last 20 quarters with the leaves representinghundred millions of dollars.
10 1 1 3 411 2 5 5 5 7 8 912 4 7 7 8 913 2 11415 3 916 217 118 8
Describe the distribution for the backlog of orders for Gulfstream’sproducts.This distribution is skewed to the right.
Moore Chapter 1
What is Statistics?Analyzing Distributions
What is a Distribution?Distribution of a Categorical VariableDistribution of a Quantitative Variable
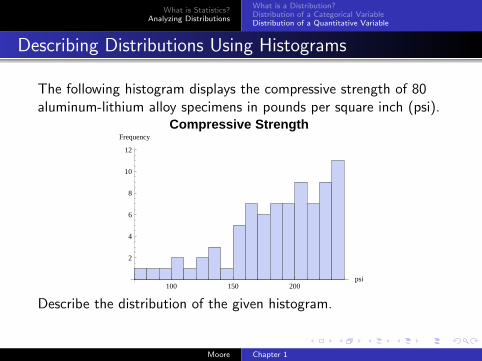
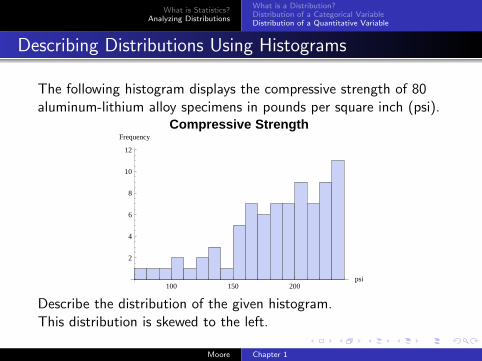
Describing Distributions Using Histograms
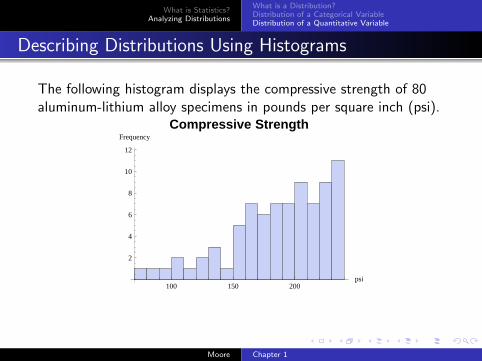
The following histogram displays the compressive strength of 80aluminum-lithium alloy specimens in pounds per square inch (psi).
100 150 200psi
2
4
6
8
10
12
Frequency
Compressive Strength
Describe the distribution of the given histogram.This distribution is skewed to the left.
Moore Chapter 1
What is Statistics?Analyzing Distributions
What is a Distribution?Distribution of a Categorical VariableDistribution of a Quantitative Variable
Describing Distributions Using Histograms
The following histogram displays the compressive strength of 80aluminum-lithium alloy specimens in pounds per square inch (psi).
100 150 200psi
2
4
6
8
10
12
Frequency
Compressive Strength
Describe the distribution of the given histogram.
This distribution is skewed to the left.
Moore Chapter 1
What is Statistics?Analyzing Distributions
What is a Distribution?Distribution of a Categorical VariableDistribution of a Quantitative Variable
Describing Distributions Using Histograms
The following histogram displays the compressive strength of 80aluminum-lithium alloy specimens in pounds per square inch (psi).
100 150 200psi
2
4
6
8
10
12
Frequency
Compressive Strength
Describe the distribution of the given histogram.This distribution is skewed to the left.
Moore Chapter 1
What is Statistics?Analyzing Distributions
What is a Distribution?Distribution of a Categorical VariableDistribution of a Quantitative Variable
Time Plots
Definition
A time plot is a graph in which the vertical axis gives the observedvalue of the variable and the horizontal axis denotes the time(which could be in minutes, days, years, etc.)
When measurements are plotted as a time plot, we often seetrends, cycles, or other broad features of the data that could notbe seen otherwise.
Moore Chapter 1

What is Statistics?Analyzing Distributions
What is a Distribution?Distribution of a Categorical VariableDistribution of a Quantitative Variable
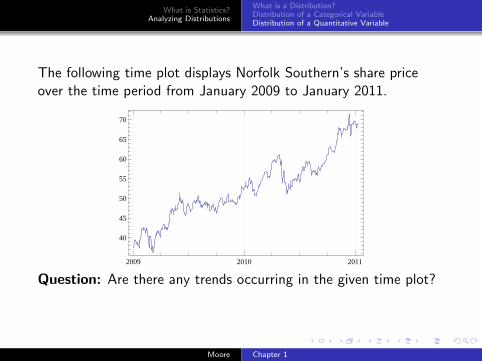
The following time plot displays Norfolk Southern’s share priceover the time period from January 2009 to January 2011.
2009 2010 2011
40
45
50
55
60
65
70
Question: Are there any trends occurring in the given time plot?Answer: The trend for Norfolk Southern’s stock is going upward.
Moore Chapter 1
What is Statistics?Analyzing Distributions
What is a Distribution?Distribution of a Categorical VariableDistribution of a Quantitative Variable
The following time plot displays Norfolk Southern’s share priceover the time period from January 2009 to January 2011.
2009 2010 2011
40
45
50
55
60
65
70
Question: Are there any trends occurring in the given time plot?
Answer: The trend for Norfolk Southern’s stock is going upward.
Moore Chapter 1

What is Statistics?Analyzing Distributions
What is a Distribution?Distribution of a Categorical VariableDistribution of a Quantitative Variable
The following time plot displays Norfolk Southern’s share priceover the time period from January 2009 to January 2011.
2009 2010 2011
40
45
50
55
60
65
70
Question: Are there any trends occurring in the given time plot?Answer: The trend for Norfolk Southern’s stock is going upward.
Moore Chapter 1