Embed Size (px)
Citation preview

Introduction to ScienceChapter 1
Section 1 The Nature of Science
Section 2 The Way Science Works
Section 3 Organizing Data

• Skills• Experiment Design
• SI Units and SI unit conversions
• Using graphs
• Scientific Notation and use in calculations
• Significant Digits

Objectives
• Describe the main branches of natural science andrelate them to each other.
• Describe the relationship between science andtechnology.
• Distinguish between scientific laws and scientifictheories.
• Explain the roles of models and mathematics inscientific theories and laws.
Section 1 The Nature of Science

How Does Science Take Place?
• Scientists observe.
• Scientists investigate.
• Scientists plan experiments.
• Scientists always test the results.

How Does Science Take Place? continued
• Science is the knowledge gained by observing in order todiscover facts and to formulate laws or principles that canbe verified or tested.
• Social Science deals with individual and group behaviors.
• Natural Science deals with how the universe works.
• Biological science is the science of living things.
• Physical science is the science of matter and energy.
• Earth science is the science of the Earth, the atmosphere,and weather.
Natural Science

Physics

How Does Science Take Place? continued
• Science and technology work together.
• Some scientists practice pure science defined asthe continuing search for scientific knowledge.
• Some scientists and engineers practice appliedscience defined as the search for ways to usescientific knowledge for practical applications.
• Technology is the application of science forpractical purposes.

Scientific Laws and Theories
• Laws and theories are supported byexperimental results.
• Scientific theories are always being questionedand examined. To be valid, a theory must:
• explain observations• be repeatable• be predictable

Scientific Laws and Theories, continued
• Scientific law a summary of many experimentalresults and observations; a law tells how thingswork—what will happen
• Scientific theory an explanation for somephenomenon that is based on observation,experimentation, and reasoning

Comparing Theories and Laws

Scientific Laws and Theories, continued
• Mathematics can describe physical events.
• A qualitative statement describes somethingwith words.
• A quantitative statement describes somethingwith mathematical equations.

Scientific Laws and Theories, continued
• Theories and laws are always being tested.
• Models can represent physical events.
• A model is a representation of an object or eventthat can be studied to understand the real objector event.
• Scientists use physical and computer models tostudy objects and events.

Models

Physical, Mathematical, andConceptual Models

Section 2 The Way Science Works
Objectives• Understand how to use critical thinking skills to
solve problems.
• Describe the steps of the scientific method.
• Know some of the tools scientists use toinvestigate nature.
• Explain the objective of a consistent system ofunits, and identify the SI units for length, mass,and time.
• Identify what each common SI prefixrepresents, and convert measurements.

Science Skills
• Critical thinking is the ability and willingnessto assess claims critically and to makejudgments on the basis of objective andsupported reasons, facts, and data.

Science Skills, continued
• Using the scientific method
• The scientific method is a general description ofscientific thinking rather than an exact path forscientists to follow.
• Scientific method is a series of steps followedto solve problems; includes collecting data,formulating a hypothesis, testing the hypothesis,and stating conclusions

Scientific Method

Hypothesis

Science Skills, continued
• Hypothesis a possible explanation or answerthat can be tested
• Variable a factor that changes in an experimentin order to test a hypothesis• The values of the independent variable are set
before the experiment takes place.• The values of the dependent variable depend on
what happens in the experiment.

Controlled Experiment
• Testing hypotheses• Scientists test a hypothesis by doing a controlled
experiment.• In a controlled experiment, all the factors are kept
constant except for one.• A control is a standard for comparison.

Controlled Experiment continued

Science Skills, continued
• Conducting experiments
• No experiment is a failure
• The results of every experiment can be used torevise the hypothesis or plan tests of a differentvariable.

Experiment Design
Assignment: Investigate the impact on plantgrowth of adding various amounts of fertilizer topotted plants. Think about what you would need todo to be certain that the fertilizer was having theimpact on the plant growth.

Experiment Design, continuedYou perform an experiment and collect the datashown in the table below.
• 1. What was the independentvariable?
• 2. What was the dependentvariable?
• 3. What was the control?
• 4. Describe the overall trend.
• 5. What was held constant?

Units of Measurement
• SI units are used for consistency.• Scientists use the International System of Units (SI) to
make sharing data and calculations easier.

SI (Le Système Internationale d’Unités)

Units of Measurement, continued
SI prefixes are for very large and very smallmeasurements.

Units of Measurement, continued

Math Skills
Conversions A roll of copper wire contains 15 m ofwire. What is the length of the wire incentimeters?
Practice p.17

Units of Measurement, continued
• Length a measure of the straight-line distancebetween two points
• Mass a measure of the amount of matter in anobject
• Volume a measure of the size of a body orregion in three-dimensional space
• Weight a measure of the gravitational forceexerted on an object

Volume

Section 3 Organizing Data
Objectives
• Interpret line graphs, bar graphs, and piecharts.
• Use scientific notation and significant figuresin problem solving.
• Understand the difference between precisionand accuracy.

Presenting Scientific Data
• Line graphs are best for continuous change.
• Line graphs are usually made with the x-axis
showing the independent variable and the y-
axis showing the dependent variable.

Line Graph

Presenting Scientific Data, continued• Bar graphs compare items.
• A bar graph is useful for comparing similar datafor several individual items or events.
• A bar graph can make clearer how large or smallthe differences in individual values are.

Bar Graph
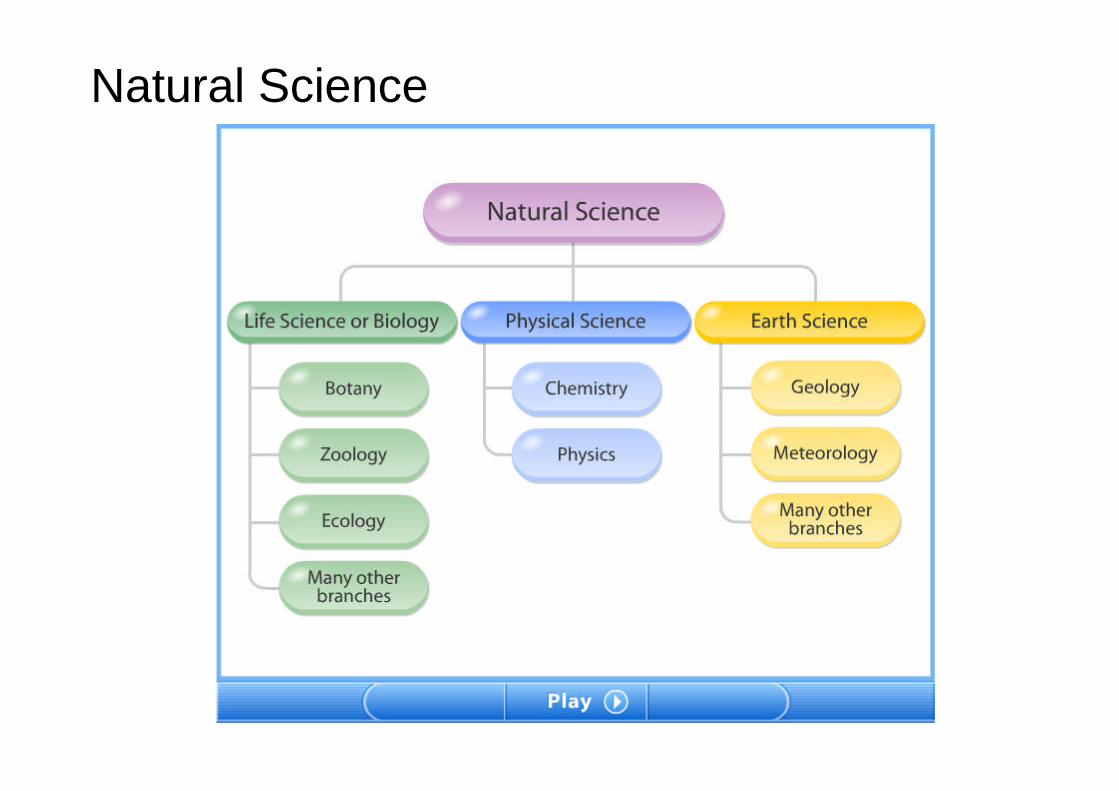
Presenting Scientific Data, continued
• Pie charts show partsof a whole.
• Data in a pie chart isusually presented as apercent.

Writing Numbers in Scientific Notation• Scientific notation is expresses a quantity as a
number multiplied by 10 to the appropriatepower.
• 103 = 1000• 102 = 100• 101 = 10• 100 = 1• 10-1 = 0.1• 10-2 = 0.01• 10-3 = 0.001

Writing Numbers in Scientific Notation,continued
• Using scientific notation
• When you use scientific notation in calculations,you follow the math rules for powers of 10.
• When you add or subtract values they must allhave the same power of 10.
• When you multiply two values in scientificnotation, you add the powers of 10. When youdivide, you subtract the powers of 10.

Math Skills
Writing Scientific Notation The adult humanheart pumps about 18 000 L of blood each day.Write this value in scientific notation.
Practice p.23

Scientific Notation

Using Significant Figures
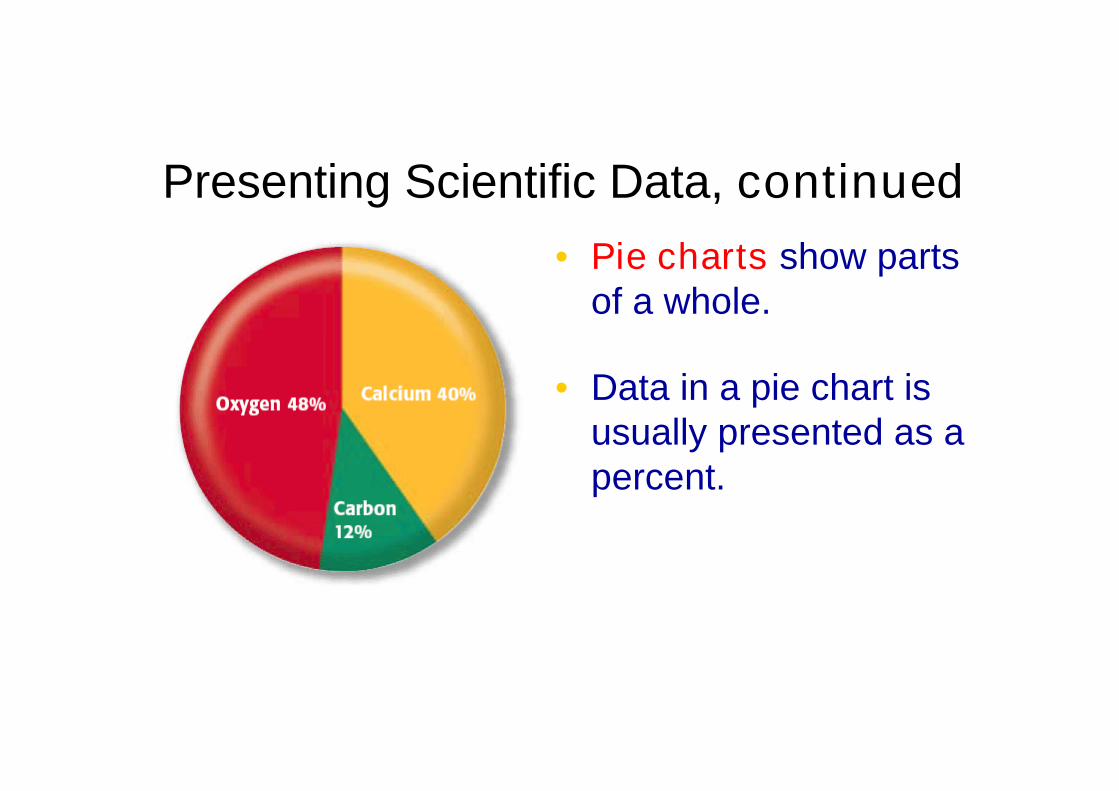
Precision and accuracy
• Precision is the exactness of a measurement• Accuracy is how close a measurement is to the
true value of the quantity being measured• Significant figures prescribe the number of
decimal places retained in presented data--based on the precision of the measurement
Accuracy and Precision, part 1

Accuracy and Precision, part 2

Accuracy and Precision

Using Significant Figures, continued
• When you use measurements in calculations,the answer is only as precise as the leastprecise measurement used in the calculation.
• The measurement with the fewest significantfigures determines the number of significantfigures that can be used in the answer.

Math SkillsSignificant Figures Calculate the volume of a
room that is 3.125 m high, 4.25 m wide, and5.75 m long. Write the answer with the correctnumber of significant figures.
1. List the given and unknown values.
Given: length, l = 5.75 m
width, w = 4.25 m
height, h = 3.125 m
Unknown: Volume, V = ? m3

Math Skills, continued
2. Write the equation for volume.V = l w h
3. Insert the known values into the equation,and solve.V = 5.75 m 4.25 m 3.125 mV = 76.367 1875 m3
The answer should have three significant figures.
V = 76.4 m3

Math SkillsUsing Scientific Notation Cushing plans to buy a
rectangular tract of land measuring 7.36 x 10³ mby 2.38 x 10⁴ m to establish a nature preserve.What are the area and perimeter of this tract?
1. List the given and unknown values.
Given: length, l = 1.38 x 10⁴ m
width, w = 5.36 x 10³ m
Unknown: area, A = ? m2
perimeter, P=? m

Math Skills, continued
2. Write the useful relationships (equations).A = l w, P = 2l + 2w
3. Insert the known values into the equations,and solve.A = (2.38 104 m) (7.36 103 m); regroupA = (2.38 7.36) (104 103) (m m); add powers of 10A = (2.38 7.36) (104+3) (m m) A = 17.5168 107 m2
A = 1.75 108 m2
P = 2(2.38 x 10⁴ m) + 2(7.36 x 10³ m)P = 4.76 x 10⁴ m + 14.7 x 10³ m; match powers of 10P = 47.6 x 10³ m + 14.7 x 10³ m = 62.3 x 10³ m
P = 6.23 x 10⁴ m
Note: an exact number, e.g. 2, does not limit significant figuresPractice p.24

Significant Figures
Practice p.25, Math Skills p.26

• TERMS TOOLS (equations)
• length (x, l, h) (m)
• mass (m) (kg)
• time (t) (s)
Chapter Review p.28; 1-7, 13-19