Embed Size (px)
Citation preview

1
CHAPTER - 1
INTRODUCTION AND DESIGN OF THE THESIS
"A brand for a company is like a reputation for a person. You earn reputation by
trying to do hard things well."
Kenneth Blanchard
Introduction to Brand equity
A basic premise of brand equity is that the power of a brand lies in the minds of
consumers and what they have experienced and learned about the brand over time. Brand
equity can be thought of as the "added value" endowed to a product in the thoughts,
words, and actions of consumers. There are many different ways that this added value
can be created for a brand.
Similarly, there are also many different ways the value of a brand can be
manifested or exploited to benefit the firm (i.e., in terms of greater revenue and/or lower
costs). For brand equity to provide a useful strategic function and guide marketing
decisions, it is important for marketers to fully understand the sources of brand equity,
how they affect outcomes of interest (e.g., sales), and how these sources and outcomes
change, if at all, over time. Understanding the sources and outcomes of brand equity
provides a common denominator for interpreting marketing strategies and assessing the
value of a brand: The sources of brand equity help managers understand and focus on
what drives their brand equity; the outcomes of brand equity help managers understand
exactly how and where brands add value.
2
Hoeffler& Keller1, indicates that as a consequence of creating knowledge
structures about a brand, consumers should respond more favorably to the marketing
activity for a brand than if the brand had not been identified to consumers. Specifically, a
product with positive brand equity can potentially enjoy the following seven important
customer-related benefits:
� Be perceived differently and produce different interpretations of product
performance;
� Enjoy greater loyalty and be less vulnerable to competitive marketing actions;
� Command larger margins and have more inelastic responses to price increases
and elastic responses to price decreases;
� Receive greater trade cooperation and support;
� Increase marketing communication effectiveness;
� Yield licensing opportunities;
� Support brand extensions.
These benefits, and thus the ultimate value of a brand, depends on the underlying
components of brand knowledge and sources of brand equity. Via the indirect approach,
individual components can be measured, but to provide more direct estimates, their
resulting value still must be estimated in some way. The direct approach to measuring
customer-based brand equity attempts to more explicitly assess the impact of brand
knowledge on consumer response to different aspects of the marketing program for the
firm. The direct approach is useful in approximating the possible outcomes and benefits
that arise from differential response to marketing activity due to the brand, either
individually or in aggregate.
1 The marketing advantages of strong brands S Hoeffler, KL Keller - The Journal of Brand Management, 2003
3
Retail Brand Equity
Extant Research provides different conceptualizations of retailer brand equity ,
based on the consumer – perspective. Hartman and spiro2( 2005) have used the term ‘
customer based store equity’ drawing mainly from Keller’s conceptualization of
customer based brand equity. According to Pappu and Quester’s3 , Retail Brand Equity is
defined as “ the value associated by the consumer with the name of a retailer, as reflected
in the dimensions of retailer awareness, retailer associations, retailer perceived quality
and retailer loyalty”
Retail Industry
Retailing is the largest private sector industry in the world economy with the
global industry size exceeding $6.6 trillion and a latest survey has projected India as the
top destination for retail investors. And the further upsurge is anticipated in the retail
sector as the Government of opened up 51% FDI in single brand retail outlets.
Industry experts are sensitive to the point that local markets have an edge over the retail
investors in India as they have unique advantages such as an understanding of local
needs and extended service like home delivery. As the FDI influence on the Indian retail
sector sets in, the total size of the retail trade is expected to grow extensively in the
coming years and the consumer segments patronizing the big malls will create frenzy for
organized retailing predicting a growth of 25-30 per cent per annum over the next
decade.
2 K.B. Hartman, R.L. Spiro Recapturing store image in customer-based store equity: a
construct conceptualization/ Journal of Business Research 58 (2005) 1112–1120 3 Ravi Pappu, Pascale G. Quester, Ray W. Cooksey, (2005) "Consumer-based brand
equity: improving the measurement – empirical evidence", Journal of Product & Brand Management, Vol. 14 Iss: 3, pp.143 - 154
4
The Indian retail industry is divided into organised and unorganised sectors.
Organised sectors are licensed retailers and unorganised relates to traditional or low cost
retailing. India’s retail sector with a compounded growth rate of 46.64% is the fastest
growing sector in Indian economy. Traditional markets are making way for new formats
like departmental stores, hypermarkets and speciality stores. So in such a competition in
order to maintain good recall it is essential for a retail outlet to be to a great extent
visible.
Also the particular factors focused by the outlets is important with regards to the
footfalls and sales as, if those factors meet with the expectations of the customers and is
targeted in satisfying their needs and demands then a brand bond is created between the
outlet and the customer. It is an everyday challenge for a retailer to satisfy the diversified
demands of discerning customers. The further challenges are to reel in more customers,
assure their loyalty, and drive in more footfalls and to ensure the conversion rate. In
order to gain more profits, retailers try to lure the customers with in-store signage’s,
advertisements and customer-loyalty programmes. No matter how unique these strategies
may be, they do not guarantee a success rate. Thus, to ensure a minimum return on
investment, the retailers need to ascertain that the format, product assortment and the
location of their store assures profits.
The bottom line in any business is profit and retail is certainly no exception to
this rule. In order to make sales you need to first attract people into your shop and then
get them to stay long enough to look around and make that all important purchase. The
number of people coming into the shop is known as the footfall and, like many other
businesses, it is all about the numbers. The more people who come into the shop then
generally the more you will sell. This is always provided that you are selling what the
customers want to buy.

5
The word 'retail' is extracted from the French word 'retaillier' meaning 'to cut a
piece off' or 'to break bulk'. In simple terms it involves activities whereby products or
services are sold to final consumers in smaller consumption quantities. Although
retailing in its various formats has been around in India for many years, it has been
confined for a long time to family owned corner shops or mom and pop shops popularly
known as kirana shop.
The term “retailing “refers to any activity that involves a sale to a customer who
consumes or uses the product or service. Retailing is the sale interface between the
producer and the individual consumer buying for personal consumption. The term
includes direct interface between the manufacturer and institutional buyers such as
government and other bulk customers. The retail industry is of late often being hailed as
one of the sunrise sectors in the economy. AT Kearny4, the well known international
management consultancy, recently identified India as the “Second most attractive
destination” globally from among thirty emergent markets. In India, the unorganized
retailing sector comprises of 96.5% while that of organized sector is just 3.5% that is
mainly in major metropolitan and urban areas. Indian retailing has been traditionally
dominated by a small family run “Kirana store”.
Retailing in India is the second largest untapped market after China. Professional
management and strong customer focus characterize organized retailing. Despite the
huge size of the industry, only 8% of the country’s population is engaged in retailing
while on a comparative the United States of America, it is 20%. The positive factor such
as increased purchasing power, rise in number of double income families and demanding
customers, due to change in life style and paucity of time, customers are increasingly
looking for convenience in shopping.
4 http://www.atkearney.com/consumer-products-retail/global-retail-development-index

6
To woo the customers to the store, retailers are providing a wide product range,
quality and value for money, apart from creating a pleasant shopping experience.
India has one of the largest numbers of the retail outlets (organized and
unorganized) in the world. Of the 12 million retail outlets present in the country, nearly 5
million sell food and related products. Thought of the market has been dominated by
unorganized players, the rapid entry of domestic and international organized players is
set to change the scenario.
Organized retail segment has been growing at a blistering pace, exceeding all
previous estimates.
According to a study by TSMG5 projects that in the next 10 years, the overall
retail market in India is likely to grow at a CAGR of 5.5% (at constant prices) to
1,677,000 Cr in 2015. The organized retail market is expected to grow much faster at a
CAGR of 21.8% (at constant prices) to Rs. 246,000 Cr by 2015 thereby constituting
~15% of the overall retail sales. Based on our projections, the top 5 organized retail
categories by 2015 would be food, grocery & general merchandise, apparel, durables,
food service and home improvement.
Indian retail industry is the largest industry in India, with an employment of
around 8% of work force and contributing to over 10% of the country’s GDP. Retail
industry in India is expected to rise 25% yearly being driven by strong income growth,
changing lifestyles, and favorable demographic patterns. It is expected that by 2016
modern retail industry in India will be worth US$ 175-200 billion. India retail industry is
one of the fastest growing industries with revenue expected in 2007 to amount US$ 320
billion and is increasing at a rate of 5% yearly.
5 Tata Strategic Management Group Analysis.

7
A further increase of 7%-8% is expected in the industry of retail in India by
growth in consumerism in urban areas, rising incomes and a steep rise in rural
consumption. It has further been predicted that the retailing industry in India will amount
to US$ 21.5 billion by 2010 from the current size of US$7.5 billion.
Shopping in India has witnessed a revolution with the change in the consumer
buying behavior and the wholesale format of shopping also altering. Industry of retail in
India which has become modern can be seen from the fact that there are multi-stored
malls, huge shopping centres, sprawling complexes which offer food, shopping and
entertainment all under the same roof. Indian retail industry is expanding itself most
aggressively; as a result a great demand for real estate is being created. Indian retailers
preferred means of expansion to expand to other regions and to increase the number of
their outlets in a city. It is expected that by 2010, India may have 600 new shopping
centres. Indian retail industry is progressing well and for this to continue retailers as well
as the Indian government will have to make a combined effort.
Organized Retail Vs Unorganized Retail
Global Retail Development Index-2011
As per Global Retail Development Index (GRDI) 2011 ( Table 1. 1 ) high saving
and investment rates; fast labor force growth; and increased consumer spending—make
India for a very favorable retail environment and the 4th spot in the GRD.

8
TABLE - 1.1
THE 2011 GLOBAL RETAIL DEVELOPMENT INDEX™
Source: Population Reference Bureau International Monetary Fund World Bank; World
Economic Forum; Economist Intelligence Unl; Planer Retail; A. T. Kearney analysis
2011 Rank Country Region
Market Attractive
ness ( 25%)
Country Risk (25%)
Market Saturation (25%)
Time Pressure (25%)
GRDI Score
Change in Rank
compared to 2010
1 Brazil Latin America 100.0 79.4 42.9 63.9 71.5 +4
2 Uruguay Latin America 85.0 73.8 63.6 39.6 65.5 +6
3 Chile Latin America 84.3 100.0 30.3 44.3 64.7 +3
4 India Asia 28.9 59.9 63.1 100.0 63.0 -1
5 Kuwait MENA 80.4 80.6 57.3 27.1 61.3 -3
6 China Asia 49.5 76.5 31.0 87.7 61.2 -5
7 Saudi Arabia MENA 70.9 80.7 50.6 35.7 59.5 -3
8 Peru Latin America 39.8 61.5 72.0 59.5 58.2 + 1
9 United Arab Emirates
MENA 87.6 88.9 12.6 42.9 58.0 -2
10 Turkey MENA 83.8 65.5 45.0 37.0 57.8 +8
11 Lebanon MENA 56.3 43.0 57.5 53.8 52.6 N/A
12 Egypt MENA 22.1 49.5 855 52.7 52.5 +1
13 Albania Eastern Europe 19.9 48.3 79.6 60.5 52.1 -1
14 Russia Eastern Europe 76.2 49.1 308 51.0 51.8 -4
15 Kazakhstan Asia 29.2 30.1 87.5 60.1 51.7 N/A
16 Indonesia Asia 38.2 53.0 54.5 58.8 51.1 0
17 Morocco MENA 22.6 72.9 528 54.8 50.8 -2
18 Philippines Asia 26.2 548 66.1 51.0 49.4 +4
19 Tunisia MENA 37.5 75.2 63.0 21.3 49.3 -7
20 Sri Lanka Asia 8.4 52.6 865 42.4 47.5 N/A
21 Malaysia Asia 53.9 64.0 18.0 52.7 47.2 -4
22 Mexico Latin America 74.6 67.5 16.3 23.8 45.6 +3
23 Vietnam Asia 8.4 35.0 48.8 85.1 44.3 -9
24 Colombia Latin America 45.7 54.0 35.8 36.9 43.1 +2
25 Argentina Latin America 60.4 26.6 44.2 38.4 42.4 N/A
26 South Africa Sub-Saharan Africa
46.9 898 15.2 17.2 42.2 -2
27 Panama Latin America 44.3 47.3 44.5 27.6 40.9 N/A
28 Dominican Republic
Latin America 39.5 0.0 74.2 49.0 40.7 -5
29 Iran MENA 33.5 3.4 89.2 31.0 39.3 N/A
30 Bulgaria Eastern Europe 45.1 56.2 4.9 50.2 39.1 -11
9
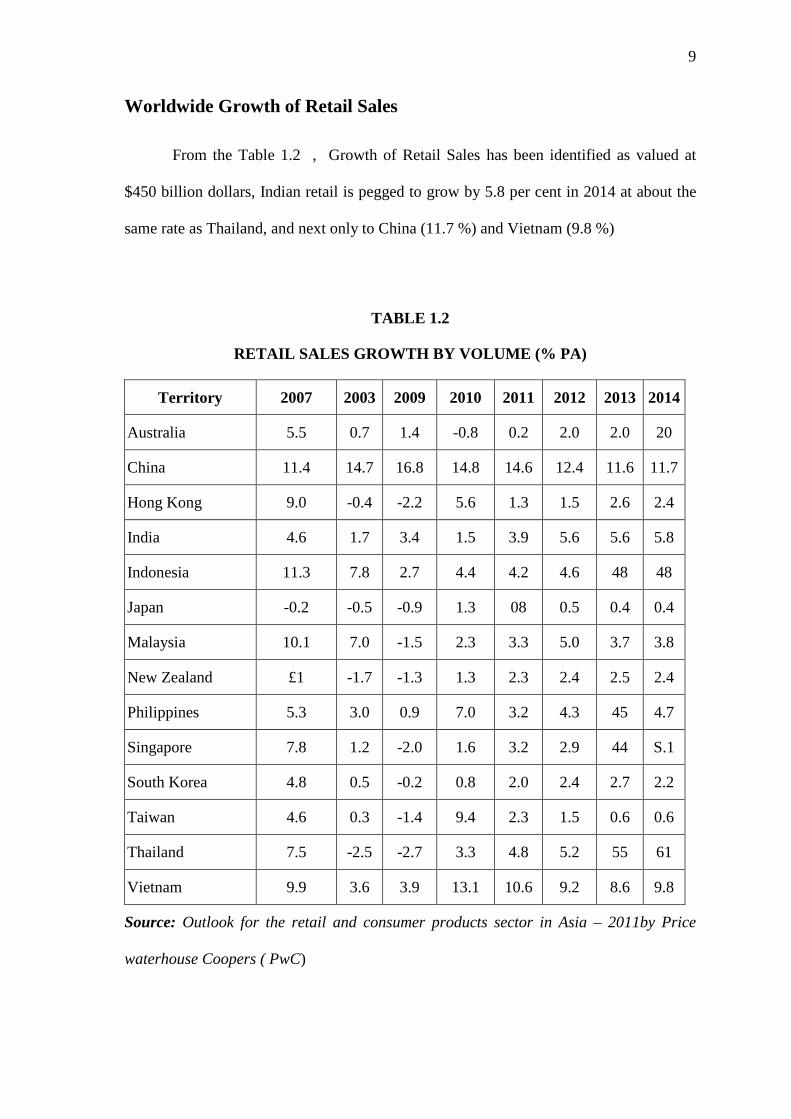
Worldwide Growth of Retail Sales
From the Table 1.2 , Growth of Retail Sales has been identified as valued at
$450 billion dollars, Indian retail is pegged to grow by 5.8 per cent in 2014 at about the
same rate as Thailand, and next only to China (11.7 %) and Vietnam (9.8 %)
TABLE 1.2
RETAIL SALES GROWTH BY VOLUME (% PA)
Territory 2007 2003 2009 2010 2011 2012 2013 2014
Australia 5.5 0.7 1.4 -0.8 0.2 2.0 2.0 20
China 11.4 14.7 16.8 14.8 14.6 12.4 11.6 11.7
Hong Kong 9.0 -0.4 -2.2 5.6 1.3 1.5 2.6 2.4
India 4.6 1.7 3.4 1.5 3.9 5.6 5.6 5.8
Indonesia 11.3 7.8 2.7 4.4 4.2 4.6 48 48
Japan -0.2 -0.5 -0.9 1.3 08 0.5 0.4 0.4
Malaysia 10.1 7.0 -1.5 2.3 3.3 5.0 3.7 3.8
New Zealand £1 -1.7 -1.3 1.3 2.3 2.4 2.5 2.4
Philippines 5.3 3.0 0.9 7.0 3.2 4.3 45 4.7
Singapore 7.8 1.2 -2.0 1.6 3.2 2.9 44 S.1
South Korea 4.8 0.5 -0.2 0.8 2.0 2.4 2.7 2.2
Taiwan 4.6 0.3 -1.4 9.4 2.3 1.5 0.6 0.6
Thailand 7.5 -2.5 -2.7 3.3 4.8 5.2 55 61
Vietnam 9.9 3.6 3.9 13.1 10.6 9.2 8.6 9.8
Source: Outlook for the retail and consumer products sector in Asia – 2011by Price
waterhouse Coopers ( PwC)

10
Country wise share of organized retail Organized versus unorganized debate
India's share of organized retail has just hovered around about 4 per cent despite
advent of big corporate in retail sector.
TABLE 1. 3
SHARE OF ORGANIZED RETAIL IN SELECTED COUNTRIES, 20 06
S
Source: Planet Retail and Technopak Advisers Pvt. Ltd – www.technopak.com
Country Total Retail Sales (US$ bn)
Share of Organized Retail (%)
USA 2,983 85
Japan 1,182 66
China 785 20
United Kingdom 475 80
France 436 80
Germany 421 80
India 322 A
Brazil 284 12
Russia 276 33
Korea, South 201 15
Indonesia 150 30
Poland 120 20
Thailand 68 40
Pakistan 67 1
Argentina 53 40
Philippines 51 35
Malaysia 34 55
Czech Republic 34 30
Vietnam 26 22
Hungary 24 30

11
Difference between Organised and Unorganised Retail
The Organised retailing refers to the trading activities undertaken by licensed
retailers that is those who registered themselves for sales tax ,income tax ,etc. These
include the corporate –backed hypermarkets and retail chains and also the privately
owned large businesses. The various forms of organized retail are
� Hypermarket: They store products of multiple brands comprising food items and
non-food items. Eg: HyperCity
� Supermarkets: These are self service stores selling food and personal care
products. E.g. Reliance Fresh
� Departmental Stores: Retails branded goods in non-food categories. E.g.
Shoppers stop.
� Specialty Chains: These focus on branded product or product category. E.g. Bata
Convenience Stores., EZone,etc
Organized retailing is based on the principle of unity and unorganized retailing is
based on the principle of singularity. Both organized and unorganized retailing is found
in most countries throughout the world. India and China are strong examples of countries
in which unorganized retailing is dominating the markets. Today these countries have a
growing economy today because of the influx of organized retailers into these markets.
12
The demand for giant malls with large department stores, cinemaplexes,
supermarkets, and pharmacy chains is the result of higher incomes and urban customers
looking for convenience in shopping. Large chains such as WalMart, McDonald's,
Vodefone, Dell and other organized retailers have reached across the world sharing their
retailing expertise.
The unorganized mom and pop retailers and independent retailers also continue
to fulfill the local needs. The organized retailing giants are trading their organizational
expertise for a share of the markets across the world.
Indian retail is dominated by a large number of small retailers consisting of the
local kirana shops, owner-manned general stores, chemists, footwear shops, apparel
shops, paan and beedi shops, hand-cart hawkers, pavement vendors, etc. which together
make up the so-called “unorganized retail” or traditional retail. Organized retailing is
based on the principle of unity and unorganized retailing is based on the principle of
singularity. Both organized and unorganized retailing is found in most of the countries
throughout the world. India and China are strong examples of countries in which
unorganized retailing dominated their markets. Today these countries have a growing
economy because of the influx of organized retailers into their markets. The last 3-4
years have witnessed the entry of a number of organized retailers, opening stores in
various modern formats in metros and other important cities. The growth in organized
retailing in recent years can also be gauged by the rise of shopping malls as well as the
rising number of modern retail formats.
13
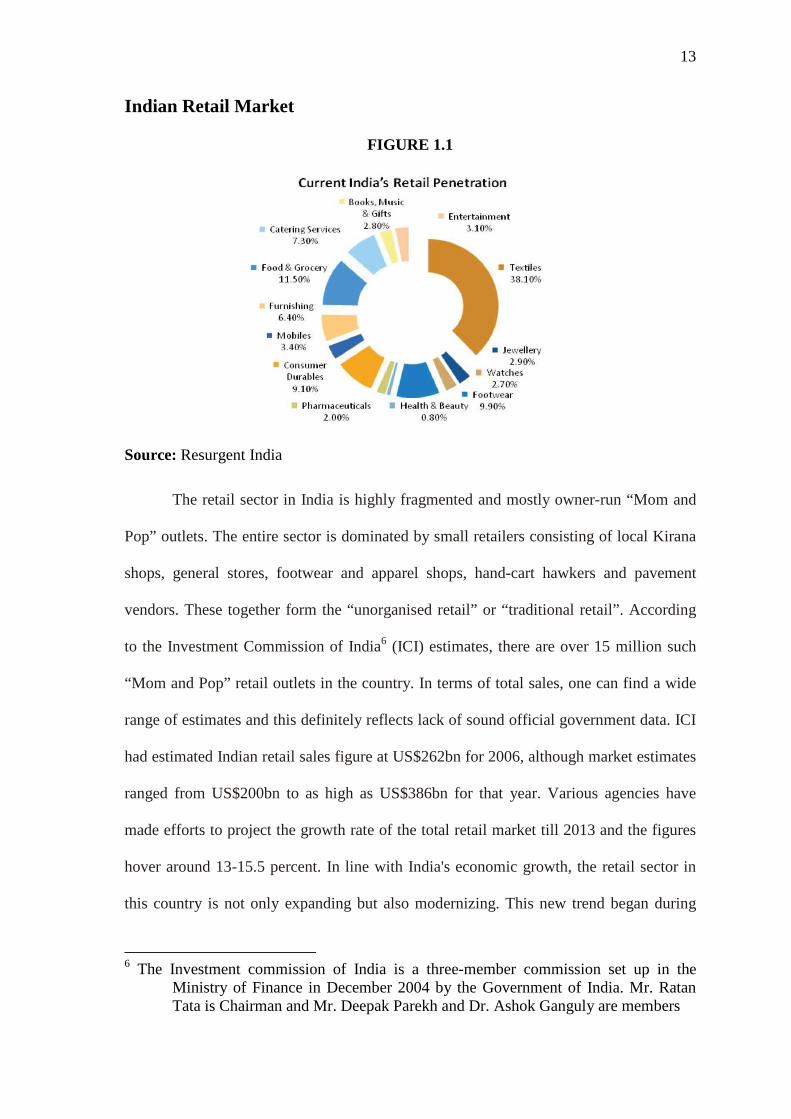
Indian Retail Market
FIGURE 1.1
Source: Resurgent India
The retail sector in India is highly fragmented and mostly owner-run “Mom and
Pop” outlets. The entire sector is dominated by small retailers consisting of local Kirana
shops, general stores, footwear and apparel shops, hand-cart hawkers and pavement
vendors. These together form the “unorganised retail” or “traditional retail”. According
to the Investment Commission of India6 (ICI) estimates, there are over 15 million such
“Mom and Pop” retail outlets in the country. In terms of total sales, one can find a wide
range of estimates and this definitely reflects lack of sound official government data. ICI
had estimated Indian retail sales figure at US$262bn for 2006, although market estimates
ranged from US$200bn to as high as US$386bn for that year. Various agencies have
made efforts to project the growth rate of the total retail market till 2013 and the figures
hover around 13-15.5 percent. In line with India's economic growth, the retail sector in
this country is not only expanding but also modernizing. This new trend began during
6 The Investment commission of India is a three-member commission set up in the
Ministry of Finance in December 2004 by the Government of India. Mr. Ratan Tata is Chairman and Mr. Deepak Parekh and Dr. Ashok Ganguly are members

14
late 1990s and early 2000s. In the midst of the unorganised retail sector's strong
dominance, some of the major industrial houses have entered into this sector and have
announced ambitious future expansion plans. Transnational corporations have also
joined hands with big Indian companies to set up retail chains. India's Bharti group
joined hands with Wal-Mart, the world's largest retailer and Tata group tied up with the
UK based Tesco, the world's third largest retail group. A perceptible structural change
towards an organized format is foreseeable in the retail sector. These organized and
modern retail formats generally consist of supermarkets/convenience stores,
hypermarkets, discount stores, specialty stores and departmental stores. These outlets are
usually chain stores, all owned or franchised by a central entity or a single store large
enough to form a part of the modern retail segment. The existence of these modern retail
outlets are generally found in malls and prominent high streets across various cities. As
discussed earlier, the retail market in India is primarily unorganized and the penetration
of modern retail is very minimal. This is in contrast to the trend in developed economies
of USA, UK, France and Germany where organized retail is in the range of 75-80 per
cent. As per the data released by ICI, organized retail market size was to the tune of
US$12.1bn in 2006, accounting for 4.6 per cent of the total retail segment. The late
diffusion and low share of modern retail is mainly attributable to the severe restrictions
on foreign direct investment (FDI) for retailing in our country till end of 2005. The
demand side characteristics such as moderately high economic growth, ever expanding
middle and upper class consumer base, high urbanization rate, increasing share of
women in workforce and greater availability of personal credit were definitely favorable
for a greater penetration of modern retail in the economy. In January 2006, India allowed
foreign companies to own up to 51 per cent in single-brand retail joint ventures (JVs) and
as a result the organized retail in India got a boost. Though multiple-brand foreign firms

15
are still barred in retail, they can set up wholesale operations. The growth in organized
retailing in the present decade may be gauged by the rise in number of shopping malls. In
1999, India had just 3 shopping malls measuring around 1 mn.sq.ft. and by the end of
2006, the total mall space rose up to 28 mn.sq.ft. with an average annual addition of 3.9
mn.sq.ft. Post 2006, on an average 8 mn.sq.ft. of retail space has been added annually
pan India taking the mall space to over 52 mn.sq.ft by the end of 2009. With partial
relaxation of FDI norms pertaining to retail, the modern retail market is expected to grow
at a healthy rate. There has been a creeping internationalization of retailing in the recent
past. As home markets are becoming crowded, modern retailers from developed
countries are turning to new emerging markets like India. The projected annual growth
rate of this segment of the retail market till 2013 is slated to be over 30 per cent. As a
result, its share in total retail market is expected to be around 11 per cent by 2013. On the
flip side, concerns have been raised that the growth of modern retail will have an adverse
impact on retailers in the unorganized sector. However, a recent study (2008) undertaken
by the Indian Council for Research on International Economic Relations7 (ICRIER) and
commissioned by Department of Industrial Promotion and Policy8 (DIPP), Ministry of
Commerce & Industry, Government of India has shown that there would be a positive
sum game in the retail sector in India where both organized and unorganized retail
segments not only coexist but also grow substantially in size. As a result, it is expected
that a positive environment is likely to be prevalent in the economy which would take the
organized retail on a high growth trajectory.
7 Established in August 1981, ICRIER is an autonomous, policy-oriented, not-for-profit,
economic policy think tank. 88 The Department of Industrial Policy & Promotion was established in 1995 and has
been reconstituted in the year 2000 with the merger of the Department of Industrial Development. Earlier separate Ministries for Small Scale Industries & Agro and Rural Industries (SSI&A&RI) and Heavy Industries and Public Enterprises (HI&PE) were created in October, 1999.

16
Dynamics of Organized Retailing
The economic meltdown of 2008 and 2009 has brought in some important
alterations in the organized retail market in India. During the boom period, prior to the
downturn, the outlook for this sector exuded confidence. Lots of developers announced
their forays into mall development and the penetration of modern retail was expected to
grow at a phenomenal rate. However, as a result of the economic slowdown in the last
couple of years, bullish sentiments have given way to the much needed cautious and
consolidative approach among developers and retailers. Lease rentals have been
renegotiated and a substantial correction in the rental rates has taken place. Mumbai
witnessed an average rental correction of 15-20 per cent during Q1 2008 to Q4 2009
while the average correction in Bangalore and NCR was more than 25 per cent during
the same period. Apart from rental corrections, various lease rental models have evolved
as a corollary to coping strategies adopted by the stakeholders of organised retailing
during 2008 and 2009. Zero rental schemes and revenue sharing models are options that
are proving increasingly attractive to retailers looking to trim costs and to property
owners seeking to maintain occupancies. Revenue sharing models are based on the
premise that rent paid is linked to store performance. Some retailers are also attempting
to negotiate a combination of zero rentals and revenue sharing agreements, whereby a
period of zero rentals will be followed by revenue sharing for a duration until sales
volumes begin to rise again. Another variant that is increasingly gaining importance is
revenue sharing with a minimum guarantee from the retailer's side. In addition to the
short-term measure of renegotiating rent, retailers are also looking at long-term
initiatives in order to trim costs and diversify risk. Certain national brands have started
exploring relatively untapped or growing segments in order to diversify their range of
products. Consolidation of operations by reducing number of outlets is also another

17
strategy adopted by several retailers to beat the adverse consequence of oversupply
created during the boom time. Once the phase of control and consolidation is over,
significant new trends could well begin to emerge across the board. Retailers are
expected to shift focus to food and related items, rather than lifestyle goods. In addition
to this, Tier I and Tier II cities could become more attractive propositions for developers
and retailers due to lower rentals and operating costs and high growth in population.
Market Review
Mumbai bears the tag of being the financial capital of the country and contributes
around 5% of the country's GDP. The city is home to important financial institutions like
the Reserve Bank of India, the Bombay Stock Exchange and the National Stock
Exchange. Besides being the entertainment capital of the country, the city has rich
cosmopolitan demographics. These factors also ensure that the city remains foremost in
terms of the real estate development. The region referred to as Mumbai Metropolitan
Region (MMR), covers the city of Thane and Navi Mumbai along with Mumbai city.
Mumbai, which houses the first Mall in the country, has a total organised retail stock of
8.72 mn.sq.ft. and will witness 11.26 mn.sq.ft. of new retail development over the next 3
years. The city is home to some of the most prominent and successful malls in the
country and the retail rentals are amongst the most expensive in the world. While the size
of the consumer market in the city is particularly large, the pace of retail real estate
development has outgrown the organised retail business over the last 4-5 years. This
situation, coupled with the global financial crisis in 2008, forced retailers to curtail their
expansion plans and put some large retailers on the brink of bankruptcy. While the
confidence of the retailers was shaken, the mall projects in the city were stalled due to
poor liquidity. Retail and commercial projects of the city were on a negative list of the
institutional lenders which made situation worse for commercial real estate segment.

18
According to Knight Frank Research 9While the situation has improved since mid 2009,
the retail space vacancy across the city still remains high. Many mall projects have been
marred because of poor design and also high concentration of malls in particular
catchment area. Taking cognizance of the poor demand situation, some malls with high
vacancy have started leasing space to office occupiers instead of waiting for retailers
Mumbai currently has 8.72 mn. sq.ft. of major operational mall space in the city. These
malls are spread all over the city, stretching from Nariman Point in South Mumbai to
Bhayander in the Western Suburbs and Kalyan in the Central Suburbs. The city of
Mumbai is divided into 4 zones: Island City, Western Suburbs, Central Suburbs and Navi
Mumbai. The malls in these zones have been analyzed and their characteristics have been
studied in order to provide a thorough examination of mall space in Mumbai.
Zone Locations
Island City : Nariman Point, Haji Ali, Worli, Lower Parel, Dadar, Mahim
Western Suburbs : Bandra, Santacruz, Andheri, Goregaon, Malad, Borivali,
Dahisar, Mira Road- Bhayander stretch
Central Suburbs : Matunga, Chembur, Ghatkopar, Mulund, Thane,
Kalyan, Bhandup
Navi Mumbai Airoli, Vashi, Kharghar
Source: Knight Frank Research
9 http://www.knightfrank.co.in/en

19
As mentioned above, the Island City zone of Mumbai encompasses all of South
Mumbai, Worli to Nariman Point, as well as Prabhadevi, Dadar and Mahim. The major
micro-markets covered in the Island City are Nariman Point, Worli-Prabhadevi, Lower
Parel and Haji Ali-Kemps Corner. Some of the major malls in the zone include High
Street Phoenix located at Lower Parel and Atria Mall located at Worli. Since the Island
City is considered to be a fairly up market residential area, there are a large number of
national and international brands present here. Two out of the three major high streets
that were covered in this study are present in this zone, further enhancing this zone's
exclusive status. Crossroads, the first mall in the country, located at Haji Ali was shut
down and bought by the Future Group in 2006 to convert it into office space with some
amount of retail space as well. The initially unorganised retail space has now been
organised and is referred to as SoBo (South Bombay) Central Mall, having a built up
area of 0.1 mn. sq.ft. This name of the retail space was given as recently as 2009.
Currently, there is just a fraction of the space that is used commercially, with the
majority comprising retail space.
This zone saw the development of a new mall called Palladium, which is the
newest part of the High Street Phoenix Mall at Lower Parel. It is referred to as Phase 3,
came into operation in 2009 and has a built up area of approximately 0.2 mn. sq.ft. The
Island City only accounts for 15% of the major operational malls in Mumbai with a total
built up area of 1.3 mn. sq.ft. As mentioned earlier, owing to the large volume of
organised retail in this zone, there is a lack of dependence on mall space. Furthermore,
the average mall vacancy is only 4% since there are only 5 major malls in the Island
City. With a smaller number of malls in the zone, it is unlikely that any of them would
operate without full capacity.

20
Western Suburbs
Our scope of research is the Western Suburb of Mumbai covering Bandra to
Borivali and some of the major micro-markets falling under the Western Suburbs include
Santacruz, Linking Road in Bandra, Andheri, Malad, Goregaon , Kandivali and Borivali.
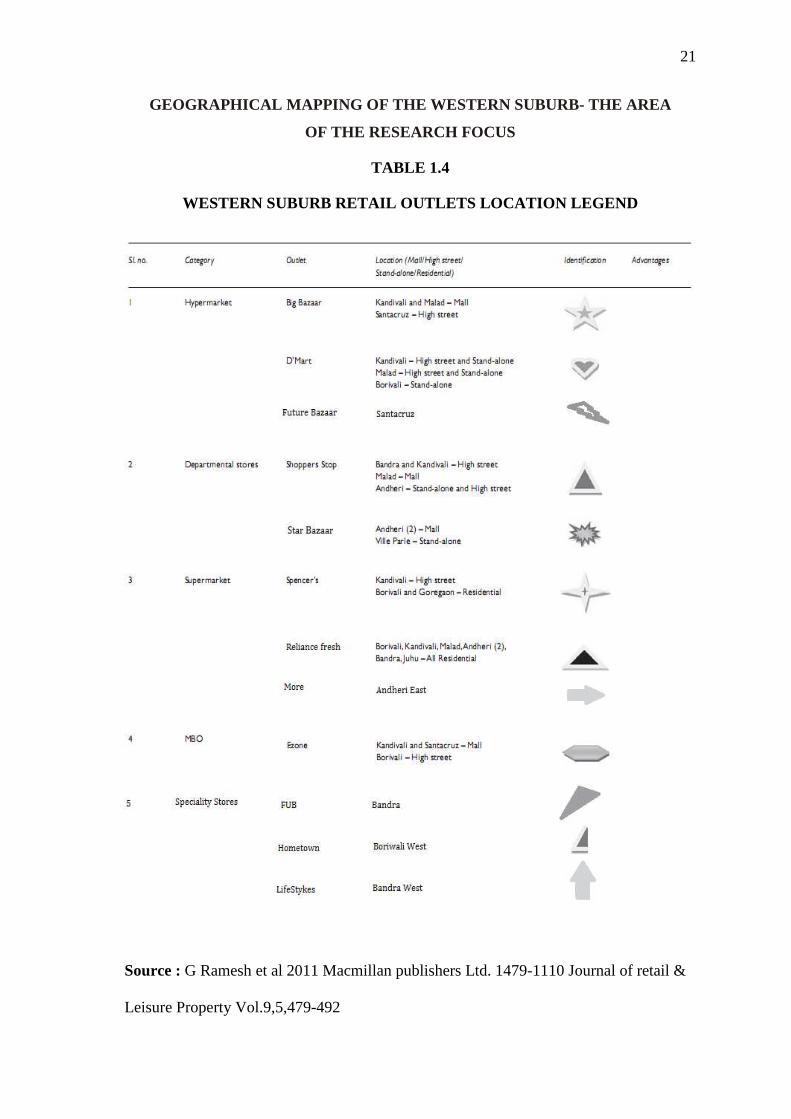
A geographical mapping of the area is placed as figure 1.1 with the different formats of
retail outlets and some of the prominent retail brands with location using semiotics. The
legend with the outlets and its identified semiotics are put up as Table 1.4 for easy
reference.
21
GEOGRAPHICAL MAPPING OF THE WESTERN SUBURB- THE ARE A
OF THE RESEARCH FOCUS
TABLE 1.4
WESTERN SUBURB RETAIL OUTLETS LOCATION LEGEND
Source : G Ramesh et al 2011 Macmillan publishers Ltd. 1479-1110 Journal of retail &
Leisure Property Vol.9,5,479-492

22
FIGURE 1.2
RETAIL LOCATION WESTERN SUBURB OF MUMBAI
Source : G Ramesh et al 2011 Macmillan publishers Ltd. 1479-1110 Journal of retail &
Leisure Property Vol.9,5,479-492

23
Statement of the Problem
Brand Equity of a product has been in prominence across the globe and its
measure is of another importance cutting across all the products be it fast moving or the
durables. However, from the service point of view, this equity concept has not taken
wings among the managers and marketers especially in the business of Retail sector.
This shows clearly that both the Management and the Marketers are neither much
worried about nor concentrate on the places where the different products are available.
The issue of Organized Retail although has a nominal growth of about 4 to 5 % in the
entire retail industry in India, it is indeed gaining momentum considering the fact that the
government has provided the much needed and expected fillip to the issue of Foreign
Direct Investment in the Single Brand business and also in the Multi brand Business.
Keeping this as the strong background as the problem identified, this research was
initiated and the statement of the problem is appended below
“Measurement of Brand Equity for a product is in prevalence but the same
is not so in the case of Service aspect especially with respect to Retail outlets as a
service provider. Hence there is a strong felt need in research attempts on the issues
related to Brand Equity on Retail outlets and its Measurement”.
Need for the study
Many Researchers have carried out extensive studies on the brand equity issues
in relevance to Products. However, very few studies are found even globally on the
Brand Equity study of Services especially in reference to Organized Retail Outlets.
Hence a need was felt to pursue a study to understand the concept of Brand Equity with
reference to Organized Retail outlets and to formulate an equation which will necessitate
measuring the brand equity of a particular Organized Retail outlet/store. The scope of

24
the research is limited to the area covered under the Western Suburb of Mumbai region
only ( From Bandra to Borivali ).
Various studies and extensive research have been undertaken to study the concept
of Brand Equity and its application with respect to Products. However, not many have
been done as on date in order to study the concept of Brand Equity with respect to
Services and in particular the organized Retail Brands. Hence the motivation to develop
into a research area will enable to bring out a better understanding on the concept of
Retail Brand Equity and its application. Although the organized retail has just touched
upon the 5 % mark as its share over the entire Retail Sector, we have taken a sizeable
strength of Organized Retail brands under various Formats in the catchment area of
Mumbai suburbs. The challenges faced by undertaking this research is the fact that the
equity measure is based on the customer patronizing the store/outlet and the concerned
outlet per se may not be convinced with these projections. Unfortunately, we are bound
to go by the projections as given by the customers who are the real judge anyways.
However, vital information have been duly cross checked with the experts at the time of
in depth interview that we have conducted.
Significance of the study
In the light of the fact that very few studies have been reported or rather
identified across the globe in the field of Brand Equity of Organized Retail Outlet, it is
indeed significant to undertake the study not only to understand the concept of Brand
Equity but also to formulate an equation to measure the brand equity of an organized
Retail Outlet.

25
Scope of the study
The Scope of the research includes the Organized Retail outlets in Mumbai. Data
for this study were collected from about 3000 shoppers by intercept method intercepting
them immediately after they finish their shopping from a particular organized Retail
outlet. In addition to this, supplementary information were also used from the sources of
Retailers Association of India ( rai) which is head quartered at Mumbai.
Research Methodology
Theory Building Up
In order to understand more on the problem recognized, numerous articles from
various journals were reviewed. These articles are referred in the review of literature
chapter. Also theory building up helped us to establish the specific indicators and
constructs which are in turn used to develop a structured questionnaire.
Establishing the constructs
As indicated in the previous paragraph, based on the theory build up, specific
indicators say about 45 were identified covering different attributes such as product
assortment, Service quality rendered, ambience ( both internal and external), pricing
issues, facilities provided etc. These indicators were then grouped into four constructs as
per Aaker model. They are Brand Awareness, Brand Association, Perceived Quality and
Customer Loyalty. For the sake of ease in reference, these constructs were written in an
acronym form such as Brand Awareness as BAW, Brand Association as BAS, Perceived
Quality as PQ and Customer Loyalty as CL.

26
Developing Research Questions, Hypotheses and Research Objectives
Research Questions
The following questions were developed on the basis of the theory building up.
1. Does the concept of Brand Equity in the Organized Retail outlet has an
significance on the Brand Image of the Outlet?
2. Does Strong Brand Awareness for a brand helps to create strong Brand Equity?
3. Does Strong Brand Association for a brand helps to create strong Brand Equity?
4. Does Strong perceived quality for a brand is positively related to Brand Equity?
5. Does Superior customer Loyalty of a brand helps to create strong Brand Equity?
TABLE 1.5
LIST OF ABBREVIATION
Abbreviation Expansion
SB Star Bazaar
SS Shopper’s Stop
FUB Furniture Bazaar
SP Spencer
EZ EZone
BB Big Bazaar
HT Home Town
DM D Mart
RF Reliance Fresh
LS LifeStyle
MO More
FB Future Bazaar
BAW Brand Awareness
BAS Brand Association
PQ Customer Perceived Quality
CL Customer Brand Loyalty

27
Categorization of Retail Brands under specific Organized Retail
Outlets Formats
The Current Research is specifically on the Organized Retail sector which is
categorized into various formats. For the Study, specific Retail brand of Outlets falling
under specific formats have been chosen as per availability under the scope of the
research ( From Bandra to Borivali) and on the basis of certain evaluation. A Sample List
of the Retail Formats with example is placed in Table 1.6
TABLE 1.6
CATEGORIZATION OF RETAIL BRANDS UNDER SPECIFIC ORGA NIZED
RETAIL OUTLETS FORMATS
Sl No Organized Retail Formats Brands
1 Hypermarket HyperCity
2 Supermarket Reliance Fresh, Star Bazaar,etc
3 Departmental Store Shopper’s Stop, Big Bazaar,etc
4 Discount Store D Mart, Spencers
5 Specialty Store Croma, Crossword, Bodyshop etc
6 Multi Brand Outlets (MBO) Vijay Sales, Next etc
Source : Prepared for the Study based on discussion with experts
Research Hypotheses
Following are the specific Hypotheses (H) developed as a declaration to the
Research questions.
HSB: Retail Brand Equity positively influences the retail brand image of the
Brand SB in terms of the four constructs BAW, BAS, PQ and CL
HSS: Retail Brand Equity positively influences the retail brand image of the
Brand SS in terms of the four constructs BAW, BAS, PQ and CL

28
HFUB: Retail Brand Equity positively influences the retail brand image of the
Brand FUB in terms of the four constructs BAW, BAS, PQ and CL
HSP: Retail Brand Equity positively influences the retail brand image of the
Brand SP in terms of the four constructs BAW, BAS, PQ and CL
HEZ: Retail Brand Equity positively influences the retail brand image of the
Brand EZ in terms of the four constructs BAW, BAS, PQ and CL
HBB: Retail Brand Equity positively influences the retail brand image of the
Brand BB in terms of the four constructs BAW, BAS, PQ and CL
HHT: Retail Brand Equity positively influences the retail brand image of the
Brand HT in terms of the four constructs BAW, BAS, PQ and CL
HDM: Retail Brand Equity positively influences the retail brand image of the
Brand DM in terms of the four constructs BAW, BAS, PQ and CL
HRF: Retail Brand Equity positively influences the retail brand image of the
Brand RF in terms of the four constructs BAW, BAS, PQ and CL
HLS: Retail Brand Equity positively influences the retail brand image of the
Brand LS in terms of the four constructs BAW, BAS, PQ and CL
HMO: Retail Brand Equity positively influences the retail brand image of the
Brand MO in terms of the four constructs BAW, BAS, PQ and CL
HFB: Retail Brand Equity positively influences the retail brand image of the
Brand FB in terms of the four constructs BAW, BAS, PQ and CL
H1 : Strong brand awareness for a brand helps to create strong brand equity
H2 : Strong brand association for a brand helps to create strong brand equity
H3 : Strong perceived quality of a brand is positively related to brand equity.
H4 : Superior customer loyalty regarding a brand helps to create strong brand equity.
29
Objectives of the study
The Primary Objective of the research would identify the effect that both the
brand image of the store and the perceived value as realized by the customers in shaping
the brand loyalty and in turn deriving good brand equity.
The following are the Sub objectives of the current study on the brand equity
study on Organized Retail Outlets.
� To establish the factors which influences the Brand Equity of an Organized Retail
Outlet and helps decision making by the consumers selecting a particular retail
outlet for patronizing
� To analyze and identify those established factors which are dependent and
independent on the Brand Equity of the outlet using the data collected on Twelve
(12) brands of Organized Retail outlets in Mumbai covering Three Thousand
(3000) Shoppers.
� To carry out inferential analysis on the chosen brands of organized retail outlets
and to formulate a mathematical equation using the multiple regression analysis
that can be used to measure the brand equity of a particular retail outlet.
� To Construct a Brand Equity Equation and Brand Equity Index that could capture
the full domain of Brand Equity using specific models and Statistical tools and
analysis with respect to Organized Retail Outlets/Stores.
Research Design
A Research Design is the arrangement of conditions for collection and analysis of
data in a manner that fits the requirement of the research purpose keeping in view the
expenditure aspects also so as to have an effective and comprehensive procedure. The
arrangement of conditions suitable for collection and analysis of data depends on the
subject and purpose of the research study.
30
To study the brand equity of organized retail outlets, the descriptive research
design has been adopted. The descriptive research involves collection of data with the
help of a designed questionnaire by using an appropriate sampling procedure and
analyzing of the same using inferential statistical techniques to find out the measure of
the retail brand equity of the organized retail outlets in Mumbai.
Tools for data collection
Structured questionnaires were distributed to find out the data of the
consumer/shopper experience in the organized retail brands categorized under various
formats in the geographical area of Mumbai. Data were collected on the basis of
qualitative study such as in depth interview with senior management personnel of
various brands of organized retail and focus groups conducted across different ranks of
specialist in the retail and other field. There are primarily two ways of collecting data
with regard to understanding the brand equity aspect as advocated by prominent authors
and experts of the subject. One is using the method called residual wherein the data
related to the opening and closing stock of all the Stock Keeping Units ( SKU’s) of
different products is needed. The second method is consumer oriented and requires
understanding the experience of their shopping in a particular organized retail
outlet/store. Application of the first method was found to be difficult as on the basis of
in depth interviews with senior management people indicated the non readiness towards
the divulging of internal data. Hence the second method focusing on consumer/shopper
orientation was chosen. The data related to the consumers/shopper’s experience were
collected based on the catchment area where the outlet/store was located and on the basis
a set of common attributes associated with the Organized retail outlets/stores. Also as the
study is related to measuring the brand equity of the outlets, a minimum of 12 brands of
the organized retail brands in Mumbai was felt as a bare necessity.
31
Type of Data Used
The primary data, which is the back bone of the study in terms of its effectiveness
and requirement, is collected for the purpose of analysis from the various organized retail
outlets and also the secondary data were collected as appropriate for interpretive and
corroborative purpose.
Framework of Analysis
As part of descriptive analysis, mean, Standard Deviation, Percentages,
Distribution, Bar Charts, etc., are used. As a part of inferential analysis, of test, Analysis
of Variance (one way correlated and two-way without replication), Multiple Regression
Analysis, Factor Analysis using Structural Equation Modeling and the respective follow
up tests have been used to analyze the data. Different Organized Retail Brands
representing specific formats of Organized Retail Outlets in Mumbai are chosen so to
have an appropriate mix of units for the purpose of the study. The choice of the units is
based primarily on the catchments areas followed by the availability of Retail brands in
the area identified. While the object of evaluation was the Organized Retail brands, the
subject of evaluation was the regular consumers/shoppers who are visiting the various
Organized Brands of Retail Outlets/stores. In order to bring in a substantial result, the
respondents were identified as those who finish their shopping and their respective
opinions were captured at the exit level. Although this exercise was subjected to lot of
inconvenience to the shopper, maximum care was taken to get the most unbiased
responses from them.

32
Sampling Size and Sampling procedure
While the population of Organized Retail outlets across is more than 100 and the
shoppers are countless, from the Subject of evaluation point of view ( vide Table 1.6 &
vide Objective b), and the scope of the research restricted to the western suburb covering
Bandra to Borivali, a sample of Twelve (12) Organized Retail brands representing
different format were taken and from the object of evaluation point of view, a sample of
3000 consumers/shoppers were taken on the convenience of the researcher on the
purposes selected for the study.
Data Collection
The data was collected from among the object respondents through a structured
questionnaire (vide Appendix A – page No.273 ) which was subjected to its validity and
reliability using various test such as Cronbach Alpha Test etc. The responses were
collected through specially trained students by incentivizing them appropriately.