Embed Size (px)
Citation preview

CHAPTER 1 INTROD,UC TION . ~ ~.;..:; .

Sulphur is an important element· in the blosph~re
antl' occu,rs abundantly throughou't the earth's crust at aft ,
a:v;~rage concentration o.f about 0.1 per cent and as S02
in ~4~ atmosphere. at an average concentration ~f 0.003 pp~~
In recel]~ years on account of indus~tialization and increas ...
ing consumption of fossil fuels, emission of /SOZ 'has
steadily increased in India (Parikh,1977; Varshney and '
Garg, 1978).
The problem of S02 p01~V~ton has created
s.,er~ous concern in many countries lt~r, Canada, France, U.K. t
and U. S .A,., where complete lan'dscapes h~ve been destroyed , : (. ~:. ~ ! :t
by S02 pollution. The current ambien~, S02 levels in some
of the iinport,~pt ci ties of the world (Table 1) range from , • j i
60 - 600 llg m- 3·whichhave been shown to cause extensive •
losses to plan'ts (Hawksworth and Rose, 197Qi; Grodzinski. and' / .. ';. :. '
Yorks, 1981). 'Relatively susceptible specie~. are eliminated
in chronically polluted areas wi th the conseq~~n,t. changes 'in
the species compO,sition (Kozlowski, 1979, 1980) .•
fo~m of acidic def:,Q$.i tion interferes wi th the h;iR~i~~qf,~~'J1li'cal
cycling in the ec?.sy~stem and brings out irreversi~~~:., ~~l1g~s ,"
in the structure of,.'~,cosystem (Holdgate, 1979). ' De~S'~jr~~it;ipn ..
of copper basin area·.! of Tennessee (USA) whe're about :J09,~1t
acres of ri,ch decid.8.11 s,,- forest was completely destroyed
another 17 000 acf~s Qf'natural forest was replaced with , , " ;'" . grassl~~4 speFt~;; "dreqgecock, 1912) and disap~~aran:ce' of i

2
Table 1. Ambient S02 concentration of some importa~t.
cities of the world
Clty Year
Athens 1979 ISO··
Copenhagen 1976' 60*
London City 1976 260*
London greater 1976 150·
Milan 1976 600·
Paris 1976 110·
Stockholm 1976 ·70* .
To.ronto 1976 170·
2610 lJgm-3 =' 1 ppm
Source: It STIC'UUNG CONCAVE - THE HAGUE Report4/76 ,
** Lalas~, et a1., 1982 --

3
conifer trees along a narrow valley in Connecticut, USA (TOUIey,
1921) are some of the exampl~s of S02phytotoxic~ty.
The cost of S02 damages to crops'oofruits etc.ohavenot
been worked out for many developed or developingcotmtriesbut
they are escalating with the increasing in~trialization and i ..
. urbanization. A recent estimate shows that the cost of air
pollution damage in USA varies between US$ 2 billion to 5 billion
per year (El Hinawi, 1981).' .' i
The problem of S02 pollution is increasing 'in
India, but data on the cost of air pollution damage are
not availab Ie. A prel iminary survey of the S02 level5,
in the ambient air of seven cities of IndiaCfable' 21 . shows that average S02 levels vary between 0 .• 0.02 to O.~l
ppm i' (National Committee on Air Pollution, ~9 72). Since
thEm, S02 levels have increased due to our rapidly growing
consumption of coal and other fossil fuels (Varshney and Garg,
,1978). Relatively high concentrations of S02 are c<?mmon
in highly industrialized pockets, but the long range tfcmsportation '
of pollutants does not leave unindustr!alized fUrAI .reas
and countrys ide free from pollution problems ~ A policy
,of decentrali zed industrial growth persuaded by the Indian
.Government has promoted i!lcreasing industrialization ,of
small townships and extension of heavy industry tell back-
ward regions. The policy of diffused industrial growth •
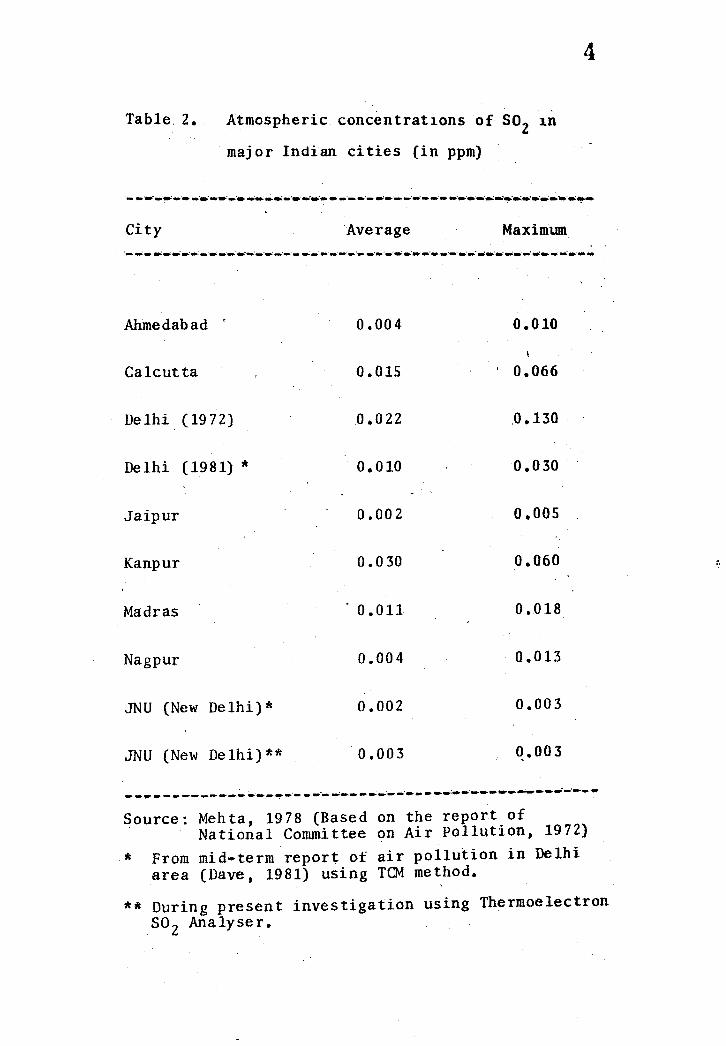
Table, 2. Atmospheric concentrat1onsof SOZ 1n
, maj or Indian cities (in ppm)
4
- __ ' .. - ................... _._ ... _._'; ...... _'_ .... _~ ... _. __ ._ ... _-____ • __ ....... _-... ·_ ... ---. • .: ... __ • ____ T __ ~ ...
City Average Maximtun .-...... -= ... -.-:-,:-............. -.-.~-.-.-.-=-.-.-.-.-.... -............ -- ... -.-.-.-.-.--.--... -.-.... -~
Ahlnedabad 0.004 0.010
Calcutta 0.015 0.066
Delhi (1972) 0.022 ,0.130
Delhi (1981) * 0.010 0.030
Jaipur 0.002 0.005
Kanpur 0.030 0.060
Madras . 0.011 0.018
Nagpur 0.004 . Q.013
JNU (New Delhi)* 0.002 0.003
JNU (New Delhi) ** 0.003 Q.003
------------.. ~--~-.--:---.-=-.. ,---.--... --~-; .. -................... -... -_ ..... _-Source: Mehta, 1978 (Based on the report of
National Committee <?n Air Pollution, 1972) * From mid-term report of air pollution in Delhi
area (Dave, 1981) using TCM method.
** During present investigation using Thermoelectron S02 Analyser.
"

·5
adds to. the problem of S02 pollution due to local emissions
from industries established in rural/backward areas. On actount of these reasons the ambient S02 levels are going
to increase dramaticalJy in the foreseeable future"
S02 affects plants both at acute and chronic
leve Is of exposure. In general, chronic injury results
in chlorosis· which is usually lnter-coastal in distributio.n.
In the chlorotic areas the cells are. not ·1<:illed but the
chlorophyll is bleached. The chlorotic areas become
browni.sh red in colour. Leaves n:,~main turgid but function
at a reduced leve Is of efficiency. Acute injury is .. signalled by a cell plasmolysis leading to necrotic collapse
of leaf tissue (Thomas, 1961). Initially, the affected
leaf areas appear water-soaked, the metabolic processes
cease~ resulting in the drying up of the affected areas, i.e.
Recl'osis (Thomas, 1961; Brandt and Heck, 1968).
The symptomology.of S02 injury has bee~
ex.tensively studied "and documented by Barrett and
Benedict (1970), Baut and Stratmann (1970), Hawksworith
(J911, 1914), LeBlanc and Rao (1973), Mudd (1975),
Ziegler (1975.1, Davis and Wilhour (1976), Varshney and
Gar~ (1979 ).and Manning and Feder {19BO). Most of the
studies on plant'responses to S02 have use.d relat:jv~iy
high leve Is of S02 and thus do not re'flect the 'real
5ituation. Whereas, low levels of SOZ:have been found

6
to affect plants hoth at individual and community levels~
Low l.evels of S02 have been shown to ~reduce feaf area,"
biomass, growth, fruit and seed deve lopmen t" and yield "
(T~omas, 1961} Brandt and Beck, 1968; Heagle""~ "a}.:,"'19~4::
Sprugel ~al., 1980). Various plant processes such as:
photosynthesis, respiration, transpiration, nitrogen
fixation, reproduction etc. are adversely affected by 502
, (Malhotra, 1977; Ma ""~a1., 1973; Bull and Mansfield, 1974;""
Hallgren and Huss, 1975; Ma and Khan, 1976; Murdy and
Ragsdale, 1980; Varshneyand Varshn~y, 1981).
At biochelIlical level plant ,responses t~502
have been eVqluated in terms· of carbohydrate, protein" and
chlorophyll C·(i)J);tent .. and enzyme activity' CRabe and Kreeb,
1979; Pahlich, 1972, 1973; Malhotra and Hocking, 1976;
Wallace and Spedding, 1976; Varshney and Varshney, 1979.;
Pierre and Queiroz, 1981}.
.. - It is widely believed that ecophysiological
and bi!Jchemic~l changes are likely to occur much before·
the appearance of any visible change at sub~chronic.
levels of sg2'- Plants exposed tosllblethal'\c,9n~ent.ration
of S02 may a~Rear green and normal but· their. bioch~mical",
and physio19.gica1" processes are subdued and they genera~ly" , ..
funct:iona1;.,~ a;"reduced efficiency. The invisible changes' . ..' .:.~-:'" ~'II .'
c~used~··b'¥ .. {non-necrotit S02. exposure, can, however, be ,1. ," .. "
de,tec'~ed,(a t me tabo1ic 1eve 1 by examining certain , ~,;' , ; .. ', ,~. ';
P)hY;~~~'logica1 and biochemical parameters. ~ ... ", .

7
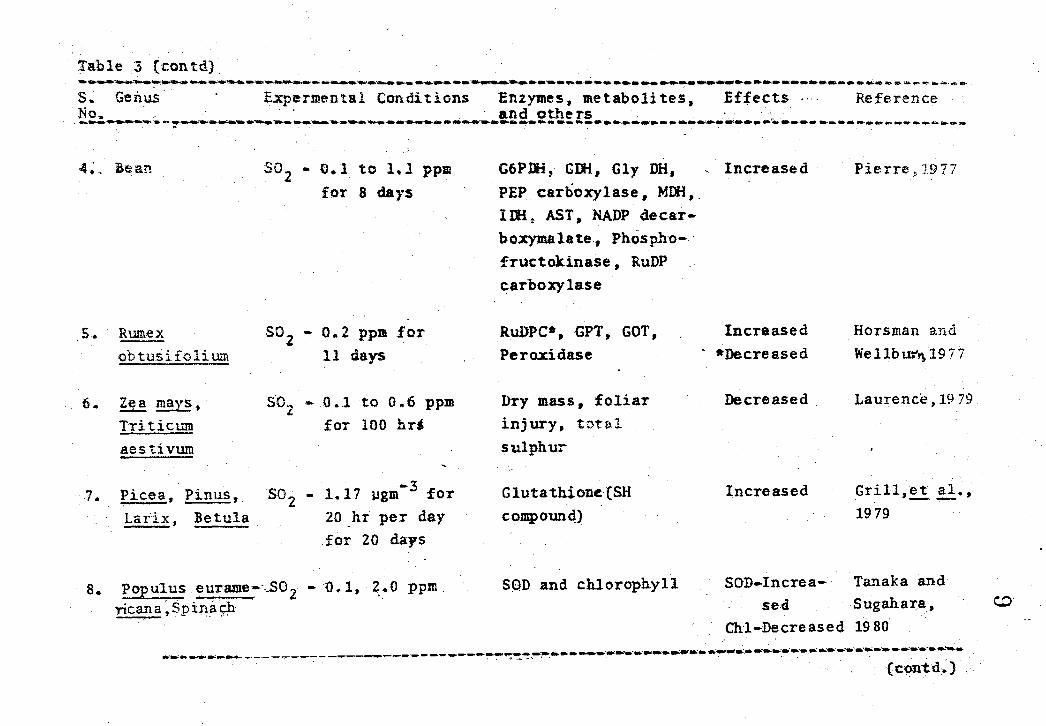
, Most of the studies (Table 3) conducted to
evaluate the response of plpnts to S02 at biochemical
level reveal that relatively high concentrations of SOz'
1.e. ,more than 2S pphm~ have been employed. Furthennore II
these studies provide lit'tIe guidance in terms of real
life situation where S02 concentrations are seidom as high
as have been used by earlier workers (Table 3). Therefore;
it has been suggested that S02 leve 1s less than 2S pp~
should be regarded as the upper limi tl£or ob~aining meaning-
ful results' on the plant response tc S02 (Bell and Clough.
1973; Bleasdale, 1973; Bull and Mansfield, 1974; Ashenden,
1978; Ashenden and Mansfield, 1978; Wellbum 'et al. J 1981). -- '
The criteria for selecting S02 copcentr~tions
uSed by various workers have not been properly discussed.
Moreover. the dividing line between the injurious and
non-injurious concentrations is not well defined because
plants vary in their susceptibility to S02 according to
the species, sub-species J stage of growth, and othar
environmental factors. f\-loreover,at present, the permissi ... , ' '
bIe levels of S02 for air quality criteria are based on
the ~ppearance of visible injury though plants often get
severely affected at concentrations much lower than the
Lrescri,bed limit Crable 4). "

Table 3. Effects of low levels of S02 on plants -- ..... -....... ~--.. -~ ............. -.... ~ ... ..,.. ......... ~ ............. ~ ................. .....:~ ................. ~ .. -. ............. .,:~ .. ...-.. ..... ~.~ ......... --........ ..: ...................... ~ ..... ... .. _.., .~ ........... ,.
S. Genus No •
/ Experimental Condi tfons EIlz:yme ,me taboli tes, Effects and others
Re,ference
... -....... ---... -~ ....................... -....... -... ----.... --.. .... -.... -....-... ... ..,;, ......... ~~ ........ -: ........ --.:, .. ,...-.: .... ~~ ............... --... -...... -~---~ .......... --.. -.: ... ..-..... -~- ... .... . ,.,. ,--'.
1. Pistml sa t ivum
Z. Lolium perenne.
SO 2 - 0.2, 1.\), 1.5, Z.O ppm
NO Z - 0.1, 1.0 ppm
for 6 days
502 - 0, 50, 100, 200, 400 usm" 3
for 77 days
Activities of RuDPC, Increased GPT,GOTjperoxidase
Horsman and We 1 Ibu.rn, 1975
Sulphur iri leaf, plant yield
Yield in- Lockyer et a1.,. --creased in .1976 sulphur de .. ficient soil but at higher con-centration
. yie ld redu .. . ced
3. Lolium S02 - 0.1 ppm for Leaf. area, root. Decreased Ashcnden and peren~7 4. weeks shoot ratio, dry Mansfield,
weight 1971. . ~ ~~ ............. ~ ......... -........................ ~ ........................ -~ .... -........ -................ -.,....-...... ----.... -.. -.------.-........... --..... ....
(~ntd.)
TableS (contd) ............. ----.,.......~~ ....... ~ ...... :-..~ ................ ~ ................ ----............ - .... ----.... - .. - ...... -.~--- ... ~.~.-..: .. - .... ~.-: .... --.--.-- ..... - ................ ,t.!:t • ...", ...
S.Genus· E.,Xpermental Conditions Enzymes. metaboli teSt Effects,,·, Reference ,~2.:. ___ ;;,,_:, ____ ... _. __ .... ___ . __ .. _____ ...... __ ......!!:2 .. 2!h~r! ____ ._ ... __ -.. ------.. ':..-.------.. -- ..... ---____ ..
4;, Bean
5. Rumex
6.
7.
ob tusi £0 li tl.11l
~ mays" Triticum aestivum
Pieea, Pinus, Lar"ix, Betula
S02 .. Q .. l to l .. l ppm for 8 days
S02 - 0.2 ppm for 11 days
S02 - O.lto 0.6 ppm fOT 100 hrl
-3 S02 - 1.17 ~gm fOT
20 _hI' per day for 20 days
8.. Populus eurame--:..50Z -0.1, 2.0 ppm orlcan a ~ 5 p iIl.a ~. .
G6PlE, Glli, Gly DH, PEP carboxylase, MDH,_ IDK t AST, NADP decar-boxymalat.e, Phospho-fructokinase ,RuDP carboxylase
RuDPC*,GPT, GOT, Peroxidase
Dry mass t foliar . . ., l.nJ ury , tota ... sulphur
GlutathioneCSH compoun4)
SOD and chlorophyll
, Increased
Incraased -Decreased
Decreased.
Increased
Pierre ~ 1977
Horsman and We I1bID't\ 19 77
.. Laurence, 19 79
Grill,~ al., 1979
SOD .. Increa- Tanaka and sed Sugahara,
ChI-Decreased 1980 .................. ~ _.-----.........,-------------------------~--.-~ ................ .., ....... --.; .... --.:- ... .......,. .. :-.. -.......... - ....... .,.' ....... -.-=-~ .. _-.:_: ........ .. . , .... u"" ,,', ." ..' •
(contd.)
c..o
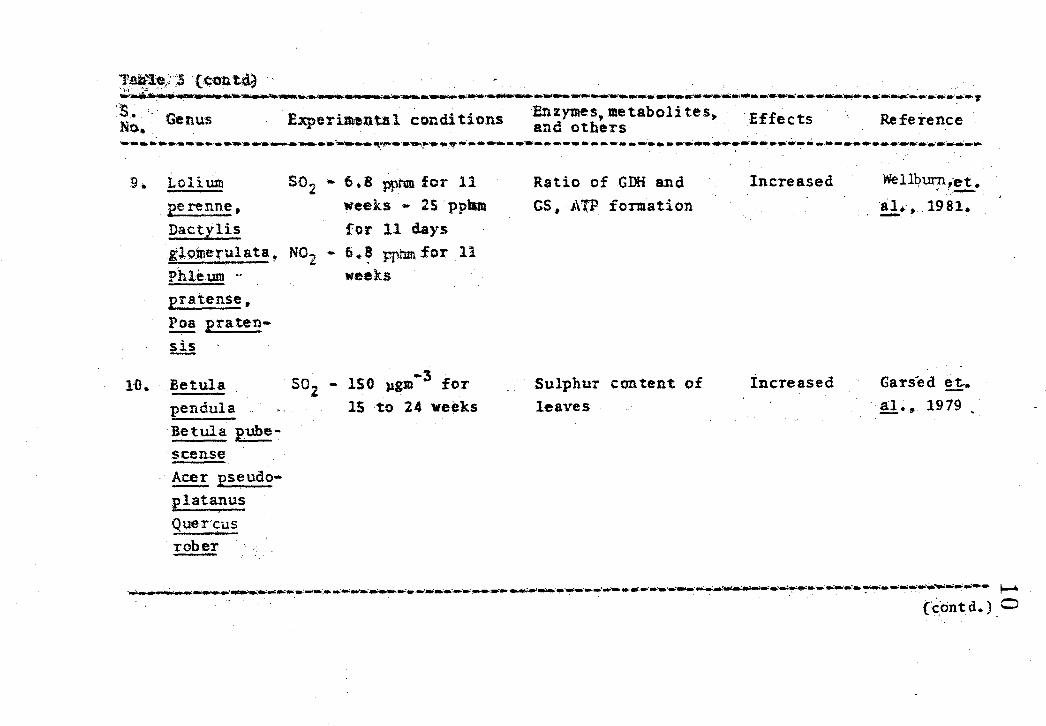
~~1~,:,3 (1:on t.G!) •. ~ ... "._ 4' - .. _ ..... _-.. __ ~ .................... -..... ,....,; ............ ~._ ....... ~~ .......... 'tIa:' ... _-.:;_._ ......... .",.~* ..... _~~._: .. .-r~ ... _ ... ~ ... ~ ... ..: .... ' .. y-
~~. Genus ExperUliIultnl condi tions:~r:;~~~~~taboli tes" EffectsRefeTenc~ .... -.: ............ "..---.................... --- ...... -,-~ .... 4IV'~.-'.~ .. -.~~ .. -.................... -..... -.. -.--.., .... --..... -•.• --........... .;;.. .. --... --.;--............ ,~ ........ .... , ", .'
9.. Lolium S02 • 6.8 ppnm for 11 weeks - 2S ppbm fot' 11 days
10.
perenne, Dactylis gJ,9)rierulata, N02 .. 6 .. ~ ppbtn for 11 phleum -- wee.ks pra te.nse. Poa praten-sis
Betula pendula Betula pube-scense ~ pseudo-platanus Quercus rober
-3 SO~ - 150 ~gm for
~
15 to 24 weeks
Ratio of GOO and CS t j\'l'P formation
Sulphur content of leaves
Increased
Increased
Wellburn,et. ' .-;~. " -----
&1., 1981. -.
Garsed ~ aL, 1979 .
_--:, ___ ~_.~, ............. ~~-= .... __ -..: ...... '_ ....... ~ .... _ ...... ,.,: __ ...... -= ...... .-: .. ~ .... _'~ ... , ....... ~ .. _:-.r .. _ . ., .... <~ ........ ~~_..:;~~' .. -.,; ...... -~ ... .,:-~ .. .:----.. ..:...... ~
(~ontd.) ,0

~;labj(> 31:;::o:n1(',1 . . . _. . '''''-~'''.':'i'''''''''''''''''.·.'''_7I'Io~1'''·~'''''''''''"''-'-'''''-~''''''''''''''''''-'- __ '_''''''''''''''''<''''fIIp,-"""""'~""""._"""""""""'_:'Wo. .. _ ...... .., __ , .. _. _____ .. ~·ft_"""""", ___ """-"_,,,,,~ •• _~,=:-,, ....... ~.~'~.~
~~ Genvs txp~ rimen. tal condi - .f.n :r:ne s, m~tabcli test Eff~cts Reference' i·",. ti'CIlS ar,d c't heys ..... _, ..... "'"'.-.:-........... __ .... ~4IIIIO' ............................................ _~ ........... _ .... MP>.,;. .... 14IIfi .... _ ...... -........... _ ........ _~_ ..................... _ ... ~~; ........................ _ .... .,._.~ ...... _ .... _. __ ..... _....,..
,.11,. Srj'i~ci,es
12. Alianthus '!1 tissima
13. Agropyron
SO~ - 0.1 tc 1.5 ~
p;:n: for 8 hr
S02 - 0.1, 0.2 ppm for 1 and 2-weeks
Monthly median SO? 2
'"'", .. :3 ..... cone. ~ l-lgm' . to ,175 ;Jgm-3 fOT 4
years (1975-1978)
14. Phaseolus ,S02 - 0.1 ppm for
15.
vulgaris three weeks
.. 3 Agropyron .502 - 200 }Jgtn .
Photosynthetic process, openins of "6tomsta and conduc~ance in C3 and C,t plants
~rovth and biomass acc:umul,e't oi on ,
Total chlorophyl1~ Chloropb)'ll a and 011oTo.phy 11 b
Orga-nic aCids, amino acids,proteins, poly"
. mines,I.DH.GDH,AAT. malic enzyme peroxidase
14c t~ons1ocation'and
C3 i3 more- se.nSl tl ve tJ-,a.n C 4 b~cau!;~ o,f higher conductance and gTca tel' s timula.-tion ofs tcmatal ope,ning
Decreased
Decreased. chl-a m~re sensi ti ve than chI b
Increased
Increased
Winner ~nd Mooney, 1980
Marshall and Fumier, 1981
Lauenroth and Dodd, 1981
Pierre and ~roz.;
1981 .
Milchunas-!!. ~ .. , 1982
..... ..... smi thii ' for 30 days li:af growth
-----............................ ~ .. -........ -.-..... -; ........... -........... ~ ........ ......,. ...... -:---.... ~ ............... --,..:-.; .... '.,; .............. -.~ ................ ~ ............. ~, .... -.... -.: .... -~ ... ~~-...... --..: ............ .

I \ Table 4 S02 concentration,s causing visible
injury to various sensitivity groupings of vegetation (ppm S02)
12
........... -.~-.--:-.-.-..... -.. --........... --' ...... -.. ---- ........ --'-.--_....-..... _._ .... .; ......... .. Maximum average concen-tration
Sensitive Interuediate Resistant _ ...... __ .. :.,.:..,;_ ......... .,.. •. ..r ..... ...... _ .... ~._ ....... _ .................. _ .......... _ ...... -._._ ....... __ ... _ ...
Peak 1.0-1.5 1.5-2.0 >. 2.U
1 hour O.S-1.0 1.0-2.0 '> 2.0
3 hour 0.3-0.6 0.6-0.8' > 0.8 ,
............................ __ ... ;--=-= ........ -..: .. ' ... .-.:-=-: .... -.,--;-_ ........ --- ............ ,:----_ ... ---' ...
Source: Jones :~t a1., 1974
Therefore, the low levels of S02 should
be consid~red as the levels' equivalent or near t,o
ambient levels at which no visible symptom is likely ,
to produce even if the fumigation is extended throughout ,
their life. In view of these considerations the present
investigation w·as undertaken to study the plant ,I .
respons'es to low. levels of S02 which are relatively
more realist~.c. S02 levels at JNU (New Delhi) were
observed to b~ averaged at 0.3 pphm and taken a~ ,
background l~vel.
.. S~2 mostly enters plants through the
stomata (M~sfieldt 1973). tn fact, stomata are one of
13
the important controlling factor, of S02 injury to plants
(Mansfield, 1973; Mansfield and Majernik, 1970)~ 502 has ,
been observed to affect the opening and closing of the
stomata (Mansfield, 1973; Kondo and Sugahara, 1978; 01s%y~
and Tibbi ts J 1981J.' The plant injury due to 'S02 depends. on ,
the rate of absorptinn of S02 through stomata. It has been
debated that the sensitivity of differen.tspecies or different
cuI ti val's. of the same species deplUlds on, the uptake 'Of 502 , (Bennet and Hill, 1973; Craker and Starbuck, .1972; Roberts,
1974 ; Elkiey and Ormrod, 1981) •
S02 is converted into different ionic forms, i.e.
HS0 3 - S03 -~ J J
SO -2 4 and part of it remain as hydrated
form SOZ.H20 when it ccimes in contact with the cell. Some
amount of sulphite is metabolised and incorporated into
newly synthesized protein. The 'remaining sulphite is
accumulated in the form of sulphate. In some s\udies
fumigation of plants to low leve~s of S02 have been observed
t~ have beneficiary effect on the plant growth especially
in the sulphur deficient soils (Cowling ~!l., 1973).
Fumigations ,wloth low levels of S02 (13 pgm-3)' increased
the yield ofry~~~ass, growing in sulphur deficient soia
through the c,or~~<;:tion of soil deficiency (Cowlin:B £!.:!!. •• 1973). The yi~~d of dry matter of several ,speci~s growing
il.\: solution cul;ture were enhanced when t:h.e shoots were
exposed 'fo'1' 9 to 20 days in air containing S02 labelled

14
. 35 :). witll S J at 200 and 500 )Jg m- {F811~r"!.! "!!. •• ' 1970}"
, Milchunas ~ a!. J (1982) observe"d stimulation in leaf growth
·when Agropyron smithii Rydb. was fumigated during April to
9:~tober a.t 30 day median s02 concentration of" 200 'Jlg m .. 3• ' "
0,1\ tl1e \:>'8s15 of experi.mental exposures, a concentration Qf
"b t 429 m-3 S02 ( a ou "pg 0.15 ppm) has been widely accepted as
a thresh~ld below which a range of higher plants would not
be injured::even after a prolonged eXposure (Zahn ,1961) to
50Z-
Whenth~: capacity of the plant to m~tabolize
sulphite decreases,' the extra amount of sulphite •
accumulated in the cell becomes toxic and causes the
acidification of the cell fluid~ The first thing to be
affected by the toxicity of S02 is the ce 11 membrane as
S02 'interferes with the. structure and permeability of the
cell membt)ane. The change in the permeabili ty of mem ...
b.rane following the S02 fumigation has caused the leak.age
in the potassium 'ionsand other electrolytes from the
cell (Nieboer, &t 1 a1., 1976; Puckett et 81. t 1917; .. - - ---- ...-.-.
Tomassinl et !!.!.., 1977; Elkiey and,Ormrod, 1919). The
alteration of cell membrane permeability- will affect the
functioning of various enzymes attached to it which would
resul t into the' eco-physj ologi.cal chcuiges by disrupting
various hiochemical proc.ess es (Thomas ~ !l .. :1950;
Welburn !:.! E..!., 1972). After- disrupting the structure of

15
the cell membrane S02 affects various organelles and the
biochemical processes associated with them. 'Malhotra
and Hoe-king (1976) reported that S02 .a1tered the ultra-
structure of chloroplast and other photosynthetic pigments.
The conversion of chlorophyll to phaeophytin following the
fumigation wi th S02 has been observed by Rao and LeBlanc
(1966). The diminution in chlorophyll content was
'observed by several workers int;luding Gilbert (1968), 11~e
(1970)}and Steubing' 'et a1., (1974).
S02 was observed to suppress the ,glycolic acid
pa thway as a result of which glycine and setiire synthesis'
was adversely affected (Tanaka ~ !l., 1972), The dimi-
nution is soluble protein content after exposing to 502 is,
due on the one hand to a reduced de ~ synthesis (Barnett, t
and Taylor, 1966), and on the other hand to an iJncreased'
, clecomposi tion to amino acids (Dugger and Ting, 1,9,70; Ting
a~d M~erj+, 1971; Godzik and Linskens, 1974).
J~pth 502 and H.2S0 3 are capable, of converting
enzymes or pro'teil1s having disulphide bonds to thio-
sulphonates and thiols. The S-S b mds in the polypeptide
c~ains are cle~ved by' HZS03 (Bailey and Cole, 1959; Cecil - -2 i and Wake J 1962~:. The accumulation of HSO:s - 8.1\,41 .. 503 ons
disrup~ the IiaJural balance between incomple,te~y oxidlzed • • .' 0"-'';
S-compounds a.n9 SH:groups present in glutathio,~~ ~~d, ., " .. , .
cysteine that are essential for structural in~~gr~ty of : ;;: ~ ~:' ',,"!:.'
proteins (McMullen, 1~60 i Loughman. 19~4).

16
The change in the activity 0.£ various enzymes
and in the pools of metaboli tes due to S02 f~igation has
been observed.' It lias reporte<:i ~hat 400 ~ m~~ of SOZ'
increased the sugar content in bean leaves and enhanced 'Ii. ~ ;.' ;,
the incorporation of· 14C02 into sucrose and fructose in
ryegrass (Koziol and Jordan, 1978; Koziol and Cowling,
1978). Increase in the pool of polyamines in pea lDlder
0 •. 3 ppm S02 was observed by Priebe ~ a1. (1978). Godzik
and Linskens (1974) when fumigatedPryaseolus vulgaris
to 0.7 ~ 0.1 ppm S02 for 6, I2,or 24 hr day-l for 3 days
observed a gene:r;al; increase in the ~~.ol of fref:} ami.no acids.'
except for ~,spartic and glutamic acids .• ; which,. were found
to decre~se. Jager and Pahlich '(1972) anp Jager ~ .ak (1972} observed incE~ase in the cysteine, glutami~e,and
glutamate levels, in Pisum sativum when furnigat.ed for 7 . '.
to 2.1 days wi th 0.3 to 1. 3 ppm of S02. However, the leve Is
of glutamate started decreasing ~ith an initial increase.
Tpe levels of glut.~Fhione (Sa compound) was found to
increase in Picea, Pinus, Larix,and Betula species w~en
fumigated for 21 days with 1.17 mg m- 3 S02 for 20 hr day·! ; ~." ~ .
. (G:r~ ~1 ~ al., 1979).
Low levels of 502' have been report~d t:Ci, i~f\:crease
the activity of certain enzymes. Pierre (19:7,1.) 'studied , .. ~ .' - '. .
tht.1.:respon se of various enzymes _ in bean Q.!!!.~cot species)
fumigated for 8, days at 0.1 ppm - 1.1 ppm S02. He

17
observed increase in the activity of glucose b-phosphate
dehydrogenase, glutamate dehydrogena'se. glycerol phosphate
dehydrogen~se, 'phosphofructokinase, malate dehydrogenase.
NADP- carboxylase, 'isoci trate dehydrogenase, aspartate
amino tra~sferase and ribulose 1-5 diphosphate carboxylase.
f Increase in the activity of various enzymes such
as isoci t'~ate de,hydrogenase. organic acid'synthesis . /
(malic enzyme), amino acid synthesis (aspartate amino-
transferase)) and glutamate dehydrogenase was observed in
Phaseolus Vulgaris when exposed continuously t:J't 0.1 ppm S02'
(Pierre and Queiroz, 1981). Horsman and Wellburn (1977)
compared the activities of ribulose diphosphate carboxylase
(RuDPC), glutamate pyruvate transwninase (Gl'T) and glutamate • J '
oxaloacetate transaminase (GOT) from extract of seedli~8s of
Rumex obtusifolium fumigated with 0.2 ppm S02 for 11 days.
They observed increased activities of GPT and GOT but RuDPC
behaved di£..f.~ren tly~" in fumigated see lings. Synergis tic • 'r J ~ .' ~;' ';~: I
effects were.o~se;r.ved' when seedlings were fumigated with .• !,'
0 .. 1, ppm NO Z ~lo.ltg w~th 0.2 ppm S02'" Tanaka:'~!l. (1974) !
reported inhibi;,tion,,}tf the activity of enzyme ribulose, 1-5 ;;, h d' . h 3 10-5 ,3 X' 10-4 • diphosophate in.alf~lfa w en treate Wlt x •
'3~ x 10- 3 and :3 x 10- 2 M soluti.ons of sulphite or sulphate
ions.

18
Acid phosphatase activity in mosses'Wls found,
to increase initially when fumigated for 48 ~ours at 5 and -
5.5 llg m-3 S02 but later decreased and visible injury - J
appeared when funligation was. extended upto 14 days .
(Hackeme,sser,. 1981). Rabe and Kreeh (1979) also observed
increased activities of ~nzymes glucose-'6-phosphate
dehydrogenase (G6.PDH), isocitrate dehydrogenase· (leDH),
alanine amino transferase'CALT), aspargine amino trans-,
ferase· (AST)" and glutamat~ dehydrogenase (GDH), in various ,
pl~nt species a~' Medicago sativa, Vicia' faba,- -TuliEa
gesnerana,- Be'ta. vulgaris, Nicotiana tahacum,.. Hordeum
d:i,..stichon and Lycopersicon e'sculentum 'when these plants
we~e grown in the vicinity of the l'WS power station
StUttgart-MUnster. They have also suggested th.at on
increased enzyme activity may be use,d as i,ndicators of ,
low levels pollution which do not pro~uce any vi~ible
damage to plants. Wellburn -~!!. (1981) while working
on three clones of ,!,olium perenne of different sensiti-
vity to S02 togethe r with other grasses 'Dactyli,s -
glomerata, ~hleum l?ratense and ~,pratensis, obsented
significant rise in t~e ratio of glutamate dehydrogenas~ i
activity and glutamine synthetase at; 6.8 pphm S02 for 11
weeks. The effect was more ,than additive in the ,
presence qf N0 2 •

19
Out of rhese studies, 'GDH was one of the common
enzyme s tudie d by various' lV'orkers • However , the'
behaviour of GDH and its suitability as indi.cator of low
,levels of S02 is relatively unknown.
The activities of oxidative enzymes like'
peroxidase , catalase .. and superoxidedismutase (SOD) were
also observed to be enhanced following the. fumigatiDn wi 1lh
S02 (Nikolaevskiy, 1966; Keller, 1974; Horsman and Wellburn,
1975;, Tanaka and Sugahara, 1980; Pierre and Queiroz, 1981) ~. ,
The levels of peroxidase have"been reported to be
incre asing with the exposure to other pollutants such as
NO z' HF; OzoneJand HCI. The increase in peroxidase'
, activity has been often suggested to have' an indicator as
we 11 as protecti ve ,value against the stress situation.
Horsman and Wellburn (1975) observed synergistic
effect of 0.1 ppm N02 on the increase of peroxidase
act,ivity, in Pisum sativum :"fHmigated with 0.2 ppm S02·
,1 ncre ase ~n:tJt!l,e peroxidase acti vi ty has also. been reported , "
in the two cuitivars. of Glycine '~Merr., 'York' and
'Wye': grown iIi the fi~tered air f(n' 14 days and then , f
exposed to 35 pphm ozone for 2 hr (Curtis'~!l •• 19?6).', , ! i',
Increased acti vi ty Of perox~dases was observed by Das~
and Weaver ,( 196 8) in these'nsi ti ve cu1 ti vars ofs6yb'e'an
" h 0 f ~o foIl owi ng the ir fumi ga tion \~i th 13 ... 50 pp m 3 0r oJ
min. Endress et a1. (1980) exposed -"phase 0 Ius -:-

20
vulgaris and Lycopersicon esculentum plants to either
gaseous hydrogen chloride (4.08 - '12.52 mg m-3) for 20
min or ozo~e (196-:392 pg m- 3) for 1 hour. They concluded
that total peroxidase activity, associated with non~
necrotic injury increased fol~owing pollutant stress, and
that it is sensitive to the internal physiological
conditions of the plants. 1$s ,extreme sensitivity, however.
prec:ludes its use as a reliable indicator of pollution
s·t ress.
Keller (1974) found thnt peroxidase activity
increased with the increasing levels of pollution caused i
l,ly fluoride containing exhaolates emanating from an
alijminium smelter near Zurich. He used the peroxidase
activity of white ash plants for monitoring air polluti.on
in the vicinity of the aluminium smelter, and also to
determine the effect of exhaust of automotive traffic on
vegetation in the city ~f Zuric~. A significant increase.
of peroxid~s·e activity was found in the city, although the
. white ash did not show any injury symptoms. On the basis
of t.he studii:e;.$.'t' it was suggested that .the peroxidase
activity is a ve·ry sensitive indicator of pl.ant reac~ion
to air poilutio;n and reflects the so called "hid~en",
injury (Keller~nd Schwager, 1971; Keller e~ ~l.~ 1916)~ { ---~ ...
The .. isoenzyme pattern of plants can also be
used to detect the effect of lo~.~evel~ pf S02. Pahlic~ t
-'.-'

21
(1972, 1973) reported that S02 altered tlle jsoenzyme ~~1t~1 • '< .. ,;
of GDB .in Pis'lun satl vum. Endress et'.!!.. (19~O} re:poi·te,q
that the isoenzyme pattern of peroxidases in' ;Lycopersicc)n'-- , .. ~
~culentum changed by He! and/or ozone ,exposure. 'CuTt);'
!..f~. (1976) while. 'working on the response of soybean' ,: . ,p~!oxidase to ozone found that certain pe,roxi.das~s of"
ozone-tolerant 'X'crktwere relatively less affected thWl
the peroxidases of ozone sensitive 'Wye', and CJll the b~nd~
showed inc:reased' acti vi ty. The available information a,n
the effect of S02 on isoenzyme pattern .of GDH and, , ,. , ..........
peroxidase 1sfragmentaty and nc: t' sufficient to assess , .,:
the nature of the injury. Moreover" the informatiOn
related to the response to peroxidases~o low ,l~vels ~f : ~I
S02 in sensitive' and:"Trsistant specie.'s is comp~etely
lacking.
The causes of significance of ~l,W in,creased
activity of enzymes following S02 s tre,sshas not been
sati.sfactorily understood. However, some spe~::ulations
have been ma,de to suggest that',the enhanced enzyme
activity helps plant to.resisi against gaseous pollutants
and thus enables the plant, t6 wi~hst~nd such stre~s by a
quanti t ati ve readj us tmentof the intermediary metabol i.sm
(Pierre 'and Queiroz, 1981).;' It is further argl,led that
theillcrease 'in metabo'licpot~ntiality of the cell is
to resist pollutit5n by faster metabolizatiqn of S02~and
TH -lol-{4

- a stabilization of internal pH. The readjustment is
, transitory and possibly starts diminishing after couple
of'weeks of continuous fumigation (Pierre and Queirot, !
. 1981). Other workers have also suggested that an increase
in the activity of enzymes, especially peroxidase and
superoxide dismuta&e is benefiCial for, the plant (Hersman
andWellburn, 1975;. Curtis et ~., 1976;'Endress!! !!., ,1980; Keller 1977; Tanakaand.Sugahara, 1980; Asada, 1980).
Peroxidase has been sugges te dto play apro~ec-
tive role in plants against S02 stress. . It has been ( .
-2 postulated that peroxidase ehnances the oxidation of SOa . -z -to ~04 thereby reduces the toxicity of S02 (Tanaka and
Sugahara, 1980; As ada , 1980). The mechanism and rate of
conversinnof sulphite to sulphate (sulphite turnover rate)
under the influence of enhanced level of perojidase is not·
known. Information about the sulphite turnover rate in .the
SOZ sensitive and resistant plant species is lacking. I
The detoxification o~ S03-2 in the plant cell
generally takes'place by the oxidation of sulphite to
sulph~te, as describe d above, and also by the reduction
df S02' In -S02~,;reduction ascorbic acid has been;.,f(l1Jrid to - -'
play an imp.-Q~t~·n,t role. Keller and Sch~ager'.f19i7) ) -~.~ :-
reported th~t. ascorbic acid may also influence detoxifica· , ",-
ti,<;m of pollutants in plants by reducing S02" Continued

23
SOz fumigation decreases ascorbic acid content long
before visible injury symptoms appear. A spray of
ascorbic acid to gr~en house crops increased their
tolerance to exidants (Fr~ebairn, 1960; Freebairn and
Taylor, 1960). Rao et Q. (1981) reported that the spray
,of ascorbic aCid, in the form of potassium ascorbate.
over S02 fumigated Vicia faba reduced the S02 toxicity
and suggested that potassiUm ascorbate acts as an
antidote of S02 pollution.
Plants have been fOlWd to have some inbuilt
eapaci ty to r~C?X~ f from various s t~~s~s including S02
when the nor~a.l conditions are restored. In bean plants, t
'it wasobserveq Fr~-t after the termination of f~!,!}gation
to 0.7 ppm SOZ' th.~- total protein increased wh~rr~s, ~lle
to tal amino aci ds de ere ased (Godzik and Linskens, t~? 4).
The level of protein in fumigated be~n Pfqn.ts. increased to that of control, while tneconcen-tratioq. of
~ ~. 1 - .... . ~! : ~ 1 ! •
total ami~C? aFi~s was still slight'ly h,tgher 'than t~~
control plan,t,s. after 72 hr of termination of fumigation
thereby indicatf~g the recov~ry (Godzik and Linskens,
1974). The rat,e of 14coz uptake or photosynthesis ~as
been observed tp recover when S02 exposure was discon,ti-
nued (Tanaka et a.1. 1974). The activity o~ enzy,me n~i,tro" --genase and photosynthesis show good fecovery after the
: 1 . . ... <: removal of b llJ.e green alga Anabaena cylindrica from sodium

94 . .."
bisulphite solution (Hallgren and Huss, 1975). Though
plants have shown a capacity to recover, but it is still
an open question because it iS,not known as to how long a
plant can withstand fumigation and whether the plants ,can
recover irrespective of the preceeding period of fumigation.
The effect of plant age on the recovery process is also not
known.
The review of the literature on S02 phytotoxicity,
shows that the information regarding the ecological, conse-. ,
quences of low levels ofS02 on plants and their eco-
physiological behaviour under S02 stress is lacking.
F
The present sutdy is aimed to assess plant
response- to low levels of S02 (3,5 ,and 10 pphm) by evalua-
ting a range of parameters such as leaf biomass t chloro-
phylls, sulphite turnover rate, total sulphate and sulphur \
content, total protein, activity of enzymes, peroxidase
and GDH and their isoenzyme pattern, ascorbic acid. content.
total electrolyte} and potassium leakage. This study also
suggests the suitability of some of the above parameters'
fOT employing them as reliable bioindicator of S02
stress.


![Conifer expansion [Chapter M.] - fs.fed.us](https://img.dokumen.tips/doc/110x75/61cace1c98ffe14ced450e01/conifer-expansion-chapter-m-fsfedus.jpg)


