Embed Size (px)
Citation preview

International Journal of Social Sciences: 10(1), 2016
72
International
Journal of Social
Sciences
Changing Land Uses and Traffic Congestion in Calabar
Municipality, Cross River State, Nigeria
Victor E. Umoren, PhD and Itoro U. Akpan, MURP.
Department of Urban and Regional Planning
University of Uyo, Uyo, Akwa Ibom State
E-mail: vicmoor2000@yahoo.
Abstract: The aim of this study was to assess the relationship between changing land
uses and traffic congestion in Calabar Municipality. The study employed the survey
design. Field survey was undertaken using the road network map and the land use map
of the study area. Traffic survey was also undertaken to obtain data on the volume of
traffic. The land use maps of 2010 and 2014 were used in order to examine the
changing patterns in the land use of the study area. The annual rate of land use change
was obtained by dividing the difference in area covered by each land use between 2010
and 2014 by five years. In order to examine the relationship between changing land
uses and traffic congestion, the multiple linear regression statistically technique was
adopted. The result of the analysis indicated a coefficient of determination of 0.537
which implies that that 53.7% of the variation in traffic volume can be explained by the
changes in the predictor variables - residential, commercial and public land uses. The
result showed that changing land uses had significant relationship with traffic
congestion in the study area. Findings also revealed that there has been significant
effect in changes in the use of land along roads and these changes have created
problems along transportation routes such as traffic congestion, parking problems,
accidents, haphazard/indiscriminate display of signpost/billboards, over stretching of
the road infrastructures and noise pollution. Based on these findings, it has been
recommended from the study amongst others; equitable redistribution of land uses
particularly those uses that trigger and generate high volumes of traffic, regular
studies should be carried out to progressively examine the rate and pattern of changing
land use, strict enforcement and implementation of development control measures,
monitoring of the changes in the land use of the area from time-to-time by the Calabar
Municipality Planning Authority and restriction of unnecessary change in use of land.
Keywords: Land use, traffic volume, traffic congestion, change, roads and
transportation.
INT
ER
NA
TIONAL JOU
RN
AL
OF
SO
CIA
L SCIENC
ES

International Journal of Social Sciences: 10(1), 2016
73
1. Introduction
Over the years, changing land use has been a major concern for major stakeholders in the
environment. Wu and Cho (2007) observed that in the United States, major land use
changes have occurred in the past twenty five years, in spite of the efforts made by the
government to impose strict land use control. The location of land uses with respect to the
spread of residential and commercial areas when not properly considered in town
planning and development of master plans for major cities can cause serious congestion
problem. In most urban areas in developing countries, traffic congestion has continued to
challenge the efforts of land use experts as well as transportation planners, in terms of
longer travel time and delays over time and space.
Traffic congestion along roads in Nigeria is in a severe situation. According to Popoola,
Abiola and Adeniji (2013), traffic congestion is as a result of the increasing growth in
motor vehicles without a corresponding improvement in transport facilities such as road
network, traffic management techniques. Momoh (2011) argued that poor planning of
transportation system in Nigeria has led to over-dependence in motor vehicles resulting in
too many vehicles with its accompanied problems including traffic congestion. More so,
Popoola, Abiola and Adeniji (2013) noted that many highways in Nigeria are bedeviled
with traffic congestion which tends to defy various remedial measures adopted by
different governments over the years. Journey times from one point to another, have
remained unreliable and travelers have continued to face disturbing inconveniences in
transportation. These are accompanied by noise and air pollution and the high costs
associated with burning of fuels from stationary vehicles.
One of the most important factors responsible for shaping land use patterns in urban
centres is the transportation system. According to Balchin, Kieve and Bull (1991), urban
road system acts as a basic component of urban areas and also plays an essential role in
the determination of the scale, nature and form of the urban areas. Transportation systems
have the potential to affect development and the location pattern of land uses. Indirectly,
transportation systems have the potential to affect land development by either inducing
new development or changing the pattern of development. According to Inyang (2000),
the historic and most popular view of the role of transportation in the development
process is a prerequisite for economic growth. However, the interconnections that exist
among the various functional parts of cities depend upon efficient systems of
transportation. The transportation system of any given city generates different land uses
and also provides connections among the different land uses in that city. For instance, the
transport routes in Calabar Municipality exhibits a number of nodes and linkages to form
networks of both major and minor roads along which land uses such as residential,
commercial, public, industrial, institutional and open spaces are located.
Umoren and Akpan

International Journal of Social Sciences: 10(1), 2016
74
Increase in economic activities and good road networks are making changes in land use
very challenging. In the study area, the provision of good road networks in some parts of
the city, profitable and productive land uses have been attracted to some of these roads
which have witnessed changes in the use of land. One of the driving forces behind
changes along transportation routes in the study area is change in the use of land, these
changes can be noticed along roads such as Calabar Road, Old Odukpani Road, IBB Way,
Mary Slessor Avenue, MCC Road, Marian Road and Eta Agbor Road. Change in the use
of land along these roads have created problems such as traffic congestion, parking
problems, accidents, haphazard/indiscriminate display of signpost/billboards, over
stretching of road infrastructures and noise pollution. This paper therefore intends to
examine land use distribution and the rate of change in the study area. It will also examine
the relationship between changing land uses and traffic volumes in the study area.
2. Literature Review
The arrangement, distribution and organisation of land uses in an area in terms of socio-
economic functions of residential, commercial, recreational, industrial and institutional
usually determine the land use pattern of that area. Land use pattern summarises the
distribution of urban activities in a city. The conflicts that arise between the different land
uses have added dimension to land use patterns that is why, the structure of a city is as a
result of growth over a period of time of various land uses. The problem with urban land
use is not only in its classification but also in its distribution. In a study along Lagos-
Badagry corridor, Adekunle, Oduwaye and Alade (2011) noted that the major challenge
of land use distribution along the corridor was both in terms of planning standard and
layout. In most cities, the conflict that arise between the different land uses have added
dimension to land use patterns. This is why the structure of a city is as a result of growth
over a period of time of various land uses. Etuk (2008) stated that urban land use and its
transport system have aggravated the environmental impact of cities while the spatial
location of activities or structures like houses, workshops, roads, railways, production and
consumption are proportionally increasing. Increase in population and urbanisation have
also led to the severity of these problems.
One of the driving forces behind changes along transportation routes is change in the use
of land. Changing land uses have been influenced by human actions throughout the years
and this has taken place without an appreciation of the effect these changes have on roads.
Oruonye (2014) stated that transportation’s most significant impact on land improvement
occurs when access is provided to land. Changes in the location, type and density of land
uses invariably changes transportation patterns. Hillier (1996), one of the proponents of
the transportation and land use linkage, noted that socio-economic forces shape the city
primarily through the relations between movement and the structure of the urban grid. In
International Journal of Social Sciences: 10(1), 2016
75
recent times, frontier expansion and population growth have primarily accelerated land
use change (Adger and Brown, 1994; Richards, 1990). Changing land use can occur from
either direct or indirect decisions to alter the current use of land. A number of factors
account for the changing pattern of land use in any given location. These factors have
been summarised by some researchers to include social, economic and institutional while
others include personal choice, legislation, government policies and plans, decision of
developers or transportation entrepreneurs, the nature of the land itself and the availability
of technology to develop the land. Moreso, land uses within the urban areas are subject to
changes as roads are improved upon and made more accessible through transportation
projects. However, these changes are usually associated with attendant problems which
manifest in various dimensions along transport routes such as noise pollution, parking
problems, accidents and congestion.
Land use and transportation are two vital subjects that are central in the understanding of
the internal structures of cities. These two subjects (land use and transportation) are
interdependent and findings of earlier studies have indicated the corresponding
connections amongst them. For instance, land uses shape transportation by physically
arranging different activities along transport routes and transportation shapes land use by
providing the means or access to these land uses. Moreover, a reciprocal relationship
exists between transportation and land use. Land uses by virtue of their occupancy
generate interaction needs and these interaction needs are directed to specific targets by
specific transportation facilities. For example, at any point in a city’s development
process, its activity patterns determine the transportation needs. Similarly, the land use
pattern and intensity of use generates demand which can eventually lead to the
development and improvement of transportation systems. When this happens, the land use
becomes more attractive and developed for urban use. Land uses do not only influence
transportation but transportation also influences land use. For instance, large scale
transportation projects tend to precede and trigger land use changes while small scale
transportation projects tend to complement existing land use pattern. Similarly, a
corresponding relationship between land use and transportation also leads to a
corresponding increase in vehicle ownership, this further increases the demand for
provision of transport facilities as well as exacerbate the flow of traffic. It is in view of
this that Sule (2004) opined that urban motor vehicle ownership and usage is growing
even faster than the population and also much faster than the ability of cities to provide
road space, among others. Nevertheless, an interrelationship between land use and
transportation does exist as there is little doubt that land use does change in response to
changes in transportation infrastructure, thereby causing secondary effects on travel
demand in addition to the direct effect caused by route and mode switching.
Umoren and Akpan

International Journal of Social Sciences: 10(1), 2016
76
Egbu and Kalu (2006) stated that past and recent transportation studies have shown that
different land uses have their trip generation characteristics. The rate of trip making in an
urban area is a function of the existing land uses in the area. Thus, each land use has its
peculiar characteristics in its trip generation. For example, in a residential land use, the
trip making activities of a high income household will be more than that of low income
household. The ability of a land use type to attract traffic will decline as the land use type
becomes more distant or remote from the people or materials it is meant to attract. Akpan
(2008) in a study carried out in Ikot Ekpene urban observed that the location of certain
activities (parks, banks, schools and commercial shops) along the major roads attracted
and generated high traffic due to the concentration of activities on these roads.
3. The study area
Calabar Municipality is one of the Local Government Areas in Cross River State. It is
located in the South South geo-political zone of Nigeria. It lies between Latitudes 4°57′
and 5o04′ North of the Equator and Longitudes 8°18′ and 8
o24′ East of the Greenwich
Meridian.
Figure 1: Calabar Municipality on the map of Cross River State
Source: GIS Department, Ministry of Lands and Town Planning, Calabar, Cross River
State

International Journal of Social Sciences: 10(1), 2016
77
Calabar Municipality is bounded in the North West by Odukpani Local Government Area
and Calabar River, in the East by Akpabuyo Local Government Area and the Southern
shores are bounded by the Calabar South Local Government Area (see Figure 1).
4. Material and Methods
The study utilised land use maps of the study area to obtain data on the coverage area of
land uses (Figures 2 and 3). The land use map of the study area were obtained from the
Geographic Information Department, Ministry of Lands and Town Planning, Cross River
State. The satellite image was directly imported into the ArcMap environment. The
images in the ArcMap environment were geo-referenced. The geo-referenced images
were digitized on the computer system. Based on previous knowledge of the study area, a
reconnaissance survey using the road network and land use maps of the study area and
additional information about the study area was gathered. A classification scheme was
developed for the study area. The classification scheme developed gave a general
classification of five different classes of land use were. The area covered by the various
land use classes which are residential, commercial, green area/open space, public and
industrial land uses were calculated using the calculated geometry in the ArcGIS 10.1
environment.
The study employed the survey design method. The survey design approach was
considered appropriate for the study because surveys are efficient tools for measuring the
frequency with which an event occurs. The survey was used to observe and describe
events as they exist without influencing the result. Primary data were obtained from the
field survey; observation, measurement and recording. Data on roads were collected
through field survey. Traffic volume was obtained from the traffic count. Secondary data
were derived from the land use map of the study area. The annual rate of land use change
was obtained by dividing the difference in area each land use covered between 2010 and
2014 by five years. The source of secondary data was the GIS Department, Ministry of
Lands and Town Planning, Calabar, Cross River State. Purposive sampling technique was
adopted in the selection of roads. 26 roads out of a total of 256 roads were purposively
selected on the basis that most of the changes that occur in the land uses under study were
observed along these 26 roads which also constitute the major roads in the study area.
This number (26 roads) represents 10% of the total number of roads which is statistically
accepted as the minimum sample size for a study.
Multiple linear regression was used to examine the relationship between changing land
uses and traffic volume and also to determine if changing land uses have any significant
effect on roads. According to Udofia (2005), the multiple linear regression is a parametric
statistical technique which enables a researcher to carry out the following:
Umoren and Akpan

International Journal of Social Sciences: 10(1), 2016
78
(i) Investigate the causal relationships between variables.
(ii) Measure the effect of one variable on another.
(iii) Predict values of the dependent variable given values of the independent
variable.
Moreso, in multiple regression, the effect of numerous independent variables (X1, X2,
X3……….n) is measured on a single dependent variable Y. The formular for Multiple linear
regression is given as: Y = f (X1 X2 X3 ….Xn)
Y = a + b1X1 + b2 x2 + b3 X3 ….+bnXn + e (1)
where
a = Y intercept
b1, b2, b3 ….. bn= the regression plane of the three independent variables
X1 X2 X3 …. Xn = the independent variables.
Two sets of variables were required for the study; the dependent (Y) variable and the
independent (X) variables. The dependent variable was the volume of traffic, while the
independent variables were the land uses; residential, commercial and public land uses.
5. Results and Findings
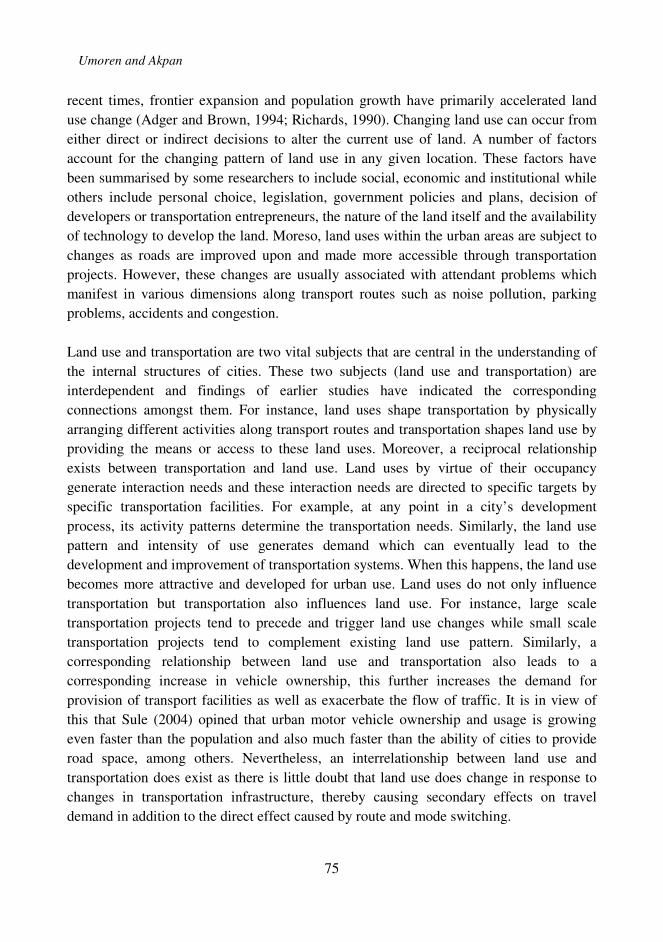
The land use map of the study area shows the distribution of land uses in the study area.
These land uses include; residential, public, commercial and other land uses which
comprise of recreational/green area, circulation and industrial (Figures 2 and 3). These
land uses as well as the area covered by these land uses in 2010 and 2014 are presented in
Table 1 which shows the sum total of the residential, public, commercial and other land
uses along the sampled roads in the study area. The residential land use which was the
dominant land use covered a total of 184.05 hectares of land in 2010 while in 2014 it
covered a total of 128.78 hectares of land. This indicated a reduction in the land use
coverage with about 55.27 hectares and 29% reduction as compared to the land coverage
in 2010. Commercial land use covered a total of 63.31 hectares of land in 2010 and in
2014 it covered a total of 104.11 hectares of land. This indicated an increase in the
commercial land use of about 40.8 hectares of land with about 23% increase from 2010.
Public land use in 2010 covered a total of 88.57 and in 2014 it covered a total of 99.54
hectares of land, indicating an increase of about 10.97 hectares of land with about 22%
increase from 2010. Circulation land use covered a total of 70.04 in 2010 and in 2014, the
green areas covered a total of 26.08 hectares of land in 2010 and 2014 while industrial
land use in 2010 covered a total of 14.44 hectares and in 2014 it covered a total of 17.94
hectares of land. This indicated an increase of 3.5 hectares of land with 4% increase from
the year 2010. The circulation and the green area in 2010 respectively had 70.04 and
26.08 hectares of land which remained unchanged. This was because these land uses
could not be easily encroached upon since they have been earmarked for this purpose.
International Journal of Social Sciences: 10(1), 2016
79
Figure 2: Land use classes of 2010 on the map of Calabar Municipality
Source: GIS Department, Ministry of Lands and Town Planning, Calabar, Cross River
State
Umoren and Akpan

International Journal of Social Sciences: 10(1), 2016
80
Figure 3: Land use classes of 2014 on the map of Calabar Municipality
Source: GIS Department, Ministry of Lands and Town Planning, Calabar, Cross River
State
International Journal of Social Sciences: 10(1), 2016
81
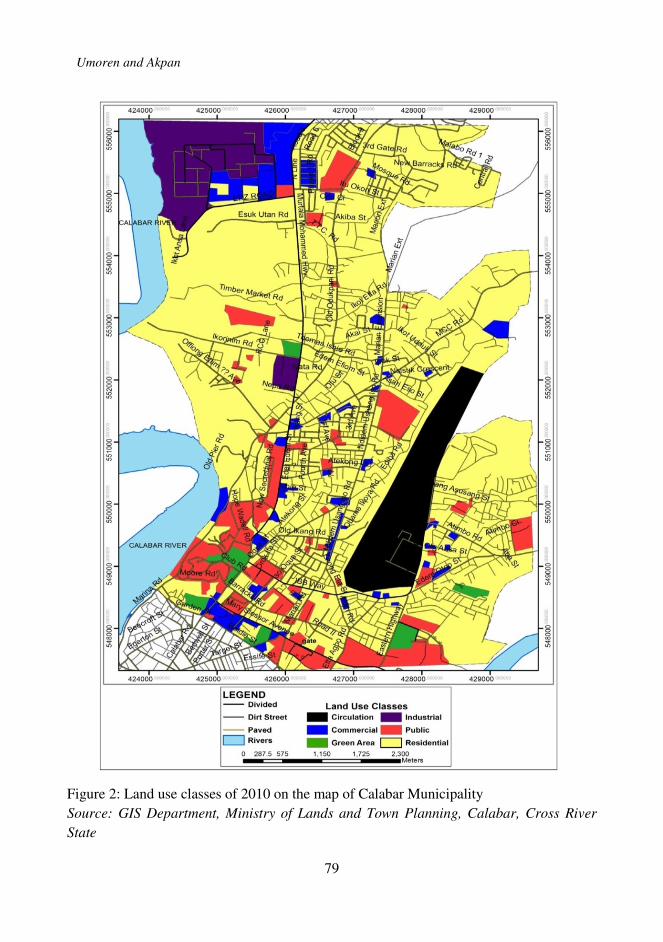
Table 1: Land use distribution in the study area.
S/N Land Use
Classes
Area (Hectares)
covered
in 2010
Area (Hectares)
covered
in 2014
Change
(Difference
in Hectares)
%
1 Residential 184.05 128.78 *55.27 29
2 Commercial 63.31 104.11 **40.80 23
3 Public 88.57 99.54 **10.97 22
4 Circulation 70.04 70.04 0 16
5 Green Area 26.08 26.08 0 6
6 Industrial 14.44 17.94 *3.50 4
Total 446.49 446.49 100
Source: Authors’ Data Analysis (2014) *Decrease hectares covered **Increase in
hectares covered
6. Analysis of Land Use and Rate of Change in the Study Area.
Table 1 indicates the distribution of land uses in the study area. In order to determine the
rate and nature of change of land use in the study area, the 2010 and 2014 land use maps
were juxtaposed and their data analysed. Table 2 indicates that there has been a
substantial increase and change in commercial, public and industrial land uses while there
has been a decrease in the residential land use. The result showed that commercial land
use increased by 40.80 hectares at the rate of 8.2 hectares, public land use increased by
10.97 hectares at the rate of 2.2 hectares, industrial land use increased by 3.50 hectares at
the rate of 0.7 hectares while the residential land use decreased by 55.27 hectares at the
rate of 11.1 hectares. The residential land use decreased due to conversion and infiltration
of residential land uses by commercial as well as public and industrial land uses.
Commercial public and industrial land uses witnessed positive changes while residential
land uses witnessed negative change. The green area and circulation land uses did not
witness changes as new green areas were not developed and the existing roads were not
expanded within this period.
In examining the relationship between changing land uses and traffic volumes in the study
area, null hypothesis was formulated which states “that there is no relationship between
changing land uses and traffic volumes in the study area.” The hypothesis was tested
using multiple regression analysis. Table 3 shows the results of the multiple regression
analysis that was adopted to determine if changing land uses had any significant
relationship on traffic volume. It showed that the value R = 0.733 and R2
= 0.537. The
coefficient of determination R2= 0.537 implied that 53.7% of the variation in traffic
volume in the study area could be explained by the changes in the predictor variables
(Residential, commercial and public land uses). It also meant that this effect was
Umoren and Akpan

International Journal of Social Sciences: 10(1), 2016
82
statistically significant implying that the extent to which changing land uses affect traffic
volume was 54%.
Table 2: Land use status and rate of change in land use in the study area
S/N Land Use
Classes
Area
(Hectares)
covered
in 2010
Area
(Hectares)
covered
in 2014
Change
(Difference)
between
2010 and
2014
Annual Rate
of land use
change
(Hectares)
between 2010
and 2014
Nature of
change
1 Residential 184.05 128.78 55.27 11.1 Decreased
2 Commercial 63.31 104.11 40.80 8.2 Increased
3 Public 88.57 99.54 10.97 2.2 Increased
4 Circulation 70.04 70.04 0 0 No Change
5 Green Area 26.08 26.08 0 0 No Change
6 Industrial 14.44 17.94 3.50 0.7 Increased
Total 446.49 446.49
Source: Authors’ Data Analysis (2014)
Table 3: Multiple regression analysis for traffic volume and changing land uses.
7. Conclusion and Recommendations
The study on changing land use and traffic congestion in Calabar Municipality, Cross
River State revealed that significant changes have taken place in the land use structure of
the area over the past five years, particularly; the public and commercial land uses have
witnessed significant changes. The study also revealed the relationship between changing
land use and traffic congestion in Calabar Municipality. Thus, as land uses change, traffic
volume increases. However, in order to address the challenges posed by changing land
use on roads, there is need for adequate land use planning so as to mitigate the effects
posed by changing land use on roads.
In addition to this, there is a need for municipal planning authority to monitor the process
of change in the area in order to prevent the negative effect these changes may unleash on
the environment. Since some of the changes or conversion of land uses are done without
Model R R Square Adjusted R Square
1 .733a .537 .474
a. Predictors: (Constant), Commercial, Public, Residential b. Dependent Variable:
Traffic Volume

International Journal of Social Sciences: 10(1), 2016
83
the consent of the Municipal Planning Authority, development control measures should
be strictly implemented by the Municipal Planning Authority so as to curb the rapid and
unauthorised conversion of land uses. In order to curb traffic noise, accidents and traffic
volume in the area, there is need for equitable redistribution of land uses particularly those
uses that trigger and generate high volumes of traffic. Also, development control laws
should be strictly enforced by the planning authority, the Calabar Municipality Planning
Authority should enact bye-laws that restrict change of use of land either by 10 or 20
years.
8. References
Adekunle, S., Oduwaye, L. and Alade, W. (2011).Land use and Traffic Pattern along Lagos–
DFBadagry Corridor, Lagos. Nigeria. In: Proceedings of the Real Corp 2011,
Tagungsband, pp. 525 - 532.
Adger W. N. and Brown, K. (1994).Land use and the Causes of Global Warming. Chichester,
England: John Wiley and Sons, p. 57.
Akpan, I. U. (2008). Transportation and Traffic Flow Pattern in Ikot Ekpene
Urban.Unpublished BURP Research Project, University of Uyo, Uyo, Nigeria.
Balchin, P. N., Kieve, J. L. and Bull, G. H. (1991).Urban Land Economics and Public Policy.
4th ed., Hamshire: Macmillan Educational Limited, pp. 29 - 34.
Egbu, A. U. and Kalu, A. O. (2006).Transportation Planning: Approaches and Strategies to
Urban and Regional Environment, Enugu: L LinsConsult, pp. 47 - 63.
Etuk, U. S. (2008). Urban Land use Structure and Environmental Degradation in Uyo Urban,
AkwaIbom State. Unpublished MURP Dissertation, University of Uyo, Uyo. Nigeria.
Hillier, B. (1996) Cities as Movement Economies in Urban Design International.Available at
http://www.arch.ttu.edu/people/facilty/haq.Accessed on March 10, 2012.
Inyang, I.B. (2000) South Eastern Nigeria: Its Environment. Kaduna: Abaam Publishers
Company. p. 45.
Momoh, O. A (2011).Transportation Planning and Management for Economic
Development:Global Best Practices. Proceedings of the National Conference of Nigerian
Society of Engineers in Calabar.
Oruonye, E. D. (2014). An Assessment of the Impact of Road Construction on Land Use
Pattern in Urban Centres in Nigeria: A Case Study of Jalingo LGA, Taraba State Nigeria.
Mediterranean Journal of Social Science, 5(10): 82-88.
Popoola M. O., Abiola S. O., Adeniji W. A. (2013). Traffic Congestion on Highways in
Nigeria Causes, Effects and Remedies. World Academy of Science, Engineering and
Technology.International Journal of Civil, Environmental, Structural, Construction and
Architectural Engineering Vol:7, No:11, 2013
Richards, J. F. (1990). Land Transformation in the Earth as Transformed by Human Action.
Cambridge; Cambridge University Press. pp. 163 - 173.
Sule, R.O. (2004). The Environmental Consequences of Rapid Urbanisation in Countries of
the Developing World. Calabar: Thumbprints International Company, pp. 104 – 107.
Umoren and Akpan
International Journal of Social Sciences: 10(1), 2016
84
Udofia, E. P. (2011).Fundamentals of Social Science Statistics. Enugu: Immaculate
Publications Limited.p. 279.
Wu, J. and Cho, S. (2007). The Effect of Local Land use Regulations on Urban Development
in the Western United States. Journal of Regional Science and Economics, 37, 69 – 86.
9. Appendix
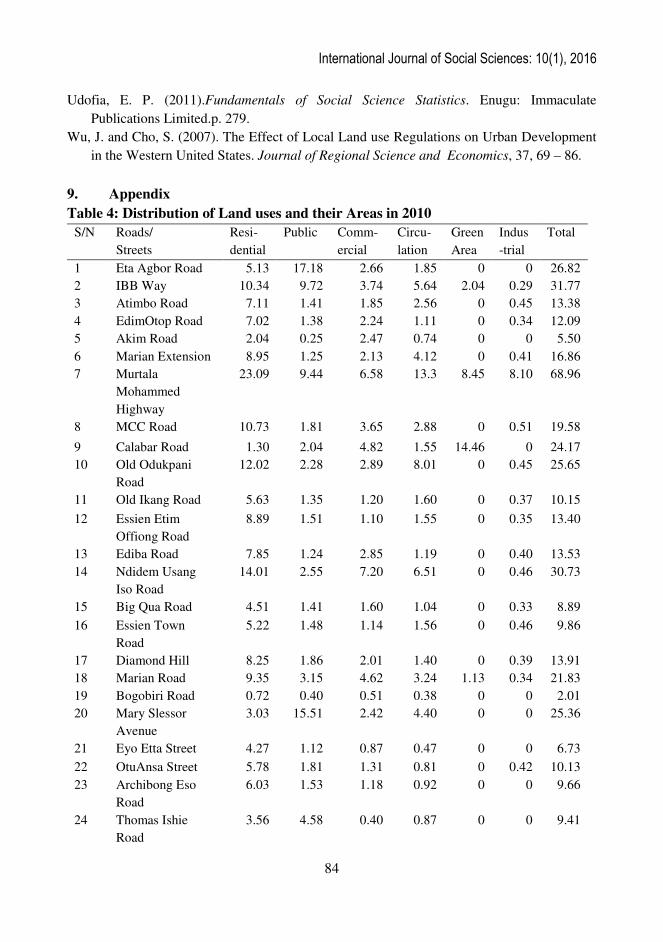
Table 4: Distribution of Land uses and their Areas in 2010
S/N Roads/
Streets
Resi-
dential
Public Comm-
ercial
Circu-
lation
Green
Area
Indus
-trial
Total
1 Eta Agbor Road 5.13 17.18 2.66 1.85 0 0 26.82
2 IBB Way 10.34 9.72 3.74 5.64 2.04 0.29 31.77
3 Atimbo Road 7.11 1.41 1.85 2.56 0 0.45 13.38
4 EdimOtop Road 7.02 1.38 2.24 1.11 0 0.34 12.09
5 Akim Road 2.04 0.25 2.47 0.74 0 0 5.50
6 Marian Extension 8.95 1.25 2.13 4.12 0 0.41 16.86
7 Murtala
Mohammed
Highway
23.09 9.44 6.58 13.3 8.45 8.10 68.96
8 MCC Road 10.73 1.81 3.65 2.88 0 0.51 19.58
9 Calabar Road 1.30 2.04 4.82 1.55 14.46 0 24.17
10 Old Odukpani
Road
12.02 2.28 2.89 8.01 0 0.45 25.65
11 Old Ikang Road 5.63 1.35 1.20 1.60 0 0.37 10.15
12 Essien Etim
Offiong Road
8.89 1.51 1.10 1.55 0 0.35 13.40
13 Ediba Road 7.85 1.24 2.85 1.19 0 0.40 13.53
14 Ndidem Usang
Iso Road
14.01 2.55 7.20 6.51 0 0.46 30.73
15 Big Qua Road 4.51 1.41 1.60 1.04 0 0.33 8.89
16 Essien Town
Road
5.22 1.48 1.14 1.56 0 0.46 9.86
17 Diamond Hill 8.25 1.86 2.01 1.40 0 0.39 13.91
18 Marian Road 9.35 3.15 4.62 3.24 1.13 0.34 21.83
19 Bogobiri Road 0.72 0.40 0.51 0.38 0 0 2.01
20 Mary Slessor
Avenue
3.03 15.51 2.42 4.40 0 0 25.36
21 Eyo Etta Street 4.27 1.12 0.87 0.47 0 0 6.73
22 OtuAnsa Street 5.78 1.81 1.31 0.81 0 0.42 10.13
23 Archibong Eso
Road
6.03 1.53 1.18 0.92 0 0 9.66
24 Thomas Ishie
Road
3.56 4.58 0.40 0.87 0 0 9.41
International Journal of Social Sciences: 10(1), 2016
85
25 Barracks Road 3.81 1.04 1.35 1.50 0 0.37 8.07
26 Atekong Drive 5.41 1.27 0.52 0.84 0 0 8.04
Total 184.05 88.57 63.31 70.04 26.08 14.44 446.49
Source: Authors’ Data Analysis (2014)
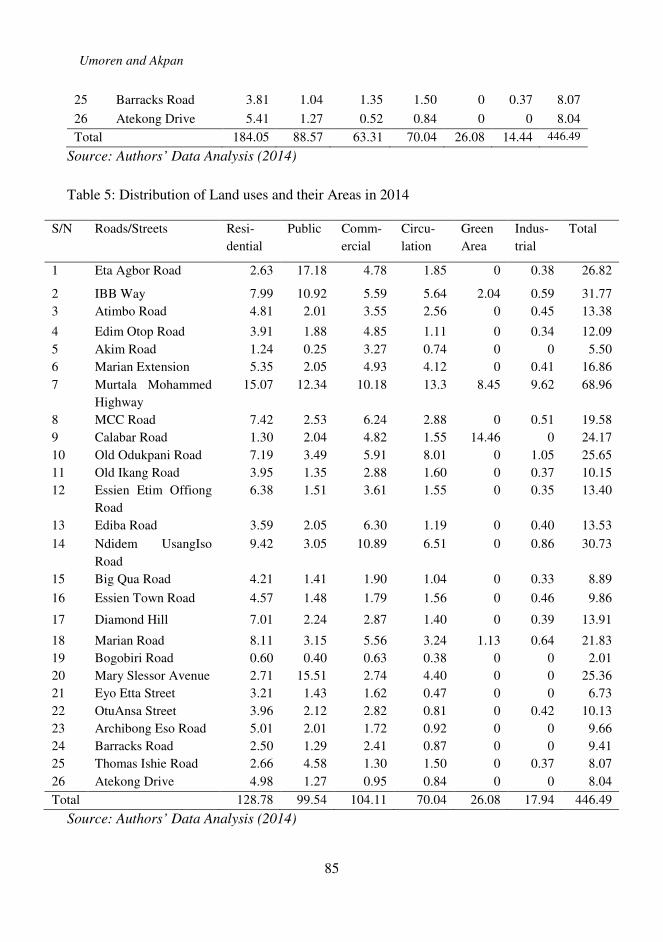
Table 5: Distribution of Land uses and their Areas in 2014
Source: Authors’ Data Analysis (2014)
S/N Roads/Streets Resi-
dential
Public Comm-
ercial
Circu-
lation
Green
Area
Indus-
trial
Total
1 Eta Agbor Road 2.63 17.18 4.78 1.85 0 0.38 26.82
2 IBB Way 7.99 10.92 5.59 5.64 2.04 0.59 31.77
3 Atimbo Road 4.81 2.01 3.55 2.56 0 0.45 13.38
4 Edim Otop Road 3.91 1.88 4.85 1.11 0 0.34 12.09
5 Akim Road 1.24 0.25 3.27 0.74 0 0 5.50
6 Marian Extension 5.35 2.05 4.93 4.12 0 0.41 16.86
7 Murtala Mohammed
Highway
15.07 12.34 10.18 13.3 8.45 9.62 68.96
8 MCC Road 7.42 2.53 6.24 2.88 0 0.51 19.58
9 Calabar Road 1.30 2.04 4.82 1.55 14.46 0 24.17
10 Old Odukpani Road 7.19 3.49 5.91 8.01 0 1.05 25.65
11 Old Ikang Road 3.95 1.35 2.88 1.60 0 0.37 10.15
12 Essien Etim Offiong
Road
6.38 1.51 3.61 1.55 0 0.35 13.40
13 Ediba Road 3.59 2.05 6.30 1.19 0 0.40 13.53
14 Ndidem UsangIso
Road
9.42 3.05 10.89 6.51 0 0.86 30.73
15 Big Qua Road 4.21 1.41 1.90 1.04 0 0.33 8.89
16 Essien Town Road 4.57 1.48 1.79 1.56 0 0.46 9.86
17 Diamond Hill 7.01 2.24 2.87 1.40 0 0.39 13.91
18 Marian Road 8.11 3.15 5.56 3.24 1.13 0.64 21.83
19 Bogobiri Road 0.60 0.40 0.63 0.38 0 0 2.01
20 Mary Slessor Avenue 2.71 15.51 2.74 4.40 0 0 25.36
21 Eyo Etta Street 3.21 1.43 1.62 0.47 0 0 6.73
22 OtuAnsa Street 3.96 2.12 2.82 0.81 0 0.42 10.13
23 Archibong Eso Road 5.01 2.01 1.72 0.92 0 0 9.66
24 Barracks Road 2.50 1.29 2.41 0.87 0 0 9.41
25 Thomas Ishie Road 2.66 4.58 1.30 1.50 0 0.37 8.07
26 Atekong Drive 4.98 1.27 0.95 0.84 0 0 8.04
Total 128.78 99.54 104.11 70.04 26.08 17.94 446.49
Umoren and Akpan
International Journal of Social Sciences: 10(1), 2016
86
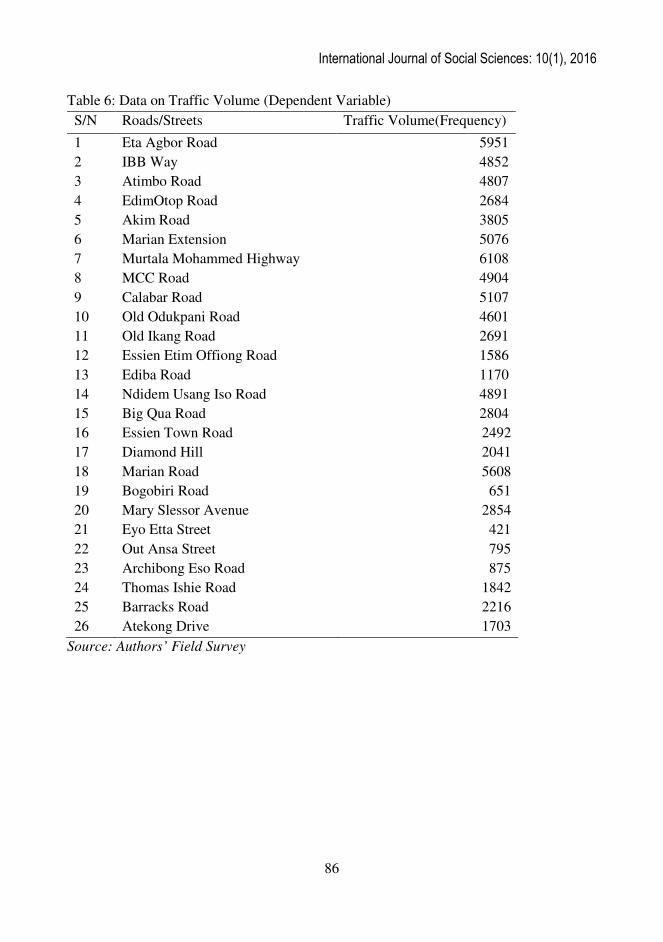
Table 6: Data on Traffic Volume (Dependent Variable)
S/N Roads/Streets Traffic Volume(Frequency)
1 Eta Agbor Road 5951
2 IBB Way 4852
3 Atimbo Road 4807
4 EdimOtop Road 2684
5 Akim Road 3805
6 Marian Extension 5076
7 Murtala Mohammed Highway 6108
8 MCC Road 4904
9 Calabar Road 5107
10 Old Odukpani Road 4601
11 Old Ikang Road 2691
12 Essien Etim Offiong Road 1586
13 Ediba Road 1170
14 Ndidem Usang Iso Road 4891
15 Big Qua Road 2804
16 Essien Town Road 2492
17 Diamond Hill 2041
18 Marian Road 5608
19 Bogobiri Road 651
20 Mary Slessor Avenue 2854
21 Eyo Etta Street 421
22 Out Ansa Street 795
23 Archibong Eso Road 875
24 Thomas Ishie Road 1842
25 Barracks Road 2216
26 Atekong Drive 1703
Source: Authors’ Field Survey