Embed Size (px)
Citation preview
Changing Demographics ofthe American Population
Ihab Halaweish, MD, Hasan B. Alam, MD*
KEYWORDS
� Geriatric � Demographics � United States
KEY POINTS
� Currently in the United States, 1 in 9 Americans is aged 65 years or older; by 2050, this willincrease to 1 in 5 Americans.
� The distribution of men and women who are older than 85 years—the oldest-old—will in-crease substantially by 2050.
� The prevalence and severity of comorbidity—the co-occurrence of multiple chronic con-ditions—will also increase.
� Life expectancy at 65 years of age has increased more in the past 30 years than in theentire 200-year period from 1750 to 1950; today, a person aged 65 years can expect tolive another 15 years.
� Mortality from cardiac disease and stroke has decreased during the past 2 decades,whereas deaths from diabetes-related complications and Alzheimer disease areincreasing.
� The aging of the population will have wide-ranging implications for the health care system.
INTRODUCTION
As noted by the Population Reference Bureau, “The U.S. is getting bigger, older, andmore diverse.” Since 1950, theUnited States has been in themidst of a profound demo-graphic change: the rapid aging of the population. The baby boom generation beganturning 65 in 2011 and is now driving growth at the older ages of the population.1 Thisreport highlights geriatric demographic changes and illustrates how these and futuretrends will have wide-ranging implications for the US health care system.
DEMOGRAPHIC TRENDSBaby Boom Generation
In the post–World War II era, Americans started families at younger ages and in greaterpercentages than during the Great Depression. Between 1946 and 1964, this resulted
Department of Surgery, University of Michigan Hospital, University of Michigan, 2920 TaubmanCenter/5331, 1500 East Medical Center Drive, Ann Arbor, MI 48109-5331, USA* Corresponding author.E-mail address: [email protected]
Surg Clin N Am 95 (2015) 1–10http://dx.doi.org/10.1016/j.suc.2014.09.002 surgical.theclinics.com0039-6109/15/$ – see front matter � 2015 Elsevier Inc. All rights reserved.

Halaweish & Alam2
in a surge in births and increased family sizes.2 In 2000, the US population was typicalof one experiencing slow growth. The population has been aging as life expectancyhas increased markedly.2 The number of persons aged 65 years and older reached35.1 million in 2000, representing 12.4% of the US population, an increase from8.1% in 1950. By 2050, the older population will reach 20.2%, around 88.5 million.In other words, 1 in 5 persons in 2050 will be aged 65 years or older.Fig. 1 illustrates the importance of the baby boom generation in shaping the overall
population demographics. In 2010, the baby boom generation was 46 to 64 years old.The 2010 population pyramid for the age groups near 20 years is a result of childrenborn to baby boomers. All of the baby boomers will have moved into the ranks ofthe older population by 2030, resulting in a shift in the age structure, from 13% ofthe population aged 65 years and older in 2010 to 19% in 2030. Even after the youn-gest of the baby boom population have passed away, aging will continue to be one ofthe most important defining characteristics of the US population, reflecting continuinglow fertility and improving survival in the United States.1
Age Composition
Half of women and almost three-fifths of men in the United States aged 65 years andolder are in the 65- to 74-year age group, and one-third of both men and women areaged 75 to 84 years, whereas only one-tenth of men and one-sixth of women are aged85 years or older. Between 2009 and 2030, this age distribution of the older populationwill remain mostly unchanged; however, by 2050 significant changes are expected:the distribution of men and women who are aged 85 years and older—the oldest-old—will increase substantially, whereas the shares of both men and women in theyoungest age group will decline. Almost one-quarter of all women and one-fifth ofall men aged 65 years and older will be in the oldest-old group. Given that theoldest-old have the highest rates of disability and institutionalization, this demographicshift will place significant strains on the state and federal budgets.3
Gender Changes
In the future, women will continue to constitute most of the older population, becausewomen live longer than men in the United States; however, the difference betweenmale and female life expectancy at birth has been decreasing. In 1979, this differencepeaked at 7.8 years and decreased to 5.0 years in 2008. As people age, this gapshrinks, with men having a life expectancy of 17.0 years at age 65 years, whereaswomen’s life expectancy at age 65 years is 19.7 years—a gap of less than 3 years.This gap decreases to only 1 year by age of 85.3
Ethnic Changes
In addition to disparities between men and women regarding aging, disparities existbetween blacks and whites. White men in the United States on average have a life ex-pectancy of 29 years and white women of 33 years at age 50 years.4 Older black menand women, however, may not expect to live as long at the age of 50, with life expec-tancies of 25 and 30 years, respectively. Since the 1970s, the black/white gap in malelife expectancy at age 50 years has remained longer than it was since 1930, but signsindicate that this gap is starting to narrow again.5 The current racial gap in life expec-tancy at older ages for men may largely be attributed to trends in heart disease amongmen in the 60 years and older age group. From the 1970s through the 1990s, blacksexperienced a slower decline in mortality from heart disease than whites. Recentevidence from analysis of the black/white life expectancy gap suggests a decline in

Fig. 1. Age and sex structure of the population for the United States: 2010, 2030, and 2050.(From Vincent GK, Velkoff VA. The next four decades, the older population in the UnitedStates: 2010 to 2050, Current Population Reports, P25-1138. Washington, DC: U.S. CensusBureau; 2010.)
Changing Demographics of American Population 3
mortality from cardiovascular-related diseases among young black men but notamong older black men.5
MORTALITY
Reduced mortality at older ages is the leading cause of the increasingly greater life ex-pectancy of the US population. A major shift has occurred in the past century
Halaweish & Alam4
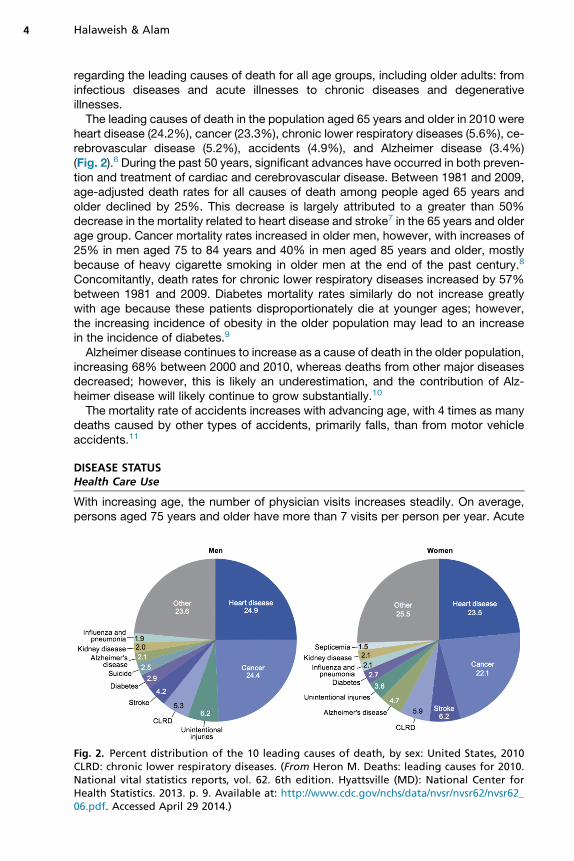
regarding the leading causes of death for all age groups, including older adults: frominfectious diseases and acute illnesses to chronic diseases and degenerativeillnesses.The leading causes of death in the population aged 65 years and older in 2010 were
heart disease (24.2%), cancer (23.3%), chronic lower respiratory diseases (5.6%), ce-rebrovascular disease (5.2%), accidents (4.9%), and Alzheimer disease (3.4%)(Fig. 2).6 During the past 50 years, significant advances have occurred in both preven-tion and treatment of cardiac and cerebrovascular disease. Between 1981 and 2009,age-adjusted death rates for all causes of death among people aged 65 years andolder declined by 25%. This decrease is largely attributed to a greater than 50%decrease in the mortality related to heart disease and stroke7 in the 65 years and olderage group. Cancer mortality rates increased in older men, however, with increases of25% in men aged 75 to 84 years and 40% in men aged 85 years and older, mostlybecause of heavy cigarette smoking in older men at the end of the past century.8
Concomitantly, death rates for chronic lower respiratory diseases increased by 57%between 1981 and 2009. Diabetes mortality rates similarly do not increase greatlywith age because these patients disproportionately die at younger ages; however,the increasing incidence of obesity in the older population may lead to an increasein the incidence of diabetes.9
Alzheimer disease continues to increase as a cause of death in the older population,increasing 68% between 2000 and 2010, whereas deaths from other major diseasesdecreased; however, this is likely an underestimation, and the contribution of Alz-heimer disease will likely continue to grow substantially.10
The mortality rate of accidents increases with advancing age, with 4 times as manydeaths caused by other types of accidents, primarily falls, than from motor vehicleaccidents.11
DISEASE STATUSHealth Care Use
With increasing age, the number of physician visits increases steadily. On average,persons aged 75 years and older have more than 7 visits per person per year. Acute
Fig. 2. Percent distribution of the 10 leading causes of death, by sex: United States, 2010CLRD: chronic lower respiratory diseases. (From Heron M. Deaths: leading causes for 2010.National vital statistics reports, vol. 62. 6th edition. Hyattsville (MD): National Center forHealth Statistics. 2013. p. 9. Available at: http://www.cdc.gov/nchs/data/nvsr/nvsr62/nvsr62_06.pdf. Accessed April 29 2014.)

Changing Demographics of American Population 5
problems decrease steadily with increasing age, whereas the chronic problemsbecome more prevalent, accounting for almost 60% of office visits in the age groupolder than 75 years.10 Hospitalizations among the elderly population aged 65 yearsand older represent a significant portion of the annual expenditures on hospitalcare. Although the 65 years and older age group constituted only 13% of the US pop-ulation in 2003,1 they accounted for 36% of all hospitalizations, with more than 13.2million hospital stays. The mean length of stay for patients aged 65 years and olderwas 1.7 days longer and the mean hospital charges 46% higher compared with theyounger cohorts. Additionally, a larger proportion of hospitalizations among the elderlywere through the emergency department.12 Compared with the nonelderly, the pro-portion of in-hospital deaths for elderly patients was 5 times higher.13 Hospital staysfor the elderly resulted in hospital charges totaling nearly $329 billion, or 43.6% ofthe national hospital bill in 2003. The Medicare program is the third largest expenditureitem for the federal government, and is projected to exceed Social Security by 2024.14
Causes of Hospitalization
The actual causes of hospitalization in persons aged 65 years and older (Fig. 3) aredominated by heart disease, including myocardial infarction, coronary artery disease,cardiac dysrhythmias, and congestive heart failure.13 Pneumonia, stroke, and cancerare also common reasons for hospitalization and are associated with high mortality.
Circulatory disorders, 28.40%
Respiratory disorders, 14.90%
Musculoskeletal disorders, 10.80%
Digestive disorders, 10.70%
Nervous system disorders, 8.00%
Genitourinary disorders, 5.20%
Endocrine disorders,
3.70%
Infections, 2.60%
All other disorders, 15.60%
Fig. 3. The 10 leading causes of hospitalization in persons aged 65 years and older, firstlisted diagnosis. United States, 2004. (Adapted from Russo CA, Elixhauser A. Hospitalizationsin the Elderly Population, 2003. Statistical Brief #6. May 2006. Rockville (MD): Agency forHealthcare Research and Quality; 2006. p. 8. Available at: http://www.hcup-us.ahrq.gov/reports/statbriefs/sb6.pdf. Accessed May 3, 2014.)

Halaweish & Alam6
Other common reasons for admission include fractures, osteoarthritis, chronic bron-chitis, and psychosis.
End of Life
Among older Americans, 49% of deaths occurred in hospitals in 1989, declining to32% in 2009. The percent dying at home increased from 15% in 1989, to 24% in2009. Use of hospice and the intensive care unit (ICU)/coronary care unit (CCU) iscommon in the last month of life. However, in the past decade, an increased use ofhospice service and a decrease in intensive care stays at the end of life have beenseen. In 2009, 43% of elderly decedents used hospice services in the last 30 daysof life, representing an increase from 19% in 1999. Twenty-seven percent of elderlydecedents used ICU/CCU in the last 30 days of life in 2009, compared with 22% in1999. The length of hospice stay has also been increasing over the past decades.In 2009, 19% of hospice stays were more than 90 days, compared with 13% in 1999.7
COMORBIDITYChronic Conditions
In general, the risk of developing most diseases increases progressively with age.Thus, it is not surprising that the prevalence and severity of comorbidities, and theco-occurrence of multiple chronic conditions, are significantly higher in the older pop-ulation. An estimated 2 of every 3 older Americans have multiple chronic conditions.15
Table 1 lists the most commonly reported chronic conditions in adults aged 65 yearsand older. Hypertension is the most common condition, reported by almost half ofthe older population, with nearly one-quarter of men and women reporting coronaryheart disease. More than 8% of the older population reported a history of stroke.
Table 1Most commonly reported chronic conditions per 100 persons aged 65 years and older in 2005
Condition Men Women
Hypertension 44.6 51.1
Arthritis diagnosis 40.4 51.4
Chronic joint symptoms 39.7 47.7
Coronary heart disease 24.3 16.5
Cancer (any type) 23.2 17.5
Vision impairment 14.9 18.7
Diabetes 16.9 14.7
Sinusitis 11.5 16
Ulcers 13.1 10.4
Hearing impairment 14.8 8.4
Stroke 8.9 8.2
Emphysema 6.3 4.1
Chronic bronchitis 4.5 6.3
Kidney disorders 4.1 3.9
Liver disease 1.4 1.4
Data from Guralnik JM, Ferrucci L. Demography and epidemiology. In: Halter JB, Ouslander JG,Tinetti ME, et al, editors. Hazzard’s geriatric medicine and gerontology. 6th edition. New York:McGraw-Hill; 2009. p. 9. Available at: http://accessmedicine.mhmedical.com.proxy.lib.umich.edu/content.aspx?bookid5371&Sectionid541587608. Accessed May 10, 2014.

Changing Demographics of American Population 7
The prevalence rates of chronic conditions vary, however, according to race andethnicity. In the subgroup of adults aged 70 years and older, non-Hispanic blackshave a 1.5-fold higher incidence of hypertension, with increased rates of stroke.10
Obesity
Obesity is a risk factor for many chronic conditions, including type 2 diabetes, hyper-tension, hyperlipidemia, stroke, heart disease, cancer (endometrial, colon, postmeno-pausal breast), and arthritis. Higher grades of obesity are associated with excessmortality, primarily from cardiovascular disease, diabetes, and certain cancers.9,16–18
Between 1999 and 2008 the prevalence of obesity in men aged 60 years and olderincreased significantly from 33% to 40%, whereas the percentage of women whowere obese declined from 39% to 35%.19 During the same period, the prevalenceof obesity among older non-Hispanic black men increased from 26% to 38%.19
Diabetes
The prevalence of diabetes among Americans older than 65 years varies from 22% to33%.20 Diabetes in older adults is associated with higher mortality, increased risk ofhospitalization, and decreased functional status.21 Older patients with diabetes expe-rience higher rates of acute and chronic microvascular and cardiovascular complica-tions of the disease. Of the obesity-related conditions, diabetes is most closely linkedto obesity. Increasing rates of overweight and obesity in the older US population arestrongly linked to the current epidemic of type 2 diabetes. With the aging of the USpopulation, the Centers for Disease Control and Prevention projects that the preva-lence of diabetes will double in the next 20 years.22 Other projections suggest a4.5-fold increase in the diagnosis of diabetes in adults older than 65 years between2005 and 2055. In this period, minority groups will have the largest increases in theincidence of diabetes; the number is projected to increase 481% among Hispanics,208% among blacks, and 113% among whites.23
Cancer
With the aging of the US population, a significant increase in the number of cancer di-agnoses is projected. The US population is expected to increase 19% from 2010 to2030, with a 67% increase in the cancer incidence anticipated for patients aged65 years or older (from 1.0 to 1.6 million).8 Prostate, lung, colon and rectum, andbladder cancers are themost common cancers that affect men, whereas breast, colonand rectum, lung, and uterine cancers are the leading cancers in women. Withincreasing age, the incidence of most of these cancers increases, but at the oldestages, cancers such as prostate, breast, and lung begin to decrease in incidence.24
Dementia
The cause of most dementia is unknown, but the final stages are usually associatedwith a decline in cognitive ability, including memory and speech, and multiple otherfunctions that are required for independent living. With a growth in the older popula-tion, the increasing prevalence of dementia will have a deep impact not only on the in-dividuals and their families but also on the health care systems. In 2010, the estimatedprevalence of dementia among Americans older than 70 years was 14.7%.25
Alzheimer disease is the most common form of dementia, accounting for 40.0% to80.0% of these CNS illnesses.26 In 2014, an estimated 5.2 million Americans werediagnosed with Alzheimer disease, including an estimated 5.0 million people aged65 years and older.27 With the increasing number of people in the United States fallinginto the elderly age group, the annual incidence of Alzheimer and other dementias is
Halaweish & Alam8
projected to double by 2050.28 Alzheimer disease is one of the costliest chronic dis-eases to society because of substantial health care, long-term care, and hospice ex-penses. In 2014, total payments for all individuals with Alzheimer disease and otherdementias are estimated to reach $214 billion, with Medicare and Medicaid coveringapproximately 70.0% of the total health-related expenditures for people with Alz-heimer disease and other dementias.25
Disability
With increasing age, the prevalence of activities of daily living (ADL) disability increasesrapidly, approaching 90% in persons aged 85 years and older.29 In women and menaged 65 to 69 years, the prevalence of disabling immobility was 18.8% and 13.3%,respectively, and for women and men aged 90 to 95 years it was 83.3% and 63.4%,respectively.30 More than half of adults aged 65 years and older report limitations inbasic activities of daily living, such as dressing and bathing.29 Chronic conditions,including acute events such as hip fracture and cerebrovascular disease and slowlyprogressive diseases such as arthritis and heart disease, are the major underlyingcauses of physical disability in the elderly31; additionally, the increasing incidence ofobesity in the elderly continues to be a growing cause of disability.
Trauma
Traumatic injuries are important causes of morbidity and mortality in older adults, andolder adults constitute a growing proportion of trauma patients in emergency depart-ments. The increased population of older adults with active lifestyles has led to adramatic increase in geriatric traumas. In 2008, adults in the United States aged 65years and older accounted for more than 5.8 million emergency department visitsfor injuries, contributing to 30% of all visits by older adults and almost 14% of allinjury-related emergency department visits.32 Injuries sustained are more severe inolder versus younger adults, and with the increased presence of comorbid diseaseand independent effects of age, this leads to increasedmorbidity andmortality in olderpatients.33 Falls are the leading mechanism of injury and the leading cause of injury-related death in patients older than 65 years.34 Falls accounted for 2.1 million emer-gency department visits among those aged 65 years and older in 2008; almost10 times more common than motor vehicle accidents, the second leading cause oftrauma in older adults.11,35
SUMMARY
The population in the United States is projected to grow older in the next several de-cades. Much of this aging is due to the baby boom generation moving into the ranks ofthe 65 years and older population. The aging of the population will have wide-rangingimplications on the health care system. An understanding of the demographics of thisspecial population and thoughtful planning is essential to prepare for the future.
REFERENCES
1. Vincent GK, Velkoff VA. The next four decades, the older population in the UnitedStates: 2010 to 2050, Current Population Reports, P25-1138. Washington, DC:U.S. Census Bureau; 2010.
2. Shrestha LB, Heisler EJ. The Changing Demographic Profile of the United StatesAvailable at: http://www.fas.org/sgp/crs/misc/RL32701.pdf. Accessed April 20,2014.

Changing Demographics of American Population 9
3. Jacobsen LA, Kent M, Lee M, et al. America’s aging population. Popul Bull 2011;66(1). Available at: http://www.prb.org/pdf11/aging-in-america.pdf. AccessedApril 15, 2014.
4. Arias E. United States life tables, 2006, Table A. Natl Vital Stat Rep 2010;58(21):1–40.
5. Harper S, Lynch J, Burris S, et al. Trends in the black-white life expectancy gap inthe United States, 1983-2003. JAMA 2007;297(11):1224–32.
6. Heron M. Deaths: leading causes for 2010. 6th edition. National vital statistics re-ports, vol. 62. Hyattsville (MD): National Center for Health Statistics; 2013. Avail-able at: http://www.cdc.gov/nchs/data/nvsr/nvsr62/nvsr62_06.pdf. AccessedApril 29. 2014.
7. Federal Interagency Forum on Aging-Related Statistics. Older Americans 2012:key indicators of well-being. Washington, DC: Federal Interagency Forum onAging-Related Statistics; 2012. Available at: http://www.agingstats.gov/Main_Site/Data/2012_Documents/docs/EntireChartbook.pdf. Accessed April 19, 2014.
8. Smith BD, Smith GL, Hurria A, et al. Future of cancer incidence in the UnitedStates: burdens upon an aging, changing nation. J Clin Oncol 2009;27(17):2758–65.
9. Must A, Spadano J, Coakley EH, et al. The disease burden associated with over-weight and obesity. JAMA 1999;282(16):1523–9.
10. Guralnik JM, Ferrucci L. Demography and epidemiology. In: Halter JB,Ouslander JG, Tinetti ME, et al, editors. Hazzard’s geriatric medicine and geron-tology. 6th edition. New York: McGraw-Hill; 2009. Available at: http://accessmedicine.mhmedical.com.proxy.lib.umich.edu/content.aspx?bookid5371&Sectionid541587608. Accessed May 10, 2014.
11. Centers for Disease Control and Prevention. Web–based Injury Statistics Queryand Reporting System (WISQARS). Available at: http://www.cdc.gov/injury/wisqars/index.html. Accessed April 20, 2014.
12. Steiner C, Elixhauser A, Schnaier J. The healthcare cost and utilization project: anoverview. Eff Clin Pract 2002;5(3):143–51.
13. Russo CA, Elixhauser A. Hospitalizations in the elderly population, 2003. Statisti-cal Brief #6. May 2006. Rockville (MD): Agency for Healthcare Research andQuality; 2006. Available at: http://www.hcup-us.ahrq.gov/reports/statbriefs/sb6.pdf. Accessed May 3, 2014.
14. Centers for Medicare and Medicaid Services. 2013 Annual Report of the Boardsof Trustees of the Federal Hospital Insurance and Federal Supplementary Medi-cal Insurance Trust Funds. Washington (DC): U.S. Department of Health and Hu-man Services; 2013. Available at: http://downloads.cms.gov/files/TR2013.pdf.Accessed April 29, 2014.
15. National Center for Health Statistics. Health, United States, 2010: With SpecialFeature on Death and Dying. Hyattsville (MD): National Center for Health Statis-tics; 2010. Available at: http://www.cdc.gov/nchs/data/hus/hus10.pdf. AccessedApril 23, 2014.
16. U.S. Department of Health and Human Services. The Surgeon General’s call toaction to prevent and decrease overweight and obesity. Rockville (MD): U.S.Department of Health and Human Services, Public Health Service, Office of theSurgeon General; 2001. Available at: http://www.ncbi.nlm.nih.gov/books/NBK44206/. Accessed April 20, 2014.
17. Moyer VA. Screening for and management of obesity in adults: U.S. PreventiveServices Task Force recommendation statement. Ann Int Med 2012;157(5):373–8.

Halaweish & Alam10
18. U.S. Preventive Services Task Force. Screening for obesity in adults: recommen-dations and rationale. Ann Intern Med 2003;139(11):930–2.
19. Flegal KM, Carroll MD, Ogden CL, et al. Prevalence and trends in obesity amongUS adults, 1999-2008. JAMA 2010;303(3):235–41.
20. Kirkman MS, Briscoe VJ, Clark N, et al. Diabetes in older adults. Diabetes Care2012;35(12):2650–64.
21. Brown AF, Mangione CM, Saliba D, et al. California Healthcare Foundation/Amer-ican Geriatrics Society Panel on Improving Care for Elders with Diabetes. Guide-lines for improving the care of the older person with diabetes mellitus. J AmGeriatr Soc 2003;51(5 Suppl Guidelines):S265–80.
22. Boyle JP, Thompson TJ, Gregg EW, et al. Projection of the year 2050 burden ofdiabetes in the US adult population: dynamic modeling of incidence, mortality,and prediabetes prevalence. Popul Health Metr 2010;8:29.
23. Narayan KM, Boyle JP, Geiss LS, et al. Impact of recent increase in incidence onfuture diabetes burden: U.S., 2005-2050. Diabetes Care 2006;29(9):2114–6.
24. Centers for Disease Control and Prevention. National Program of Cancer Regis-tries (NPCR). Available at: http://apps.nccd.cdc.gov/uscs/. Accessed April 20,2014.
25. Hurd MD, Martorell P, Delavande A, et al. Monetary costs of dementia in theUnited States. N Engl J Med 2013;368(14):1326–34.
26. Organisation for Economic Co-operation and Development. Health at a Glance2011: OECD Indicators. OECD Publishing; 2011. Available at: http://dx.doi.org/10.1787/health_glance-2011-en. Accessed May 1, 2014.
27. Hebert LE, Weuve J, Scherr PA, et al. Alzheimer disease in the United States(2010-2050) estimated using the 2010 census. Neurology 2013;80(19):1778–83.
28. Hebert LE, Beckett LA, Scherr PA, et al. Annual incidence of Alzheimer disease inthe United States projected to the years 2000 through 2050. Alzheimer Dis AssocDisord 2001;15(4):169–73.
29. Motl RW, McAuley E. Physical activity, disability, and quality of life in older adults.Phys Med Rehabil Clin N Am 2010;21(2):299–308.
30. Leveille SG, Penninx BW, Melzer D, et al. Sex differences in the prevalence ofmobility disability in old age: the dynamics of incidence, recovery, and mortality.J Gerontol B Psychol Sci Soc Sci 2000;55(1):S41–50.
31. Fried LP, Guralnik JM. Disability in older adults: evidence regarding significance,etiology, and risk. J Am Geriatr Soc 1997;45(1):92–100.
32. National Center for Health Statistics. National Hospital Ambulatory Medical CareSurvey: 2008 Emergency Department Summary Tables. Available at: http://www.cdc.gov/nchs/data/ahcd/nhamcs_emergency/2008_ed_web_tables.pdf2008. Ac-cessed May 1, 2014.
33. Hollis S, Lecky F, Yates DW, et al. The effect of pre-existing medical conditionsand age on mortality after injury. J Trauma 2006;61(5):1255–60.
34. Bergen G, Chen LH, Warner M, et al. Injury in the United States: 2007 Chartbook.Hyattsville (MD): National Center for Health Statistics; 2008. Available at: http://www.cdc.gov/nchs/data/misc/injury2007.pdf. Accessed May 1, 2014.
35. Labib N, Nouh T, Winocour S, et al. Severely injured geriatric population:morbidity, mortality, and risk factors. J Trauma 2011;71(6):1908–14.