Embed Size (px)
Citation preview
References
Jia, G. J., H. E. Epstein, and D. A. Walker. 2003. Greeningof arctic Alaska, 1981-2001. Geophysical ResearchLetters 30: 2067.
Munger, C. A. 2007. Spatial and temporal patterns ofvegetation, terrain, and greenness in the Toolik Lakeand Upper Kuparuk River region. MS Thesis, Universityof Alaska Fairbanks.
Nolan, M. 2003. Distribution of a Star3i DEM of the
Kuparuk River watershed. Joint Office for ScientificSupport, Boulder, CO.
Wahren, D.-H. A., M. D. Walker, and M. S. Bret-Harte.2005. Vegetation responses in Alaskan arctic tundraafter 8 years of a summer warming and winter snowmanipulation experiment. Global Change Biology 11:537-552.
Walker, D. A., and H. A. Maier. 2008. Vegetation in thevicinity of the Toolik Field Station, Alaska. BiologicalPapers of the University of Alaska #28. Institute ofArctic Biology, University of Alaska Fairbanks.
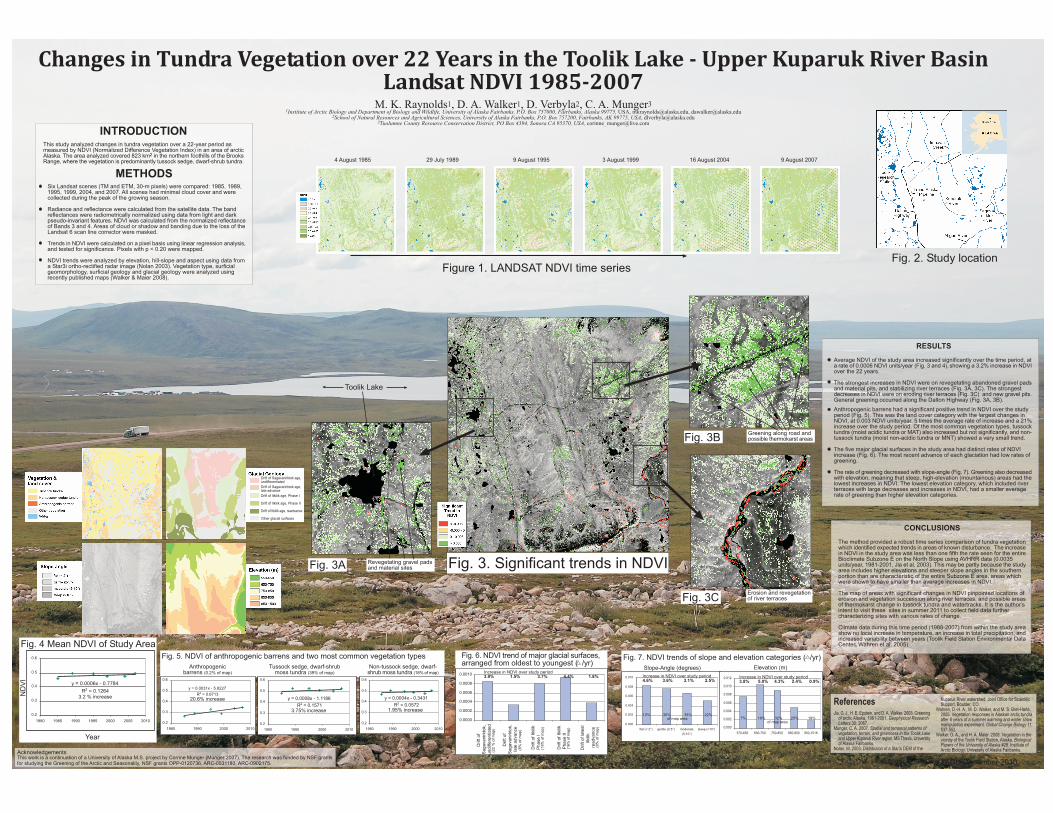
Fig. 7. NDVI trends of slope and elevation categories ( /yr)
0.000
0.002
0.004
0.006
0.008
0.010
flat (< 2°) gentle (2-5°) moderate
(5-10°)
steep (>10°)0.000
0.002
0.004
0.006
0.008
0.010
0.012
570-650 650-750 750-850 850-950 950-1518
Fig. 5. NDVI of anthropogenic barrens and two most common vegetation types
y = 0.0006x - 0.7784
R2 = 0.1264
0.2
0.3
0.4
0.5
0.6
1980 1985 1990 1995 2000 2005 2010
M. K. Raynolds1, D. A. Walker1, D. Verbyla2, C. A. Munger31Institute of Arctic Biology and Department of Biology and Wildlife, University of Alaska Fairbanks, P.O. Box 757000, Fairbanks, Alaska 99775, USA, [email protected], [email protected]
2School of Natural Resources and Agricultural Sciences, University of Alaska Fairbanks, P.O. Box 757200, Fairbanks, AK 99775, USA, [email protected] County Resource Conservation District, PO Box 4394, Sonora CA 95370, USA, [email protected]
Changes in Tundra Vegetation over 22 Years in the Toolik Lake - Upper Kuparuk River BasinLandsat NDVI 1985-2007
4 August 1985 29 July 1989 9 August 1995 3 August 1999 16 August 2004 9 August 2007
AcknowledgementsThis work is a continuation of a University of Alaska M.S. project by Corrine Munger (Munger 2007). The research was funded by NSF grantsfor studying the Greening of the Arctic and Seasonality, NSF grants OPP-0120736, ARC-0531180, ARC-0902175.
Slope-Angle (degrees) Elevation (m)
Fig. 2. Study location
Fig. 3. Significant trends in NDVIFig. 3A
Fig. 3B
Fig. 3CErosion and revegetationof river terraces
Greening along road andpossible thermokarst areas
Revegetating gravel padsand material sites
Fig. 6. NDVI trend of major glacial surfaces,arranged from oldest to youngest ( /yr)
Figure 1. LANDSAT NDVI time series
AGU December 2010
Toolik Lake
Fig. 4 Mean NDVI of Study Area
ND
VI
Year
3.2 % increase
Anthropogenicbarrens (0.2% of map)
Tussock sedge, dwarf-shrubmoss tundra (39% of map)
Non-tussock sedge, dwarf-shrub moss tundra (18% of map)
y = 0.0031x - 5.8227
R2 = 0.6713
0.2
0.3
0.4
0.5
0.6
1980 1990 2000 2010
20.6% increase y = 0.0008x - 1.1186
R2 = 0.1571
0.2
0.3
0.4
0.5
0.6
1980 1990 2000 2010
3.75% increase
y = 0.0004x - 0.3431
R2 = 0.0572
0.2
0.3
0.4
0.5
0.6
1980 1990 2000 2010
1.95% increase
0.0000
0.0002
0.0004
0.0006
0.0008
0.0010
Drift o
f
Sagavanirkto
k,
undiffe
rentiate
d (2
2 %
of m
ap)
Drift o
f
Sagavanirkto
k,
late
advance
(8%
of m
ap)
Drift o
f Itkili
k
Phase I
(18%
of m
ap)
Drift o
f Itkili
k
Phase II
(16%
of m
ap)
Drift o
f la
test
Itkili
k
readvance
(8%
of m
ap)
Increase in NDVI over study period3.9% 1.5% 3.7% 4.4% 1.8% Increase in NDVI over study period
4.6% 3.6% 3.1% 2.5%Increase in NDVI over study period3.8% 5.0% 4.3% 2.4% 0.9%
10% 30% 38% 22%of map area 7% 18% 32% 25% 19%
of map area
INTRODUCTION
This study analyzed changes in tundra vegetation over a 22-year period asmeasured by NDVI (Normalized Difference Vegetation Index) in an area of arcticAlaska. The area analyzed covered 823 km2 in the northern foothills of the BrooksRange, where the vegetation is predominantly tussock sedge, dwarf-shrub tundra.
Six Landsat scenes (TM and ETM, 30-m pixels) were compared: 1985, 1989,1995, 1999, 2004, and 2007. All scenes had minimal cloud cover and werecollected during the peak of the growing season.
Radiance and reflectance were calculated from the satellite data. The bandreflectances were radiometrically normalized using data from light and darkpseudo-invariant features. NDVI was calculated from the normalized reflectanceof Bands 3 and 4. Areas of cloud or shadow and banding due to the loss of theLandsat 6 scan line corrector were masked.
Trends in NDVI were calculated on a pixel basis using linear regression analysis,and tested for significance. Pixels with p < 0.20 were mapped.
NDVI trends were analyzed by elevation, hill-slope and aspect using data froma Star3i ortho-rectified radar image (Nolan 2003). Vegetation type, surficialgeomorphology, surficial geology and glacial geology were analyzed usingrecently published maps (Walker & Maier 2008).
METHODS
Drift of Sagavanirktok age,undifferentiated
Drift of Sagavanirktok age,late advance
Drift of Itkilik age, Phase I
Drift of Itkilik age, Phase II
Drift of Itkilik age, readvance
Other glacial surfaces
RESULTS
Average NDVI of the study area increased significantly over the time period, ata rate of 0.0006 NDVI units/year (Fig. 3 and 4), showing a 3.2% increase in NDVIover the 22 years.
The strongest increases in NDVI were on revegetating abandoned gravel padsand material pits, and stabilizing river terraces (Fig. 3A, 3C). The strongestdecreases in NDVI were on eroding river terraces (Fig. 3C) and new gravel pits.General greening occurred along the Dalton Highway (Fig. 3A, 3B).
Anthropogenic barrens had a significant positive trend in NDVI over the studyperiod (Fig. 5). This was the land cover category with the largest changes inNDVI, at 0.003 NDVI units/year, 5 times the average rate of increase and a 21%increase over the study period. Of the most common vegetation types, tussocktundra (moist acidic tundra or MAT) also increased but not significantly, and non-tussock tundra (moist non-acidic tundra or MNT) showed a very small trend.
The five major glacial surfaces in the study area had distinct rates of NDVIincrease (Fig. 6). The most recent advance of each glaciation had low rates ofgreening.
The rate of greening decreased with slope-angle (Fig. 7). Greening also decreasedwith elevation, meaning that steep, high-elevation (mountainous) areas had thelowest increases in NDVI. The lowest elevation category, which included riverterraces with large decreases and increases in NDVI, had a smaller averagerate of greening than higher elevation categories.
CONCLUSIONS
The method provided a robust time series comparison of tundra vegetationwhich identified expected trends in areas of known disturbance. The increasein NDVI in the study area was less than one fifth the rate seen for the entireBioclimate Subzone E on the North Slope using AVHRR data (0.0035units/year, 1981-2001, Jia et al. 2003). This may be partly because the studyarea includes higher elevations and steeper slope angles in the southernportion than are characteristic of the entire Subzone E area, areas whichwere shown to have smaller than average increases in NDVI.
The map of areas with significant changes in NDVI pinpointed locations oferosion and vegetation succession along river terraces, and possible areasof thermokarst change in tussock tundra and watertracks. It is the author�sintent to visit these sites in summer 2011 to collect field data furthercharacterizing sites with various rates of change.
Climate data during this time period (1988-2007) from within the study areashow no local increase in temperature, an increase in total precipitation, andincreased variability between years (Toolik Field Station Environmental DataCenter, Wahren et al. 2005).