Embed Size (px)
Citation preview
Abstract—This study describes how typhoons in the South
China Sea can change the sea surface temperature (SST) and precipitation rate trend. Typhoons that occurred in the South China Sea from 1991 to 2011 were selected. The effect of typhoons on SST and precipitation rate was examined with the use of archived data of the National Centers for Environmental Prediction/National Center for Atmospheric Research (NCEP/NCAR), and the number of typhoons from the Joint Typhoon Warning Center during the indicated period was reported. Most typhoons happened during the months of August and September. Maximum values of SST and precipitation rate were recorded during May and June and during November and December, respectively. Results of a long-term study on typhoon behavior indicate that on average, SST increases before a typhoon whereas precipitation rate increases after a typhoon. By contrast, a short-term study showed that an increase in the number of typhoons decreases both SST and precipitation rate. Most variations in SST and precipitation rate were seen in longitudes and latitudes in the Malaysian environment.
Index Terms—Precipitation rate, South China Sea, SST,
tropical cyclone.
I. INTRODUCTION The South China Sea is a marginal sea located on the west
of the tropical Pacific Ocean. It is a semi-closed ocean basin surrounded by South China, Peninsular Malaysia, Borneo Island, the Philippines, and the Indo-China Peninsula [1]. Our area of study is from 0º to 7º north and from 99º to 120º east, which includes the Malaysian water environment. Typhoon, an important event in South China Sea climate, can essentially affect precipitation and cause enormous destruction. In particular, precipitation from typhoons significantly contributes to overall precipitation. Although Malaysia is spared from the threats of severe natural hazards, it has experienced disasters such as flooding, man-made disasters, and landslides.
Ariffin and Moten studied the effect of tropical cyclones in the western Pacific Ocean and South China Sea on the rainfall in Malaysia. The results showed the probability of rainfall changes in different stages of cyclones and their location within the area [2].
Wangwongchai et al. investigated the effect of the Asian winter monsoon, which comes from high latitudes and moves to low latitudes, on heavy rainfall in the South China Sea. The authors conducted their study in Thailand from 20
Manuscript received March 5, 2013; revised May 3, 2013. This work
was supported by a fellowship from Center for Marine and Coastal Studies (CEMACS), Universiti Sains Malaysia.
The authors are with the Center for Marine and Coastal Studies (CEMACS), Universiti Sains Malaysia, 11800 Minden, Penang, Malaysia (e-mail: [email protected]; [email protected]).
to 23 of November 2000. They found that disturbances in the area affect precipitation [3].
Fumin et al. presented that tropical cyclones affect the amount of precipitation in China. The authors defined the main typhoon season as occurring from May to November and described the frequency of typhoon effects to be steady during the past 40 years (1957 to 1996). They also found a reduced trend in the precipitation caused by tropical cyclones compared with overall precipitation [4]. The characteristics of typhoon rainfall in China were studied in [5]. Precipitation as a result of typhoons was found to steadily reduce from the southeastern coastal region to the northwestern part of the area. The heaviest rainfall was caused by typhoons.
Reference [6] analyzed the patterns of rainfall in Peninsular Malaysia monthly, yearly, and during the monsoon period. Using an interpolation method, the authors produced daily rainfall fields during the period from 1971 to 2006. Rainfall characteristics were spatially and temporally different in the regions. The long-term analysis of rainfall variability showed that the dry and wet seasons in the areas were not essentially governed by the El Niño Southern Oscillation events. The east coast region, which received high amounts of precipitation during the northeast monsoon, had a lower precipitation variation and a steadier rainfall distribution than other areas.
II. DATA AND METHOD This study covers a 21-year period from 1991 to 2011.
Sea surface temperature (SST) and precipitation rate values during these years were obtained from the data set of the National Centers for Environmental Prediction/National Center for Atmospheric Research. The number of typhoons during the indicated period was obtained from the Joint Typhoon Warning Center [7]. The interaction between typhoons and the two mentioned parameters was investigated through an analysis of the cyclical variations of typhoon numbers, SST, and precipitation rate.
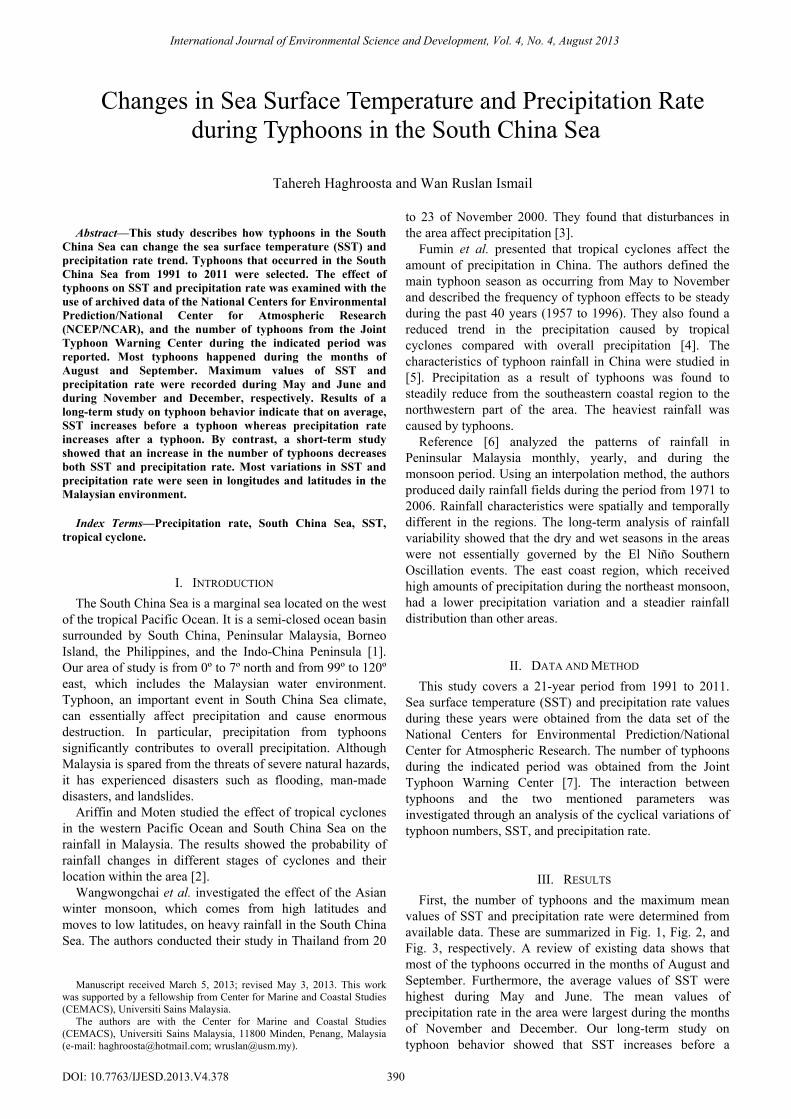
III. RESULTS First, the number of typhoons and the maximum mean
values of SST and precipitation rate were determined from available data. These are summarized in Fig. 1, Fig. 2, and Fig. 3, respectively. A review of existing data shows that most of the typhoons occurred in the months of August and September. Furthermore, the average values of SST were highest during May and June. The mean values of precipitation rate in the area were largest during the months of November and December. Our long-term study on typhoon behavior showed that SST increases before a
Changes in Sea Surface Temperature and Precipitation Rate during Typhoons in the South China Sea
Tahereh Haghroosta and Wan Ruslan Ismail
International Journal of Environmental Science and Development, Vol. 4, No. 4, August 2013
390DOI: 10.7763/IJESD.2013.V4.378
typhoon whereas precipitation rate increases after a typhoon. In other words, SST in the area increases before typhoon occurrence to prepare the required energy for typhoons and thus causes the typhoon to bring additional precipitation in subsequent months.
Fig. 1. Most typhoons occurred in the months of August and September.
Fig. 2. The maximum SST occurred in the months of May and Jun.
Fig. 3. The maximum precipitation rate occurred in the months of Nov and
Dec. Second, a comparison of the mean values of SST from
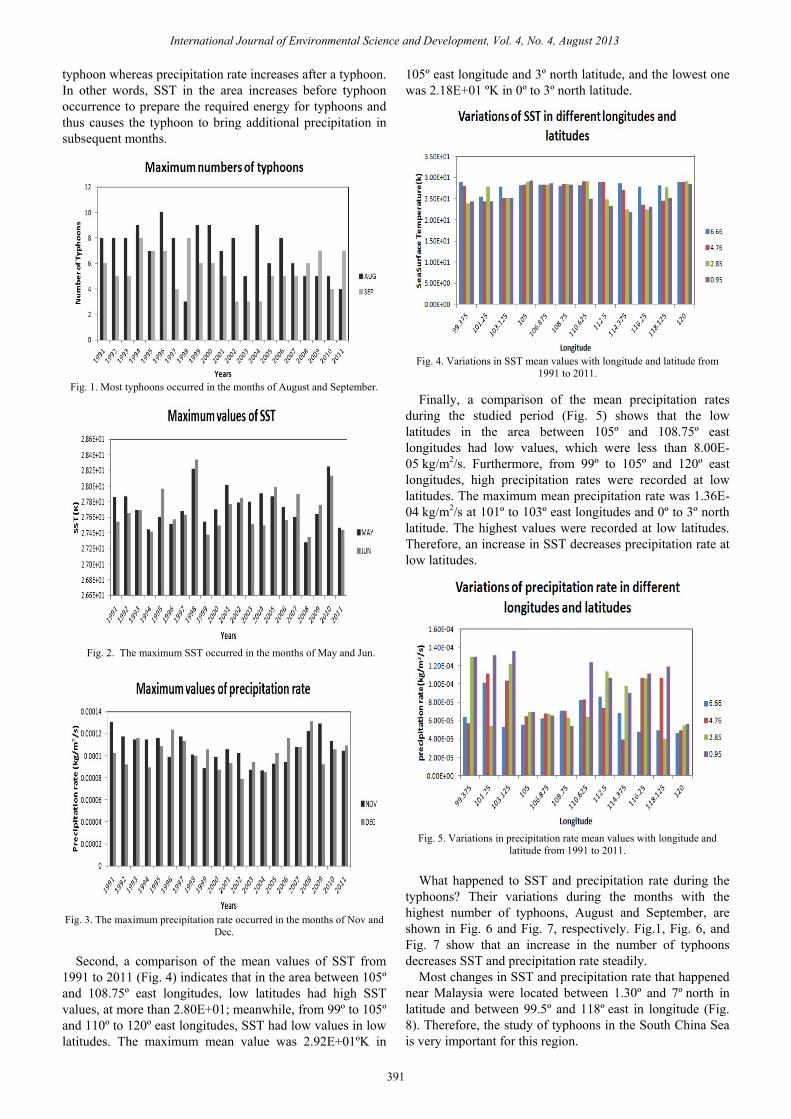
1991 to 2011 (Fig. 4) indicates that in the area between 105º and 108.75º east longitudes, low latitudes had high SST values, at more than 2.80E+01; meanwhile, from 99º to 105º and 110º to 120º east longitudes, SST had low values in low latitudes. The maximum mean value was 2.92E+01ºK in
105º east longitude and 3º north latitude, and the lowest one was 2.18E+01 ºK in 0º to 3º north latitude.
Fig. 4. Variations in SST mean values with longitude and latitude from
1991 to 2011. Finally, a comparison of the mean precipitation rates
during the studied period (Fig. 5) shows that the low latitudes in the area between 105º and 108.75º east longitudes had low values, which were less than 8.00E-05 kg/m2/s. Furthermore, from 99º to 105º and 120º east longitudes, high precipitation rates were recorded at low latitudes. The maximum mean precipitation rate was 1.36E-04 kg/m2/s at 101º to 103º east longitudes and 0º to 3º north latitude. The highest values were recorded at low latitudes. Therefore, an increase in SST decreases precipitation rate at low latitudes.
Fig. 5. Variations in precipitation rate mean values with longitude and
latitude from 1991 to 2011. What happened to SST and precipitation rate during the
typhoons? Their variations during the months with the highest number of typhoons, August and September, are shown in Fig. 6 and Fig. 7, respectively. Fig.1, Fig. 6, and Fig. 7 show that an increase in the number of typhoons decreases SST and precipitation rate steadily.
Most changes in SST and precipitation rate that happened near Malaysia were located between 1.30º and 7º north in latitude and between 99.5º and 118º east in longitude (Fig. 8). Therefore, the study of typhoons in the South China Sea is very important for this region.
International Journal of Environmental Science and Development, Vol. 4, No. 4, August 2013
391
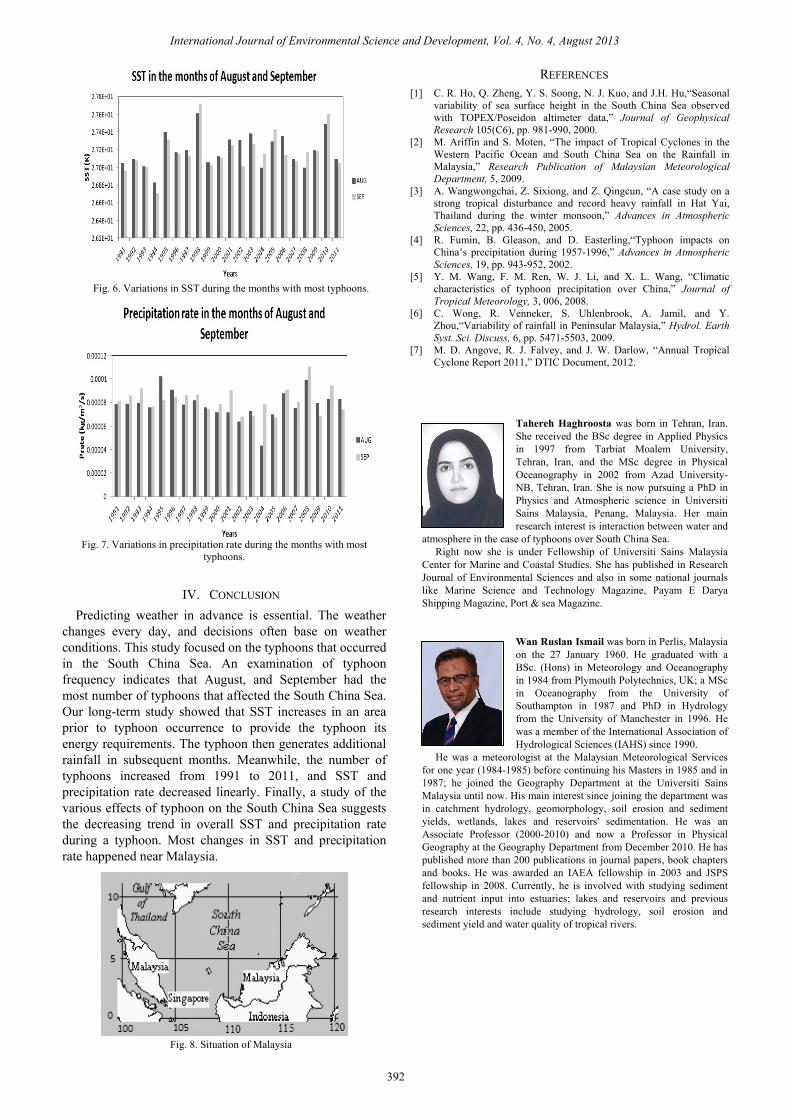
Fig. 6. Variations in SST during the months with most typhoons.
Fig. 7. Variations in precipitation rate during the months with most
typhoons.
IV. CONCLUSION Predicting weather in advance is essential. The weather
changes every day, and decisions often base on weather conditions. This study focused on the typhoons that occurred in the South China Sea. An examination of typhoon frequency indicates that August, and September had the most number of typhoons that affected the South China Sea. Our long-term study showed that SST increases in an area prior to typhoon occurrence to provide the typhoon its energy requirements. The typhoon then generates additional rainfall in subsequent months. Meanwhile, the number of typhoons increased from 1991 to 2011, and SST and precipitation rate decreased linearly. Finally, a study of the various effects of typhoon on the South China Sea suggests the decreasing trend in overall SST and precipitation rate during a typhoon. Most changes in SST and precipitation rate happened near Malaysia.
Fig. 8. Situation of Malaysia
REFERENCES [1] C. R. Ho, Q. Zheng, Y. S. Soong, N. J. Kuo, and J.H. Hu,“Seasonal
variability of sea surface height in the South China Sea observed with TOPEX/Poseidon altimeter data,” Journal of Geophysical Research 105(C6), pp. 981-990, 2000.
[2] M. Ariffin and S. Moten, “The impact of Tropical Cyclones in the Western Pacific Ocean and South China Sea on the Rainfall in Malaysia,” Research Publication of Malaysian Meteorological Department, 5, 2009.
[3] A. Wangwongchai, Z. Sixiong, and Z. Qingcun, “A case study on a strong tropical disturbance and record heavy rainfall in Hat Yai, Thailand during the winter monsoon,” Advances in Atmospheric Sciences, 22, pp. 436-450, 2005.
[4] R. Fumin, B. Gleason, and D. Easterling,“Typhoon impacts on China’s precipitation during 1957-1996,” Advances in Atmospheric Sciences, 19, pp. 943-952, 2002.
[5] Y. M. Wang, F. M. Ren, W. J. Li, and X. L. Wang, “Climatic characteristics of typhoon precipitation over China,” Journal of Tropical Meteorology, 3, 006, 2008.
[6] C. Wong, R. Venneker, S. Uhlenbrook, A. Jamil, and Y. Zhou,“Variability of rainfall in Peninsular Malaysia,” Hydrol. Earth Syst. Sci. Discuss, 6, pp. 5471-5503, 2009.
[7] M. D. Angove, R. J. Falvey, and J. W. Darlow, “Annual Tropical Cyclone Report 2011,” DTIC Document, 2012.
Tahereh Haghroosta was born in Tehran, Iran. She received the BSc degree in Applied Physics in 1997 from Tarbiat Moalem University, Tehran, Iran, and the MSc degree in Physical Oceanography in 2002 from Azad University- NB, Tehran, Iran. She is now pursuing a PhD in Physics and Atmospheric science in Universiti Sains Malaysia, Penang, Malaysia. Her main research interest is interaction between water and
atmosphere in the case of typhoons over South China Sea. Right now she is under Fellowship of Universiti Sains Malaysia
Center for Marine and Coastal Studies. She has published in Research Journal of Environmental Sciences and also in some national journals like Marine Science and Technology Magazine, Payam E Darya Shipping Magazine, Port & sea Magazine.
Wan Ruslan Ismail was born in Perlis, Malaysia on the 27 January 1960. He graduated with a BSc. (Hons) in Meteorology and Oceanography in 1984 from Plymouth Polytechnics, UK; a MSc in Oceanography from the University of Southampton in 1987 and PhD in Hydrology from the University of Manchester in 1996. He was a member of the International Association of Hydrological Sciences (IAHS) since 1990.
He was a meteorologist at the Malaysian Meteorological Services for one year (1984-1985) before continuing his Masters in 1985 and in 1987; he joined the Geography Department at the Universiti Sains Malaysia until now. His main interest since joining the department was in catchment hydrology, geomorphology, soil erosion and sediment yields, wetlands, lakes and reservoirs' sedimentation. He was an Associate Professor (2000-2010) and now a Professor in Physical Geography at the Geography Department from December 2010. He has published more than 200 publications in journal papers, book chapters and books. He was awarded an IAEA fellowship in 2003 and JSPS fellowship in 2008. Currently, he is involved with studying sediment and nutrient input into estuaries; lakes and reservoirs and previous research interests include studying hydrology, soil erosion and sediment yield and water quality of tropical rivers.
International Journal of Environmental Science and Development, Vol. 4, No. 4, August 2013
392