Embed Size (px)
Citation preview

1
بسم الله الرحمن الرحيم
Changes in Chemical and Physical Properties of Groundnut and
Cottonseed Oils used in Frying Fish and Chickpea Balls
Moawya Ibrahim Yousif Abdalla
B.Sc. (Hon.) in Agricultural Sciences (Food Sciences)
Faculty of Agricultural Sciences
University of Gezira (2000)
M.Sc. (Toxicology)
Agricultural Sciences (Pesticides and Toxicology)
Faculty of Agricultural Sciences
University of Gezira (2004)
A Thesis
Submitted to the University of Gezira in Partial Fulfillment of the
Requirements for the Award of the Degree of Doctor of Philosophy in
Pesticides and Toxicology (Toxicology)
in
Pesticides and Toxicology (Toxicology)
Department of Pesticides and Toxicology
Faculty of Agricultural Sciences
(August / 2014)
2
Changes in Chemical and Physical Properties of Groundnut and
Cottonseed Oils used in Frying Fish and Chickpea Balls
Moawya Ibrahim Yousif Abdalla
Supervision Committee:
Name Position Signature
Prof. Salah Ahmed ElHussein Main Supervisor ……………………………
Prof. ELAmin Abdalla ElKhalifa Co- supervisor …………………………….
Prof. Nabil Hamid Hassan Bashir Co- supervisor ……………………………..
Date: August / 2014
3
Changes in Chemical and Physical Properties of Groundnut and
Cottonseed Oils used in Frying Fish and Chickpea Balls
Moawya Ibrahim Yousif Abdalla
Examination Committee:
Name Position Signature
Prof. Salah Ahmed ElHussein Chairperson …………………………...
Dr. Hassan Ali Mudawi External Examiner …………………………..
Prof. Ali Osman Ali Internal Examiner ……………………………
Date of Examination: 13 /8/2014

4
Dedication
This thesis is dedicated to my parents, Ibrahim and Shadia,
who are always loved me unconditionally and taught me to
work hard for the things that I aspire to achieve. This work is
also dedicated to my wife, Amna and our lovely kids, Ziad,
Samar and Ahmed, who have been unlimited source of
support and encouragement during the course of this study and
my whole life. I am truly thank ALLah for having them in my
life.
With my love!

5
ACKNOWLEDGEMENTS
First and foremost, I thank Allah (subhanah wa taala) for endowing me
with health, patience, and knowledge to complete this work.
I thank all who in one way or another contributed in the completion of
this thesis.
I acknowledge, with deep gratitude and appreciation, the inspiration,
encouragement, valuable time and guidance given to me by Professor
Salah Ahmed ElHussein, who served as my main supervisor. Thereafter, I
am deeply indebted and grateful to my co-supervisor Professor ELAmin
Abdalla ElKhalifa, for their constructive guidance, valuable advice and
cooperation. I would like to express my deepest thanks to my co-
supervisor Professor Nabil Hamid Hassan Bashir for their extensive
guidance, continuous support, and personal involvement in all phases of
this research.
Thanks and acknowledgment are due to the laboratory senior technician
personnel Mr. Hassan Elansari and Mr. Mohamed Elmaleeh, faculty of
Engineering and technology for their tremendous help also to Ms. Najla
Khider and Ms. Marym, faculty of agricultural sciences, biochemistry
lab., for their substantial assistance in the experimental work, and also to
the lab. technician, Mr. Mohemed Abdul Raoof for his help and
assistance in experimental work. I am also indebted to the chairman, Dr.
Atiff Abdel Moneim, National oilseed processing research Institute, for
his support.
Deep thank is due to my senior colleague at the all study stages, Mr.
Tarig Ahmed Korak, for his logistic support.
Finally, I would like to express my deepest gratitude to my mother,
father, brother, sister, my wife, my children, and all other relatives, for
their emotional and moral support throughout my academic career and
also for their love, patience, encouragement and prayers.

6
Changes in Chemical and Physical Properties of Groundnut and Cottonseed Oils
used for Frying Fish and Chickpea Balls
Moawya Ibrahim Yousif Abdalla
University of Gezira
Abstract
Different edible oils used in frying food, are expected to have some changes in their
physical and chemical properties including the production of harmful compounds. Moreover, it
is now a common practice in homes and restaurants, reusing oils for frying fish or falafel
(tamieya) several times. The objectives of this research were to investigate the changes in the
physical and chemical qualities of cottonseed (CS) oil and groundnut (GN) oil used in frying
fish and falafel, determine the level of Cu, Cd and Pb and study attitudes and practices done by
restaurants and homes during frying process. These objectives were achieved through different
methodologies; a questionnaire composed of 20 questions has been designed to 103 and 78
cooks of homes and restaurants, respectively, and depending on questionnaire findings the
experiment was designed. The experiment was composed of two types of food (fish and falafel)
which were fried separately and continuously in CS and GN oils, for 20 cycles. Samples were
taken during frying process at initial/fresh oil, 5th, 10
th, 15
th and 20
th frying cycle number and
analyzed for chemical and physical changes. The survey results showed that the process of
frying in homes sector were found acceptable, except in reusing deteriorated frying oil for
wiping Kisra pan's and cooking food. However, in restaurants, unacceptable practices were
done in terms of, prolonged use of thermally deteriorated frying oils, storing remained oil in
fryer, topping oil and pouring waste oil in drainage system. Color index and viscosity of the two
oils increased as the number of frying cycles increased. Peroxide, acid values and free fatty acid
percent of both oils, were increased as frying number increased. Total polar compounds (TPC)
of both oils increased as frying number increased. Groundnut oil was the most stable among the
two studied oils. However, no significant differences (p>0.05) in physical and chemical changes
were found in each frying oils for both types of fried food, except for TPC. The level of Cu, Cd
and Pb change rates in CS oil used for frying fish ranged from 157-450, 0-9 and 159-269 ppb,
respectively. Regarding frying falafel, the respective ranges were 130-326, 0-1.5 and 79-269
ppb, respectively. The respective values for GN oil used for frying fish were 174-584 (Cu), 0-5
(Cd) and 39-638 ppb (Pb). On the other hand, for frying falafel, the range of values were 163-
222 (Cu), 0-5 (Cd) and 67-200 ppb (Pb). TPC and Cd didn't exceed accepted limits among the
two studied oils, except for Cu and Pb. Thus, the study recommended that changes in chemical
and physical properties of the two studied oils has been found acceptable in terms of quality,
except for limits of Pb and Cu it is not safe.

7
قلي فى السوداني وبذرة القطن المستخدمة الفول الكيميائية والفيزيائية لزيوت في الخواص التغيراتالطعميةالاسماك و
معاوية ابراهيم يوسف عبدالله
جامعة الجزيرة
ملخص الدراسة
زيوت الطعام المختلفة لقلى الاطعمة ومن المتوقع ان تتغير خصائصها الفيزيائيةة والييميائيةة متنةماة اجتةا تستخدم
مركبات ضارة. علاوة علي ذلك اصبحت هذه الممارسات شائعة فى الماازل والمطاعم وهي تيرار استخدام زيةوت القلةى
سة للتعرف على التغيرات الفيزيائية والييميائيةة لزيتةى رةذرة لعدة مرات. هدفت هذه الدرا -للاسماك والفلافل )الطعمية( –
اليةادميوم والرصةا , تحديةد مسةتويات الاحةا و القطن و الفول السوداجي المستخدمين لقلى السمك والفلافل )الطعمية(
هةذه الاهةداف مةن رها طهاة الاطعمة في الماازل والمطةاعم اناةاع عمليةة القلةى. وقةد تحققةت يقومودراسة الممارسات التي
اة الماةازل والمطةاعم, من طه 87و 321سؤال علي عدد 02خلال ماهجيات مختلفة, حيث تم تطبيق استبيان يتيون من
واعتماداً على جتائج الاستبيان تم تصميم التجررة.تيوجت التجررة من جوعين من الاطعمة )الاسماك و الفلافل( علي التوالي
دورة قلةي. اخةذت العياةات اناةاع 02ومافصلة فى زيتيي رذرة القطن والفول السوداجي لعدد حيث تم قليها رصورة مستمرة
ومن نم تحليلها فيزيائياً وكيميائياً. اظهرت جتائج المسح 02و 35, 32, 5عملية القلي فى كل من دورة القلي رقم صفر,
لقلي المتدهور في مسح صا اليسرة ى إستخدام زيت االاستبياجى رصورة عامة ان عمليات القلى المازلي مقبولة, ما عدا ف
من حيث, الاستمرار في استخدام زيت القلي المتةدهور غير مقبولةاما في قطاع المطاعم وجدت ممارسات .وطبخ الطعام
حرارياً لفترات زماية طويلة, تخزين الزيت المتبقى فى اجاع القلى, تيملة زيت القلي المتدهور رزيت جديد وسيب مخلفات
ا ارتفعةت ارتفع مقيا اللون واللزوجة في كلا الزيتين رزيةادة عةدد دورات القلةي. كمة الزيت في اجاريب الصرف الصحي.
قيم البيروكسيد, الحموضة والاحماض الدهاية الحرة في كل من زيت رذرة القطن والفول السوداجي. ازدادت الاسبة المئوية
رازدياد عةدد دورات القلةي. كةان زيةت الفةول السةوداجي الاكقةر اسةتقراراً كلا الزيتين( في TPCللمركبات القطبية اليلية )
ما الدراسةة. مةع ذلةك كاجةت جتةائج التحليةل الاحصةائي لمعةدلات التغييةر الفيزيائيةة والييميائيةة رين زيتي القلي اللةذين شةملته
(, مةا عةدا فةي حالةة تغيةرات المركبةات 2.25لزيتي القلي ليةلا الاةوعين مةن امطعمةة المقليةة لا تختلةي معاويةاً )راحتمةال
والرصا في زيت رذرة القطن المستخدم لقلي السةمك القطبية اليلية. تراوح مستوي معدل التغيير في الاحا , اليادميوم
(, 106 - 312( . اما عاد قلي الفلافل كاجت المستويات )ppb 069 – 359( و )9 - 2(, )052-358علي الترتيب, )
(. كما تراوح مستوي معدل التغيير في الاحا , اليادميوم والرصا في زيت الفول ppb 069 – 89( و )3.5 – 2)
( . امةا عاةد قلةي الفلافةل ppb 617 – 19( و )5 - 2(, )570 -380لمستخدم لقلةي السةمك علةي الترتيةب, ) السوداجي ا
, TPC(, علةي التةوالي.علي الةرغم مةن ان مسةتويات ppb 022 – 68( و )5 – 2(, )000 - 361كاجت المستويات )
لذين شةملتهما الدراسةة, مةا عةدا فةي مسةتويات الاحا , اليادميوم و الرصا لم تتجاوز الحدود المقبولة في كلا الزيتين ال
وعليه اوصت الدراسة ران التغيرات الييميائية والفيزيائية للزيتين اللذين شملتهما الدراسة قد وجدت مقبولة من .الرصا
.ما عدا حدود مستويات الرصا والاحا لم تين آماةحيث الجودة
8
TABLE OF CONTENTS
Topic Page
Dedication …………………………………………………………………… IV
Acknowledgement …………………………………………………………… V
English Abstract……………………………………………………………… VI
Arabic Abstract………………………………………………………………... VII
Table of Contents ……………………………………………………………... VIII
List of Tables …………………………………………………………………. XIII
List of Figures ………………………………………………………………… XV
List of Appendices…………………………………………………………… XVI
List of abbreviations ………………………………………………………… XVII
Chapter One: Introduction 1
Chapter Two: Literature Review 4
2.1 FATS and OILS………………………………………………………… 4
2.1.1 Types of Fatty Acids (FAs)……………………………………… 4
2.1.1.1 Saturated Fatty Acids (SFAs) …………………………………… 4
2.1.1.2 Monounsaturated Fatty Acids (MUFAs) ……………………… 4
2.1.1.3 Polyunsaturated Fatty Acids (PUFAs) ………………………….. 4
2.1.2 Dietary Fats and Blood Cholesterol……………………………… 5
2.2 RECOMMENDATION OF FAT INTAKE …………………. 5
2.2.1 The Selection of Vegetable Fat/Oil for Health ………………… 6
2.3 FRYING OILS ………………………………………………… 6
2.3.1 Cottonseed Oil……....................................................................... 6
2.3.2 Groundnut/ Peanut Oil……………………………..…………… 7
2.4 FRYING FOOD………………………………………………... 8
2.4.1 Chickpea ……………………………………..…………………. 8
9
2.4.2 Fish…………..………………………………………… 9
2.4.2.1 Nutritional Value………………………………………. 9
2.4.2.2 Health Benefits………………………………………… 9
2.4.2.3 Health Hazards…………………………………………….. 9
2.4.2.4 Fish Consumption Patterns……………………………….. 10
2.5 FRYING ………………………………………………...... 10
2.5.1 Changes in Frying Food Qualities and Frying Oils Qualities…… 11
2.5.1.1 Break-in oil …………………………………………………. 11
2.5.1.2 Fresh oil …………………………………………….……….. 11
2.5.1.3 Optimum oil………………………………………….………. 12
2.5.1.4 Degrading oil ………………………………………….…….. 12
2.5.1.5 Runaway oil ………………………………………….……… 12
2.5.2 FRIED FOOD QUALITIES……………………………….. 12
2.5.2.1 Moisture contents. ………………………………………….. 12
2.5.2.1.1 Temperature. ………………………………………………… 13
2.5.2.1.2 Time. ……………………………………….…………………. 13
2.5.2.1.3 Type of food ………………………………….………………. 13
2.5.2.2 Oil-content of fried food products………………………….. 13
2.5.2.2.1 The geometrical shape of the food products ………………. 14
2.5.2.2.2 Viscosity of the frying oil…………………………………… 14
2.5.2.2.3 Specific gravity of the food ………………………………… 14
2.5.2.2.4 Type of food ……………………………………………….… 14
2.5.2.2.5 Temperature of the frying medium ………………..…….… 15
2.5.2.2.6 Time of frying ……………………………………….…….… 15
2.5.2.3 Color. ………………………………………………………….. 15
2.5.2.4 Flavor. …………………………………………………………. 16
10
2.5.2.5 Texture……………………………………………………….. 16
2.5.2.6 Yield. …………………………………………………........... 16
2.5.2.7 Nutrition. ……………………………………………………. 16
2.5.3 FRYING OIL QUALITIES……………………………….. 17
2.5.3.1 Hydrolytic alteration. ……………………………………… 17
2.5.3.2 Oxidation alteration. ……………………………………….. 17
2.5.3.3 Thermal alteration. ………………………………….……… 19
2.5.4 FACTORS AFFECTING OIL DEGRADATION……… 20
2.5.4.1 Turnover Rate (T.O)…………………………………………. 20
2.5.4.2 Type of the Frying Process …………………………………. 20
2.5.4.3 Temperature and Frying Time………………………………. 20
2.5.4.4 Intermittent Heating and Cooling…………………………… 20
2.5.4.5 Degree of Unsaturation of Frying Fats / Oils ……………. 21
2.5.4.5.1 Unhydrogenated vegetable oils ………………………….. 21
2.5.4.5.2 Hydrogenation ……………………...…………………….. 21
2.5.4.5.3 Rate of oxidation …………………...…………………….. 21
2.5.4.6 Component of Frying Oil ……………………….………… 22
2.5.4.7 Type of Food Material …………………………………......... 23
2.5.4.8 Design and Maintenance of Fryer ………………………… 23
2.5.4.9 Light …………………………………………………………… 24
2.5.4.10 Use of Filters …………………………………………............. 24
2.5.5 METHOD OF ASSESSING FRYING OIL DEGRADATION.. 24
2.5.5.1 Physical Assessing ……………………………………………. 24
2.5.5.1.1 pH ………………………………………………………………. 24
2.5.5.1.2 Smoke point ……………………………………...……………. 24
2.5.5.1.3 Color …………………………………………..………………. 24

11
2.5.5.1.4 Viscosity ……………………………………..………………. 25
2.5.5.2 Chemical Assessing …………………………………………. 25
2.5.5.2.1 Iodine value (I.V)…………………………….………………. 25
2.5.5.2.2 Saponification value (S.V)……………………………………. 25
2.5.5.2.3 Acid value (A.V)…..……………………………………..…… 25
2.5.5.2.4 Carbonyl value (C.V) …..…………………………………..… 26
2.5.5.2.5 Hydroxyl value (H.V) …..…………………………………..… 26
2.5.5.2.6 Peroxide value (P.V) …..…………………………………..… 26
2.5.5.2.7 Total polar compounds (TPC) …..………………….……..… 26
2.5.5.2.8 Conjugated dienoic acid (CDA)…..………………….……… 26
2.5.6 RECOMMENDATION and REGULATION of FRYING
FATS and OILS in COUNTRIES ……………………….. 27
2.6 PERTINENT RESEARCH ………………………… 27
Chapter Three: Material and Methods ………… 34
3.1 Site of the experiments ……………………………….. 34
3.2 METHODS ……………………………………………. 34
3.2.1 Study design ………………………………………… 34
3.2.2 Questionnaire …………………………………………… 34
3.2.3 Laboratory work……………………………………… 34
3.2.3.1 Samples collection and frying process ………………. 34
3.2.3.2 Sensory evaluation of fried falafel and fish ………… 35
3.2.3.3 Physical analysis for used frying oils ……………….. 35
3.2.3.3.1 Color ………………………………………….. 35
3.2.3.3.2 Viscosity ………………………………………………….. 35
3.2.3.4 Chemical analysis of used frying oils ……………...… 35
3.2.3.4.1 Peroxide value ………………………………………….. 35
3.2.3.4.2 Acid value and Free fatty acid ………………………... 36

12
3.2.3.4.3 Total polar compounds (TPC) measurement ……………... 36
3.2.3.4.4 Determination of Pb, Cd and Cu ions …………………….. 37
3.3 STATISTICAL ANALYSIS …………………………………. 37
Chapter Four: Results and Discussion …………………….. 38
4.1 Questionnaire analysis results ………………………………… 38
4.2 Sensory evaluation of fried falafel and fish …………………. 44
4.3 Changes in physical qualities of CS oil and GN oil when used
for frying fish and falafel ………………………………….. 50
4.3.1 Color ……………………………………………………………… 50
4.3.2 Viscosity ……………………………………………................... 53
4.4 Changes in chemical qualities of CS oil and GN oil when
used for frying fish and falafel.………………………….. 57
4.4.1 Acid value and free fatty acid …………………………… 57
4.4.2 Peroxide value ………………………………………… 63
4.4.3 Total polar compound ………………………………….. 66
4.5 Determination Cu, Cd and Pb in CS oil and GN oil used for
frying Fish and Falafel…………………………… 71
4.5.1 Copper ………………………………………………. 71
4.5.2 Cadmium …………………………………………….. 72
4.5.3 Lead …………………………………………………. 78
Chapter Five: Conclusion and Recommendations 80
5.1 Conclusions ………………………………………….. 80
5.2 Recommendations ……………………………………. 81
REFERENCES ……………………………………………………… 83
APPENDICES ………………………………………………………. 91

13
List of Tables Table Title Page
1a Percentage of Distribution of the Selections for the Questions
(Q1-Q8) in the Questionnaire used for restaurants and home
cooks……………………………………………………. 39
1b Percentage of Distribution of the Selections for the Questions
(Q9-Q15) in the Questionnaire used for restaurants and home
cooks……………………………………………………. 41
1c Percentage of Distribution of the Selections for the Questions
(Q16-Q20) in the Questionnaire used for restaurants and home
cooks…………………………………………………....... 43
4 Lovibond color units (LCU) of groundnut (GN) and cottonseed
(CS) fresh and used frying oils for fish and falafel………. 51
5 Correlation and regression parameters of Lovibond color units of
CS and GN oils used for frying fish and
falafel.…………………………………………………...… 52
6 Viscosity of cottonseed (CS) oil and groundnut (GN) oil used for
frying fish and falafel. …….……………………………….. 55
7 Correlation and regression parameters of viscosity of cottonseed
(CS) oil and groundnut (GN) oil used in frying fish and
falafel.………………………………………………………. 56
8 Acid value (A.V) changes of cottonseed (CS) oil and groundnut
(GN) oil used for frying fish and falafel.………………… 58
9 Free fatty acids (FFAs) changes of cottonseed (CS) oil and
groundnut (GN) oil used for frying fish and falafel.……….. 59
10 Correlation and regression parameters of acid value of cottonseed
(CS) oil and groundnut (GN) oil used for frying fish and falafel…. 60
11 Correlation and regression parameters of free fatty acid of
cottonseed (CS) oil and groundnut (GN) oil used for frying fish
and falafel…………………………………………………………. 61
12 Peroxide value (P.V) of cottonseed (CS) oil and groundnut (GN)
oil used for frying fish and falafel………………………… 64
13 Correlation and regression parameters of peroxide value of
cottonseed (CS) oil and groundnut (GN) oil used for frying fish
and falafel………………………………………………….
65
14 Total polar compounds (TPC) of cottonseed (CS) oil and
groundnut (GN) oil used for frying fish and falafel………….
68

14
15 Correlation and regression parameters of total polar compound of
cottonseed (CS) oil and groundnut (GN) oil used for frying fish
and falafel……………………………………………………. 69
15
List of Figures
Figure Title Page
1 Evaluation percentage of the consumer panelists for falafel fried in
groundnut oil……………………………………….. 45
2 Evaluation percentage of the consumer panelists for falafel fried
in cottonseed oil.…………………………………... 46
3 Evaluation percentage of the consumer panelists for fish fried in
cottonseed oil.………………………………………….. 48
4 Evaluation percentage of the consumer panelists for fish fried in
groundnut oil………………………………………… 49
5 Levels (ppb) of copper, cadmium and lead determined in
cottonseed oil used for frying falafel, for initial frying oil, 5th
, 10th
,
15th
and 20th
frying cycle number……………………… 73
6 Levels (ppb) of copper, cadmium and lead determined in
cottonseed oil used for frying Fish, for initial frying oil, 5th
, 10th
,
15th
and 20th
frying cycle number………………………. 74
7 Levels (ppb) of copper, cadmium and lead determined in groundnut
oil used for frying falafel, for initial frying oil, 5th
, 10th
, 15th
and
20th
frying cycle number…………………………………
76
8 Levels (ppb) of copper, cadmium and lead determined in groundnut
oil used for frying fish, for initial frying oil, 5th
, 10th
, 15th
and 20th
frying cycle number……………………………………….
77

16
List of Appendices
Append. Title Page
A Saturated (SFAs) and unsaturated fatty acid (UFAs) of different
edible oils…………………………………………………….. 91
B Physical and chemicals characteristics of peanut oil………… 92
C Frying oil quality curve………………………………………. 93
D Deep frying schematic picture showing mass transfer and
chemical reactions during the frying process…………………. 94
E Recommendations and regulations of frying fats and oils in
some countries………………………………………………. 95
F Questionnaire applied to restaurants and homes cooks……… 96
G Hedonic Scale a five points used for sensory evaluation of fried
fish and falafel in cottonseed oil and groundnut oil………… 99

17
List of Abbreviations
AAS Atomic Absorption Spectroscopy.
AHA American Heart Association.
AOCS American Oil Chemists Society.
ARS Agricultural Research Service.
AV Acid Value.
BHA Butylated Hydroxyl Anisole.
BHT Butylated Hydroxyl Toluene.
CAC Codex Alimentarius Commission.
CDA Conjugated Dienoic Acid.
Cn Cycle Number.
cP Centipoise.
CS Cottonseed.
CVD Cardio Vascular Disease.
FAS Faculty of Agricultural Sciences.
FAs Fatty Acids.
FFA Free Fatty Acid.
FL Falafel.
GN Groundnut.
H.V Hydroxyl value.
HDL High Density Lipoprotein.
HNE 4-Hydroxy-trans-2-nonenal.
IV Iodine Value.
18
LCU Lovibond Color Units.
LDL Low Density Lipoprotein.
m.p. Melting Point.
MPC Maximum Permissible Concentration.
MUFAs Monounsaturated Fatty Acids.
PTWI Provisional Tolerable Weekly Intake.
PUFAs Polyunsaturated Fatty Acids.
PV Peroxide Value.
RI Refractive Index.
SFAs Saturated Fatty Acids.
SFAs Saturated Fatty Acids.
SFs Saturated Fats.
SPSS Statistical Package for the Social Sciences.
SV Saponification Value.
T.O Turnover rate.
TPC Total Polar Compounds.
UFA Unsaturated Fatty Acid.
USDA United States Dept. of Agric.

19
CHAPTER ONE
INTRODUCTION
Oils and fats are vital components of the human diet. They are important source of
energy and act as carrier of fat-soluble vitamins, etc. Oils and fats are used in various
cooking methods, e.g. frying, and are also used as raw material for food products, e.g.
salads and cooking. Frying is one of the popular cooking methods, because it is fast,
easy and produce unique texture and taste.
However, in most houses and restaurants, and other food preparation facilities,
cooks used oil more than once in frying fish, meat, vegetables, etc. The frying
temperature is usually ca. 180°C, and might extent up to 20 hr.
The fresh oil is expected to have chemical and physical properties, which are approved
by the health and the specifications authorities of the country. Meanwhile, as a
chemical, oil is expected to be affected by heat. Consequently, the latter is expected to
change these properties. Other people are used to add fresh oil to what is left from the
previous frying. Heating and continuous use of oil affects the flavor and taste of fried
food, and some toxic materials, such as polymers, acrylamide and 4-hydroxy-trans-2-
nonenal (HNE) can be formed. HNE is well known highly toxic compound that is
easily absorbed from diet. HNE is highly reactive with protein, nucleic acids (DNA
and RNA) and other biomolecules. HNE is formed from oxidation of linoleic acid, and
reports have related it to several diseases, including atherosclerosis, stroke,
Parkinson's, Huntington's and liver diseases (Esterbauer et al., 1991). In the Sudan, the
Middle East, and most of the African and developing countries, the popular fried foods
are: fried chicken, fried fish, fried potatoes, fried chickpea or faba beans balls (falafel,
it is local Egyptian name), fried plantain, (fried banana)…etc. Chickpeas, faba beans
and other leguminous seeds can be ground and mixed with vegetables, onion and
spices, shaped in balls and fried as falafel, which are quite popular in breakfast and
supper in most Arab countries, especially Sudan and Egypt.
Vegetable-based mono-unsaturated and poly-unsaturated fats are inherently unstable,
especially at high temperature, which are used for cooking foods in homes and
restaurants, where oils are reused more than once. Cooking oil in the Sudan is mainly
cotton-seed oil, groundnuts oil, sunflower oil, maize oil and sesame oil. Some are
imported and others are locally produced either from traditional mills or modern
factories (Oloo, 2010).

20
Most of the environmental pollutants are lipophilic, including pesticides,
intentionally produced compounds, unintentionally produced compounds (e.g.
dioxins/furans), in addition to heavy metals, anthropogenic compounds, municipal and
industrial waste, dyes, etc. The residue analysis studies from the African research and
monitoring institutes and universities emphasized that most of the food is
contaminated with different levels of some or most of these pollutants, especially
Egypt, RSA, Kenya, Nigeria, DRC, Uganda, Tanzania, Zambia, Zimbabwe, the Sudan
and Ethiopia. Fish, especially high lipid-content fish, is expected to accumulate higher
concentrations of these pollutants. Fish consumption in these countries is very high;
especially the fried fish (El-Shahawi et al., 2010).
Plants and animals depend on some metals as micronutrients. Metal elements such as
Na, K, Ca, Mg, Fe, Cu, Zn and Mn, are essential nutrients for human growth.
However, certain forms of some metals can also be toxic, even in relatively small
amounts and, therefore, pose a risk to the health of animals and people. Metal
elements such as Hg, Pb, Cd, Co, and Cu, could also have detrimental effects on
health. While the effects of chronic exposure to trace amounts of some metals are not
well understood, many incidents tell us about the seriousness of high levels of
exposure to some toxic metals, especially Cd, Cr, Co, Ni and pb (Demirbas, 2001;
Buldini et al., 1997 and Garrido et al., 1994). Trace levels of metal ions (Cu, Fe, Mn,
Co, Cr, Pb, Cd, Ni, and Zn) are known to have adverse effect on the oxidative stability
of edible oils. Transition metals such as Cu and Fe catalyze the decomposition of
hydroperoxides and lead to more rapid formation of undesirable substances. The
presence of metals in vegetable oils depends on several factors. They might come from
the soil, environment, genotype of the plant, fertilizers and/or metal-containing
pesticides, introduced during the production process or by contamination from the
metal processing equipment (Jamali et al., 2008; Zeiner et al., 2005).
The present work hypothesizes/suggests that during frying, most/all of these pollutants
will be dissolved and remain in the frying oil, and the heat will even improve the
extractability of the oil. Therefore, the fresh oil will be contaminated during frying. By
time and more frying of new fresh fish or any contaminated product the degree/level
of contamination is expected to increase. Moreover, the uncontaminated food when
fried in this oil will be liable to contamination.
It is also hypothesized that several changes will be working simultaneously:

21
a) Changing the chemical and physical properties of the oil;
b) Contamination of the oil with several types and concentrations of unknown
pollutants and contaminants coming from the fried fish or other foods;
c) Thermal degradation and other types of degradation of these pollutants to
unknown compounds/metabolites/isomers, etc., with unknown concentrations, and
d) Contamination of the fresh food when fried in previously used oil.
The objectives of this study were:
1. To study changes in physical and chemical properties and the qualities of the two
CS oil and GN oil after being used for frying fish and falafel for different periods
of time.
2. To investigate the levels of total polar compounds (TPC) in the oils remaining
after frying at restaurants.
3. To determine the level of pollutants and contaminants (heavy metals namely Cd,
Pb and Cu) in frying oils, after being used for frying fish and falafel for different
periods of time.
4. To study the attitudes and practices used by restaurants and homes during frying
food.
22
CHAPTER TWO
LITERATURE REVIEW
2.1 Fats and Oils
Fats consist of a wide group of compounds that are generally soluble in organic
solvents and generally insoluble in water. Chemically, fats are triglycerides: triesters
of glycerol and any of several fatty acids (FAs). Fats may be either solid or liquid at
room temperature, depending on their structure and composition. Although the
words "oils", "fats", and "lipids" are all used to refer to fats (Casimir and David,
2008). All fats and oils are made up of a combination of three main kinds of fatty
acids; saturated, monounsaturated, and polyunsaturated linoleic or linolenic acid.
These refer to the kind of structure these fatty acids have between their carbon and
hydrogen atoms.
2.1.1 Types of fatty acids (FAs)
2.1.1.1 Saturated fatty acids (SFAs)
The carbon chain in a saturated FA are filled, or saturated, with hydrogen atoms.
This saturation creates a compact and highly stable structure that resist oxidation,
even under high temperatures. Saturated fatty acids are found in animal fats and
tropical oils (Casimir and David, 2008).
2.1.1.2 Monounsaturated fatty acids (MUFAs)
The carbon chain is missing two hydrogen atoms and has one (mono) double bond
between two of its carbons, so it is not saturated (unsaturated) by hydrogen atoms.
MUFAs are not densely packed and bends at the double bond, so these fats are
liquid at room temperature and cannot be exposed to high heat like SFAs. They are
found in olive oil, peanut oil, avocados, and nuts (Casimir and David, 2008).
2.1.1.3 Polyunsaturated fatty acids (PUFAs)
The carbon chain is missing several hydrogen atoms and contains two or more
(poly) double bonds. PUFAs are highly unstable and sensitive to heat and light that
can cause free radicals, which harm our body. Also, polyunsaturated vegetable oils,
especially when heated, damage our cells, metabolic function, gene expression, and
23
hormone functions. PUFAs are found in corn, canola, soy, CS oil, sunflower,
safflower, rice bran, and grape-seed oils...etc. (Casimir and David, 2008).
Polyunsaturated fats can be divided into two categories:
a) Omega 3 FAs are triple unsaturated (3 double bonds) alpha-linolenic acid,
found in both plant and marine foods, although it is the omega-3 fats from
marine sources that have the strongest evidence for health benefits (including
reducing the risk of heart disease). Plant food sources include canola and soy
oils, and canola-based margarines. Marine sources include fish, especially oily
fish, such as Atlantic salmon, mackerel, Southern blue fin tuna and sardines.
b) Omega 6 is a double (2 double bonds) unsaturated linoleic acid, are found
primarily in nuts, seeds and plant oils, such as corn, soy bean, CS, sunflower
and safflower. The high omega – 6, polyunsaturated vegetable oils increase
inflammation in the body and are associated with cardio vascular disease
(CVD), diabetes, obesity, asthma, cancer, auto-immunity diseases, high blood
pressure, infertility and blood clots (Casimir and David, 2008).
2.1.2 Dietary fats and blood cholesterol
Dietary fats are classified by their structure. Different types of fats react differently
inside the body. Saturated fats (SFs) increase blood cholesterol, which is a risk
factor in coronary heart disease. Mono-unsaturated (MUFAs) and polyunsaturated
fats (PUFAs) tend to lower blood cholesterol. There are two types of blood
cholesterol: low density lipoprotein (LDL) cholesterol and high density lipoprotein
(HDL) cholesterol. LDL is considered the ‘bad’ cholesterol, because it contributes to
the narrowing and silting up of the arteries, which can lead to heart disease and
stroke. HDL cholesterol is considered to be the ‘good’ cholesterol, because it
actually carries cholesterol from the blood back to the liver, reducing the risk of
CVD (Richard et al., 2005).
2.2 Recommendation of Fat Intake
WHO, FAO and the American Heart Association (AHA) has recommended that fat
consumption supplied about < 30% of energy requirement /day and ratio of
vegetable fat/oil: animal fat/oil is 3: 1 and ratio of SFA: MUFA: PUFA = <10 : (10 -
15) : <10 for decreasing risk of the chronic disease, i.e. cancer, CVDs. MUFA
24
decreases LDL cholesterol, that causes coronary heart disease, and it increases HDL
cholesterol, which is used in metabolism of cholesterol in cell and blood system
(ARS, 2011).
2.2.1 The Selection of vegetable fat/oil for health
The basic important qualities of the oil selection for good health are; the vegetable
oil doesn't contain cholesterol. Each vegetable oil has different essential FA,
different ratio of SFA: MUFA: PUFA, different content of vitamin E and different
other components. Appendix A shows the percentage of SFA and UFA of different
edible oils. The recommendations of oil selection for health are: The ratio of FA is
nearly ratio of FA recommendation that is SFA: MUFA: PUFA is 28.6 : 42.8 : 28.6
% and there are high essential FAs. Appendix A shows that olive oil is the highest
of MUFA- content, canola oil, groundnut (GN) oil, rice bran oil and palm oil are
high of MUFA- content, respectively. Rice bran oil and CS oil are the ratio of SFA:
MUFA: PUFA is close to recommended ratio (ARS, 2011).
2.3 Frying Oils
The composition of oil is the one of factors that affecting oil degradation that includes
physical and chemical qualities of used frying oil. Two oils in this research represent
different compositions of oil. Peanut oil is monounsaturated fatty acid and cottonseed
oil is polyunsaturated fatty acid.
2.3.1 Cottonseed Oil
CS oil is a cooking oil extracted from the seeds of cotton plant of various species,
mainly G. hirsutum and G. herbaceum. CS oil consists of 70% UFAs (18% MUFAs,
and 52% PUFAs) and 26% SFA (Jones and King, 1996). Crude CS oil has a mild taste
and dark reddish-brown color, because of the presence of highly colored material
extracted from the seed. After processing, it typically has a rich golden yellow color;
the amount of color depending on the amount of refining (Anon., 2010). CS oil has a
relatively high smoke point (232 °C) as a frying medium; also it should be slightly less
viscous by measurement, because of a higher saturation level than other vegetable oils.
CS oil is high in tocopherols, which also contribute its stability giving products that
contain a long shelf life. The temperature range at which CS oil changes from a solid
to a liquid is 10°C to 16 °C. A crude CS oil with a FA- content of 1.8% was found to
have a flash point of 293.3 °C and its iodine values range from 103 to 112. The level
25
of unsaponifiable matter in good-quality CS oil usually ranges from 0.5% to 0.7%. It
may decrease slightly in deodorized oils, due to slight reductions of sterols with alkali
refining and high-temperature deodorization. CS oil saponification values range from
189 to 19, with an average of 195. But, it may contain natural toxins (gossypol) and
unacceptably high levels of pesticide residues, since it is subjected to many
agrichemicals when growing it. The natural toxin, gossypol, is eliminated in the
refining process of commercially edible CS oil and the FAO has documented the lack
of appreciable residues in CS and CS oil (David, 1990). CS oil has many food
applications. As a salad oil, CS oil is used in mayonnaise, salad dressings, sauces, and
marinades. As cooking oil, it is used for frying in both commercial and home cooking.
As a shortening or margarine, CS oil is ideal for baked goods and cake icings. Food
applications have been a major use for CS oil, but it has also been used in soap,
lubricants, sulfonated oil, pharmaceuticals, protective coasting, rubber, as a carrier for
nickel catalysts and, to a lesser degree, in the manufacture of leather, textiles, printing
ink, polishes, synthetic plastics, and resins (David, 1990).
2.3.2 Groundnut/Peanut oil
Groundnut (GN) oil, also known as peanut oil, is a mild tasting vegetable oil derived
from peanuts (Arachis hypogaea L.; Liu et al., 2011). GN oil is used mainly for
edible purposes in the preparation of shortening, margarines, and mayonnaise, as
cooking and frying oil and as a salad oil. GN oil is often used in Middle East
countries for general cooking, and in the case of roasted oil, for added flavor. The
percent of FFA in GN oil varies between 0.02% and 0.6%. Lipase hydrolysis of
triacylglycerols into FFAs and glycerol occurs before germination and during
adverse storage. Consequently, high FFA values indicate poor handling, immaturity,
mold growth, or other factors that lead to triacylglycerol hydrolysis. GN oil has a
high smoke point (226 °C) relative to many other cooking oils, so is commonly used
for frying food. Appendix B summarized the physical and chemical characteristics
of GN oil. According to the USDA (2011) data, 100 g of GN oil contains 17.7 g of
SFA, 48.3 g MUFA, and 33.4 g of PUFA. Its major component FAs are oleic acid
(46.8% as olein), linoleic acid (33.4% as linolenic), and palmitic acid (10.0% as
palmitin).
26
The oil also contains some stearic acid, arachidonic acid, behenic acid, lignoceric
acid and other FAs. Antioxidants, such as vitamin E are sometimes added, to
improve the shelf -life of the oil (Yan-Hwa and Hsia-Fen, 1999). Most highly
refined GN oils remove the peanut allergens and have been shown to be safe for the
vast majority of peanut-allergic individuals. Peanuts, which contain the mold, which
produces highly toxic aflatoxin, can end up contaminating the oil derived from them
(Crevel et al., 2000).
2.4 Frying Food
The important factor that affects used frying oil qualities is food component. The
characters of chickpeas and fish are described below:
2.4.1 Chickpea
The chickpea (Cicer arietinum), also called garbanzo bean, Indian pea, ceci
bean, Bengal gram, Hommes. It is an edible legume of the family Fabaceae,
subfamily Faboideae. Chickpeas are high in protein and one of the earliest
cultivated vegetables; 7,500-yr-old remains have been found in the Middle
East. The plant grows to between 20 and 50 cm high and has small feathery
leaves on either side of the stem. Chickpeas are a type of pulse, with one
seedpod containing two or three peas. It has white flowers with blue, violet
or pink veins. Chickpeas need a subtropical or tropical climate with
>400mm of annual rain. Chickpeas are grown in the Mediterranean, western
Asia, the Indian subcontinent and Australia (Duke, 1981). Mature chickpeas
can be cooked and eaten cold in salads, cooked in stews, ground into a flour
called gram flour, ground and shaped in balls and fried as falafel, fermented
to make an alcoholic drink (Hulse, 1991).
Chickpeas are a good source of zinc, folate (vit. B9) and protein. They are also
very high in dietary fiber and, hence, a healthy source of carbohydrates for persons
with insulin sensitivity or diabetes. Chickpeas are low in fat and most of this is
polyunsaturated. One hundred g of mature boiled chickpeas contains 164 calories,
2.6 g of fat (of which only 0.27 g is saturated), 7.6 g of dietary fiber and 8.9 g of
protein. Chickpeas also provide dietary calcium (49–53 mg/100 g), with some
sources citing the garbanzo's calcium-content as about the same as yoghurt and close
to milk (Huisman and Van der Poel, 1994; Hulse, 1991).
27
2.4.2 Fish
Fish is a sea food consumed by many species, including humans. The word "fish"
refers to both the animal and to the food prepared from it (Kris et al., 2002).
2.4.2.1 Nutritional value
Fish provides a good source of high quality protein and contains many
vitamins and minerals. Fish may be classified as either whitefish, oily or
shellfish. Whitefish, such as haddock and seer, contain very little fat (< 1%)
whereas oily fish, such as sardines, contain between 10-25%. The latter, as a
result of its high fat content, contain a range of fat-soluble vitamins (A, D, E
and K) and essential FAs, all of which are vital for the healthy functioning
of the body (Fellows and Hampton, 1992).
2.4.2.2 Health benefits
Research over the past few decades has shown that the nutrients and
minerals in fish, and particularly the omega 3 FAs, are heart-friendly and
can make improvements in brain development and reproduction. This has
highlighted the role for fish in the functionality of the human body
(Mozaffarian and Rimm, 2006)
2.4.2.3 Health hazards
Environmental chemical contaminants and pesticides in fish pose a potential human
health hazard. Fish can be harvested from waters that are contaminated by varying
amounts of industrial chemicals, including heavy metals, pesticides, persistent
organic pollutants (POPs), persistent toxic substances (PTSs) and others. These
contaminants may accumulate in fish at levels that can cause human health problems
(e.g., carcinogenic and mutagenic effects, endocrine disruptors, kidney failure,
miscarriages, etc.). The hazard is most commonly associated with exposure over a
prolonged period of time (chronic exposure). Illnesses related to acute exposure (one
meal) are very rare. If fish and shellfish inhabit polluted waters, they can accumulate
other toxic chemicals, particularly persistent organic pollutants (POPs), fat-soluble
pollutants containing chlorine or bromine, dioxins, furans or polychlorinated
28
biphenyls ( PCBs), polyaromatic hydrocarbon (PAH) (Mozaffarian and Rimm, 2006,
and Bashir, personal communication).
2.4.2.4 Fish consumption patterns
Fish consumption patterns in many African countries show relatively higher
levels in the coastal countries than in the hinterland. The average annual
fish consumption in the West African coastal region for example is approx.
20 kg /capita. In the Sahel countries of Sudan, Chad and Mali, per capita
fish consumption is low, ranging from 2 to 9 kg /annum. In these countries
the main source of animal protein is meat, due to the large number of herds
of cattle in these countries.
Fish consumption is generally low in the Sudan. However, consumers have
a high preference for fresh fish, especially in the cities and urban area,
which are accessible to fresh fish supply. About 70 % of the total fish
supply is consumed in the fresh or frozen form. Fried fish is not consumed
at any appreciable level, except in the cities where it is readily available
(Watanabe, 1982).The predominant cured fishery product widely produced
and consumed in northern Sudan is the salted fish, fessiekh, a fermented
fishery product. It is used as both a staple food and a condiment in food
preparation. Terkeen is a fermented fish paste which is a delicacy among the
people of northern Sudan around lake Nuba/Nasir. It is mainly used as a
condiment in traditional vegetable sauces. Hard dried fermented fish
(kejeick) is popular as food fish for Sudanese farm-workers involved in
agricultural rainfed projects or working on farm plantations, especially in
southern Sudan (Youssif, 1988).
2.5 Frying
Frying is a cooking process with which wate-containing foodstuff is immersed into
edible oils or fats at temperatures between 140 -190 °C. to change the food's
character. This process includes two transfer forms, i.e. mass transfer and heat
transfer.
29
a) Mass transfer
Inside a frying (dehydrating) food, water migrates from the central portion radially
outward to the walls and edges to replace what is lost by dehydration of the exterior
surfaces and oil is absorbed into the food (Blumenthall, 1991).
b) Heat transfer
Water plays a number of roles in transferring heat into the food. First, it carries
energy from the hot frying oil surrounding the frying food. This removal of energy
from the food's surface prevents charring or burning caused by excessive
dehydration. The water changes from liquid to steam as the water leaves the food,
carrying off a bulk of the contacting oil's energy. As long as the water still
evaporates, the food will not char or burn. Although the temperature of the oil may
be over 180°C but the temperature of the frying food is only about 100°C, which
represents the temperature of the change in phase from water to steam. Subsurface
water also conducts heat energy from the surface contacted by hot frying oil to the
interior (Water is a better heat conductor than the fat, protein, and carbohydrate
portion of food).
The final function of cooking is gelatinizing of starchy inside the frying food.
Sufficient heat (thermal energy) must be transferred to bound water. Then, the starch
will be swelling to form the starch gel. If heat is not enough, the interior structure of
starch would be collapsed. Then, food would be overcooked or fried in badly abused
oil (Blumenthall, 1991).
2.5.1 Changes in frying food qualities and frying oils qualities
The quality of the oil as a frying medium and the quality of the food processed in it
are intimately bound. Appendix C shows the five stages of oil and relates them to
food quality, as described below (Blumenthall, 1991).
2.5.1.1 Break-in oil
This is beginning of heated oil. Food is white-colored, raw, un-gelatinized starch at
the center, no cooked odor, no crisping of the surface, and little oil absorbed by the
food.
2.5.1.2 Fresh oil
Slight browning at the edges of the product; partially cooked (gelatinized) centers,
crisping of the surface, and slightly more oil absorption.
30
2.5.1.3 Optimum oil
Golden-brown color, crisp, rigid surfaces, delicious food and oil odors, fully cooked
centers (rigid and ringing gel) and optimal oil absorption.
2.5.1.4 Degrading oil
Darkened and/or spotty surfaces, excess oil pickup, product is moving toward
limpness, and case-hardened surfaces.
2.5.1.5 Runaway oil
Dark, case-hardened surfaces, excessively oily product, surfaces collapsing inward,
centers not fully cooked, and off-odor and off -flavors (burned) (Blumenthall, 1991).
2.5.2 Fried food qualities
High temperature, oxygen, moisture and component of food involve in frying
system. This system can change four principal qualities in foods are:
- Appearance, including color, shape, gloss, etc.
-Flavor, including taste and odor.
-Texture.
-Nutrition.
Appearance, flavor, and texture refer to sensory acceptability but not nutrition. In
general, the frying industry controls product qualities by product appearance and
flavor. These quality characteristics can be determined by measuring the related
product properties which include moisture content, color, oil content, flavor, texture,
yield, nutrition and shelf-life stability. These quality characteristics were changed
when food is fried (Moreira et al., 1999) as follow:
2.5.2.1 Moisture content.
When food is placed in hot oil, the surface temperature rises rapidly and water is
vaporized as steam. The plane of evaporation moves inside the food, and a crust is
formed. The surface temperature of the food then rises due to the hot oil, and the
internal temperature rises more slowly towards 100°C. The rate of heat transfer is
controlled by the temperature difference between the oil and the food and by the
surface heat transfer coefficient. The rate of heat penetration into the food is
controlled by the thermal conductivity of the food (Fellow, 2000).
31
The factors of moisture content in frying process are:
2.5.2.1.1 Temperature
Temperature of deep frying process affects the moisture content of food. In deep
frying with high temperature, moisture content of food is decreased more than deep
frying with low temperature.
Velez-Ruiz, et al. (2002) studied the effect of temperature on the physical properties
of chicken strips during deep-fat frying by using chicken slabs (10.0 x l.0 x 0.5 cm)
with sunflower oil at several temperatures 130, 140 and 150 °C. Moisture content
was determined during the whole experiment. This study revealed that the
evaporation rate was high during the first 3 minutes of frying and after 5 minutes of
frying. Moisture content of chicken strips which deep-fat fried with sunflower oil at
temperature 130, 140 and 150 °C were 45-50%, 35-40% and 25-30%, respectively.
2.5.2.1.2 Time
Studies have been performed by several researchers to predict texture of fried
products e.g. French fries and tortilla chips, (Fan, et al., 1997). In general, a fried
product becomes tougher as frying time increases up to an optimum value after
which the product becomes brittle. Mass transfer during frying consists of moisture
loss and oil absorption. Moisture loss during frying generally decreases exponentially
with frying time.
2.5.2.1.3 Type of food
The textural properties, porosity, size, orientation of capillary spaces, and component
of food, etc. are all different from one food to another. This makes the oil penetration
characteristically different from one kind of food to another, effect to heat transfer of
food and their moisture content (Paul and Mittal, 1997).
2.5.2.2 Oil- content of fried food products
According to Moreira et al., 1999, oil- content is one of the most important qualities
attributors of fried product. The oil content of fried food starts in the fresh oil phase
in which oil transfer occurs. Once the diffused water escapes into the oil through the
capillaries, the hot oil starts entering into the same open pores and capillaries. The
rate of entry of oil into the food is a function of the viscosity and the surface tension
of the oil.
Varela et al., (1988) reported about the frying of potatoes in olive oil that the fat
penetration starts only after about 60% of the moisture content evaporated. So the hot
32
oil effect on interior of the food for a short time, and the time of contact of oil with
food surface is 10% of the total frying time process, when the frying is done with the
fresh oil. Composition of food material is another factor of fat absorption. If that
food has initial high fat, it does not absorb oil when it is cooked but the fat of food
material moves into the hot oil. The important factors affecting oil penetration into
the food products are explained below.
2.5.2.2.1 The geometrical shape of the food products.
The geometrical shape is the ratio of surface area of the product to its volume played
an important role in the oil penetration. For example, the French fried potato
contained only 13.5% oil on an average, whereas the fried potato chip contained
about 40% oil, because the surface area of potato chip was 10 to 15 times greater
than that of the French fried potato for the same volume (Moreira et al., 1999).
2.5.2.2.2 Viscosity of the frying oil.
Viscosity of the frying oil is an important factor determining the total volume of oil
sticking to the large cavities in the crust of the food product. Higher viscosity
provided a larger volume of oil on the fried food. Potatoes absorbed about 8.5% of
the oil when fried in fresh oil, and it increased to 15% in degraded oil due to increase
in viscosity (Varela et al., 1988).
2.5.2.2.3 Specific gravity of the food.
Generally, the oil absorption decrease as the specific gravity of the food increases.
An increase in specific gravity of the food generally means an increase in the
moisture content. Higher moisture content produces larger quantity of steam, which
reduces the oil-to-food contact time (Paul and Mittal, 1997).
2.5.2.2.4 Type of food.
The textural properties, porosity, Size, and orientation of capillary spaces, etc. are all
different from one food to another. This makes the oil penetration characteristically
different from food to food. The food that is rough surface, porosity and the big size
absorbed oil more than another. Whereas composition of food is affecting oil
penetration i.e. increases fat or sugar in doughnut, it is high oil penetration (Moreira
et al., 1999).
33
2.5.2.2.5 Temperature of the frying medium.
Temperature of the frying medium affects oil penetration. If frying temperature of oil is low,
it takes long time to produce the golden-brown color of food product. Since food will absorb
more oil.
Varela et al. (1988) reported that the frying oil temperature in the range of 150-
180°C has no significant effect on oil absorption by foods. Oil absorption decreases
with a higher frying oil temperature of 180-200 °C because in the high temperature,
the composition of food changes to solid material or the surface forms into crust
which prevents oil penetration. However, this temperature range is unusual for food
frying (Guillaumin, 1988).
Bouchon et al., (2003) analyzed the oil-absorption process in deep-fat fried potato
cylinders (frying temperatures of 155, 170 and 185°C). This Study allowed to
distinguish three oil fractions: structural oil (absorbed during frying), penetrated
surface oil (suctioned during cooling), and surface oil. The result showed that a small
amount of oil penetrates during frying because most of the oil was picked up at the
end of the process, suggesting that oil uptake and water removal are not synchronous
phenomena. After cooling, oil was located either on the surface of the chip or sucked
into the porous crust-microstructure, with an inverse relationship between them for
increasing frying times.
2.5.2.2.6 Time of frying.
The oil absorption by the food increases with longer duration of frying (Guillaumin,
1988).
2.5.2.3 Color.
Color is among the major factors influencing consumer acceptability of a fried
product. It can indicate high-quality product and can also influence flavor
recognition such as the golden yellow of the potato chip that is reaction by Browning
and MiIlard reaction of food component. Factors affect color of fried products are
type of frying oil, used - time frying oil, oil temperature, food dimensions and food
sizing, food type, times of frying oil and component of food.
These factors give different level of color to fried food. Panel evaluation and
comparison to standards is the most common approach for determining color
consistencies or differences in fried food in the food industry as Munsell system
(Bennet, 2001 and Moreira et al., 1999).
34
2.5.2.4 Flavor.
Flavor also plays an important role to the food processor interested in flavor stability
of fried product during storage. It comprises of taste and odor. Taste defined as the
response of receptors in the oral cavity to chemical stimuli. Odor plays the dominant
role in the flavor sensation. Under normal conditions, only volatile chemicals can
reach the olfactory epithelium, and the sense of the taste is used to detect nonvolatile
chemicals (Moreira et al., 1999).
2.5.2.5 Texture
Texture is the change of protein, fat and carbohydrate of food. It is a very important
quality characteristic of fried product. An important texture characteristic for fried
food is crispness. Crispness denotes freshness and high quality. A crisp food should
be firm and snap easily when deformed, emitting crunchy sound (Moreira et al.,
1999).
2.5.2.6 Yield.
The yield of fried products depends on water loss or moisture transfer of food during
frying process. Result of loss from frying, due to water loss, which more than offsets
the weight of oil absorbed. However, factors of yield are quality of material and
processing operation (Moreira et al., 1999).
2.5.2.7 Nutrition.
Nutrition of fried product depends on processing operation and frying oil. When
frying at high temperature, food is fast crust formation and closed surface of food so
change of food is increase. So by controlling frying temperature can decrease
changes and keep nutrition of food in fried product.
These are samples of fried food and the effect of nutrition:
-Fried fish loss 15% lysine and loss 22% lysine when fried fish with fresh and used
frying oil, respectively.
- Loss of vitamin C in fried product is less than boiled product because at low water
content, vitamin C is in de-hydro-ascorbic acid form, but when food boiling, vitamin
C is hydrolyzed to 2,3-di-ketogloconic acid.
-Quality of protein in fried product changes due to Millard reaction, which causes
decrease of lysine, digestibility, nitrogen retention, protein efficiency ratio and
biological value (Casimir and David, 2008).

35
2.5.3 Frying oil qualities
According to Paul and Mittal, 1997, fats and oils are mixtures of triglycerides. About
96 to 99% of the fresh frying oil is triglycerides. During frying, the frying oil is
exposed to temperatures of 160 to 180 °C in the presence of air and moisture. As a
result hundreds of complex chemical reactions take place in the oil and it gets
chemically altered during frying. More than 400 different chemical compounds have
been identified in deteriorated frying oils. The products can generally be divided into
two groups which are volatile and non-volatile products. A portion of the volatile
product escapes into the atmosphere with steam, while the rest remains in the oil and
may undergo further alterations or get consumed by the fried food. Some of volatile
compounds contribute to the flavor of the fried food products. About 220 volatile
products have been identified. The non-volatile products remain in the oil. They are
responsible for the changes in the physical properties and the various analytical
indices of the oil. The frying oil in the presence of oxygen, moisture, and heat
undergoes mainly three different types of alterations. They are hydrolytic alteration
caused by heat.
Lists of chemical compounds formed in the oil, and the principal pathways of their
formation are below:
2.5.3.1 Hydrolytic alteration.
During frying, a considerable amount of moisture from the food products escapes
into the frying oil as steam. At elevated frying temperatures in the range 160 to
200°C, this steam reacts with triglycerides to form FFAs, mono-glycerides, di-
glycerides and glycerol.
2.5.3.2 Oxidation alteration.
Due to high temperature in frying, the atmospheric oxygen reacts with the oil at the
oil surface, causing oxidative alterations. Appendix D shows a schematic diagram of
oxidative alterations. Oxidation produces hydroperoxides that can further undergo
three major types of degradation reactions.
The first is the fission, which produces alcohols, aldehydes, acids and
hydrocarbon.
The second is the dehydration, which produces ketones.

36
The third is the free radical formation, which produces oxidized monomer,
oxidative dimers and polymers, trimers, epoxides, alcohols, hydrocarbons,
non-polar dimmers and polymers.
Most of decomposition products are formed by the free radical chain reactions. The
rate of these reactions increases with higher concentrations of oxygen and free
radicals. Only a small amount of oxygen is introduced into the oil at low
concentrations of surfactants. As the interfacial tension is high at low concentrations
of surfactants, the steam bubbles readily break and form a blanket of steam over the
oil surface, reducing the contact of atmospheric oxygen with the oil. At moderate
surfactant concentrations, oxygenation forms a number of chemicals. They include
oxidized FAs, which produce good heat transfer properties in the oil and desirable
volatile compounds. However, at high concentrations of surfactant materials, oil
dynamics and kinetics are forced to form short-chain FAs, because of the high
availability of oxygen. Flammable ketones and ethers are formed at this stage.
Polymer deposition onto the fryer walls can also be observed at this stage. However,
the rate of oxidation is depending on degree of UFAs of oil, temperature, lighting
and metal in system, e.g. copper (Moreira et al., 1999).
4-hydroxy-2-nonenal (4-HNE / HNE), (C9H16O2), is an α,β-unsaturated
hydroxyalkenal which is produced by lipid peroxidation in cells.4-HNE has 3
reactive groups: an aldehyde, a double-bond at carbon 2, and a hydroxy group at
carbon 4.It is found throughout animal tissues, and in higher quantities during
oxidative stress due to the increase in the lipid peroxidation chain reaction, due to
the increase in stress events. HNE is generated in the oxidation of lipids containing
polyunsaturated omega-6 acyl groups, such as arachidonic or linoleic groups, and of
the corresponding fatty acids. The first characterization of HNE was reported by
Esterbauer et al., (1991). This compound can be produced in cells and tissues of
living organisms or in foods during processing or storage, and from these latter can
be absorbed through the diet (Guillén et al., 2005 and Zanardi and Jagersma, 2002).
4-hydroxy-2-nonenal (4-HNE / HNE)

37
Since 1991 HNE are receiving a great deal of attention because it considered as
possible causal agents of numerous diseases, such as chronic inflammation,
neurodegenerative diseases, adult respiratory distress syndrome, atherogenesis,
diabetes and different types of cancer (Zarkovic, 2003). There seems to be a dual
influence of HNE on the health of cells: lower intracellular concentrations (around
0.1-5 micromolar) seem to be beneficial to cells, promoting proliferation, while
higher concentrations (around 10-20 micromolar) have been shown to trigger well-
known toxic pathways such as the induction of caspase enzymes, the laddering of
genomic DNA, the release of cytochrome c from mitochondria, with the eventual
outcome of cell death (through both apoptosis and necrosis, depending on
concentrate-ion).
There are small group of enzymes which are specifically suited to the detoxication
and removal of HNE from cells. Within this group are the glutathione S-transferases
(GSTs), e.g. hGSTA4-4 and hGST5.8, aldose reductase, and aldehyde
dehydrogenase. These enzymes have low Km values for HNE catalysis and together
are very efficient at controlling the intracellular concentration, up to a critical
threshold amount, at which these enzymes are overwhelmed and cell death is
inevitable (Chen et al., 2008).
2.5.3.3 Thermal alteration
Thermal alteration takes place because of heat and results in the formation of cyclic
monomers, dimers and polymers through polymerization. The mechanism of
thermal polymerization is very complex and not completely understood. Large
polymer molecules are formed by C-to-C and /or C-to-O to-C bridges among several
FAs. Cyclic monomers that are potentially harmful originate from the intra-
molecular cyclization of C18 PUFAs. The most of cyclic acids are formed due to the
carbonization of oil at the heating coil surfaces, which are maintained at high
temperature. Usually, a higher amount of cyclic monomers are formed in oils with a
higher content of linolenic acid. Dimers are formed in the first step of
polymerization. With further polymerization, molecules of high molecule weights
are formed. Appendix D summarizes the principal path ways and major products of
oil due to thermal alteration (Paul and Mittal, 1997).
38
According to Orthoefer and Cooper, 1996, these reactions cause changes in physical
and chemical qualities of frying oil which can indicate change in properties of oil:
Viscosity is high. Volatile material is high. Polarity is high. FFAs is high. Color is
dark. Iodine value (I.V.) is low. Reflective Index (RI) is high. Surface tension is low.
Smoke point is low. Peroxide value is high and carbonyl value is high.
2.5.4 Factors affecting oil degradation
In addition, there are various factors that influence the degradation of frying oils. The
most important factors as described by Paul and Mittal (1997):
2.5.4.1 Turnover rate (T.O)
The turnover rate is probably the most important factor in maintaining oil quality. It
is the ratio of total oil in the fryer to the rate of fresh oil added. The replenishment is
to compensate for the oil absorbed by food products. A daily turnover of 15 to 25%
by mass is recommended. The higher turnover rate keeps the oil a better quality.
2.5.4.2 Type of the frying process
In large scale, continuous commercial frying operations, the quality of the oil is
usually better as the T.O. period may be as low as 12 hr. Continuous fryers allow
only a very minimal oil to air contact, reducing oxidation (Orthoefer and Cooper,
1996).
2.5.4.3 Temperature and frying time
Higher temperatures accelerate the oxidative and thermal alteration; especially over
200°C. Higher temperatures also increase the rate of formation of decomposition
products as well as their degree of alteration. The excess energy provided to the oil
forms chemical cross-links causing polymer formation in the oil. Frying time is
another factor accelerates the formation of products which affect oil degradation
(Orthoefer and Cooper, 1996).
2.5.4.4 Intermittent heating and cooling
When the oil cools down from the normal temperatures of frying, the solubility of
oxygen in the oil increases. This accelerates oxidation reactions and hence the
production of peroxides. When the oil is again heated the peroxides that are highly
unstable at higher temperatures readily undergo decomposition, giving most of the
decomposition products. Thus, production of peroxides and their decomposition is
repeated with each cycle of heating and cooling. So, intermittent heating and cooling
of oils is much more destructive than continuous heating (Paul and Mittal, 1997).
39
2.5.4.5 Degree of unsaturation of frying fats / oils
A wide variety of fats / oils are used for frying operations. They can be of vegetable
or animal origin or blends of both. Degree of unsaturation is an important factor that
influences the characteristics of any frying oil. Some of the important aspects are
described below.
2.5.4.5.1 Unhydrogenated vegetable oils
Unhydrogenated vegetable oils have high contents of PUFAs and UFAs. So, they
are more susceptible to oxidative alteration. They soon become rancid at room
temperature. This makes them inferior for frying operations with low turnover
periods and food that needs longer shelf life. Hydrogenation of oils is a practical
solution to this problem.
2.5.4.5.2 Hydrogenation
Hydrogenation makes the oils solid at room temperature, more resistance to
oxidative changes and hence frying foods of longer shelf life. However, the melting
point (m.p.) of the oil varies directly with the degree of hydrogenation. The higher
the degree of hydrogenation, the higher is the m.p. In fast food restaurants, food
products are consumed at or slightly above the room temperature. Therefore, oils of
lower m.p.s offer a better mouth feel, as they melt faster at body temperature.
2.5.4.5.3 Rate of oxidation
Rate of oxidation is roughly proportional to the degree of unsaturation of the fatty
acids present in the frying oil. So linolenic acid that has three double bonds is more
susceptible for oxidation than oleic acid that has only one double bond. Canola,
soybean oil, etc. contain higher proportions of linolenic acid. This is one of the
reasons why canola and soybean oils are not considered to be satisfactory for frying.
This problem can be resolved by: Partial hydrogenation, which reduces the linolenic
acid content. Mixed oils which had SFAs such as palm olein, palm kernel olein, that
reduces the double bond of FA content. Addition of antioxidant ( Orthoefer and
Cooper, 1996).
Goburdhum and Jhurree, (1995) studied effect of deep-fat frying on fat oxidation in
soybean oil. The frying performance and stability of pure soybean oil (PSBO),
soybean oil blended with palm kernel olein and pure soybean oil with an antioxidant
mixture of butylated hydroxyl toluene (BHT), butylated hydroxyl anisole (BHA),
propyl gallate and citric acid were compared. The oils were subjected to intermittent
40
frying (up to 15 frying, without any "topping up") of potato slices, at 180 °C for a
period of 337 minutes. Analytical determinations on the oils included the peroxide
value (PV), iodine value (IV), free fatty acid (FFA) value, saponification value (SV)
and the refractive index (RI). Changes in the product at the sensory level were also
assessed. The results showed that: Fat oxidation hence, reduction of unsaturated
fatty acids, as indicated by changes in the IV was non-significant in the treated oils.
Hydrolysis of fats, as shown by changes in the FFA value from the first to last
frying, was lowest in the blended oil but highest in pure soybean oil. The same trend
as above was observed for PV, an indicator of fat oxidation and rancidity. Changes
in SV were non-significant in the treated soybean oil while PSBO with the
antioxidant showed the least change in RI. Treated oils exhibited no visual increase
in viscosity or turbidity. Pure soybean oil with the antioxidant had the lightest color
at the end of the frying period. Taste panelists were unable to discriminate between
products fried in the treated oils and in PSBO. Sensory assessment showed an
improved quality of the chips fried in the blend. Chips fried in PSBO scored the
lowest rating. Thus, the overall results showed an improved behavior and quality of
the treated oils in terms of thermal stability during frying. When the oils have a high
degree of unsaturation, they show a greater tendency to form polymeric products
rather than highly polar materials. Animal-based fats have lesser UFAs and hence
high resistance to oxidative alterations. However, most of the fast food restaurants
are avoiding the use of animal- based fats due to the potential health concerns
caused by the cholesterols present in them. Blends of animal-based fats and plant-
based oils are good economical substitutes for all-vegetable- or all animal-based
shortenings. They are resistant to oxidative alterations and hence suitable for high or
low T.O rates processes. The shelf-life of fried foods is also longer.
2.5.4.6 Component of frying oil
Component of frying oil are types of FAs and FAs- content in oil. It is different
according to type of the oil and influences the physical and chemical qualities of oil.
Waner and Gupta (2005) studied frying quality and stability of low-and ultra-low-
linolenic acid soybean oils. Tests were conducted with 2% (low) linolenic acid
soybean oil and 0.8% (ultra-low) linolenic acid soybean oil, in comparison with CS
oil. Potato chips were fried in the oils for a total of 25 hr of oil use. The results
showed that FFAs and polar compounds of CS oil were higher than in the low-and
ultra-low-linolenic acid soybean oils.
41
2.5.4.7 Type of food material
The contaminants from the food leaching into the oil affect the oil quality. So, the
composition of food plays an important role in deciding the useful life of oil. This is
described follows: The higher the moisture content of the food, the higher is the
moisture transfer and hence hydrolysis. Leaching of lecithin from food materials
containing high levels of egg solids can cause early foaming. Food products of
strong odors e.g. fish, onions, etc. develop objectionable odors, reducing the useful
life of the oil. Particles of food materials, as well as particles from breaded or
battered food surface coatings, contaminate the frying oil in fairly large quantities.
These particles remain in the frying oil until they are caramelized and finally
become charred to fine suspending particles of black carbon. This is an important
factor contributing to the darkening of the oil. Routine filtering is helpful in
removing these particles. When food is heated, food with high sugar content is
subjected to browning reaction. It’s effect to color oil and reducing the useful life of
the oil (Paul and Mittal, 1997).
2.5.4.8 Design and maintenance of fryer
Selection and maintenance of fryers play an important role in oil
quality/degradation. The optimum fryer temperature should be maintained
throughout the frying operation. Heat balance of the fryer is inherent with the fryer
design. So, the overloading of the fryer should be avoided. The general tendency of
the operator is to increase the temperature to compensate for the overload. This
results in a much faster rate of oil degradation. The products are of low quality with
overcooked exterior and undercooked interior. An adverse effect of temperature on
oil degradation is intense at temperatures over 200 °C. On the other hand, if the
temperature is too low the product is greasy due to excess oil absorption and soggy
due to inadequate loss of moisture. The optimum temperature from the oil stability
point of view is the lowest possible temperature that gives products of optimum
quality. Fryers, which has low surface-to-volume ratios minimizes air-to-oil contact
at the surface. This reduces the oxidative degradation. Fryers should be designed
with large heating areas. This enables faster and more uniform heating of the oil.
Regular cleaning increases the useful life of the oil such as erase the polymer
deposition on the fryer form to gum which are responsible of foaming and

42
darkening. When cleaning, with soap and detergents should be completely removed
because they catalyze the oil degradation.
2.5.4.9 Light
Light, especially that with ultraviolet rays can cause photo-oxidative breakdown of
the oil, leading to small amounts of compound. A number of volatile compounds are
believed to form as a result of photo-oxidation. So, the frying oils should not be
exposed to direct sunlight, which contains considerable amount of ultraviolet rays.
2.5.4.10 Use of filters
If filters used regularly, they can improve the quality and increase the useful life of
the frying oil to a certain extent. Filtering materials can be broadly classified into
antioxidants: active and passive filters. However, most of the commercially
produced filter media use a combination of materials from all of these classes.
2.5.5 Method of Assessing Frying Oil Degradation
2.5.5.1 Physical assessing
2.5.5.1.1 PH
Non-aqueous pH is indicator to measure the changes in pH of the frying oil. pH of
the fresh oil is approximately 3 and that of the highly degraded oil was ≥ 6.5. Both
alkaline contaminant materials and free fatty acids forming in the oil influence the
pH. The pH is only an indication of the relative balance between the alkaline and the
acidic products. It is not a quantitative measure or neither alkaline products nor
acidic products. Moreover, chemical method of analysis is needed to measure the
pH, as the oil is immiscible with aqueous pH indicators. Therefore, the measurement
of pH is not considered very useful to represent the total oil ( Moreira et al., 1999).
2.5.5.1.2 Smoke point
The smoke point of oil decreases with frying time, because of an increase in low
molecular weight (MW) compounds, mainly FFAs. The smoke point is not easily
determined in a foodservice environment (Moreira et al., 1999)
2.5.5.1.3 Color
Change in color of oils during frying is a complex process where components of oils,
such as pigments in fried food are involved. This is the main cause of darkening of
oil with frying time (Przybylski, 2001). Only color of oil is not adequate to determine
the acceptability of frying oils. Different frying oils and foods being fried in these
oils will darken the oil at different rates.

43
2.5.5.1.4 Viscosity
Viscosity of the oil changes considerably with frying time and oil temperature. It
increases with the increase in oil degradation. The increase in viscosity is due to
formation of high molecular weight compounds in oils such as polymer.
Viscosity is determined by various types of viscometers or simply by timed flow
through an orifice. The viscosity is dependent on temperature. Measurements must
be made at a standardized temperature (Moreira et al., 1999).
2.5.5.2 Chemical Assessing
2.5.5.2.1 Iodine value (I.V)
The I.V is a measure of the unsaturation of oils. It is expressed in terms of the
number of grams of iodine absorbed by 100 g of the oil sample. The I.V decreases
with increase in oil degradation. I.V is applicable only to oils that do not contain
conjugated double bonds. Iodine value also is inadequate to represent the heat abuse
taking place, as well as the overall quality of the degrading oils. The I.V of olive oil,
oxidized olive oil, Lard, oxidized Lard, CS oil and oxidized CS oil as follows, 83.8,
77.3, 73.3, 56.2, 105.2 and 90.2, respectively (Moreira et al., 1999).
2.5.5.2.2 Saponification value (S.V)
The saponification value (S.V) is the amount of alkali necessary to saponify a
definite quantity of oil. It is expressed as the number of milligrams of potassium
hydroxide (KOH) required to saponifying one g of oil sample. The S.V, which is an
indication of surfactants forming in the oil, increase with the increase in oil
degradation. However, the surfactants constitute only a small portion of the total
decomposition products. Hence, the S.V is inadequate to represent the total changes
taking place in the degrading oil (Moreira et al., 1999).
2.5.5.2.3 Acid value (A.V)
The acid value (A.V) is the number of mg of KOH necessary to neutralize the free
acids in one g of sample. The A.V indicated amount of triglyceride in oil. The A.V
increases from FFAs, which develops from both hydrolysis and oxidation.
Therefore, the A.V increases with increase in oil degradation (Moreira et al., 1999;
Orthoefer and Cooper, 1996).
44
2.5.5.2.4 Carbonyl value
The carbonyl value (C.V) is the mg of carbonyl (-CO-) compounds contained in one
g of oil. Determination of C.V is one of the effective methods to estimate the
compounds containing carbonyl groups, such as aldehydes, esters and ketones. C.V
gives a measure of only a portion of the total oxidative products formed. Therefore,
it is considered less helpful in representing the total degraded compounds, which are
taking place in the oil (Moreira et al., 1999).
2.5.5.2.5 Hydroxyl value (H.V)
Hydroxyl value (H.V) is a measure of OH-content of the oil. It is the mg of KOH
equivalent to the OH-content in one g of oil. The H.V increases with increase in
hydrolysis. It is a good measure of hydrolytic taking place in the oil. However, it is
not a good measure of oxidative or thermal and, hence, not suitable to represent the
total of degraded compounds (Orthoefer and Cooper, 1996)..
2.5.5.2.6 Peroxide value (P.V)
The peroxide value (P.V) is a measure of oxidative abuse of the oil. The P.V is
expressed in terms of milliequivalents (meq) of peroxide per 1000 g of sample,
which oxidize potassium iodide (KI) under the conditions of the test. The P.V
increases with increase in oil temperature and moisture. The P.V is not a good
measure of heat abuse in frying oil as the P.V are unstable under high temperatures
of frying. Peroxides usually undergo further reactions even at lower temperatures.
The P.V of the oil sample may increase due to cooling, once it is taken out of the
fryer (Orthoefer and Cooper, 1996).
2.5.5.2.7 Total polar compounds (TPC)
Total polar compounds (TPC) are determined by dissolving 2.5 g oil in a petroleum
ether / diethyl ether (87: 13) mixture. The sample is eluted on a silica gel column,
where polar compounds are absorbed on the silica gel. After evaporation of the
elution solvents, the nonpolar material is weighed, and TPC is determined by
difference. In some countries, a level of 25-27% total polar material is the upper
limit for frying oil (Moreira et al., 1999; Orthoefer and Cooper, 1996).
2.5.5.2.8 Conjugated dienoic acid (CDA)
Conjugated dienoic acid occurs when PUFAs are oxidized. One of the double
bonds shifts to form the conjugated dienoic acid. This produces the diene
conjugation of unsaturated linkages present, which can be measured by UV-
absorption at 232 nm. This value is expressed as a percentage of CDA. Even though

45
the absorption at 232 nm increases initially showing an increase in percent by mass
of CDA, equilibrium is established between the rate of formation of conjugated
dienes and the rate of formation of polymers involving conjugated dienes. As a
result, the absorption does not show much variation, as the frying proceeds.
Therefore, once the equilibrium is established, the absorption at 232 nm may not
represent a direct measurement of oxidative degradation. Moreover, this test is
considered to be less applicable in measuring heat abuse of oils containing only few
UFAs. Generally, shortening contain only lesser amounts of UFAs due to partial
hydrogenation. Hence, the measurement of CDA is considered useful in
determining the frying oil quality (Casimir and David, 2008).
2.5.6 Recommendation and Regulation of Frying Fats and Oils in Some
Countries
Frying oils have to be discarded after certain duration of use because of the harmful
effects of the products forming and accumulating in the oil. In earlier days, the taste
evaluation of the food products was considered the most important factor in the
quality measurement (Moreira et al., 1999 and Stier, 2001).
Many countries establish their own recommendations or regulation for used fats
and oils for the safety of health's population. Appendix E presents summary of
regulation in some countries (Paul and Mittal, 1997 and Stier, 2001).
2.6 Pertinent research
Hasson (2012) studied the time effect of frying Falafels on physical, chemical, and
FAs changes during frying in CS oil. The samples collected from local restaurant for
Falafels in Damascus. Results of physical changes revealed that refractive index
(R.I), viscosity and density of CS oils were increased during frying of Falafels after
70 hr and the chemical changes showed that I.V was gradually decreased with the
increasing value of FFAs. The TPC reached the rejection value of 25% during the 50
hr of frying. In addition, the P.V of CS oil has reached (12.89meqO2/kg) in 20 hr
and increased to 22.5 % in 70 hr of frying falafel. All the average values of physical
and chemical changes of oils, showed that there were significant differences (p<1%)
in all polled samples and the effects of frying falafels on FAs changes showed that

46
some SFAs were increased while UFAs were decreased after 70 hr of frying,
especially C18:2.
Emin and Buket, (2011) studied the quality of 28 frying oil samples
collected twice a month from fast food restaurants in Çanakkale City,
Turkey. Oil samples have been determined by A.V, P.V, TPC, R.I,
viscosity, color and turbidity measurements. In addition, a questionnaire
composed of 9 questions has been distributed to the cooks of these
restaurants. The results of physical changes revealed that R.I, viscosity,
color and turbidity of different type of frying oils were ranged as (1.4640-
1.4745), (48.95-78.15 cP), (25.28-45.14 Lv) and (2.7-733.5 NTU),
respectively. The results of chemical changes revealed that A.V, P.V, TPC,
ranged as (0.876-4.083 % oleic), (2.50-59.06 meq/kg) and (9.25-50.25%),
respectively. Only three samples exceeded the rejection value of (TPC),
25%. In addition, the survey has indicated that especially in small frying
facilities, poor education of cooks and restaurant owners about hazard
related with frying manner such as discarding of waste, TPC limits …etc,
were leading to pouring waste oil into pipeline as a common practice and
other bad manners. Therefore, education of the restaurant owners and cooks
and organizing an effective way of collecting waste frying oils are needed in
this area. Also, the survey has indicated that cooks are well aware of the
government regulation and control procedures for frying oils. Education to
get TPC measurements to be implemented regularly is also needed.
Nittaya (2008) studied the changes in physical and chemical properties
during frying banana slices in palm olein oil, rice bran oil and soybean oil
for 20 cycles for each one. Results of physical changes revealed that P.V
was gradually increased (4.21-7.36 meq/kg) with the increasing value of
conjugated dienoic acids and TPC of three frying oils ranged between 0.25-
0.84% and 6.57-8.83%, respectively after the 20th
frying cycles. The TPC
did not reach the rejection value of 25% during the 20th
cycles of three
studied oils. In addition, the color index (Munsell value) of three studied
oils, were decreased from 10Y to 7.5Y, while viscosity increased gradually
from 14.98 to 21.17 sec/ml.
47
OtiWilberforce and Nwabue (2013) in their study in Nigeria found accumulation of
As, Cd, Cr, Pb and Zn in soils and vegetables in the vicinity of Enyigba Lead mine.
These were investigated using Particle Induced X-ray Emission (PIXE) spectrometry.
Samples from Abakaliki served as control. The five edible vegetables studied include
Telfaria occidentalis (fluted pumpkin); Talinum triangulare (water leaf); Amaranthus
hybridus (Amaranth or pigweed); Vernonia amygdalina (bitter leaf); and Solmun
nigrum (garden egg leaf). The metal concentrations in the soil decreased with depth
which possibly suggests anthropogenic sources of contamination. The levels of Pb >
Ni > Cd in Enyigba top soil was observed to be above the US-EPA Regulatory Limits
in that order. Elevated concentrations of heavy metals were recorded in all the
vegetable samples from Enyigba Lead mine and they exceeded those of Abakaliki.
The results revealed that heavy metal values in the vegetable from Enyigba ranged
from 0.035 - 0.400 mg/kg (As), 0.001 - 0.01 mg/kg (Cd), 0.023 - 0.273 mg/kg (Cr),
0.105 -0.826 mg/kg (Pb), and 0.016 - 0.174 mg/kg (Zn); while those from Abakaliki
were found to be 0.022 - 0.280 mg/kg (As), 0.002 -0.009 mg/kg (Cd), 0.023 - 0.210
mg/kg (Cr), 0.091 - 0.426 mg/kg (Pb) and 0.022 - 0.144 mg/kg (Zn). The levels of As
and Pb in bitter leaf and garden egg leaf exceeded WHO Maximum Limit (WHO-ML
= 0.1 ppm for As and 0.3 ppm for Pb).
Asemave et al., 2012 reported that samples of palm oil, groundnut oil and
soybean oil were collected from Makurdi town - Nigeria. These were
analyzed for Cu, Fe, Cr, Al, Pb and Cd. The concentrations of each of these
elements were determined. Palm oil gave 11.370 mg kg-1, 0.078 mg kg-1,
2.3319 mg kg-1, 0.1780 mg kg-1,1.9358 mg kg-1, and 0.0220 mg kg-1 for
Fe, Cu, Cr, Al, Pb and Cd respectively.
In the GN oil, the concentrations (mg/kg) of Fe, Cu, Cr, Al, Pb and Cd were
obtained as 8.5109, 0.0633, 2.7067, 0.1631, 1.7742 and 0.0207 respectively.
For the Soybean oil sample, the levels (mg kg-1) were 8.7519, 0.0475,
1.7559, 0.1631, 0.3837, and 0.0200 for Fe, Cu, Cr, Al, Pb and Cd
respectively.
Fangkun et. al, (2011) studied eight heavy metals namely Cu, Zn, Fe, Mn,
Cd, Ni, Pb and As, in nine varieties of edible vegetable oils collected from
China. The heavy metals were determined by inductively coupled plasma
48
atomic emission spectrometry (ICP-AES) and graphite furnace atomic
absorption spectrometry (GF-AAS) after microwave digestion. The
concentrations for Cu, Zn, Fe, Mn, Ni, Pb and As were observed in the
range of 0.214–0.875, 0.742–2.56, 16.2–45.3, 0.113–0.556, 0.026–0.075,
0.009–0.018 and 0.009–0.019 µg/g, respectively. Cadmium was found to be
2.64–8.43 µg/kg. In general, Fe content was higher than other metals in the
investigated edible vegetable oils. Comparing with safety intake levels for
these heavy metals recommended by Institute of Medicine of the National
Academies (IOM), US EPA and Joint FAO/WHO Expert Committee on
Food Additives (JECFA), the dietary intakes of the eight heavy metals from
weekly consumption of 175 g of edible vegetable oils or daily consumption
25 g of edible vegetable oils for a 70 kg individual should pose no risk to
human health.
Erol et al. (2008) studied 17 edible vegetable oils, which were analyzed
spectrometrically for their metal (Cu, Fe, Mn, Co, Cr, Pb, Cd, Ni, and Zn)
contents. Toxic metals in edible vegetable oils were determined by ICP-
AES. The highest metal concentrations were measured as 0.0850, 0.0352,
0.0220, 0.0040, 0.0010, 0.0074, 0.0045, 0.0254 and 0.2870 mg/kg for Cu in
almond oil, for Fe in corn oil, for Mn in soybean oil, for Co in sunflower oil
and almond oil, for Cr in almond oil, for Pb in virgin olive oil, for Cd in
sunflower oil, for Ni in almond oil and for Zn in almond oil respectively.
The method for determining toxic metals in edible vegetable oils by using
ICP-AES is discussed. The metals were extracted from low quantities of oil
(2-3 g) with a 10% nitric acid solution. The extracted metal in acid solution
can be injected into the ICP-AES. The proposed method is simple and
allows the metals to be determined in edible vegetable oils with a precision
estimated below 10% relative standard deviation (RSD) for Cu, 5% for Fe,
15% for Mn, 8% for Co, 10% for Cr, 20% for Pb, 5% for Cd, 16% for Ni
and 11% for Zn.
Nash et al. (1983) studied the presence of ultra-trace levels of Ni, Cr, Cu
and Fe occurring in hydrogenated vegetable oil products which were
estimated by dispersion of the samples in 4-methyl-2-pentanone and atomic
49
absorption spectroscopy (AAs) analysis by the graphite furnace technique.
The principal goals in establishing the analytical methods were improved
sensitivity to metals at low levels and applicability to limited amounts of
products. Using reproducibility and linearity of response as criteria,
optimum oil concentration in solvent and instrument parameters were
established. For a series of commercial products, the method of standard
additions was adopted to correct for matrix differences between the
products and salad oil-based standards. The range for the metals was
determined in five cooking oils: Ni, 29-207 ppb; Cr, 1-5 ppb; Cu, 13-37
ppb; and Fe, 138-301 ppb; in recovered oils from five margarines: Ni, 34-70
ppb; Cr, 2-12 ppb; Cu, 26-58 ppb; and Fe, 239-540 ppb; and in five solid
shortenings: Ni, 592-2772 ppb; Cr, 8-35 ppb and Cu, 26-108 ppb.
Houhoula et al. (2003) studied the effect of process time and temperature on
the accumulation of polar compounds in CS oil during deep-fat frying. The
potato chips were fried at temperature range 155-195 °C. The result showed
that the content of polar compounds increased linearly with process time.
The analysis of individual polar compounds showed that the products of
thermal and oxidation degradation dominated over the products of
hydrolytic cleavage as frying proceeded. Dimeric triglycerides increased
linearly with process time, while polymerized triglycerides increased
exponentially. The rate constants of the degradation reactions increased
slightly with temperature. Oxidized triglycerides increased with frying time
up to 6 hr, thereafter remaining constant or increasing further upon
prolonged frying. The increase was greater at higher temperature. The
products of hydrolytic cleavage were not significantly affected by
temperature. Mono- and diglycerides increased initially to reach a plateau,
while FFAs remained almost constant throughout frying. The thermo-
oxidation alterations induced by heating the oil were also measured and
compared with those observed during frying at the same temperature.
Dimeric and polymerized triglycerides showed high rates of increase during
heating as compared with frying at the same temperature.

50
Totani et al. (2006) studied color deterioration of oil during frying. The
authors investigated the oil used for frying in the industries, and recovered
on a large scale. There were adjusted virgin frying oil, whose mineral-
content to be recovered from oil, was spiked with several components of
fried foods. Then heated at 180°C for up to 70 hr. From the change in oil
viscosity, the apparent heating time of recovered oil was judged to be 20
hours. It was found that in practice, starch, proteins, sugar, and pigments
had little to do with the deterioration, whereas the amino acids, especially
Cys, Met, Trp and the oil itself contributed to the deterioration. These
amino acids exuded from foodstuffs during frying. The level of minerals in
the oil affected the deterioration and viscosity increase of oil itself, in rate as
well as in degree although the deterioration by amino acids was not affected
much by mineral-content. The authors suggested that color deterioration of
frying oil used in the Japanese food industry is attributable to the amino-
carbonyl reaction between thermally oxidized oil and amino acid exuded by
fried stuffs, and coloring of oil itself influenced much by mineral content.
Xu et al. (1999) studied the chemical and physical properties and sensory
evaluation of six deep-frying oils, that were high in oleic canola oil with different
levels of linolenic (low-linolenic canola, medium-linolenic canola and high-
linolenic canola oil), medium-high-oleic sunflower oil, a commercial palm olein oil
and a commercial, partially hydrogenated canola oil. The authors monitored
physical and chemical properties and sensory evaluation during 80 hr deep-frying
trials with potato chips. The result showed that linolenic acid-content was a critical
factor in the deep-frying performance of high in oleic canola oil and was inversely
related to both the sensory ranking of the food fried in the oils and the oxidative
stability of the oils. Low-linolenic canola and sunflower oil were ranked the best of
the six oils in sensory evaluation, although low linolenic canola performed
significantly better than sunflower oil in color index, FFA-content, and TPC.
Medium-linolenic canola was as good as palm olein oil in sensory evaluation, but
was better than palm olein in oxidative stability. Partially hydrogenated canola oil
received the lowest scores in sensory evaluation. High-oleic canola oil with 2.5 %
linolenic acid was found to be very well suited for deep frying.
51
Bastida and Sanchenz-Muniz (2002) studied content of polar and triacylglycerol
oligomer in the frying-life assessment of olive oil (monounsaturated), sunflower oil
(polyunsaturated) and a blend of these oils in deep-frying. Oil was replenished with
fresh oil every 10 frying cycles in all three oils. Changes in the polar content were
25% and polar content was surpassed after 32.2 frying in the olive oil, 22.5 frying
in the sunflower oil and 27.5 frying for the blend oil. According the triacylglycerol
oligomer content was 10% cutoff point; olive oil should be discarded after 25
frying, sunflower oil after 15 frying and the blend oil after 17.7 frying. However,
change in polar content and triacylglycerol oligomer content were different only
between olive oil and sunflower oil that indicated that olive oil performs better than
sunflower oil, and that the blend oil can be used as an alternative.
Totani (2007) studied the effect of reduction in atmospheric oxygen and decreases
thermal deterioration of oil during frying. In frying model experiments a mixture
consisting of oil and amino acid was heated in a tube at 180°C for 20 hr under a
limited supply of oxygen. It was found that a slight decrease in atmospheric pressure
inhibited color deterioration and the formation of polar compounds by more than
50%. It should be economically feasible to set up a frying facility operated under
reduced pressure, which will result in a decrease in oil deterioration, a possible risk
factor for lung cancer for frying operators.
Totani et al. (2007) collected basic information about deteriorated frying oil
ingested through foods to study the safety of deep-fried foods in frying oil. The oil
samples provided by the restaurant had been used for deep-frying for 3-9 days. They
analyzed the acid value (AV), carbonyl value (COV), polar compounds (PC) and
triacylglycerol (TG) and Gardner color in oils used in the kitchen of campus
restaurant and in oil contained in batter coatings of commercially deep-fried foods
purchased randomly in Kobe, Japan. The results of the restaurant investigation
indicated that the properties of frying oil were almost within the safe limit when one
batch of oil was used at 180°C for 3 hr a day for 5 consecutive days.
52
CHAPTER THREE
MATERIALS AND METHODS
3.1 Site of the experiments
The experiment was carried out in Faculty of Agricultural Sciences (FAS), university
of Gezira (U of G), Nesheshieba, Wad Medani, the Sudan (14° 24' N 33° 29'E, 408m
above sea level).
3.2 Methods
3.2.1 Study design
This study was composed of two parts, i.e. a questionnaire and laboratory analysis.
The laboratory work was designed to analyze the physical and chemical qualities of
two types of used frying oils, viz. CS oil and GN oil. All experiments followed the
randomized complete block design (RCBD).
3.2.2 Questionnaire
A questionnaire (Appen. F) composed of 20 questions was designed to explore the
types of popular vegetable oils and types of food used in frying, in addition to the
manner of frying (i.e. temperature, duration, storage, reusing … etc.). It has been
distributed to 181 participants involved in cooking (food producers) in both sectors
home (103) and local restaurants (78) in Wad Medani town. Data were subjected to
analysis using SPSS version 11.5 software program.
3.2.3 Laboratory Work:
3.2.3.1 Samples collection and frying process
In this study samples of used oils (CS oil and GN oil) for food frying (viz. fish and
falafel) in Wad Medani local restaurants were collected as fallow: Two types of fresh
refined oil were purchased from the local market (Wad Medani, the Sudan). The
prepared 20 kg of fresh fish (Lates niloticus), locally known as "Ejel" fished from the
Blue Nile, and the 40 kg of chickpea (Cicer arietinum) was soaked in fresh water for
10 hours, then grounded and mixed with garlic, onion, and spices, shaped in balls and
fried as falafel/ tameyia. Both type of studied foods were fried in both type of studied
oils separately and continuously for 20 cycles. Initial amount of oil in fryer was ca.
4L. Around 300 ml of oil samples were taken directly from the fryer in-use at initial
frying, 5th
, 10th
, 15th
and 20th
frying cycle. Samples were kept into capped glass
containers when oil was 180 ± 5 °C, then after oil samples were cooled they were
taken into labeled capped plastic containers and kept at 0 ± 5 °C until analyzed.

53
3.2.3.2 Sensory evaluation of fried falafel and fish
The sensory panel test was done by using Hedonic Scale method. After the end of
frying process using both types of oils (CS oil and GN oil), selected samples of fried
food (falafel and fish) were taken after end of first, 5th
, 10th
, 15th
and 20th
frying cycle,
the selected samples were placed randomly in codified plates with three-digit codes
and served to ten consumer panelists (5 males and 5 females) they fill out the
evaluation form (Appen. G). Judges were placed in different places to avoid
communication during the evaluation and asked to select one of five Hedonic Scale
range of fried fish and falafel for overall acceptability and made comments about
taste, texture, appearance, color, odor (Appen. G) (Carpenter et al., 2000).
3.2.3.3 Physical analysis for used frying oils
3.2.3.3.1 Color
The color of oil samples were measured at 25-30 °C, the cuvette was filled, using a
sufficient amount of oil to ensure a full column in the light beam. Then the filled
cuvette was placed in the instrument (Lovibond, model PFXi-950 Series) and the
color absorbance was measured in terms of Lovibond units according to AOCS
method Cc 13e-92, (2004).
3.2.3.3.2 Viscosity
The temperature of the oil samples were adjusted to 25-30 °C, 2 ml oil sample was
drawn with pipette, then 1 ml oil sample was released and flow rate was determined.
Brookfield LV viscometer Model TC-500 (Brookfield Engineering Laboratories
Stoughton, MA, USA) was used to measure the viscosity of the oil samples at 30 °C
according to the method described by Saguy et al. (1996).
3.2.3.4 Chemical analysis of used frying oils
3.2.3.4.1 Peroxide value
The peroxide value was determined using procedure described in official methods and
recommended practices of the AOCS method Cd 8-53(2003), as follows: 5.00 g ±
0.05 of sample were weighed into a 250 ml erlenmeyer flask with glass stopper and
30 ml of the 3:2 acetic acid : chloroform solution were added. Swirled well to
dissolve the sample. Then 0.5 ml of saturated KI solution was added using volumetric
pipette. The solution was allowed to stand with occasional shaking for exactly one
min., and then immediately 30 ml of distilled water were added. Titrated with 0.1 N
54
sodium thiosulfate, it was added gradually and with constant agitation. The titration
was continued until the yellow iodine color has almost disappeared. About 2.0 m1 of
starch indicator solution was added. The titration was continued with constant
agitation, especially near the end point, to liberate all of the iodine from the solvent
layer. The thiosulfate solution was added drop wise until the blue color just
disappears.
Calculation : Peroxide value (milliequivalents peroxide /100 g sample)
= (S - B) x N x 1000
mass of sample, g.
where- B = volume of titrant, ml of blank
S = volume of titrant, ml of sample
N = normality of sodium thiosulfate solution
3.2.3.4.2 Acid value and FFA
The acid value (A.V) was determined using procedure described in official methods
and recommended practices of the AOCS method Cd 3a-63(1989) as follows: 2.5 g ±
0.01 g of oil sample were weighed into an Erlenmeyer flask (250 ml) and 20 ml of the
solvent mixtures 1:1 ethanol: di-ethyl-ether solution were added with 3-4 drops of
phenolphthalein. The mixture was shaken vigorously and titrated with 0.1N KOH
solution with constant shaking until the pink coloration remains permanent. Acid
value was calculated using the formula:
The acid value, mg KOH/g of sample = [(A - B) x N x 56.1]/W
Where -
A = ml of standard alkali used in the titration
B = ml of standard alkali used in titrating the blank
N = normality of standard alkali
W = g of sample
The FFAs percent was expressed as oleic acid by dividing the acid value by (1.99)
factor.
3.2.3.4.3 Total polar compounds (TPC) measurement
Spectrophotometric measurement was done by using a Hitachi U-2000
Spectrophotometer (Tokyo, Japan). The TPC of the oil samples were measured at 25
°C according to the method described by Xu, (2000). Oil samples were dissolved in
iso-octanol (1:2) and placed in a standard cuvette. The spectrophotometer absorbance
was zeroed against blank solvent. The oil samples were measured at 490 nm
wavelength. The equation for conversion of the absorbance to TPC contents is:
55
Y = −2.7865x2 + 23.782x + 1.0309.
Where:
Y = Total Polar Compounds % (TPC).
X = Oil sample Spectrophotometric absorbance's at 490 nm.
3.2.3.4.4 Determination of Pb, Cd and Cu ions.
Preparation of standards were made by stock solutions of a 1.0 mg/L concentration of
each metal and these were used for the preparation of aqueous standard solutions after
appropriate dilution with 10 % nitric acid. The concentration ranges of the working
solutions were 0.001- 0.1 ppm for all metals. The procedure of standard preparation as
follows: one ml of 10% nitric acid containing different concentrations of metal (10-50
ppb) was added to 1g of oil samples. A calibration curve was obtained to see the
linear relationship between absorbance and metal concentration in the concentration
range being used.
Ten ml of each of the oil samples were dissolved in 50 ml of CCl4. Ten ml of each of
nitric acid 10% were added to the beaker and then shaked for 10 min. at velocity of
2500-3000 rpm. The resulting solution was transferred into a plastic bottle for metal
analysis by AAS method according to Allen et al. (1998).
3.2.4 Statistical analysis
All experiments followed the randomized complete block design (RCBD).
Differences among individual means were determined by analysis of variance
(ANOVA) test and Duncan Multiple Range Test (DMRT), t-test, F-test, correlation
and regression. SPSS version 11.5 (2002) statistical package software was used to
perform the statistical analysis.

56
CHAPTER FOUR
RESULTS AND DISCUSSION
4.1 Questionnaire analysis results
The responses in percentage of responders within each question are shown in tables
1a, 1b and 1c. The major oils used for frying were GN oil (79.5%), CS oil (15.4%),
sunflower oil (2.6%) and corn oil (1.3%) of the total amount used by the restaurants
sector. Interestingly the questionnaire revealed that CS oil was not used by the home
sector, which used slightly more oils of GN oil (88.3%), corn oil (8.7%) and
sunflower oil (2.9%). Mostly in restaurants sector and home sector using oil produced
by commercial factories (92.3 and 95.1%, respectively) or rarely traditional oil
extractors (7.7 and 4.9%, respectively). Usually in local restaurants and home frying
one type of food in the same oil (69.2% and 33%), or two (20.5% and 42.7%),
respectively), the type of fried food were falafel, 60.3% and 7.8%; fish, 21.8% and
1.0%; fish and chicken/falafel, 12.8% and 12.6%, and all options, 2.6% and 76.7% in
restaurants and homes, respectively (Tables 1a, 1b and 1c). Emin and Buket (2011)
under took questionnaire work not very different from the present work. They
reported that the main oil used for frying in Turkish restaurants was sunflower oil,
which amounted to 46.43% of the total oils used in frying process. Hasson (2012)
reported that CS oil was mostly used in frying Falafel in Damascus - Syria.
Richard et al. (2005) reported that CS oil and GN oil that did not have any processing
after extraction were purchased at local bazzars in central Asia and Africa. Refining
process refers to any purification treatment designed to remove FFA, phosphatides,
gossypol, sterols, pigments, glucosides, waxes, hydrocarbons, and other compounds
that may be detrimental to the flavor or oxidative stability of the refined oil.
Inadequately refined oils will affect the operation of all succeeding processes and the
quality of the finished product. Also refining process is to inactivate trace metals, such
as Fe, Cu and others that may be present in the oil. In the present study it is obvious
that both sector in restaurants and home cooks were using refined vegetable oil in
higher percentage than traditional oil extractor, so they have a good quality of initial
frying oil and final products of fried food.
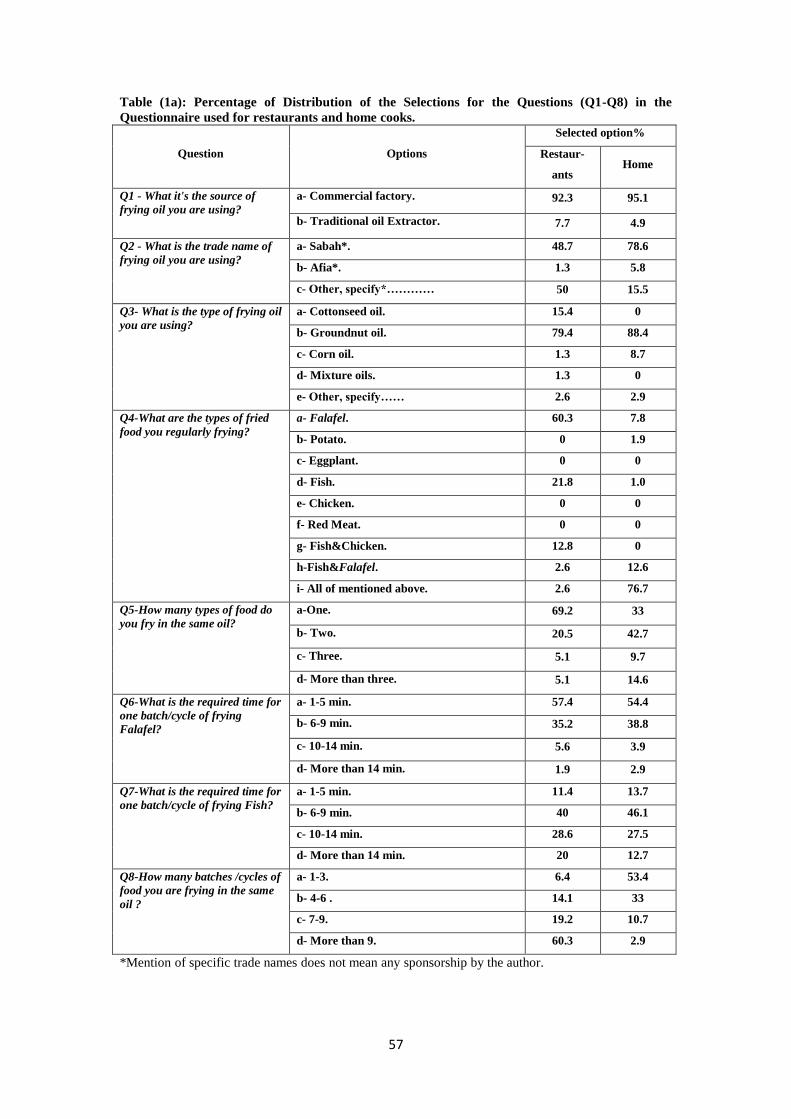
57
Table (1a): Percentage of Distribution of the Selections for the Questions (Q1-Q8) in the
Questionnaire used for restaurants and home cooks.
Question Options
Selected option%
Restaur-
ants Home
Q1 - What it's the source of
frying oil you are using?
a- Commercial factory. 92.3 95.1
b- Traditional oil Extractor. 7.7 4.9
Q2 - What is the trade name of
frying oil you are using?
a- Sabah*. 48.7 78.6
b- Afia*. 1.3 5.8
c- Other, specify*………… 50 15.5
Q3- What is the type of frying oil
you are using?
a- Cottonseed oil. 15.4 0
b- Groundnut oil. 79.4 88.4
c- Corn oil. 1.3 8.7
d- Mixture oils. 1.3 0
e- Other, specify…… 2.6 2.9
Q4-What are the types of fried
food you regularly frying?
a- Falafel. 60.3 7.8
b- Potato. 0 1.9
c- Eggplant. 0 0
d- Fish. 21.8 1.0
e- Chicken. 0 0
f- Red Meat. 0 0
g- Fish&Chicken. 12.8 0
h-Fish&Falafel. 2.6 12.6
i- All of mentioned above. 2.6 76.7
Q5-How many types of food do
you fry in the same oil?
a-One. 69.2 33
b- Two. 20.5 42.7
c- Three. 5.1 9.7
d- More than three. 5.1 14.6
Q6-What is the required time for
one batch/cycle of frying
Falafel?
a- 1-5 min. 57.4 54.4
b- 6-9 min. 35.2 38.8
c- 10-14 min. 5.6 3.9
d- More than 14 min. 1.9 2.9
Q7-What is the required time for
one batch/cycle of frying Fish?
a- 1-5 min. 11.4 13.7
b- 6-9 min. 40 46.1
c- 10-14 min. 28.6 27.5
d- More than 14 min. 20 12.7
Q8-How many batches /cycles of
food you are frying in the same
oil ?
a- 1-3. 6.4 53.4
b- 4-6 . 14.1 33
c- 7-9. 19.2 10.7
d- More than 9. 60.3 2.9
*Mention of specific trade names does not mean any sponsorship by the author.
58
In restaurants sector (question No. 8), they have a highest number of fry cycles, i.e. >
9 cycles (47%) and the lowest was between 1 to 3 cycles (5%). However, in contrast,
in home sector the range was from 2.9 to 53.4%, respectively, for the highest and
lowest cycle numbers (Table 1a). These findings are slightly different compared to
study done by Emin and Buket (2011) who applied a questionnaire composed of 9
questions to 28 restaurant cooks and their responses (%) for each responders
within each question reported that, (49.14%) perform frying for 0.5-2.5 hr daily. The
previously mentioned Hasson (2012) study in Syria (CS oil used in frying Falafel)
revealed that the TPC reached the rejection value of 25% after 50 hr of frying.
Houhoula et al. (2003) reported that levels of polar compound increased linearly with
process time. The analysis of individual polar compounds showed that the products of
thermal and oxidation degradation dominated over the products of hydrolytic
cleavage as frying proceeded. In the present study the result showed high number of
frying cycles in restaurants compared to home sectors, so the expected results will be
higher in amount of TPC in restaurants compared to home sector.
The responders used a butane gas as source of controllable heat energy for frying
process in restaurants (93.6%) and home (95.1%). The responders usually remove the
small pieces of burned food when it forms in restaurants (89.7%), but in home they do
that after end of frying process (61.2%) and often store the residual oil after cooling in
both sectors and prefer to store it in plastic container (40.5%) in restaurants compared
with home cooks who prefer glass containers (72.6%), Table (1b). The results showed
that most of cooks in restaurants and home store remained oil 1 to 3 days (100% and
85.2%, following the same order) and then topping it with fresh oil (95.2% and
78.7%, respectively).
The responders vary in method of recognizing the physical index of deteriorated oil,
most of restaurants cook's rely on changes in color (20.5%) compared with home
cooks who rely on a combination of smell, color and taste (9.7%), (Table 1c).
According to Tseng et al. (1996), the components from the food leaching into the oil
affect the oil quality. So, the composition of food plays an important role in deciding
the useful life of oil. Particles of food materials, as well as particles from breaded or
battered food surface coatings, contaminate the frying oil in fairly large quantities.
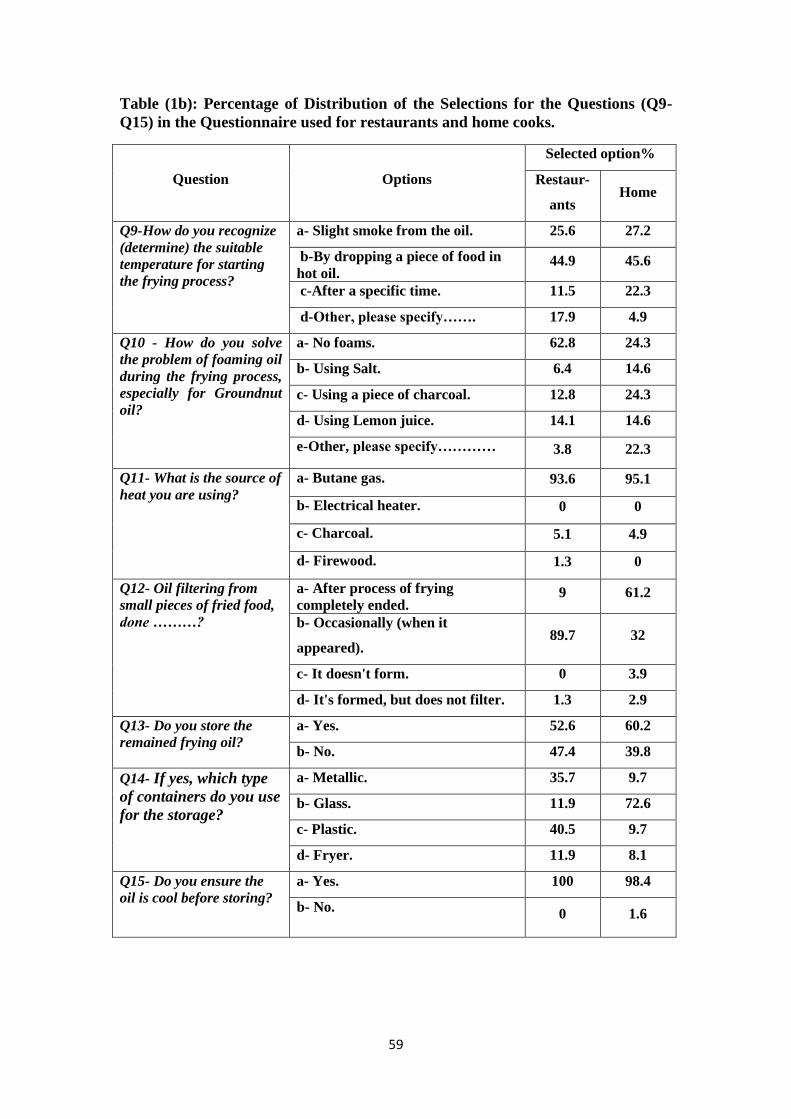
59
Table (1b): Percentage of Distribution of the Selections for the Questions (Q9-
Q15) in the Questionnaire used for restaurants and home cooks.
Question Options
Selected option%
Restaur-
ants Home
Q9-How do you recognize
(determine) the suitable
temperature for starting
the frying process?
a- Slight smoke from the oil. 25.6 27.2
b-By dropping a piece of food in
hot oil. 44.9 45.6
c-After a specific time. 11.5 22.3
d-Other, please specify……. 17.9 4.9
Q10 - How do you solve
the problem of foaming oil
during the frying process,
especially for Groundnut
oil?
a- No foams. 62.8 24.3
b- Using Salt. 6.4 14.6
c- Using a piece of charcoal. 12.8 24.3
d- Using Lemon juice. 14.1 14.6
e-Other, please specify………… 3.8 22.3
Q11- What is the source of
heat you are using?
a- Butane gas. 93.6 95.1
b- Electrical heater. 0 0
c- Charcoal. 5.1 4.9
d- Firewood. 1.3 0
Q12- Oil filtering from
small pieces of fried food,
done ………?
a- After process of frying
completely ended. 9 61.2
b- Occasionally (when it
appeared). 89.7 32
c- It doesn't form. 0 3.9
d- It's formed, but does not filter. 1.3 2.9
Q13- Do you store the
remained frying oil?
a- Yes. 52.6 60.2
b- No. 47.4 39.8
Q14- If yes, which type
of containers do you use
for the storage?
a- Metallic. 35.7 9.7
b- Glass. 11.9 72.6
c- Plastic. 40.5 9.7
d- Fryer. 11.9 8.1
Q15- Do you ensure the
oil is cool before storing?
a- Yes. 100 98.4
b- No. 0 1.6

60
These particles remain in the frying oil until they are caramelized and finally become
charred to fine suspending particles of black carbon. This is an important factor
contributing to the darkening of the oil. Routine filtering is helpful in removing these
particles. Houhoula et al. (2003) reported that production of peroxides and their
decomposition was repeated with each cycle of heating and cooling. Therefore,
intermittent heating and cooling of oils is much more destructive than continuous
heating. Przybylski (2001) reported that change in color of oils during frying was a
complex process where components of oils, such as pigments and fried food are
involved. This is the main cause of darkening of oil with frying time. Thus, only the
color of the oil is not adequate to determine the acceptability of frying oils.
Different frying oils and foods being fried in these oils will darken the oil at different
rates. Paul and Mittal (1997) revealed that T.O rate is probably the most important
factor in maintaining oil quality. It is the ratio of total oil in the fryer to the rate of fresh
oil added. The replenishment is to compensate for the oil absorbed by food products. A
daily T.O of 15 to 25% by mass is recommended. The higher T.O rate keeps the oil a
better quality.
The results showed that the cooks usually dispose un-wanted/waste oil at the end of the
day by spilling it into back-street (43.6%) in restaurants. But in home users prefer to
pour it into sewage (29.1%) (Table 1c). These results were highly different from
Turkish study done by Emin and Buket (2011) who reported that most of restaurants
cook's ( 60.72 %) treat waste oil in a way other than pouring into pipe (7.14%),
collecting and disposing it into trash (17.86%) or collecting and selling to a buyer
(14.29%).
It has been clearly the main purpose of this survey is designing our present experiment
more than a scientific investigation. From these results, it can be inferred that the
attitudes and practices done by restaurants cooks have showed great potential hazard for
human health compared to home frying food producers. Thus, the laboratory experiment
was designed to explore more details about the physical and chemical changes in frying
oil qualities, depending on findings of the questionnaire.

61
Table (1c): Percentage of Distribution of the Selections for the Questions (Q16-
Q20) in the Questionnaire used for restaurants and home cooks.
Question Options
Selected%
Restaur-
ants Home
Q16- How many days do
you store oil, for next use?
a- 1-3. 100 85.2
b- 4-6. 0 11.5
c- 7-9. 0 1.6
d- More than 9. 0 1.6
Q17 - Do you topping the
stored oil by adding fresh
oil before starting a new
frying process?
a- Yes. 95.2 78.7
b- No.
4.8 21.3
Q18- How you can
recognize the expiry date
of stored frying oil?
a-By Smell. 16.7 16.1
b- By color. 38.1 14.5
c- By taste. 11.9 8.1
d-By viscosity. 2.4 9.7
e- By smell & taste 16.7 6.5
f- By smell & color 9.5 11.3
g-By color & taste 0 3.2
h-By color & viscosity 0 12.9
i- By smell, color & taste 4.8 16.1
j- Other, please specify ….. 0 1.6
Q19- What do you do
with this oil when you
decided not to use it
again in frying?
a- Wiping Kisra's / Gorasa's pan. 6.4 33
b- Wiping bread's trays. 2.6 0
c- Making traditional soaps. 0 0
d- Not used for any purpose. 89.7 65
e-Other uses, please specify… 1.3 1.9
Q20- If your answer was
(d) for question above,
please explain how you
discard the oil?
a- In back-street. 47.9 22.4
b- Sewage. 43.7 44.8
c- Stagnated water to control
mosquitoes. 5.6 28.4
e-Other uses, please specify …… 2.8 4.5
62
4.2 Sensory evaluation of fried falafel and fish
Changes in the product at the sensory level were assessed by using Hedonic Scale
method. After the frying process end in both types of studied oils (CS oil and GN oil),
samples of fried falafel and Fish taken from 1st, 5
th, 11
th, 15
th, and 20
th frying cycle
number were chosen for the consumer panelists. The latters were asked to taste these
batches of the fried fish and falafel and evaluate overall acceptance using a5 points
Hedonic scale ranging from "Like very much" to "dislike very much" (Appen. G).
Forty consumer panelists evaluated both product, and the results showed that the
evaluators "like very much" the flavor, taste, color and overall acceptance of fried
falafel when GN oil was used as frying media, as frying cycle number increased
overall acceptance increase ranged from 20 to 70% "like very much" (Figs. 1 and 2).
In contrast, when falafel was fried in CS oil, the "dislike" score was the higher
percentage and decreased from 60% to 0% from cycle number 1 to number 20,
respectively. On the other hand CS oil as a frying media indicated by consumer
panelists, percentage of "like very much" increased from 0 to 70%, as the frying cycle
number increased (Figs. 1 and 2). These results were slightly close to Goburdhum and
Jhurree (1995) who studied effect of deep-fat frying on fat oxidation in soybean oil.
The frying performance and stability of pure soybean oil (PSBO), soybean oil blended
with palm kernel olein and pure soybean oil with an antioxidant mixture of butylated
hydroxyl toluene (BHT), butylated hydroxyl anisole (BHA), propyl gallate and citric
acid were compared. The oils were subjected to intermittent frying (up to 15 fryings,
without any "topping up") of potato slices, at 180 °C for a period of 337 minutes.
Sensory assessment showed an improved quality of the chips fried in the blend. Chips
fried in pure soybean oil scored the lowest rating. Thus, the overall results showed an
improved performance and quality of the treated oils in terms of thermal stability
during frying.
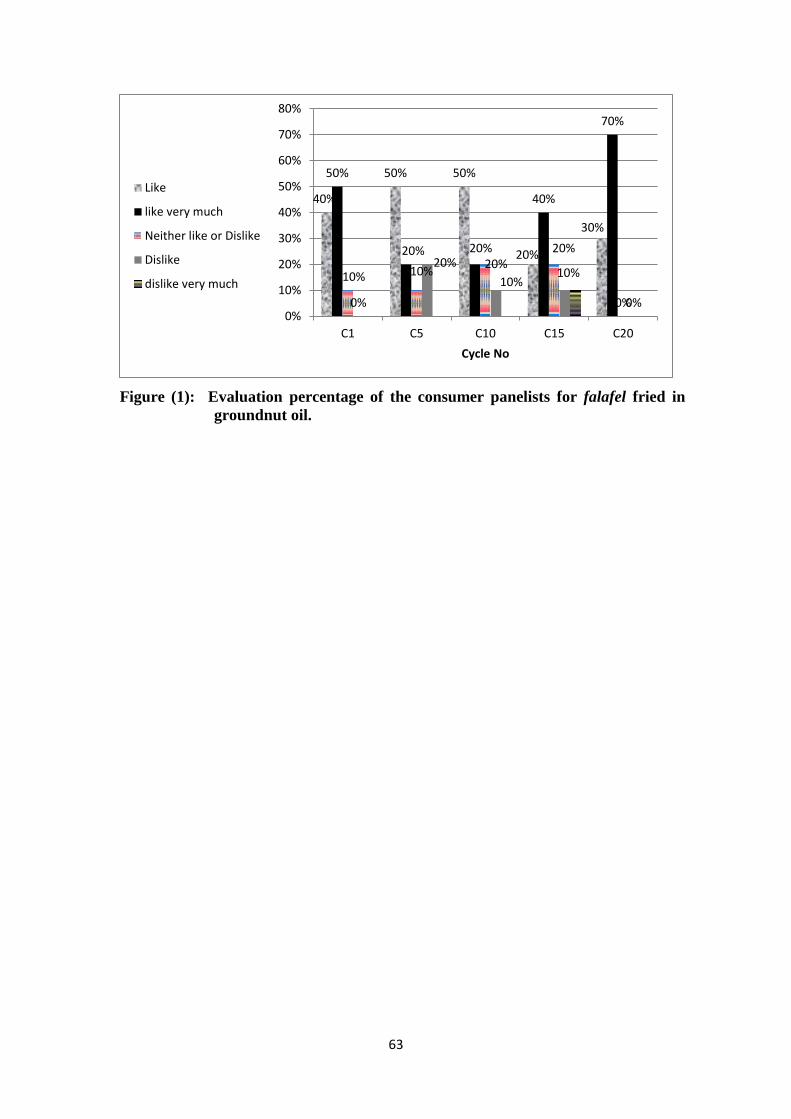
63
Figure (1): Evaluation percentage of the consumer panelists for falafel fried in
groundnut oil.
40%
50% 50%
20%
30%
50%
20% 20%
40%
70%
10% 10% 20%
20%
0% 0%
20%
10% 10%
0% 0%
10%
20%
30%
40%
50%
60%
70%
80%
C1 C5 C10 C15 C20
Cycle No
Like
like very much
Neither like or Dislike
Dislike
dislike very much
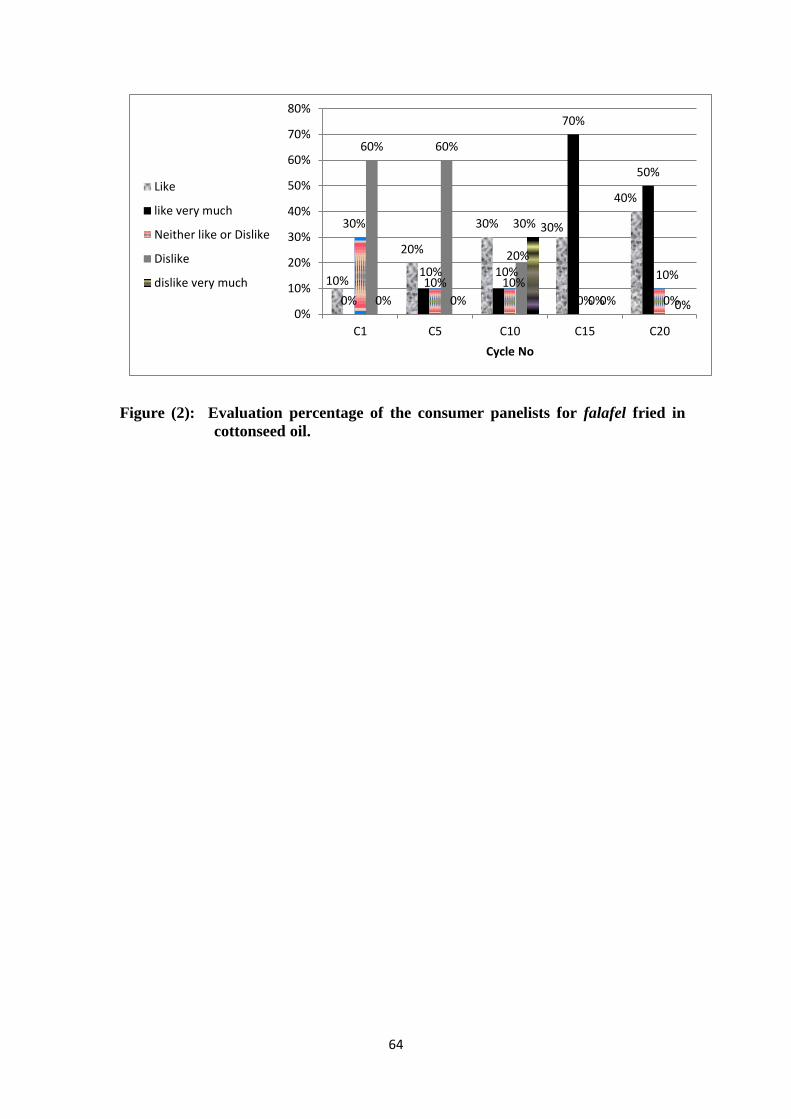
64
Figure (2): Evaluation percentage of the consumer panelists for falafel fried in
cottonseed oil.
10%
20%
30% 30%
40%
0%
10% 10%
70%
50%
30%
10% 10%
0%
10%
60% 60%
20%
0% 0% 0% 0%
30%
0% 0% 0%
10%
20%
30%
40%
50%
60%
70%
80%
C1 C5 C10 C15 C20
Cycle No
Like
like very much
Neither like or Dislike
Dislike
dislike very much
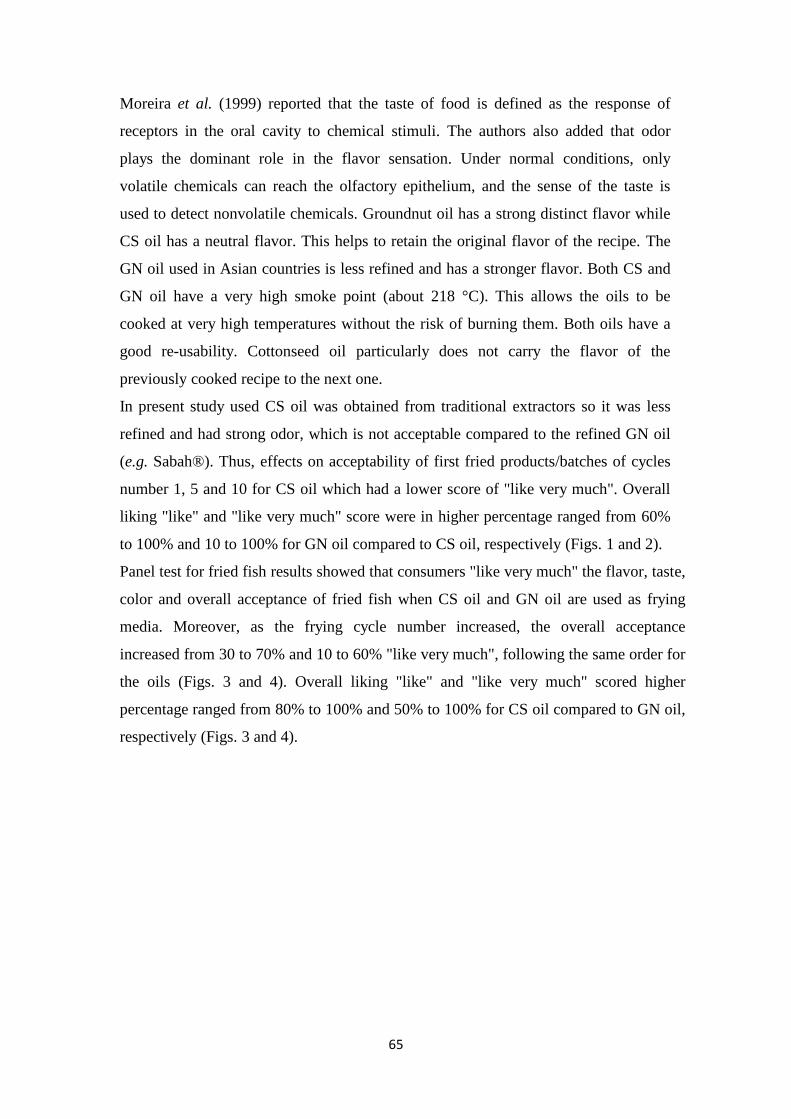
65
Moreira et al. (1999) reported that the taste of food is defined as the response of
receptors in the oral cavity to chemical stimuli. The authors also added that odor
plays the dominant role in the flavor sensation. Under normal conditions, only
volatile chemicals can reach the olfactory epithelium, and the sense of the taste is
used to detect nonvolatile chemicals. Groundnut oil has a strong distinct flavor while
CS oil has a neutral flavor. This helps to retain the original flavor of the recipe. The
GN oil used in Asian countries is less refined and has a stronger flavor. Both CS and
GN oil have a very high smoke point (about 218 °C). This allows the oils to be
cooked at very high temperatures without the risk of burning them. Both oils have a
good re-usability. Cottonseed oil particularly does not carry the flavor of the
previously cooked recipe to the next one.
In present study used CS oil was obtained from traditional extractors so it was less
refined and had strong odor, which is not acceptable compared to the refined GN oil
(e.g. Sabah®). Thus, effects on acceptability of first fried products/batches of cycles
number 1, 5 and 10 for CS oil which had a lower score of "like very much". Overall
liking "like" and "like very much" score were in higher percentage ranged from 60%
to 100% and 10 to 100% for GN oil compared to CS oil, respectively (Figs. 1 and 2).
Panel test for fried fish results showed that consumers "like very much" the flavor, taste,
color and overall acceptance of fried fish when CS oil and GN oil are used as frying
media. Moreover, as the frying cycle number increased, the overall acceptance
increased from 30 to 70% and 10 to 60% "like very much", following the same order for
the oils (Figs. 3 and 4). Overall liking "like" and "like very much" scored higher
percentage ranged from 80% to 100% and 50% to 100% for CS oil compared to GN oil,
respectively (Figs. 3 and 4).
66
Figure (3): Evaluation percentage of the consumer panelists for fish fried in
cottonseed oil.
30%
50%
40%
20%
30%
70%
30%
50%
70%
60%
0%
10% 10% 10%
0% 0%
10%
0% 0%
10%
0% 0% 0% 0% 0% 0%
10%
20%
30%
40%
50%
60%
70%
80%
C1 C5 C10 C15 C20
Cycle NO
Like
like very much
Neither like or Dislike
Dislike
dislike very much
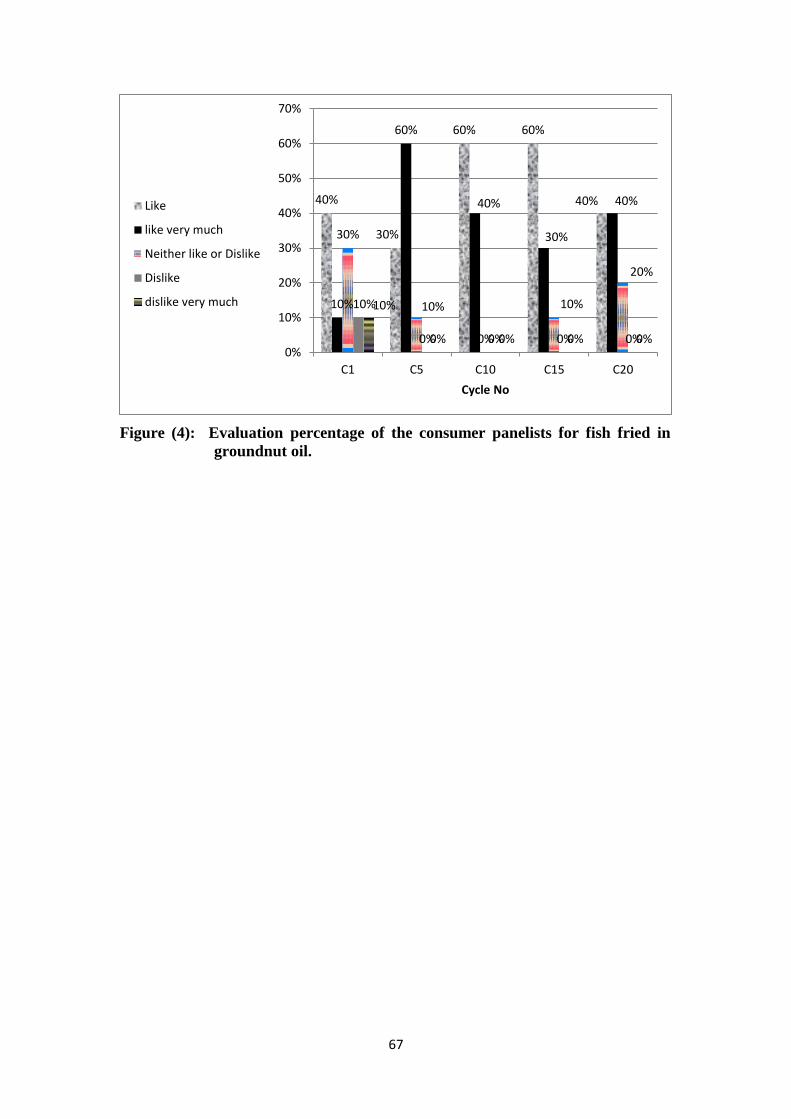
67
Figure (4): Evaluation percentage of the consumer panelists for fish fried in
groundnut oil.
40%
30%
60% 60%
40%
10%
60%
40%
30%
40%
30%
10%
0%
10%
20%
10%
0% 0% 0% 0%
10%
0% 0% 0% 0% 0%
10%
20%
30%
40%
50%
60%
70%
C1 C5 C10 C15 C20
Cycle No
Like
like very much
Neither like or Dislike
Dislike
dislike very much
68
4.3 Changes in physical qualities of CS oil and GN oil when used for frying fish
and falafel.
4.3.1 Color
The Lovibond color units (LCU) were determined for the initial (new; fresh) frying
oil, 5th
, 10th
, 15th
and 20th
frying cycle number of GN oil and CS oil. The LCU of the
two types of used frying oils were shown in table 4. The fresh/initial GN oil had the
highest Lovibond yellow color and lower red color units (11.15Y and 2.1R) than CS
oil (2.5Y and 12.85R) which were significantly different (p<0.05). LCU of CS oil
increased from 2.5Y and 12.85R to 70Y and 23R. However, the GN LCU oil
increased from 11.15Y and 2.10R to 54.2Y and 10R (Table 4). The statistical analysis
showed that the number of frying cycle had significant (p<0.05) effect on LCU of
both oils. LCU increased as frying number increased. The GN oil had the highest
grand mean of LCU yellow color and lower red LCU (21.97Y and 4.57R) than CS oil
(15.97Y and 17.31R) which were not significantly different (p>0.05) for yellow and
red (Table 4). The LCU change rates of the two types of used oils were represented
by slopes of linear equation (a) that showed in table 5. The correlation between LCU
and number of frying cycle was shown in table 5. It was represented by Pearson's
correlation (r). The result showed that LCU of GN oil correlated well with number of
frying cycle, in contrast CS oil correlated very poor. Groundnut oil has the higher
correlation and the CS oil has the lower correlation (Table 5).
In the present study, LCU of initial GN oil were (11.15Y and 2.1R) higher in yellow
color and lower in red color when compared with those of CS oil (2.5Y and 12.85R).
This is attributed to the conversion of the crude oil to edible oil involved more than
one process, i.e. degumming, neutralization or physical refining, bleaching and
deodorization (Gunstone, 1996). Bleaching is the process in which pigments are
removed. The higher level of red pigments referred to gossypol compounds which
give crude CS oil a red color so dark that it usually appears to be black. The
characteristic yellowish amber color of refined, bleached, and deodorized CS oil is
primarily caused by the remaining gossypol after processing. The light yellow color
of GN oil is caused by ß-carotene and lutein. As GN mature, a distinct lightening of
the oil color can be observed (Richard et al., 2005).
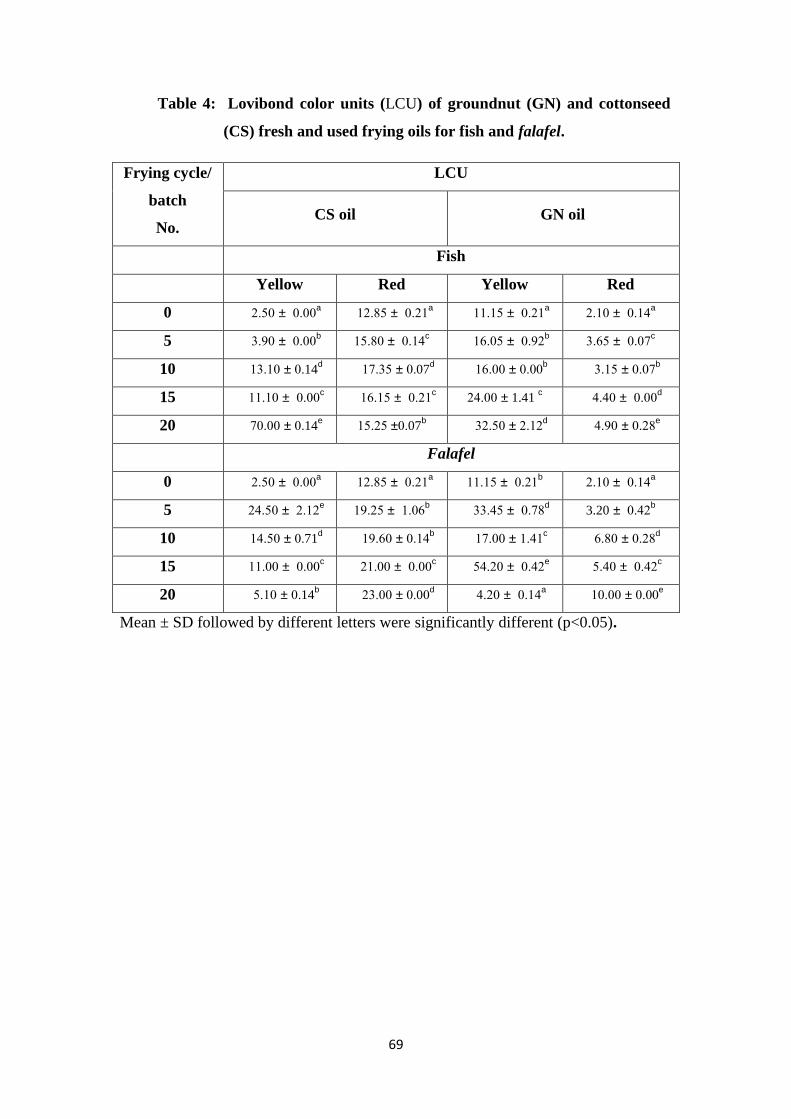
69
Table 4: Lovibond color units (LCU) of groundnut (GN) and cottonseed
(CS) fresh and used frying oils for fish and falafel.
Frying cycle/
batch
No.
LCU
CS oil GN oil
Fish
Yellow Red Yellow Red
0 2.51 ± 0.01 a 12.25 ± 0.21
a 11.15 ± 0.21
a 2.11 ± 1.14
a
5 0..1 ± 0.01 b 15.21 ± 0.14
c 16.15 ± 1..2
b 0.65 ± 0.07
c
10 10.11 ± 0.14d 17.05 ± 0.07
d 16.11 ± 0.11
b 0.15 ± 0.17
b
15 11.11 ± 0.01 c 16.15 ± 0.21
c 24.11 ± 1.41
c 4.41 ± 0.01
d
20 71.11 ± 0.14e 15.25 ±0.07
b 02.51 ± 2.12
d 4..1 ± 0.22
e
Falafel
0 2.51 ± 0.01 a 12.25 ± 0.21
a 11.15 ± 0.21
b 2.11 ± 1.14
a
5 24.51 ± 2.12 e 1..25 ± 1.16
b 00.45 ± 0.72
d 3.20 ± 0.42
b
10 14.51 ± 0.71d 1..61 ± 1.14
b 17.11 ± 1.41
c 6.21 ± 0.22
d
15 11.11 ± 0.01 c 21.11 ± 0.01
c 54.21 ± 1.42
e 5.41 ± 0.42
c
20 5.11 ± 0.14b 20.11 ± 0.01
d 4.21 ± 0.14
a 11.11 ± 0.11
e
Mean ± SD followed by different letters were significantly different (p<0.05).
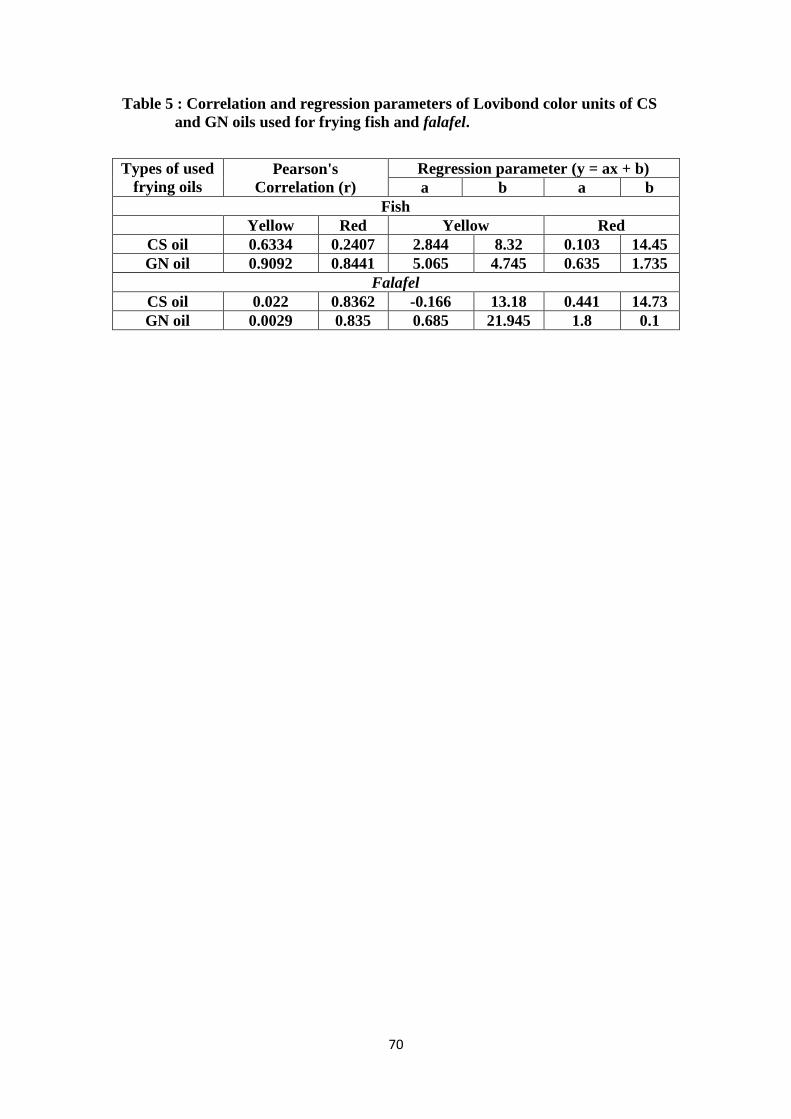
70
Table 5 : Correlation and regression parameters of Lovibond color units of CS
and GN oils used for frying fish and falafel.
Types of used
frying oils
Pearson's
Correlation (r)
Regression parameter (y = ax + b)
a b a b
Fish
Yellow Red Yellow Red
CS oil 0.6334 0.2407 2.844 8.32 0.103 14.45
GN oil 0.9092 0.8441 5.065 4.745 0.635 1.735
Falafel
CS oil 0.022 0.8362 -0.166 13.18 0.441 14.73
GN oil 0.0029 0.835 0.685 21.945 1.8 0.1
71
Lovibond color units of CS oil increased from (2.5Y and 12.85R) to (70Y and 23R)
and the LCU of GN oil increased from (11.15Y and 2.10R) to (54.2Y and 10R). The
results revealed that the LCU increased as number of frying cycle increased (Table 4).
Nittaya (2008) revealed that photometric color index value was gradually increased
for three frying oils (palm olein oil, rice bran oil and soybean oil) ranged between
(2.47-10.07, 2.51-6.99 and 0.56-5.23, respectively) during the 20th
cycle of the three
studied oils. Xu et al. (1999) reported that the color of oils increased from light to
dark as number of frying cycle increased when measured in CIE system for palm
olein oil and canola. Mazza and Qi (1992) studied the color index of hydrogenated
canola oil during frying potatoes strips. The color index increased as number of frying
cycle increased; the color index of the initial oil was 0.73 while that measured after 35
hr of frying was 3.17. Baixauli et al. (2002) reported that photometric color index of
refined sunflower oil, in which frozen squid rings were fried for 40 frying cycles.
They detected no variation in this index until 20th
frying cycle number, and from then
on there was a significant linear increase. The authors suggested the photometric
color index provided a practical way of detecting the beginning of deterioration as a
result of thermal exposure. Tseng et al. (1996) reported that, the contaminants from
the food leaching into the oil affect the oil quality. Thus, the composition of food
plays an important role in deciding the useful life of the oil. Particles of food
materials, as well as particles from breaded or battered food surface coatings,
contaminate the frying oil in fairly large quantities. These particles remain in the
frying oil until they are caramelized and finally become charred to fine suspending
particles of black carbon. This is an important factor contributing to the darkening of
the oil. Routine filtering is helpful in removing these particles. Przybylski (2001)
reported that, change in color of oils during frying is a complex process where
components of oils, such as pigment and fried food are involved. This is the main
cause of darkening of oil with frying time. According to the author, only the color of
oil is not adequate to determine the acceptability of frying oils. Different frying oils
and foods being fried in these oils will darken the oil at different rates.
4.3.2 Viscosity
The viscosity values were determined for initial frying oil, 5th
, 10th
, 15th
and 20th
frying cycle number of CS oil and GN oil (Table 6). The viscosity of initial oil of CS
oil and GN oil were 35.17 cP and 35.40 cP, respectively. The CS oil had the higher
grand mean of viscosity (41.95 cP) than GN oil (39.80 cP). However, were not
72
significantly different (p>0.05). The viscosity of CS oil increased from 35.17 to 46.83
cP and viscosity of GN oil increased from 35.40 to 42.10 cP. The statistical analysis
showed that number of frying cycle number had significant (p<0.05) effect on
viscosity of both oils. In general, the viscosity increased as frying cycle number
increased. At the 20th
frying cycle number, viscosity of GN oil and CS oil used for
frying falafel and fish were 42.10 , 41.17 and 46.83 , 46.83 cP, respectively. The
viscosity of both oils were not significantly different (p>0.05; Table 6).
The viscosity change rates of the two oils were represented by slope of linear equation
(a) that showed in table 7. The statistical analysis of viscosity change rates in both oils
were not significantly different (p>0.05). The higher viscosity change rate was found
in CS oil, while the lower change rate was in GN oil that mean GN oil is highly stable
at frying temperature than CS.
The correlation between the viscosity and the number of frying cycle was shown in
table 7. It was represented by Pearson's correlation (r). The result showed that the
viscosity of two oils is correlated very well with the number of frying cycles (r>0.83).
GN oil showed the higher correlation and the CS oil was the lower correlation.
The viscosity varies with molecular weight, specific gravity, boiling temperature and
refractive index of the compound (Krisnangkura et al., 2006). Viscosity is higher as
longer the chain of fatty acid of triglyceride because of intermolecular attraction
between their fatty acid chains and viscosity is low as number of double bonds fatty
acid, (Richard et al., 2005). These reports are in agreement with those of the present
study. Groundnut oil had the higher initial viscosity while CS oil had the lower initial
viscosity because the major component acids of CS oil are linoleic acid 54%, saturated
fats 27% and oleic acid 19%, while the major component acids of GN oil are oleic acid
48%, linoleic acid 33% and saturated fats 19% (Gunstone, 1996).
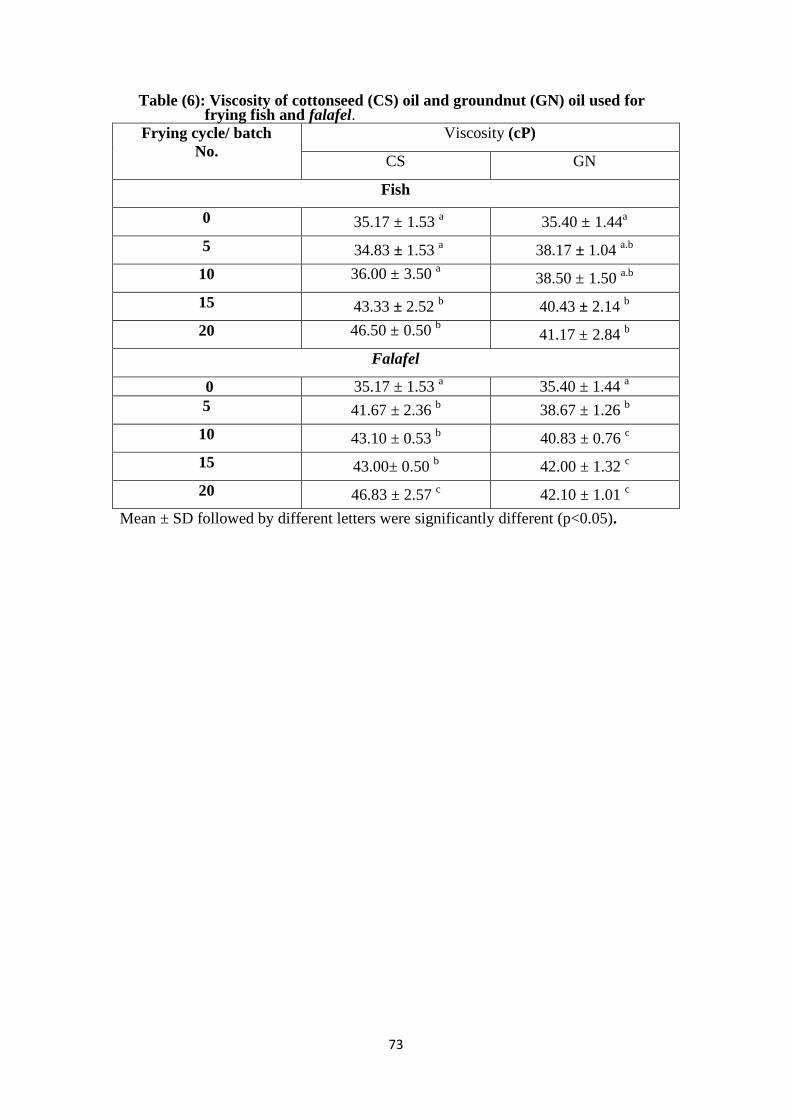
73
Table (6): Viscosity of cottonseed (CS) oil and groundnut (GN) oil used for frying fish and falafel.
Frying cycle/ batch
No.
Viscosity (cP)
CS GN
Fish
0 35.17 ± 1.53 a 35.40 ± 1.44
a
5 34.83 ± 1.53 a 38.17 ± 1.04
a.b
10 36.00 ± 3.50 a 38.50 ± 1.50
a.b
15 43.33 ± 2.52 b 40.43 ± 2.14
b
20 46.50 ± 0.50 b 41.17 ± 2.84
b
Falafel
0 35.17 ± 1.53 a 35.40 ± 1.44
a
5 41.67 ± 2.36 b 38.67 ± 1.26
b
10 43.10 ± 0.53 b 40.83 ± 0.76
c
15 43.00± 0.50 b 42.00 ± 1.32
c
20 46.83 ± 2.57 c 42.10 ± 1.01
c
Mean ± SD followed by different letters were significantly different (p<0.05).

74
Table (7): Correlation and regression parameters of viscosity of cottonseed (CS)
oil and groundnut (GN) oil used in frying fish and falafel.
Types of used
frying oils
Pearson's
Correlation (r)
Regression parameter (y = ax + b)
a b
Fish
CS oil 0.8378 3.1167 29.817
GN oil 0.9663 1.1267 35.607 Falafel
CS oil 0.8408 2.4667 34.553 GN oil 0.8793 1.6733 34.780
75
The present results showed that viscosity increased as number of frying cycle
increased. Hasson (2012) reported that CS oil has initially viscosity of 50.12 cP and
finally after 70 hr of frying falafel reached 330 cP. While Emin and Buket (2011)
reported that sunflower oil, corn oil, olive oil and others their viscosity value ranged
from 48.95 cP for initial/fresh oil and reached 78.15 cP after one month. This is also
similar to the results of the present study, where the initial/fresh CS oil registered
viscosity value of 35.17 cP, which is lower than GN oil (35.40 cP) and reached finally
after 3 hr of continuous frying to 46.83 cP and 42.10 cP, respectively for CS and GN
oils. According to Nittaya (2008), the viscosity value increased gradually when palm
olein oil, rice bran oil and soybean oil were used for frying banana slices. The range
was between 14.98-20.10 sec/ml during the 20th
cycle of these oils. Earlier, Tseng et
al. (1996) reported that the viscosity of the soybean oil increased as the degradation
increased. These could be the result of polymerization during frying, which increased
the weight of the molecules. Older studies, e.g. Chang et al. (1978) reported that the
viscosity of corn oil and CS oil increased during deep frying. The initial viscosity of
corn oil and CS oil were 39.7 and 10.2 centistokes, respectively, while the oil used for
frying for 90 hr, the viscosity of corn oil and CS oil were 50.4 and 13.2 centistokes,
following the same order. Accordingly Inoue et al. (2002) reported that the relative
viscosity of soybean oil during heating increased with an increase in the heating time
at all heating temperatures.
4.4 Changes in Chemical Qualities of CS Oil and GN Oil When Used for Frying
Fish and Falafel.
4.4.1 Acid value and FFAs
The A.V and FFAs were determined in the initial/fresh frying oil, 5th
, 10th
, 15th
and
20th
frying cycle number of CS oil and GN oil. The A.V and FFAs of CS oil and GN
oil were shown in Tables 8 and 9. The A.V and FFAs of initial oil of CS oil and GN
oil were 0.99 and 1.20 mg KOH/g oil, respectively, and for the FFAs were 0.50 and
0.60 %, following the same order. The GN oil and CS oil were nearly equal, in term
of both values, i.e. 1.43 and 0.72 for the A.V, and; 1.42 and 0.72 for the FFAs. They
were not significantly different (p>0.05). Both values increased as the frying cycle
number increased. For example, for the GN oil, the A.V. and FFA increased from
1.20 to 1.61 mg KOH/g oil, and 0.60 to 0.81, respectively. For the CS oil the values
increased from 0.99 to 1.83 mg KOH/g oil, and 0.50 to 0.86, following the same
order.

76
Table (8): Acid value (A.V) changes of cottonseed (CS) oil and groundnut (GN)
oil used for frying fish and falafel.
Frying cycle/
batch
No.
A.V (mg KOH/g oil)
CS Oil GN Oil
Fish
0 0.99 ± 0.04 a 1.20 ± 0.06
a
5 1.38 ± 0.06 b 1.36 ± 0.03
b
10 1.57 ± 0.11 c 1.38 ± 0.06
b
15 1.76 ± 0.06 d 1.46 ± 0.00
b.c
20 1.83 ± 0.06 d 1.53 ± 0.06
c
Falafel
0 0.99 ± 0.04 a 1.20 ± 0.06
a
5 1.16 ± 0.06 a 1.38 ± 0.06
b
10 1.35 ± 0.11 b 1.50 ± 0.06
b.c
15 1.42 ± 0.17 b 1.61 ± 0.06
c
20 1.72 ± 0.06 c 1.61 ± 0.06
c
Mean ± SD followed by different letters were significantly different (p<0.05).
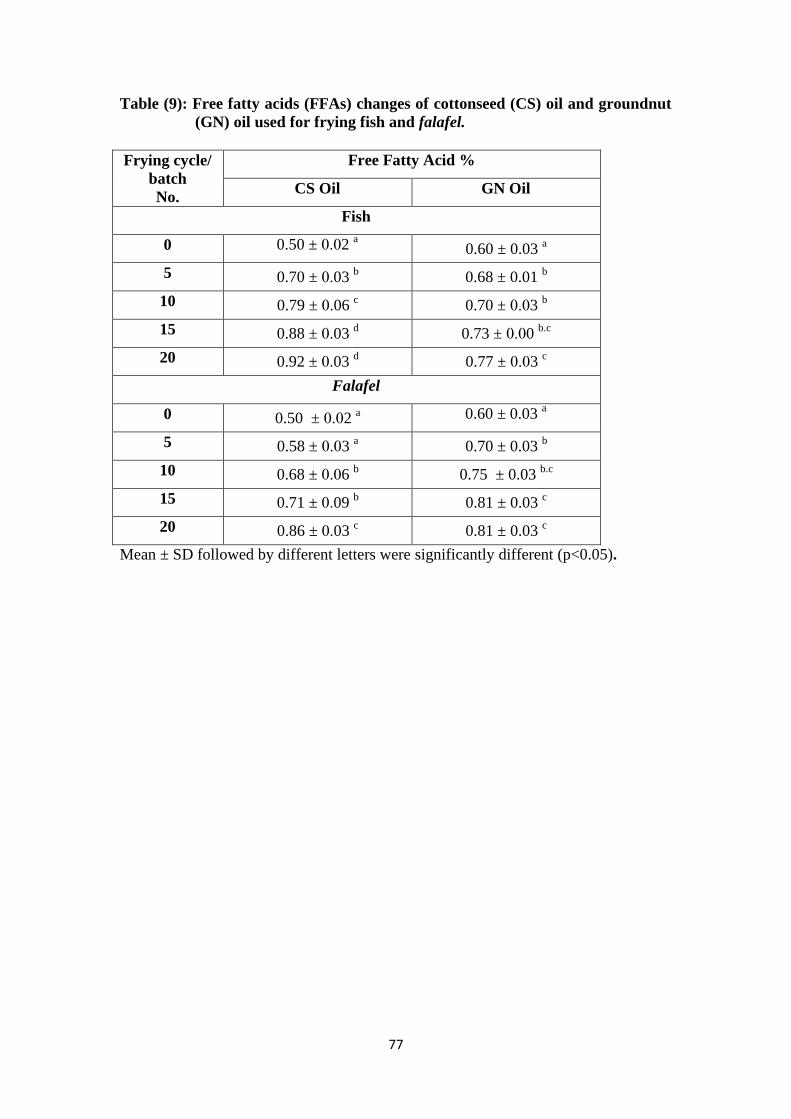
77
Table (9): Free fatty acids (FFAs) changes of cottonseed (CS) oil and groundnut
(GN) oil used for frying fish and falafel.
Frying cycle/
batch
No.
Free Fatty Acid %
CS Oil GN Oil
Fish
0 0.50 ± 0.02 a 0.60 ± 0.03
a
5 0.70 ± 0.03 b 0.68 ± 0.01
b
10 0.79 ± 0.06 c 0.70 ± 0.03
b
15 0.88 ± 0.03 d 0.73 ± 0.00
b.c
20 0.92 ± 0.03 d 0.77 ± 0.03
c
Falafel
0 0.50 ± 0.02 a 0.60 ± 0.03
a
5 0.58 ± 0.03 a 0.70 ± 0.03
b
10 0.68 ± 0.06 b 0.75 ± 0.03
b.c
15 0.71 ± 0.09 b 0.81 ± 0.03
c
20 0.86 ± 0.03 c 0.81 ± 0.03
c
Mean ± SD followed by different letters were significantly different (p<0.05).
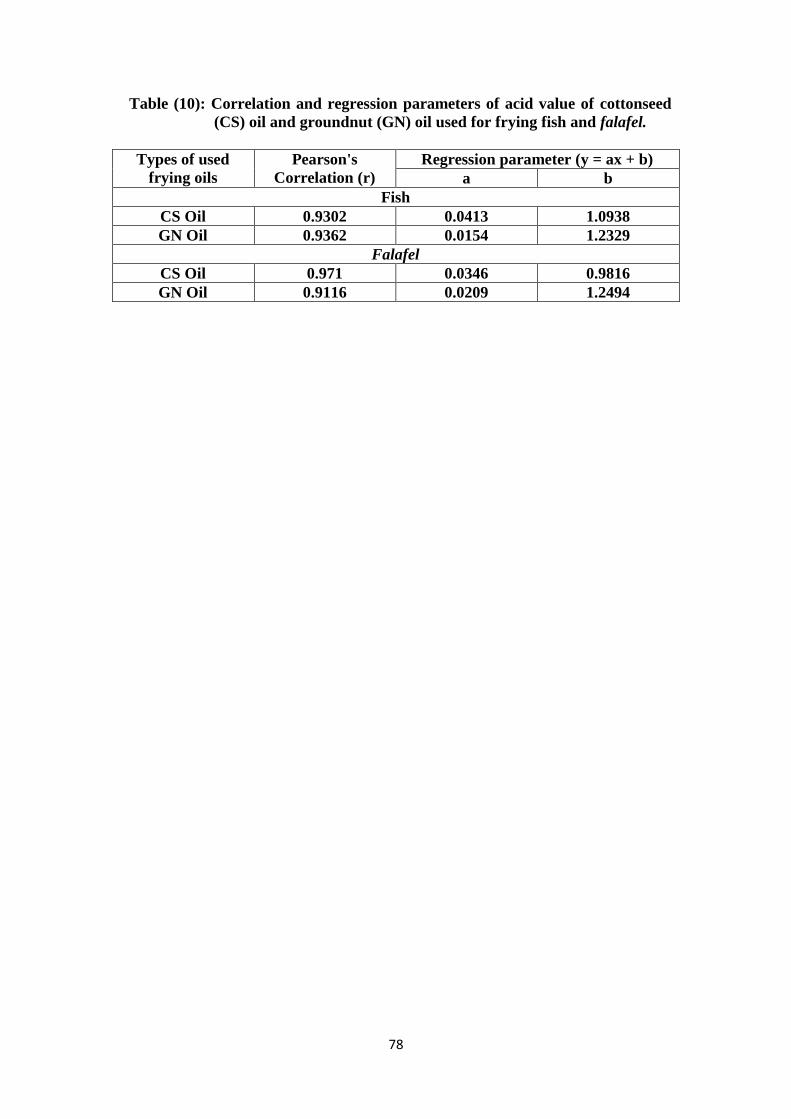
78
Table (10): Correlation and regression parameters of acid value of cottonseed
(CS) oil and groundnut (GN) oil used for frying fish and falafel.
Types of used
frying oils
Pearson's
Correlation (r)
Regression parameter (y = ax + b)
a b
Fish
CS Oil 0.9302 0.0413 1.0938
GN Oil 0.9362 0.0154 1.2329
Falafel
CS Oil 0.971 0.0346 0.9816
GN Oil 0.9116 0.0209 1.2494
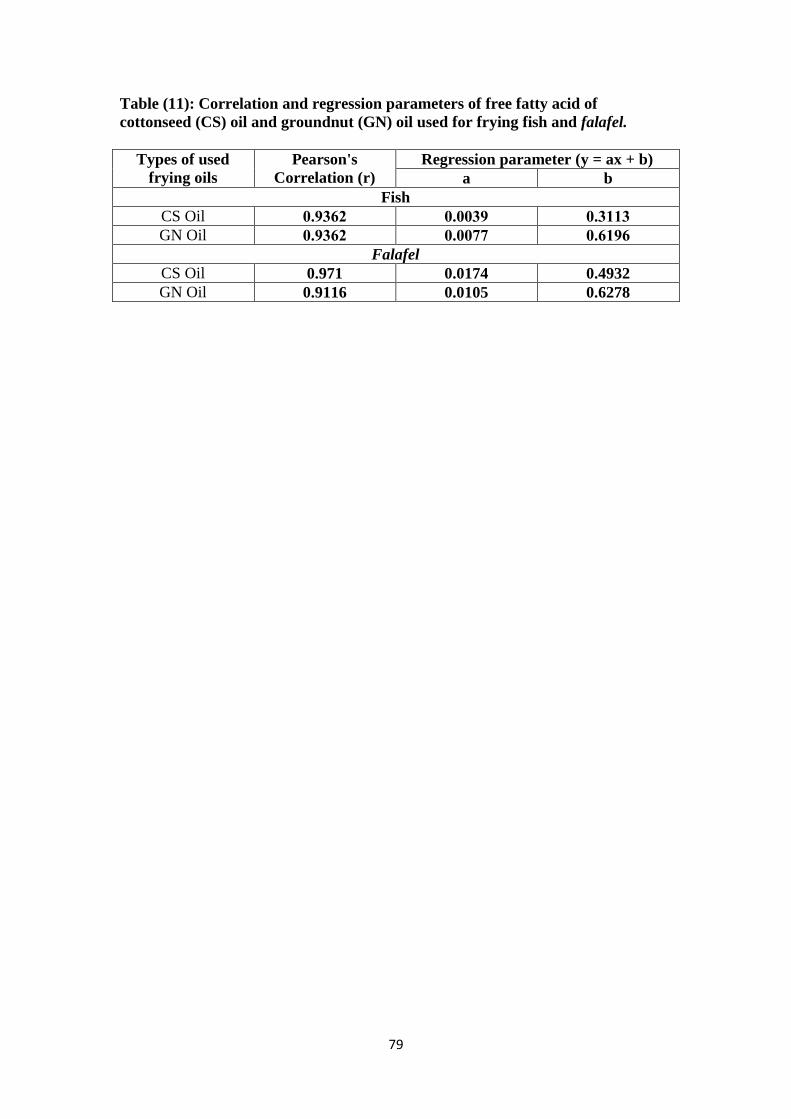
79
Table (11): Correlation and regression parameters of free fatty acid of
cottonseed (CS) oil and groundnut (GN) oil used for frying fish and falafel.
Types of used
frying oils
Pearson's
Correlation (r)
Regression parameter (y = ax + b)
a b
Fish
CS Oil 2633.0 262233 263..3
GN Oil 2633.0 262200 26..3.
Falafel
CS Oil 0.971 0.0174 0.4932
GN Oil 0.9116 0.0105 0.6278

80
The statistical analysis showed that number of frying cycle had significant (p<0.05)
effect in both values of both frying oils (Tables 8 and 9).
The A.V and FFAs changes rate of both oils are represented by slope of linear
equation (Tables 10 and 11). Statistically, no significant differences were detected in
changes of the rates in both oils (p>0.05). The higher A.V and FFAs changes rate
were found in CS oil, while the lower change rate was by GN oil.
The correlation between A.V, and FFAs changes and number of frying cycles is
presented in tables 10 and 11. It was represented by Pearson's correlation (r). The
result showed that A.V and FFAs of these two frying oils correlated well with number
of frying cycles. Cottonseed oil has the higher correlation than GN oil.
The A.V indicated amount of hydrolyzed triglyceride in the oil. The A.V increases
from FFAs, which develops mainly from hydrolysis of triglyceride. Therefore, the
A.V increases within oil degradation (Moreira et al., 1999; Orthoefer and Cooper,
1996).
The % FFAs in GN oil varies between 0.02% and 0.6%. Lipase hydrolysis of
triacylglycerols into FFAs and glycerol occurs before germination and during adverse
storage. Consequently, high FFA values indicate poor handling, immaturity, mold
growth, or other factors that lead to triacylglycerol hydrolysis. During frying, a
considerable amount of moisture from the food products escapes into the frying oil as
steam. At elevated frying temperatures in the range 160 to 200°C, this steam reacts
with triglycerides to form FFAs, monoglycerides, di-glycerides and glycerol (Paul and
Mittal, 1997).
Hasson (2012) reported that CS oil initially had free fatty acid 0.08% and finally after
70 hr of frying falafel reached 2.54%. While Emin and Buket (2011) reported that
sunflower oil, corn oil, olive oil and others, their A.V ranged from 0.876% for initial
oil and reached 4.083% after one month. This finding agreed with the present work
results. The initial/fresh CS oil had A.V and FFAs (1.420 and 0.715) were almost
identical similar to GN oil (1.425 and 0.715, respectively). Again, the statistical
analysis showed that the change rates of A.V and FFAs of two studied oils used for
two studied fried items were not significantly different (p>0.05; Tables 8 and 9).
81
4.4.2 Peroxide value
The P.Vs were determined in the initial/fresh frying oil, 5th
, 10th
, 15th
and 20th
frying
cycle number of CS oil and GN oil. The P.Vs of two types of used frying oils was
shown in Table 12. The P.Vs of the initial oil of GN oil and CS oil were 4.33 and 6.47
meq/kg, respectively. The CS oil registered a higher general mean of P.V (11.85) than
GN oil (9.91). They were not significantly different (p>0.05). The P.V increased as
frying cycle number increased. The P.Vs of CS oil increased from 6.47 to15.67
meq/kg, whereas the P.Vs of GN oil increased from 4.33 to17.80 meq/kg when used
for frying fish and falafel. The statistical analysis showed that number of frying cycles
had significant (p<0.05) effect on P.V of both oils and both fried items (Table 12).
The P.V change rate of two oils used for frying fish and falafel were represented by
slope of linear equation (Table 13). The statistical analysis of P.V change rates in each
frying oil for both types of fried foods were not significantly different (p>0.05). The
higher P.V change rate was found in CS oil, while the lower change rate was in GN
oil.
The correlation between P.V and number of frying cycles was shown in Table 13. The
correlation was represented by Pearson's correlation (r). The results showed that the
P.Vs of two used frying oils correlated well with number of frying cycles. The GN oil
used for frying falafel and fish had a higher correlation than CS oil, (0.90 and 0.96)
and (0.79 and 0.95), respectively.
Peroxides are primary reaction products of lipid oxidation. Peroxides can be measured
based on their ability to liberate iodine from potassium iodide (KI), or to oxidize iron
ions (from ferrous to ferric ions). The P.V is applicable for the early stages of lipid
oxidation. During the course of oxidation, P.Vs reach a peak and then decline (Richard
et al., 2005).

82
Table (12): Peroxide value (P.V) of cottonseed (CS) oil and groundnut (GN) oil
used for frying fish and falafel.
Frying cycle/ batch
No.
P.V (meq/kg)
CS oil GN oil
Fish
0 6.47 ± 0.50 a 4.33 ± 0.58
a
5 10.60 ± 2.12 b 5.67 ± 0.58
b
10 11.87 ± 0.12 b 9.67 ± 0.58
c
15 14.67 ± 0.58 c 12.07 ± 0.12
d
20 15.67 ± 0.58 c 17.80 ± 0.72
f
Falafel
0 6.47 ± 0.50 b 4.33 ± 0.58
a
5 5.00 ± 1.00 a 5.80 ± 0.72
b
10 6.93 ± 0.31 b 7.27 ± 0.31
c
15 12.33 ± 0.58 c 7.13 ± 0.81
c
20 13.53 ± 0.5 1 d 10.47 ± 0.51
d
Mean ± SD followed by different letters were significantly different (p<0.05).
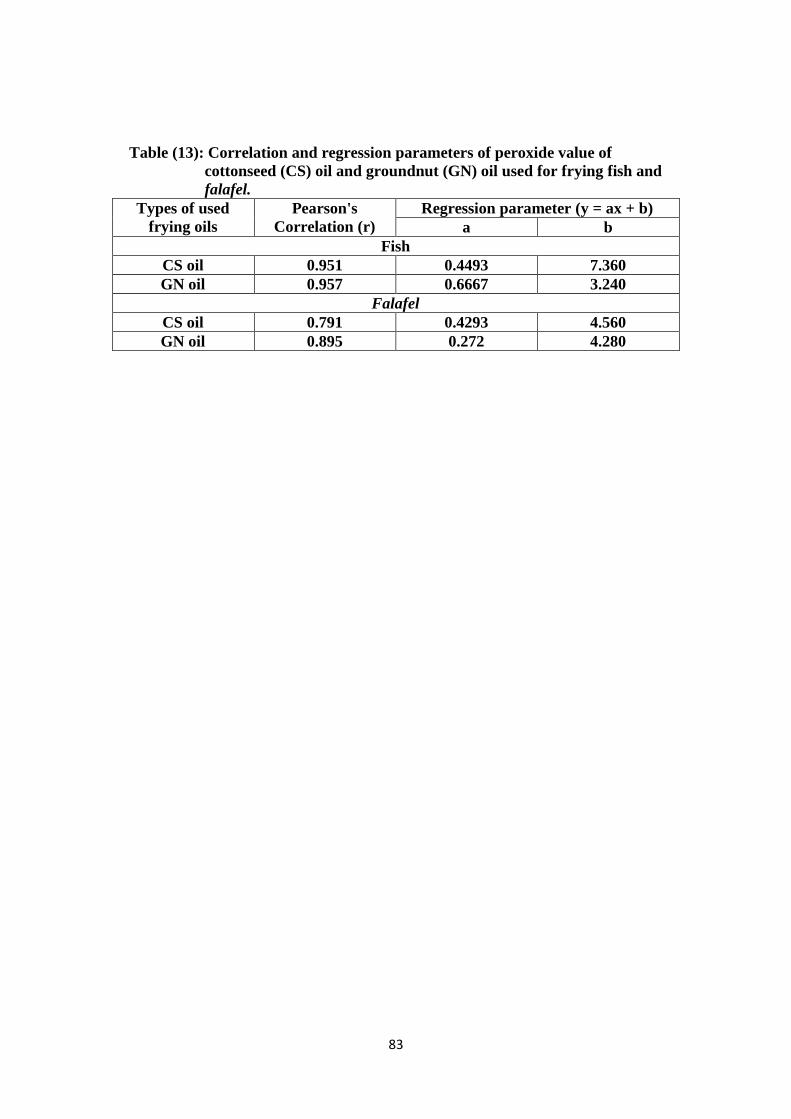
83
Table (13): Correlation and regression parameters of peroxide value of
cottonseed (CS) oil and groundnut (GN) oil used for frying fish and
falafel.
Types of used
frying oils
Pearson's
Correlation (r)
Regression parameter (y = ax + b)
a b
Fish
CS oil 0.951 0.4493 7.360
GN oil 0.957 0.6667 3.240
Falafel
CS oil 0.791 0.4293 4.560
GN oil 0.895 0.272 4.280

84
The P.V is a good measure of oxidation under normal conditions, but when used on
oils during frying it can be very misleading because peroxides are unstable radicals. It
is formed from triglycerides and very sensitive to frying oil temperature. The P.V
only rises during the subsequent cooling, sampling and storage of the oil (Pantizaris,
1999).
Hasson (2012) reported that CS oil initially had P.V of 2.50 meq/kg and finally after
70 hr of frying falafel it reached 22.5 .While Emin and Buket (2011) reported that
sunflower oil, corn oil, olive oil and others, their peroxide value ranged from 2.5 for
the initial oil and reach 59.06 after one month. This also similar to the findings of the
present study, the initial/fresh CS oil reflected P.V (6.47) higher than GN oil (4.33).
As mentioned earlier, the P.V is a valuable measure of primary lipid oxidation. The
P.Vs of fresh oils are <10 mEq/kg. Metallic impurities particularly, Cu it is pro-
oxidants and are undesirable in oils. The Cu was measured in CS oil (254 ppb) and
(174 ppb) in GN oil (Figs. 5, 6, 7 and 8). The presence of Cu ions were accelerated
the rate of peroxide formation in the oil, while the presence of natural antioxidants for
example tocopherols and synthetic anti-oxidants in refined GN oil inhibit the
formation of peroxides.
Nittaya (2008) revealed that the P.V of palm olein oil, rice bran oil and soybean oil,
was gradually increased during frying process. The P.Vs were ranged between (4.21-
7.36 meq/kg) during the 20th cycle of three studied oil. Older study by Chang et al.
(1978) reported that the P.V of CS oil during deep frying increased until frying for 12
hr, and then it fell after frying for 30 hr and increased again after frying for 60 hr.
This also close to the results of present study, the P.V of the two studied frying oils,
CS oil and GN oil was gradually increased and ranged between (6.47-15.67 meq/kg)
and (4.33-17.80 meq/kg), respectively during the 20 cycles of frying (Table 12).
4.4.3 Total polar compounds
The total polar compounds (TPCs) were determined in the initial/fresh frying oil, 5th
,
10th
, 15th
and 20th
frying cycle number of CS oil and GN oil used for frying fish and
falafel. The TPCs results are presented in Table 14. The TPC of the initial oils of CS
oil and GN oil were 5.52% and 1.66%, respectively. The CS oil showed a higher
grand mean of TPC than GN oil, which proved to be significantly different (p<0.05).
The TPC of CS oil increased from 5.52% to 6.43%, whereas that of GN oil increased
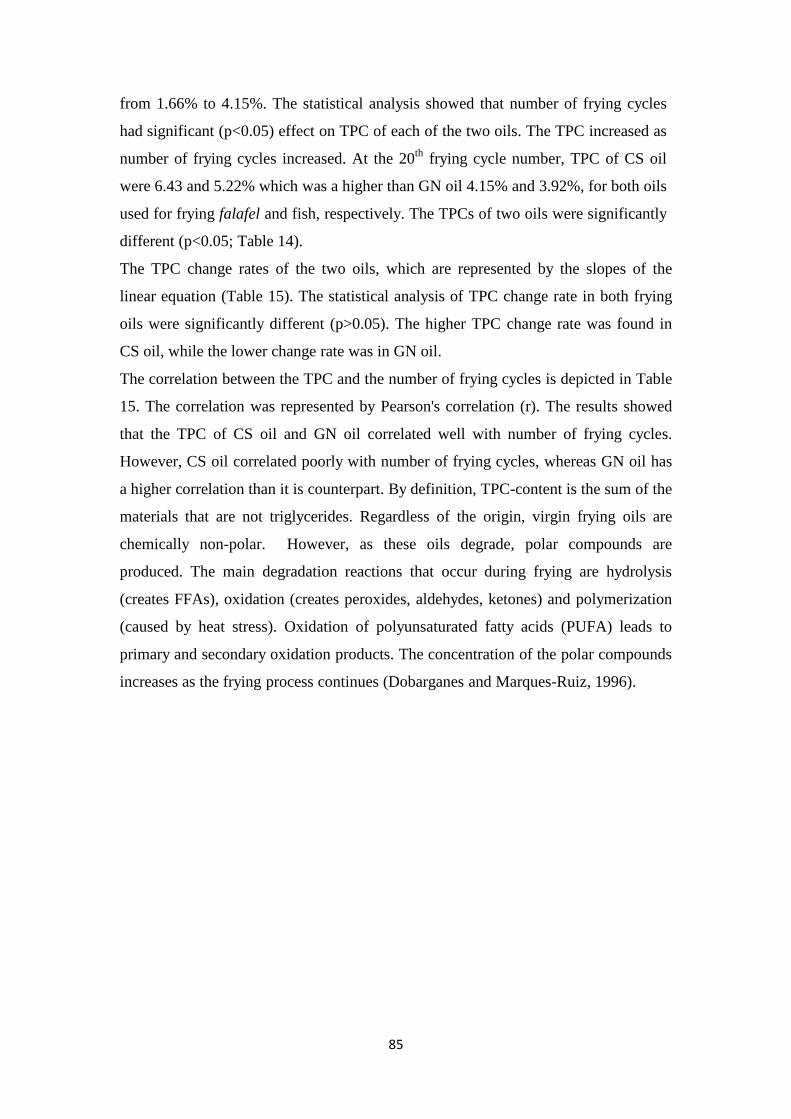
85
from 1.66% to 4.15%. The statistical analysis showed that number of frying cycles
had significant (p<0.05) effect on TPC of each of the two oils. The TPC increased as
number of frying cycles increased. At the 20th
frying cycle number, TPC of CS oil
were 6.43 and 5.22% which was a higher than GN oil 4.15% and 3.92%, for both oils
used for frying falafel and fish, respectively. The TPCs of two oils were significantly
different (p<0.05; Table 14).
The TPC change rates of the two oils, which are represented by the slopes of the
linear equation (Table 15). The statistical analysis of TPC change rate in both frying
oils were significantly different (p>0.05). The higher TPC change rate was found in
CS oil, while the lower change rate was in GN oil.
The correlation between the TPC and the number of frying cycles is depicted in Table
15. The correlation was represented by Pearson's correlation (r). The results showed
that the TPC of CS oil and GN oil correlated well with number of frying cycles.
However, CS oil correlated poorly with number of frying cycles, whereas GN oil has
a higher correlation than it is counterpart. By definition, TPC-content is the sum of the
materials that are not triglycerides. Regardless of the origin, virgin frying oils are
chemically non-polar. However, as these oils degrade, polar compounds are
produced. The main degradation reactions that occur during frying are hydrolysis
(creates FFAs), oxidation (creates peroxides, aldehydes, ketones) and polymerization
(caused by heat stress). Oxidation of polyunsaturated fatty acids (PUFA) leads to
primary and secondary oxidation products. The concentration of the polar compounds
increases as the frying process continues (Dobarganes and Marques-Ruiz, 1996).
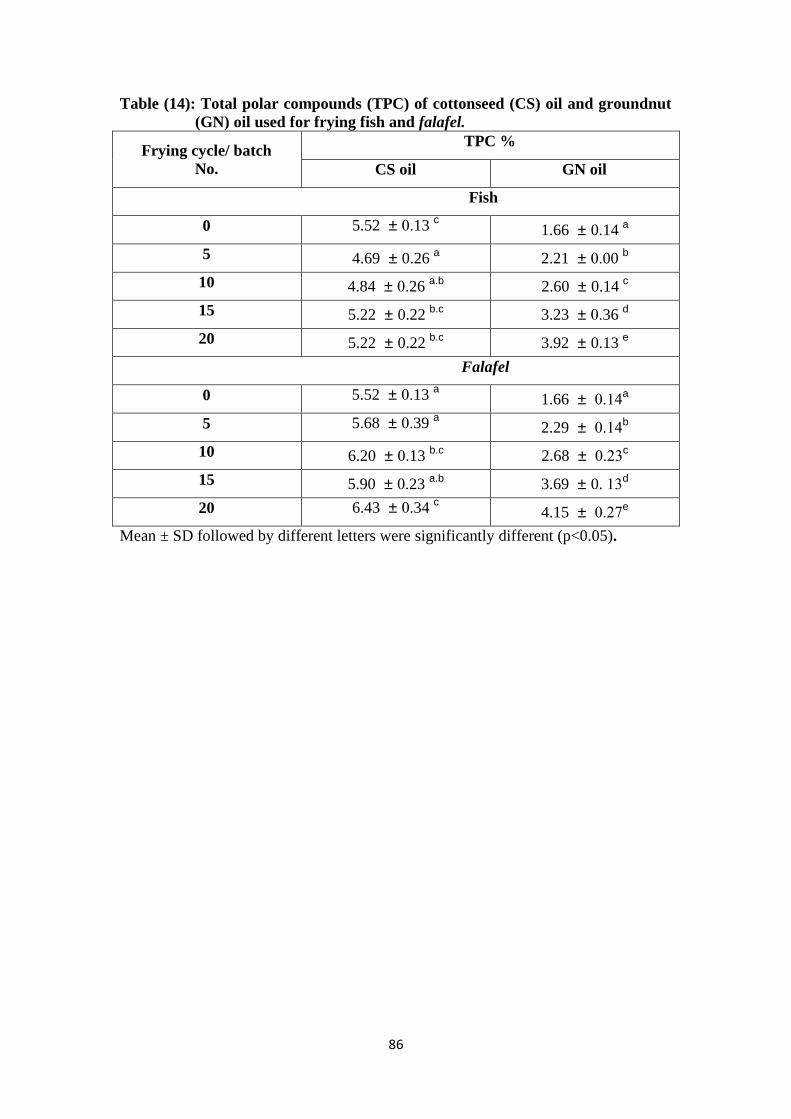
86
Table (14): Total polar compounds (TPC) of cottonseed (CS) oil and groundnut
(GN) oil used for frying fish and falafel.
Frying cycle/ batch
No.
TPC %
CS oil GN oil
Fish
0 5.52 ± 0.13 c 1.66 ± 0.14
a
5 4.69 ± 0.26 a 2.21 ± 0.00
b
10 4.84 ± 0.26 a.b 2.60 ± 0.14
c
15 5.22 ± 0.22 b.c 3.23 ± 0.36
d
20 5.22 ± 0.22 b.c 3.92 ± 0.13
e
Falafel
0 5.52 ± 0.13 a 1.66 ± 0.14
a
5 5.68 ± 0.39 a 2.29 ± 0.14
b
10 6.20 ± 0.13 b.c 2.68 ± 0.20
c
15 5.90 ± 0.23 a.b 3.69 ± 0. 10
d
20 6.43 ± 0.34 c 4.15 ± 0.27
e
Mean ± SD followed by different letters were significantly different (p<0.05).

87
Table (15): Correlation and regression parameters of total polar compound of
cottonseed (CS) oil and groundnut (GN) oil used for frying fish and
falafel.
Types of used
frying oils
Pearson's
Correlation (r)
Regression parameter (y = ax + b)
a B
Fish
CS oil 0.0012 0.0015 5.1139
GN oil 0.9905 0.1106 1.6195
Falafel
CS oil 0.7502 0.0407 5.5399
GN oil 0.9822 0.1275 1.6203
88
In present study CS is polyunsaturated oil (Richard et al., 2005), so it tends to produce
TPC more than refined GN oil which is monounsaturated oil (Richard et al., 2005), and
had a natural and artificial antioxidants and lower level of Cu (174ppb), when compared
to CS oil (254 ppb; Figs. 5, 6, 7 and 8).
Hui (1996) reported that TPC is considered as one of the standard method for
determination of extent of deterioration in frying oils. It includes all partially
oxidized triglycerides, non-triglycerides, lipids and other materials soluble in,
emulsified in, or suspended particulates in the frying oil.
Several studies emphasized the importance of the TPC during frying. Dobarganes
and Marques-Ruiz (1996) reported about factors of TPC content they found that the
TPC ratio increased with the period of heating or the number of frying operations in
discontinuous frying with slow or no turnover and the degree of unsaturation in the
frying oil. These have effect on the amount of TPC generated. Hasson (2012)
reported that CS oil initially had TPC of 6.01% and finally after 70 hr of frying
falafel reached 31.99%. In the other hand, Emin and Buket (2011) reported that
sunflower oil, corn oil, olive oil and others, showed TPC ranged between 9.25% for
initial oil and reached 50.25% after one month. This also agreed with the present
study results, where the initial CS oil had TPCs (5.52%) higher than GN oil (1.66%).
Nittaya (2008) revealed that the TPC of palm olein oil, rice bran oil and soybean oil
was gradually increased and ranged between (2.98- 6.69) during the 20 cycles of
frying banana slices.
Bastida and Sanchez-Muniz (2002) reported changes in polar compound of olive oil,
sunflower oil and blend of these oils. These changes were related to the number of
frying cycles, uses were fitted to different curvilinear models. Houhoula et al. (2003)
studied the effect of the process time and the temperature on the accumulation of
polar compounds in CS oil during deep-fat frying. They found that the content of
polar compounds increased linearly with the process time. Bheemreddy et al. (2002)
reported that TPC contents of frying oil increased with number of frying cycles.
Sanibal and Mancini-Filho (2004) reported that TPC in soybean oil and partially
hydrogenated soybean oil increased significantly during number of frying cycles. The
authors suggested that TPC in frying oil were composed of breakdown products, non-
volatile oxidized derivatives, polymeric and cyclic substances produced in the course
of deep-frying microparticu1ates, and soluble components from the food fried in this
oil. Therefore, TPC-content of frying oil has been proposed as a good indicator of
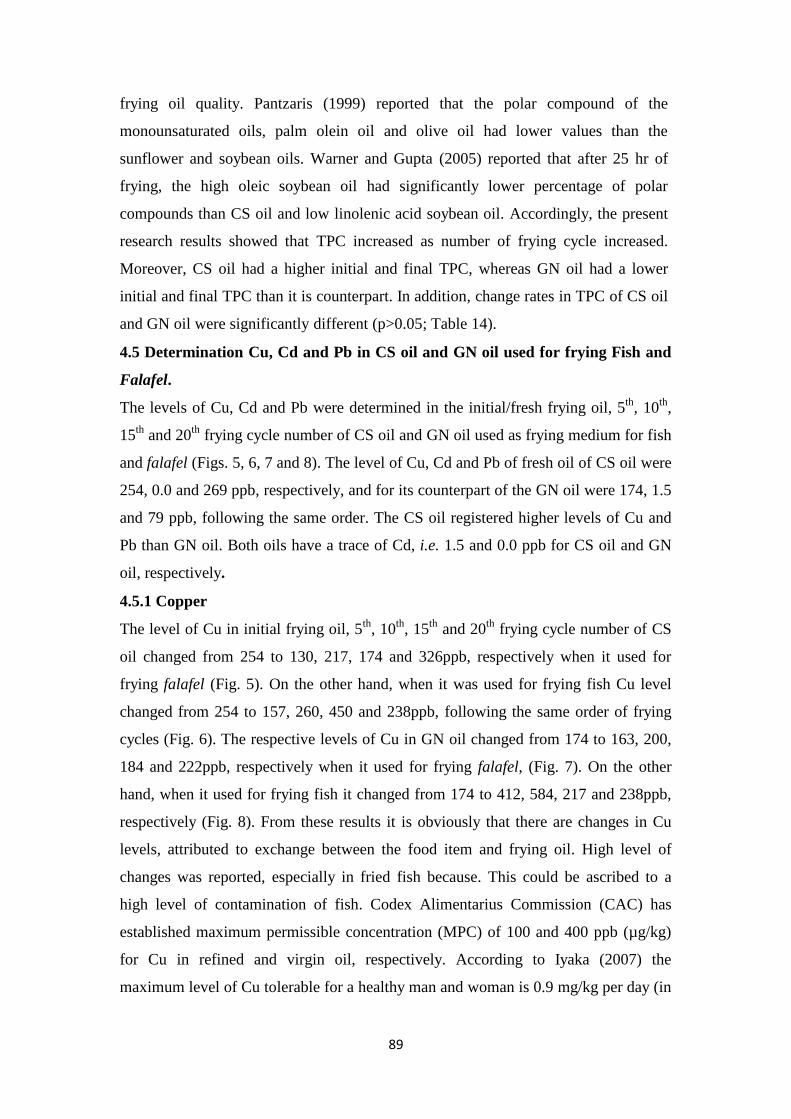
89
frying oil quality. Pantzaris (1999) reported that the polar compound of the
monounsaturated oils, palm olein oil and olive oil had lower values than the
sunflower and soybean oils. Warner and Gupta (2005) reported that after 25 hr of
frying, the high oleic soybean oil had significantly lower percentage of polar
compounds than CS oil and low linolenic acid soybean oil. Accordingly, the present
research results showed that TPC increased as number of frying cycle increased.
Moreover, CS oil had a higher initial and final TPC, whereas GN oil had a lower
initial and final TPC than it is counterpart. In addition, change rates in TPC of CS oil
and GN oil were significantly different (p>0.05; Table 14).
4.5 Determination Cu, Cd and Pb in CS oil and GN oil used for frying Fish and
Falafel.
The levels of Cu, Cd and Pb were determined in the initial/fresh frying oil, 5th
, 10th
,
15th
and 20th
frying cycle number of CS oil and GN oil used as frying medium for fish
and falafel (Figs. 5, 6, 7 and 8). The level of Cu, Cd and Pb of fresh oil of CS oil were
254, 0.0 and 269 ppb, respectively, and for its counterpart of the GN oil were 174, 1.5
and 79 ppb, following the same order. The CS oil registered higher levels of Cu and
Pb than GN oil. Both oils have a trace of Cd, i.e. 1.5 and 0.0 ppb for CS oil and GN
oil, respectively.
4.5.1 Copper
The level of Cu in initial frying oil, 5th
, 10th
, 15th
and 20th
frying cycle number of CS
oil changed from 254 to 130, 217, 174 and 326ppb, respectively when it used for
frying falafel (Fig. 5). On the other hand, when it was used for frying fish Cu level
changed from 254 to 157, 260, 450 and 238ppb, following the same order of frying
cycles (Fig. 6). The respective levels of Cu in GN oil changed from 174 to 163, 200,
184 and 222ppb, respectively when it used for frying falafel, (Fig. 7). On the other
hand, when it used for frying fish it changed from 174 to 412, 584, 217 and 238ppb,
respectively (Fig. 8). From these results it is obviously that there are changes in Cu
levels, attributed to exchange between the food item and frying oil. High level of
changes was reported, especially in fried fish because. This could be ascribed to a
high level of contamination of fish. Codex Alimentarius Commission (CAC) has
established maximum permissible concentration (MPC) of 100 and 400 ppb (µg/kg)
for Cu in refined and virgin oil, respectively. According to Iyaka (2007) the
maximum level of Cu tolerable for a healthy man and woman is 0.9 mg/kg per day (in
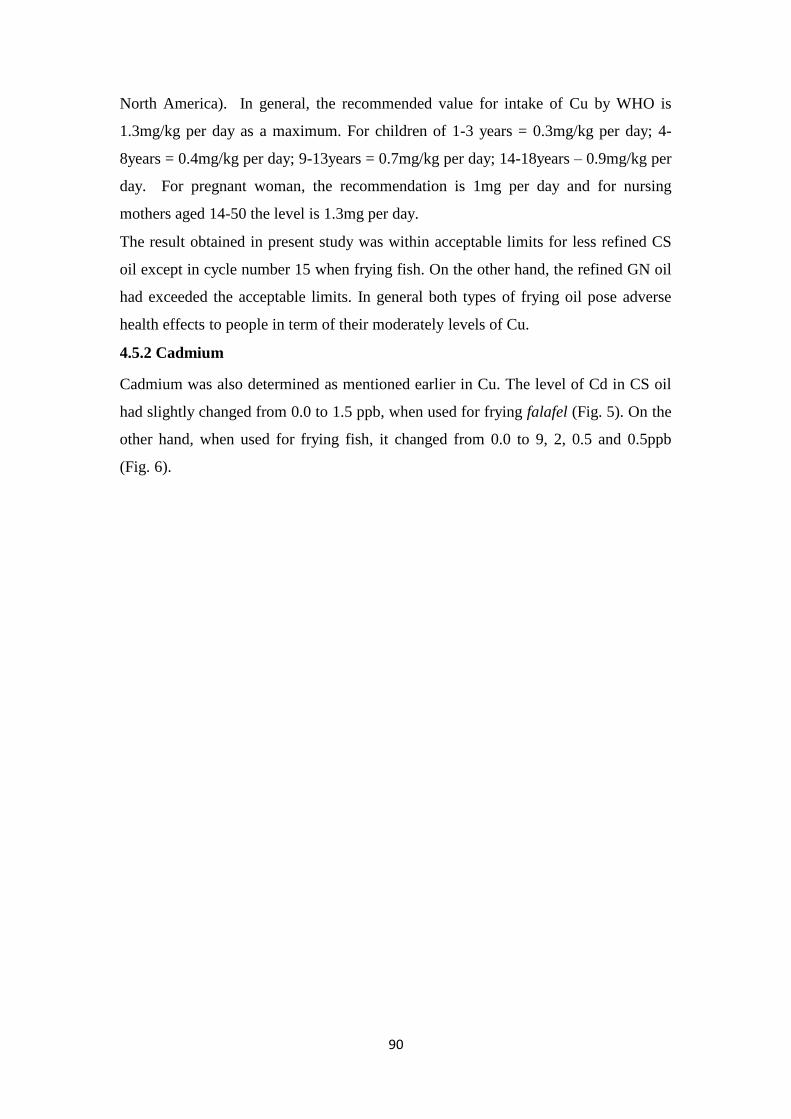
90
North America). In general, the recommended value for intake of Cu by WHO is
1.3mg/kg per day as a maximum. For children of 1-3 years = 0.3mg/kg per day; 4-
8years = 0.4mg/kg per day; 9-13years = 0.7mg/kg per day; 14-18years – 0.9mg/kg per
day. For pregnant woman, the recommendation is 1mg per day and for nursing
mothers aged 14-50 the level is 1.3mg per day.
The result obtained in present study was within acceptable limits for less refined CS
oil except in cycle number 15 when frying fish. On the other hand, the refined GN oil
had exceeded the acceptable limits. In general both types of frying oil pose adverse
health effects to people in term of their moderately levels of Cu.
4.5.2 Cadmium
Cadmium was also determined as mentioned earlier in Cu. The level of Cd in CS oil
had slightly changed from 0.0 to 1.5 ppb, when used for frying falafel (Fig. 5). On the
other hand, when used for frying fish, it changed from 0.0 to 9, 2, 0.5 and 0.5ppb
(Fig. 6).
91
Figure (5): Levels (ppb) of copper, cadmium and lead determined in cottonseed
oil used for frying falafel, for initial frying oil, 5th
, 10th
, 15th
and 20th
frying cycle
number.
254
130
217
174
326
0 0 0 0 1.5
269
159
79 79
159
0
50
100
150
200
250
300
350
C0 C5 C10 C15 C20
pp
b
Cycle No.
Cu
Cd
Pb
92
Figure (6): Levels (ppb) of copper, cadmium and lead determined in
cottonseed oil used for frying Fish, for initial frying oil, 5th
, 10th
, 15th
and 20th
frying cycle number.
254
157
260
450
238
0 9 2 0.5 0.5
269 238
200
159
202
0
50
100
150
200
250
300
350
400
450
500
C0 C5 C10 C15 C20
pp
b
Cycle No.
Cu
Cd
Pb
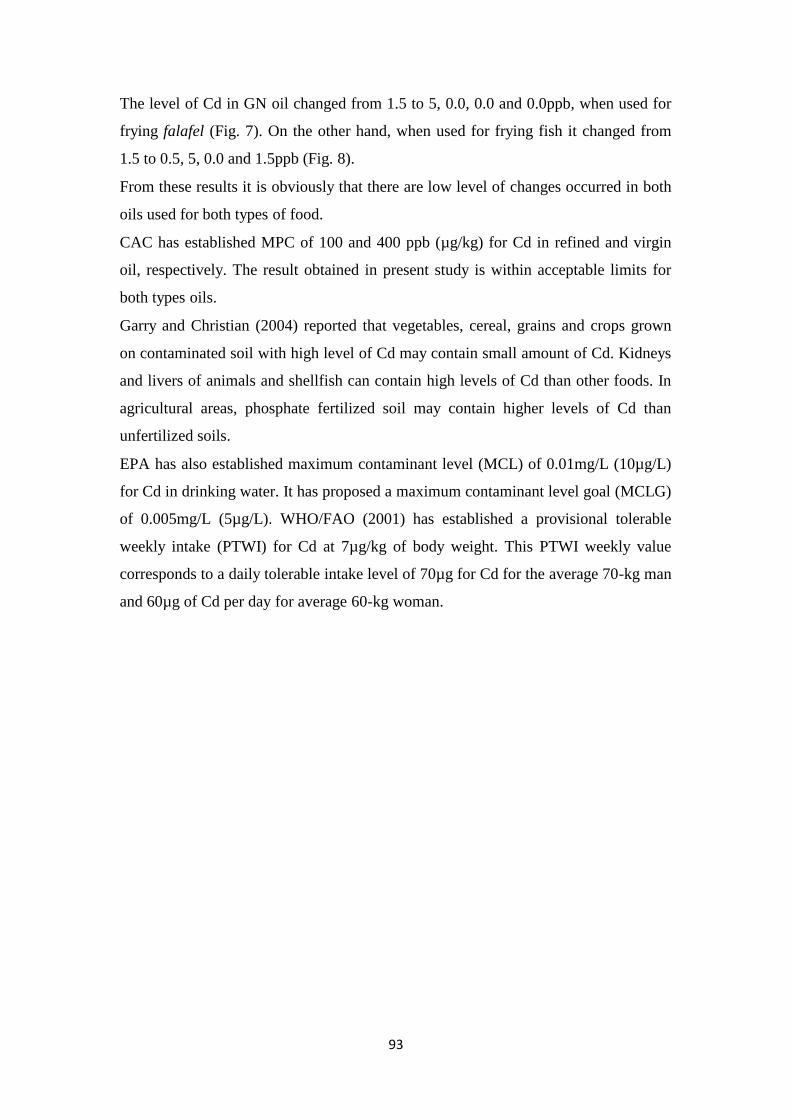
93
The level of Cd in GN oil changed from 1.5 to 5, 0.0, 0.0 and 0.0ppb, when used for
frying falafel (Fig. 7). On the other hand, when used for frying fish it changed from
1.5 to 0.5, 5, 0.0 and 1.5ppb (Fig. 8).
From these results it is obviously that there are low level of changes occurred in both
oils used for both types of food.
CAC has established MPC of 100 and 400 ppb (µg/kg) for Cd in refined and virgin
oil, respectively. The result obtained in present study is within acceptable limits for
both types oils.
Garry and Christian (2004) reported that vegetables, cereal, grains and crops grown
on contaminated soil with high level of Cd may contain small amount of Cd. Kidneys
and livers of animals and shellfish can contain high levels of Cd than other foods. In
agricultural areas, phosphate fertilized soil may contain higher levels of Cd than
unfertilized soils.
EPA has also established maximum contaminant level (MCL) of 0.01mg/L (10µg/L)
for Cd in drinking water. It has proposed a maximum contaminant level goal (MCLG)
of 0.005mg/L (5µg/L). WHO/FAO (2001) has established a provisional tolerable
weekly intake (PTWI) for Cd at 7µg/kg of body weight. This PTWI weekly value
corresponds to a daily tolerable intake level of 70µg for Cd for the average 70-kg man
and 60µg of Cd per day for average 60-kg woman.
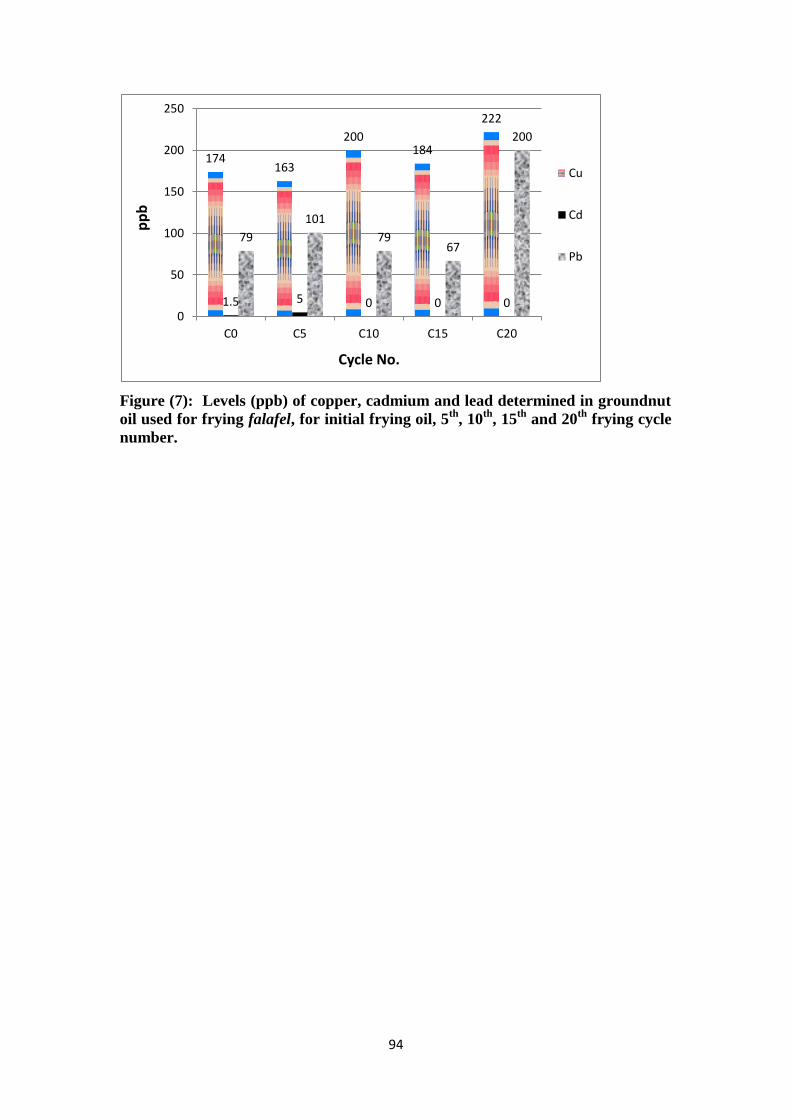
94
Figure (7): Levels (ppb) of copper, cadmium and lead determined in groundnut
oil used for frying falafel, for initial frying oil, 5th
, 10th
, 15th
and 20th
frying cycle
number.
174 163
200 184
222
1.5 5 0 0 0
79
101
79 67
200
0
50
100
150
200
250
C0 C5 C10 C15 C20
pp
b
Cycle No.
Cu
Cd
Pb
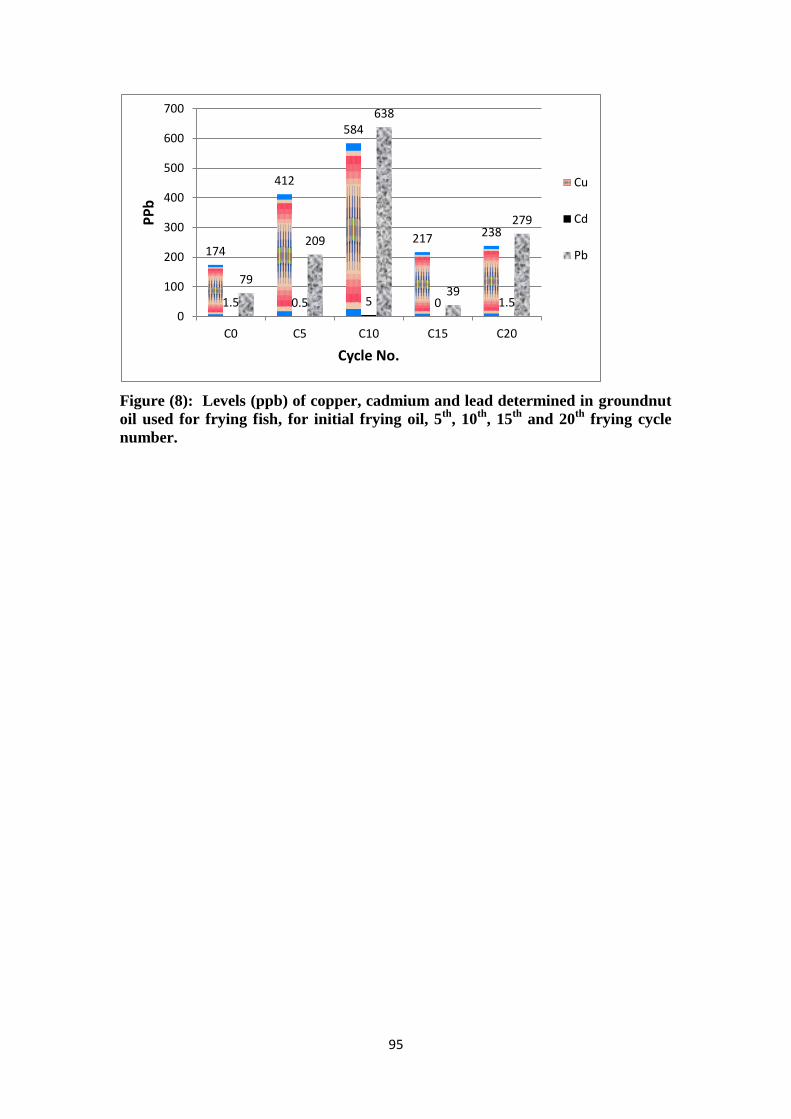
95
Figure (8): Levels (ppb) of copper, cadmium and lead determined in groundnut
oil used for frying fish, for initial frying oil, 5th
, 10th
, 15th
and 20th
frying cycle
number.
174
412
584
217 238
1.5 0.5 5 0 1.5
79
209
638
39
279
0
100
200
300
400
500
600
700
C0 C5 C10 C15 C20
PP
b
Cycle No.
Cu
Cd
Pb

96
4.5.3 Lead
The level of Pb in all specified frying cycles of CS oil changed from 269 to 159, 79,
79 and 159ppb, respectively, when used for frying falafel (Fig. 5). On the other hand,
when it used for frying fish it changed from 269 to 238, 200, 159 and 202 ppb,
respectively (Fig. 6). The level of Pb in GN oil changed from 79 to 101, 79, 67 and
200 ppb, respectively, when it used for frying falafel (Fig. 7). On the other hand,
when it used for frying fish, it changed from 79 to 209, 638, 39 and 279 ppb,
respectively (Fig. 4.8). From the present work results, it is obviously that changes in
Pb levels caused by the exchange between the food item and the frying oil; it showed
high level of changes, especially when fish is the item, due to the level of
contamination.
CAC has established MPC of 100 ppb (µg/kg) for lead in edible oil. Ali et al. (2005)
stated that lead level of 10µg/dL or above is a cause for concern. Pb has harmful
health effects even at lower levels and there is no known safe exposure level. This
means that even the low concentration of lead present in the vegetable oil is harmful,
if the oil samples are consumed for a very long period of time, since Pb can show an
accumulated harmful effect. There is, therefore, need to improve the quality of oils by
limiting the oil samples to the lowest possible Pb level.
In addition, exposure to amount of lead above 0.01mg/L is detrimental to health, as it
may result in possible neurological damage to fetuses, abortion and other
complication in children under three years old (Codex Alimentarius Commission,
2001).
Vegetable oils and fats contain trace levels of various metals depending on many
factors, e.g. species, soil used for cultivation, irrigation water, variety and stage of
maturity, pollution, mode of processing, storage, and contaminations. These metals
may enter the food material from the soil through uptake of the mineral by the crops,
food processing and environmental contamination (as in application of fertilizer).
Metals play important negative and positive role in human life (Codex Alimentarius
Commission, 2001).
From the results obtained, the levels are exceeded the MPC. Thus, many metals can
bio-accumulate in human systems, hence careful and proper processing of raw
materials, storage and exposure to the general environment should be strictly
followed and monitored.
97
The present results were close to the results of study conducted by Asemave et al.
(2012) who reported that samples of palm oil, GN oil and soybean oil (Makurdi town
– Nigeria), which were analyzed for Cu, Fe, Cr, Al, Pb and Cd, reflected the
following data. Palm oil: 11.370, 0.078, 2.3319, 0.1780, 1.9358, and 0.0220 mg/kg,
respectively, for Fe, Cu, Cr, Pb, Al and Cd. GN oil: 8.5109, 0.0633, 2.7067, 0.1631,
1.7742 and 0.0207mg/kg, respectively, for the same metals. Soybean oil: 8.7519,
0.0475, 1.7559, 0.1631, 0.3837, and 0.0200 for Fe, Cu, Cr, Pb, Al and Cd, following
the same order of elements.
The present results are even closer to Fangkun et al. (2011) results regarding eight
heavy metals, namely Cu, Zn, Fe, Mn, Cd, Ni, Pb and As, in nine varieties of edible
vegetable oils collected from China. The concentrations reported by the authors were
in the range of 0.214–0.875(Cu), 0.742–2.56(Zn), 16.2–45.3(Fe), 0.113–0.556(Mn),
0.026–0.075(Ni), 0.009–0.018(Pb) and 0.009–0.019(As) ppm (µg/g). Cd was found to
be 2.64–8.43 ppb (µg/kg).

98
CHAPTER V
CONCLUSIONS and RECOMMENDATIONS
5.1 CONCLUSIONS
In general, the changes in frying oils analyzed in the present study proved to be
acceptable in terms of quality, and consequently may not pose important health hazard.
The TPC, AV and FFA% did not go over the standard value of 25%, 4.5 and 2.5%
respectively, among the two types of frying oils, but the prolonged use of thermally
deteriorated frying oils especially in restaurants sector would be risky for consumers
due to increase in the oil degraded compounds. Refined GN oil was more stable than CS
oil. However, statistical analysis showed that these changes of studied oils were not
significantly different (p>0.05). Interestingly, very good linear correlation of the
chemical parameters, e.g. TPC, AV and FFA of the oils (r>0.91) with frying cycle
number, was detected in both oils, except TPC, which poorly correlated when CS oil
was investigated. On the other hand, as far as physical parameters is concerned,
viscosity has a good linear correlation (r>0.84) with frying cycle number, but color was
poorly correlated (r = 0.0029 - 0.91). This linear correlation may suggest that a simple
estimation of the physical property of the oil would be able to access its chemical
property, but color index result may be misleading. The number of the frying cycles and
the type of the oil are the important factors concerning the change in the physical and
chemical qualities of frying oils in the present study when frying fish and falafel.
Unfortunately in general, consumer panelists they could not differentiate well between
fried fish and falafel in term of quality, in spite of chemical deterioration of the frying
oils. The survey has indicated that the attitudes and the practices associated with frying
the frying process in the home sector were found acceptable and, consequently, may not
pose serious health hazard, except in the reuse of deteriorated frying oil for wiping
Kisra pan's (Saj) and cooking food. However, it was concluded that in local restaurants
sector a great hazard practices in term of, prolonged use of thermally deteriorated frying
oils, storing of remained oil in fryer, topping it with fresh oil in next day and pouring
waste oil into pipeline/sewage is a common practice in both sectors. These were quite
important for public health and environment.
All results of heavy metals levels and chemical parameters were within the limits of the
accepted values by regulatory bodies, except lead. However, these metals may be at

99
least reduced by not exposing the vegetable oils during and after processing to
contaminated materials. Hence these oils are safe for consumption except for limits of
Pb and Cu it is not safe.
5.2 RECOMMENDATIONS
Based on the present study findings it is recommended that:
i. Physical parameters including the color index and viscosity were not suitable
to describe the quality of frying oil, but provide rather rough reference point
for its evaluation.
ii. Chemical parameters including the determination of FFA, AV and PV are not
suitable for the determination of the degradation condition. Only the
determination of the TPC permits an objective evaluation of frying oil
degradation.
iii. In this study, the best proper frying oil is the GN oil when compared with CS
oil. Because the GN oil reflected the least rate of change in the physical and
the chemical qualities. However, the selection of frying oil should be based on
other factors, e.g. type of fried food, condition of frying … etc.
iv. Sensory evaluation of fried falafel and fish is not a sensitive method to check
deterioration of frying oil. It is only suitable to determine degree of acceptance
of final product.
v. Establishment of information services/centers for the industry on technologies
and ways and means to mitigate, prevent or reduce and eliminate pollution by
heavy metals.
vi. Production of fried foods at both big industries and local level should be done
by using stainless steel equipment.
vii. Subsequent research work should be carried out by relevant ministries to
identify and control the levels of metals present in the edible oil.
viii. The future study should concentrate on other promising oils and different types
of Sudanese’s foods.
ix. The food industry, professional societies and the academic community should
make an effort to educate consumers, caterers and retailers on proper cooking
methods and food handling.
100
x. Establishment of our own regulations about frying oil quality and correlated
this with internationally recognized standards.
xi. The use of objective tests for monitoring frying oil quality are recommended.
It should be legal, sensitive, precise, safe, easy, rapid and not costly.
xii. Encourage and support basic research focused on understanding the dynamics
of deep-fat frying and the frying process. Research should be cross-discipline
encompassing oil chemistry, food engineering, sensory science, food
chemistry, food toxicology and nutritional sciences.
xiii. Encourage and support research focused on finding out the suitable ways for
discarding deteriorated frying oils or even find useful ways for using it in for
example bio-diesel.
101
6. REFERENCES
Ali, N.; Oniye, S. J.; Balarabe, M. L. and Auta, J. (2005). Concentration of
Fe, Cu, Cr, Zn, and Pb in Makera – Drain, Kaduna, Nigeria. J. Chem Class,
Vol. 2, 69 – 73.
Allen L.B.; Siitonen P.H. and Thompson H.C. (1998). Determination of
copper, lead, cadmium and nickel in edible oils by plasma and furnace atomic
absorption spectroscopies. J. Am Oil Chem. Soc. 75, 477–481.
Anonymous, (2010). Cottonseed oil. National Cottonseed
ProductsAssociation.http://www.cottonseedoiltour.com/pdf/NCPA_CSOFAC
TSHEET_03.pdf.
AOCS official Method Cc 13e–92 (2004). “Official methods and
recommended practices of the AOCS”. 6th Edition, American Oil Chemists
Society, Champaign, Illinois.
AOCS official Method Cd 3a–63 (1989). Acid value sampling and analysis
of commercial fats and oils. Champaign, Illinois: J. American Oil Chemist
Society.
ARS -Agricultural Research Service, (2011). Types of oils and their
characteristics, U.S. Department of Agriculture, Washington DC.
Asemave, K.; Ubwa, S.T.; Anhwange, B. A. and Gbaamende A. G. (2012).
Comparative Evaluation of Some Metals in Palm Oil, Groundnut Oil and
Soybean Oil from Nigeria. Int. J. Modern Chem., ISSN: 2165-0128 Florida,
USA. 1(1): 28-35.
Baixauli, R.; Salvador, A.; Fiszman, SM. And Calvo, C. (2002). Effect of
oil degradation during frying on the color of fried, battered squid rings. J. Am.
Oil Chem. Soc.; 79(11):1127-1131.
Bastida, S. and Sanchez-Mtmiz, F.J. (2002). Polar content vs. TAG
oligomer content in the frying-life assessment of monounsaturated and
polyunsaturated oils used in deep-frying. J Am. Oil Chem. Soc.; 79(5):447-
451.
102
Bennet, R.M. (2001). Managing potato crisp processing. In: Rossell JB.
(Eds.). Frying Improving quality. 1st ed. Cambridge: Woodhead Publishing
Limited, p.215-235.
Bheemreddy, R.M.; Chinnan, M.S.; Pannu, K.S. and Reynolds A.E.
(2002). Active treatment of frying oil for enhanced fry-life. J. Food Sci.;
67(4): 1478-1484.
Blumenthall, M.M. (1991). A new look at the chemistry and physics of
deep-fat frying. J. of Food Technol. 45(2): 68-71, 94.
Bouchon, P.; Aguilera, J.M. and Pyle, D.L. (2003). Structure oil-
Absorption Relationships during deep-fat frying. J Food Sci., 68(9):2711-
2716.
Buldini, P.L.; Ferri, D. and Sharma, J.L. (1997). Determination of some
inorganic species in edible vegetable oils and fats by ion chromatography. J.
Chromatogr. A, 789, 549–555.
Carpenter, R.P.; Lyon, D.H. and Hasdell, T.A. (2000). Guidelines for
Sensory Analysis in Food Product Development and Quality Control.
Gaithersburg: Aspen Publishers, Inc. , pp: 71-91.
Casimir, C. and David, B. (2008). Food lipids: chemistry, nutrition, and
biotechnology. 3rd ed., p. 391- 392.
Chang, S.S.; Peterson, R.J. and HO, C.H. (1978). Chemical reactions
involved in the deep-fat frying of foods. JAOCS; 5(Oct):718-727.
Chen, C.H.; Budas, G.R.; Churchill, E.N.; Disatnik, M.H.; Hurley, T.D
and Mochly-Rosen, D. (2008). Activation of aldehyde dehydrogenase-2
reduces ischemic damage to the heart. J. Science 321:1493-5.
Codex Alimentarius Commission (FAO/WHO) (2001). Food additives and
contaminants. Joint FAO/WHO Food Standards Program; ALINORM
01/12A, 1-289.
Crevel, R.W.; Kerkhoff, M.A. and Koning, M.M. ( 2000). Allergenicity of
refined vegetable oils. J. Food and Chemical Toxicology, 38 (4): 385–393.
David, R. Erickson (1990). Edible fats and oils processing: basic principles
and modern practices: world conference proceedings. Published by American
Oil Chemists' Society. ISBN 10 0935315306 pp442.

103
Demirbas, A. (2001). Concentrations of 21 metals in 18 species of
mushrooms growing in the East Black Sea region. J. Food Chem. 75, 453–
457.
Dobarganes, M.C. and Marques-Ruiz, G. (1996). Dimeric and higher
oligomeric triglycerides, In: Parkins EG, Michael DE. (Eds.). Deep frying:
Chemistry, Nutrition, and Practical Applications. USA: AOCS Press; 89-111.
Duke, J.A. (1981). Handbook of legumes of world economic importance.
Plenum Press, New York. p. 52-57.
El-Shahawi, M.S.; Hamza, A.; Bashammakhb, A.S. and Al-Saggaf, W.T.
(2010). An overview on the accumulation, distribution, transformations,
toxicity and analytical methods for the monitoring of persistent organic
pollutants. J. Talanta. Vol:80, 1587–1597.
Emin, Y. and Buket, A. (2011). Quantitative assessment of frying oil quality
in fast food restaurants. J. GIDA, 36 (3): 121-127.
Erol, P.; Gulsin, A.; Fethiye, G.; Turkan, A. and Musa, Ö. (2008).
Determination of some inorganic metals in edible vegetable oils by
inductively coupled plasma atomic emission spectroscopy (ICP-AES). J.
GRASAS Y ACEITES, 59 (3), 239-244, 2008, ISSN: 0017-3495.
Esterbauer, H.; Schaur, R.J. and Zollner, H. (1991). Chemistry and
biochemistry of 4-hydroxynonenal, malonaldehyde and related aldehydes. J.
Free Rad. Biol. Med., 11:81-128.
Fan, J.; Singh, R.P. and Pinthus, E. J. (1997). Physicochemical changes in
starch during deep fat frying of a molded corn starch patty. Journal of Food
Processing and Preservation, 21: 443–460.
Fangkun, Z.; Wenxiu, F.; Xuejing, W.; Li Qu and Shuwen, Y. (2011).
Health risk assessment of eight heavy metals in nine varieties of edible
vegetable oils consumed in China. J. Food and Chemical Toxicology 49
(2011) 3081–3085.
Fellow, P. (2000). Food processing technology Principles and practice. 2nd
ed. Cambridge: Woodhead Publishing Limited; p. 353-362.
Fellows, P. and Hampton, A. (1992). Fish and fish products. Chapter 11.
Intermediate Technology Publications, FAO, Rome. ISBN 1 85339 108 5.
104
Garrido, D.M.; Frias, I.; Diaz, C. and Hardisson, A. (1994).
Concentrations of metals in vegetable edible oil. J. Food Chem. 50, 237-243.
Garry, O. and Christian N., (2004). Analytical Chemistry 6th Edition,
Matric Publishing Service, 525.
Goburdhum, D. and Jhurree, B. (1995). Effect of deep-fat flying on fat
oxidation in soybean oil. Int. J. Food Sci. Nutr., 46:363-37l.
Guillaumin, R. (1988). Kinetics of fat penetration in food, In: Frying of Food,
Principles, Changes, New Approaches. Chichester: Elli Horwood, England, p.
82.
Guillén, M. D.; Cabo, N.; Ibargoitia, M. L., and Ruiz, A. (2005). Study of
both sunflower oil and its headspace throughout the oxidation process.
Occurrence in the headspace of toxic oxygenated aldehydes. J. Agric. and
Food Chem., 53:1093-1101.
Gunstone F.D. (1996). Fatty acid and Lipid Chemistry. Bodmin, Great
Britain by Hartnol1's Ltd.; p. 61-99.
Hasson, K. (2012). The effect of frying time of Falafels on the Quality
changes of cotton seeds oil used in local market. J. Univ. of Damascus for
Agric. Sci.; 28(2):349-360.
Houhoula, D.P.; Oreopoulou, V. and Tzia C., (2003). The effect of process
time and temperature on the accumulation of polar compounds in cottonseed
oil during deep-fat frying. J Sci. Food Agric.; 83(4): 314 – 319.
Hui, Y.H. (1996). Bailey's industrial oil & fat products volume 3 edible oil &
fat products: Products and application technology. 5th
ed. Canada: John Wiley
& Sons, Inc.; p. 429-481.
Huisman, J. and Van der Poel, A.F.B. (1994). Aspects of the nutritional
quality and use of cool season food legumes in animal feed. In: F.J.
Muehlbauer and W.J. Kaiser (eds.) Expanding the Production and Use of Cool
Season Food Legumes. Kluwer Academic Publishers. Dordrecht, The
Netherlands. p. 53-76.
Hulse, J.H. (1991). Nature, composition and utilization of grain legumes. p.
11-27. In: Uses of tropical Legumes: Proceedings of a Consultants' Meeting,
27-30 March 1989, ICRISAT Center. ICRISAT, Patancheru, A.P. 502 324,
India.
105
Inoue, C.; Hagma, Y.; Ishikawa, M. and Suzuki, K. (2002).The dielectric
property of soybean oil in deep-fat frying and the effect of frequency. J. Food
Sci.; 67(3):1126-1129.
Iyaka, Y.A., (2007). Concentration of Cu and Zn in Some Fruits and
Vegetables Commonly Available in North-Central Zone of Nigeria. J. of
Environmental, Agricultural Food Chemistry, Vol. 6, 2150-2154.
Jamali, M.K. ; Kazi, T.G. ; Arain, M.B. ; Afridi, H.I. ; Jalbani, N. ;
Sarfraz, R.A. and Baig, J.A. (2008). A multivariate study: variation in
uptake of trace and toxic elements by various varieties of Sorghum bicolor L.
Journal of Hazardous Materials 158, 644–651.
Jones, L. A. and King, C. C. (1996). Cottonseed oil. In: Y. H. Hui (ed.).
Bailey's Industrial Oil and Fat Products, Edible Oil and Fat Products: Oils and
Oilseeds. New York: Wiley. ISBN 978-0-471-59426-0.
Kris, E.; Harris, W.S. and Appel, L.J. (2002). Fish consumption, fish oil,
omega-3 fatty acids, and cardiovascular disease. American Heart Association.
Nutrition Committee 106 (21): 2747–2757.
Krisnangkura, K.; Yimsuwan, T. and Pairintra, R. (2006). An empirical
approach in predicting biodiesel viscosity at various temperature. J. Science
direct; 85: 107-113. 60.
Liu, X.; Jin, Q.; Liu, Y.; Huang, J.; Wang, X.; Mao, W. and Wang, S.
(2011). Changes in volatile compounds of peanut oil during the roasting
process for production of aromatic roasted peanut oil. J. Food Sci. Apr;
76(3):C404-C412.
Mazza, G. and Qi, H. (1992).Effect of after-cooking darkening inhibitors on
stability of frying oil and quality of French fries. J Am Oil Chem. Soc.;
69(9):847-853.
Moreira, R.G.; Castell-Perez, M.E. and Barrufet, M.A. (1999). Deep-Fat
frying fundamentals and applications. Maryland : Aspen Publishers, Inc., p. 1-
141.
Mozaffarian, D. and Rimm, E.B. (2006). Fish intake, contaminants, and
human health: evaluating the risks and the benefits. JAMA. 296: 1885-99.
106
Nash, A.M.; Mounts, T.L. and Kwolek, W.F. (1983). Determination of
Ultra-trace Metals in Hydrogenated Vegetable Oils and Fats. J. JAOCS, vol.
60, no. 41 (April 1983).
Nittaya, N. (2008). Changes in physical and chemical qualities of used frying
oils for Banana slices. M.Sc., Faculty of Sciences (Public health)- university of
Mahidol – Tailand. PP 150
Oloo, J.E. (2010). Food safety and quality management in Africa: an
overview of the roles played by various stakeholders. African Journal of
Food, Agriculture, Nutrition and Development, Vol. 10, No. 11, pp. 79-97.
Orthoefer, F.T. and Cooper, D.S. (1996). Evaluation of Used Frying Oil, in
deep- frying: Chemistry, Nutrition and practical application, edited by Perkins
EG and Michael DE. (Eds.). USA: AOCS Press, p. 285-296.
Oti Wilberforce, J. O. and Nwabue, F. I. (2013). Heavy Metals Effect due
to Contamination of Vegetables from Enyigba Lead Mine in Ebonyi State,
Nigeria. J. Environment and Pollution; Vol. 2, No. 1; 2013 ISSN 1927-0909,
E-ISSN 1927-0917, published by Canadian Center of Science and Education.
Pantizaris, T.P. (1999). Palm Oil in Frying, In: Boskou D. and Elmadfa I.
(Eds.). Frying of Food. Pennsylvania: Technomic Publishing Company; p.
230-237.
Paul, S. and Mittal, G.S. (1997). Regulating the use of degraded oil /fat in
deep-fat/ oil food frying. Crit. Rev. Food Sci. Nutr., 37(7):635-662.
Przybylski, R. (2001). Effect of oils and fats composition on their frying
performance. Argi-Food Research & Development Initiative [serial online]
2001 Nov [6 screens]. Available from:
URL:http://www.gov.mb.caJagricultureJreseach/ardiJprojectsJOO-37l.htm.
Richard, D. O’Brien; Lynn, A. Jones; Clay, C. King; Phillip, J. Wakelyn
and Peter, J. Wan (2005). Edible oil and fat products: Edible oil. Bailey’s
Industrial Oil and Fat Products, Sixth Edition, Six Volume 2. Edited by
Fereidoon Shahidi. P. 74 – 100.
Saguy, I.S.; Shani, A.; Weinberg, P. and Garti, N. (1996.) Utilization of
jojoba oil for deep fat frying of foods. Lebensm.
107
Sanibal, E.A. and Mancini-Filho J. (2004). Frying oil and fat quality
measured by chemical, physical, and test kit analyses. J. Am. Oil Chem. Soc.;
81(2):847-852.
SPSS, (2002). SPSS Professional Statistics 11.5.Chicago, IL: SPSS Inc.
Stier, R.F. (2001).The measurement of frying oil quality and authenticity, in
Frying: Improving quality, Edited by Rossell, J.B. 1st ed. Cambridge:
Woodhead Publishing Limited, p. 165-193.
Totani, N. (2007). A small reduction in atmospheric oxygen decreases
thermal deterioration of oil during frying. J Oleo Sci. ; 55(3): 135-141.
Available from: URL: http://jos.jstage.jst.go.jp/en/.
Totani, N. ; Ohno, C. and Yamaguchi, A. (2007). Is the frying oil in deep-
fried foods safe?. J Oleo Sci.; 55(9): 449-456. Available from: URL
http://jos.jstage.jst.go.jp/en/.
Totani, N.; Yamaguchi, A.; Takada, M. and Moriya, M. (2006). Color
deterioration of oil during frying. J Oleo Sci. 55(2): 51-57. Available from:
URL: http://jos.jstage.jst.go.jp/en/.
Tseng, Y.C.; Moreira R.G. and Sun, X. (1996). Total frying-use time effects
on soybean oil deterioration and on tortilla chip quality. Int. J. Food Sci.
Technol.; 31:287-294.
USDA- National Nutrient Database for Standard Reference (2011).
Choose peanut oil for salad or cooking. Nutrient Data Laboratory,
Agricultural Research Service, United States Dept. of Agric.
http://www.nal.usda.gov/fnic/foodcomp /search/.
Varela, G.; Bender, A.E. and Morton, I.D. (1988). Current facts about the
frying of food, in Frying of Food: Principles, Changes, New Approaches. Elli
Horwood, Chichester, England, pp. 9 - 25.
Velez-Ruiz, J.F.; Vergara-Balderas, F.T.; Sosa-Morales, M.E. and Xique-
Hernandez, J. (2002). Effect of temperature on the physical properties of
chicken strips during deep-fat frying. Int. J. Food Prop. 5(1): 127-144.
Warner, K. and Gupta, M. (2005). Frying Quality and stability of Low- and
Ultra-Low Linolenic Acid Soybean Oils. J. Am. Oil Chem. Soc., 80(3):275-
280.

108
Watanabe, K. (1982). Fish handling and processing in tropical Africa. In
Proceedings of the FAO expert consultation on fish technology in Africa, Casablanca,
Morocco, 7-11 June 1982. FAO Fish. Rep., (268) Suppl.: 1-5. Wiss. Technol. 29,
573-557.
Xu, X.Q. (2000). A New Spectrophotometric Method for the Rapid
Assessment of Deep Frying Oil Quality. J. AOCS, Vol. 77, no. 10 77:1083–
1086.
Xu, X.Q.; Tran V.H.; Palmer, M.; White, K. and Salisbury, P. (1999).
Chemical and physical analyses and sensory evaluation of six deep-frying oils.
J Am. Oil Chem. Soc.; 76(9):1091-1099.
Yan-Hwa, C. and Hsia-Fen, H. (1999). Effects of antioxidants on peanut oil
stability. J. Food Chem., July 66 (1):29 – 34.
Youssif, O.M. (1988). Wet salted freshwater fish (fessiekh) production in the
Sudan. In Proceedings of the FAO expert consultation on fish technology in
Africa, Abidjan, Côte d'Ivoire, 2528 April 1988. FAO Fish. Rep., (400): 176-
81.
Zanardi, E. and Jagersma, C.G. (2002). Solid phase extraction and liquid
chromatography-tandem mass spectrometry for the evaluation of 4-hydroxy-2-
nonenal in pork products. J. Agric. and Food Chem., 50(19): 5268-72.
Zarkovic, N. (2003). 4-Hydroxynonenal as a bioactive marker of
pathophysiological processes. J. Mol. Aspects Med., 24:281-291.
Zeiner, M. ; Steffan, I. and Cindric, I.J. (2005). Determination of trace
elements in olive oil by ICP-AES and ETA-AAS: a pilot study on the
geographical characterization. Microchemical Journal 81, 171–176.
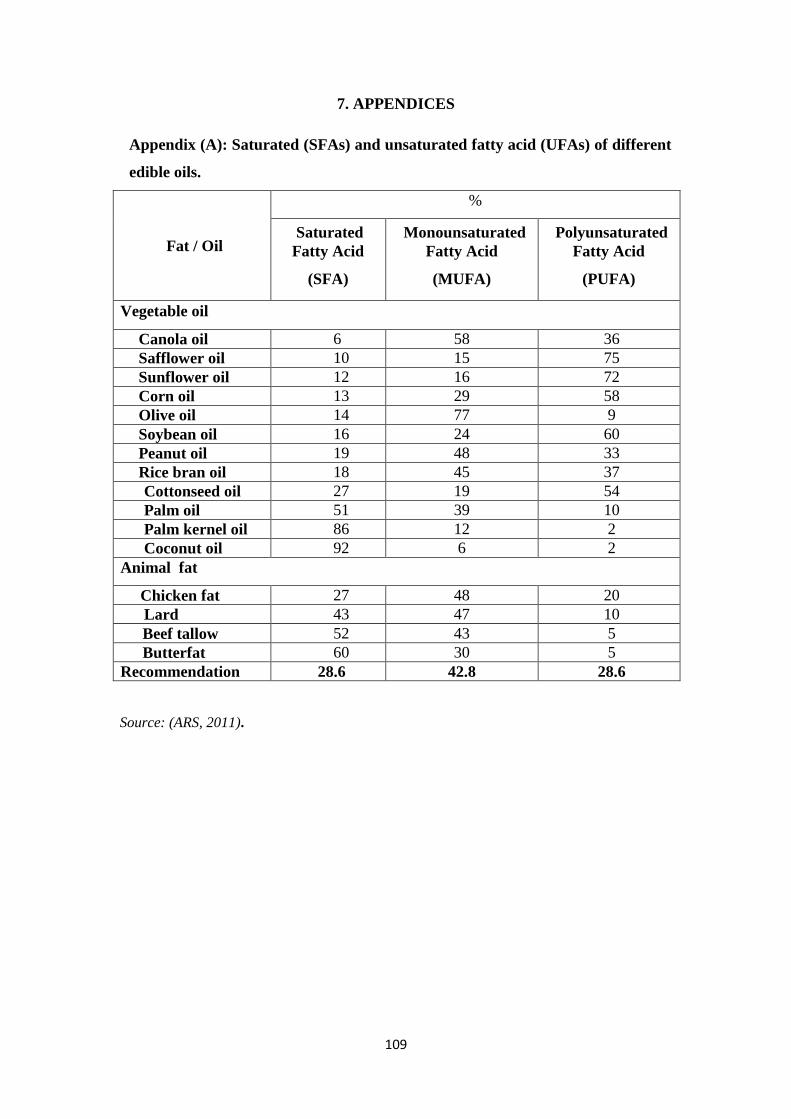
109
7. APPENDICES
Appendix (A): Saturated (SFAs) and unsaturated fatty acid (UFAs) of different
edible oils.
Fat / Oil
%
Saturated
Fatty Acid
(SFA)
Monounsaturated
Fatty Acid
(MUFA)
Polyunsaturated
Fatty Acid
(PUFA)
Vegetable oil
Canola oil 6 58 36
Safflower oil 10 15 75
Sunflower oil 12 16 72
Corn oil 13 29 58
Olive oil 14 77 9
Soybean oil 16 24 60
Peanut oil 19 48 33
Rice bran oil 18 45 37
Cottonseed oil 27 19 54
Palm oil 51 39 10
Palm kernel oil 86 12 2
Coconut oil 92 6 2
Animal fat
Chicken fat 27 48 20
Lard 43 47 10
Beef tallow 52 43 5
Butterfat 60 30 5
Recommendation 28.6 42.8 28.6
Source: (ARS, 2011).
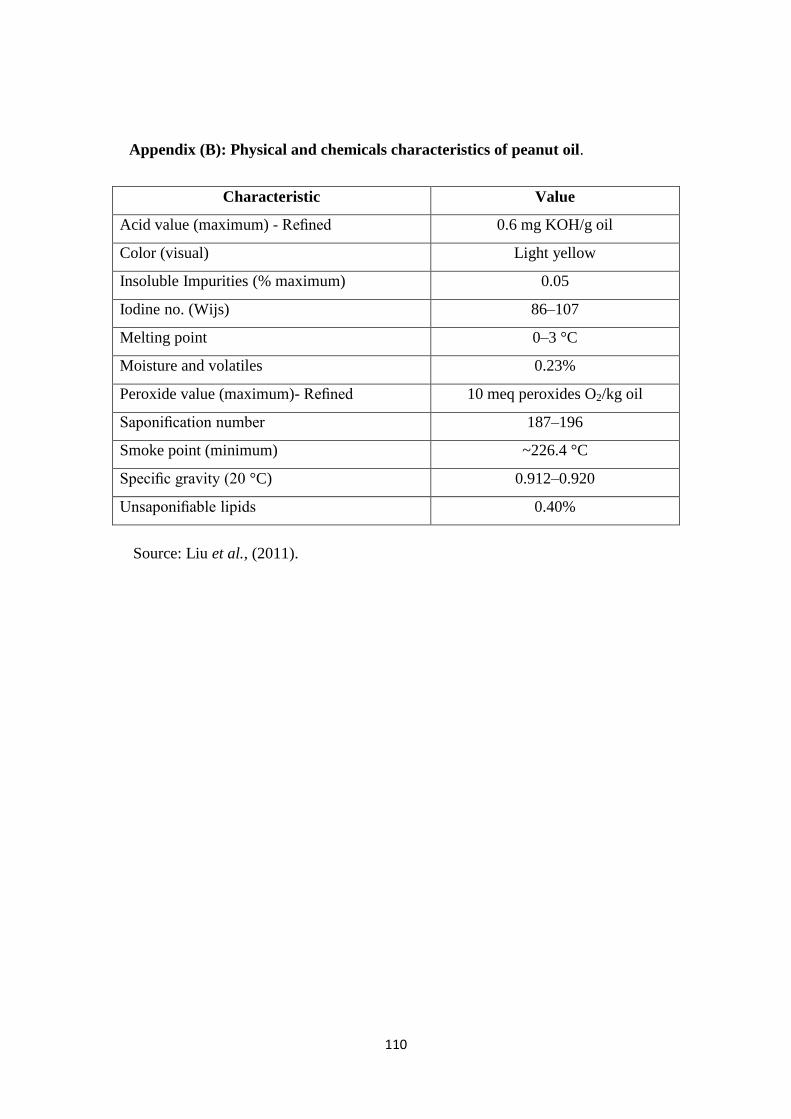
110
Appendix (B): Physical and chemicals characteristics of peanut oil.
Characteristic Value
Acid value (maximum) - Refined 0.6 mg KOH/g oil
Color (visual) Light yellow
Insoluble Impurities (% maximum) 0.05
Iodine no. (Wijs) 86–107
Melting point 0–3 °C
Moisture and volatiles 0.23%
Peroxide value (maximum)- Refined 10 meq peroxides O2/kg oil
Saponification number 187–196
Smoke point (minimum) ~226.4 °C
Specific gravity (20 °C) 0.912–0.920
Unsaponifiable lipids 0.40%
Source: Liu et al., (2011).
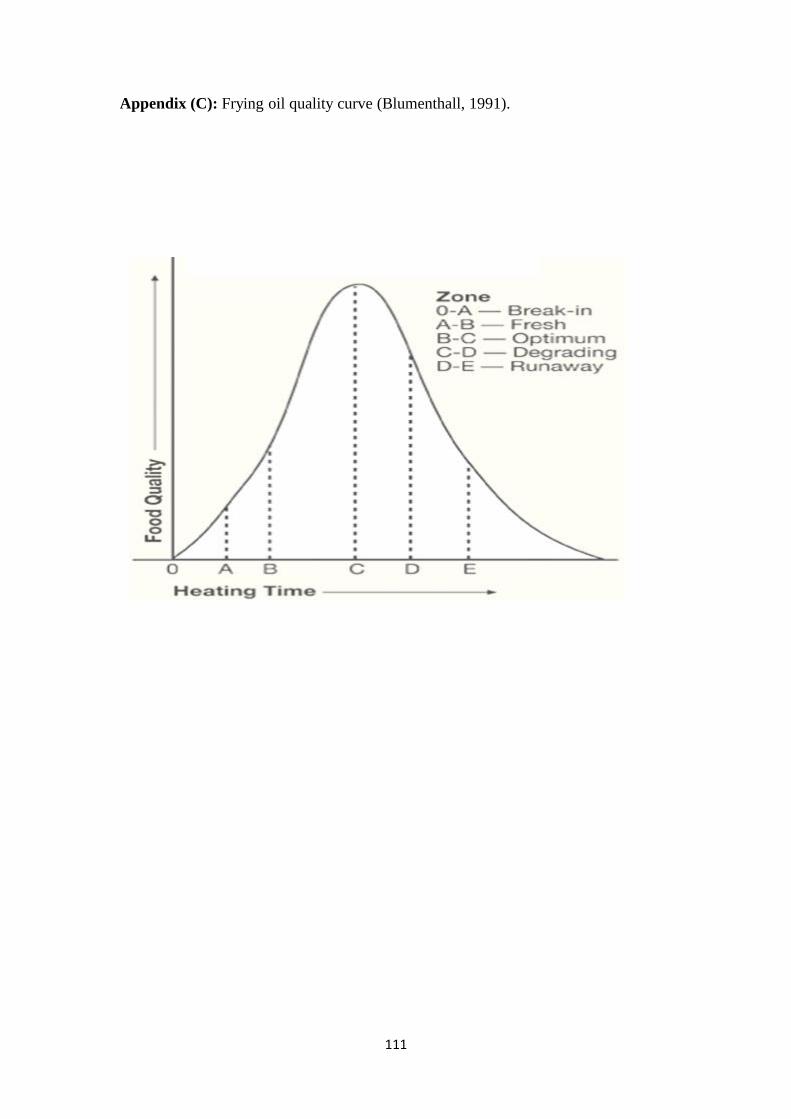
111
Appendix (C): Frying oil quality curve (Blumenthall, 1991).
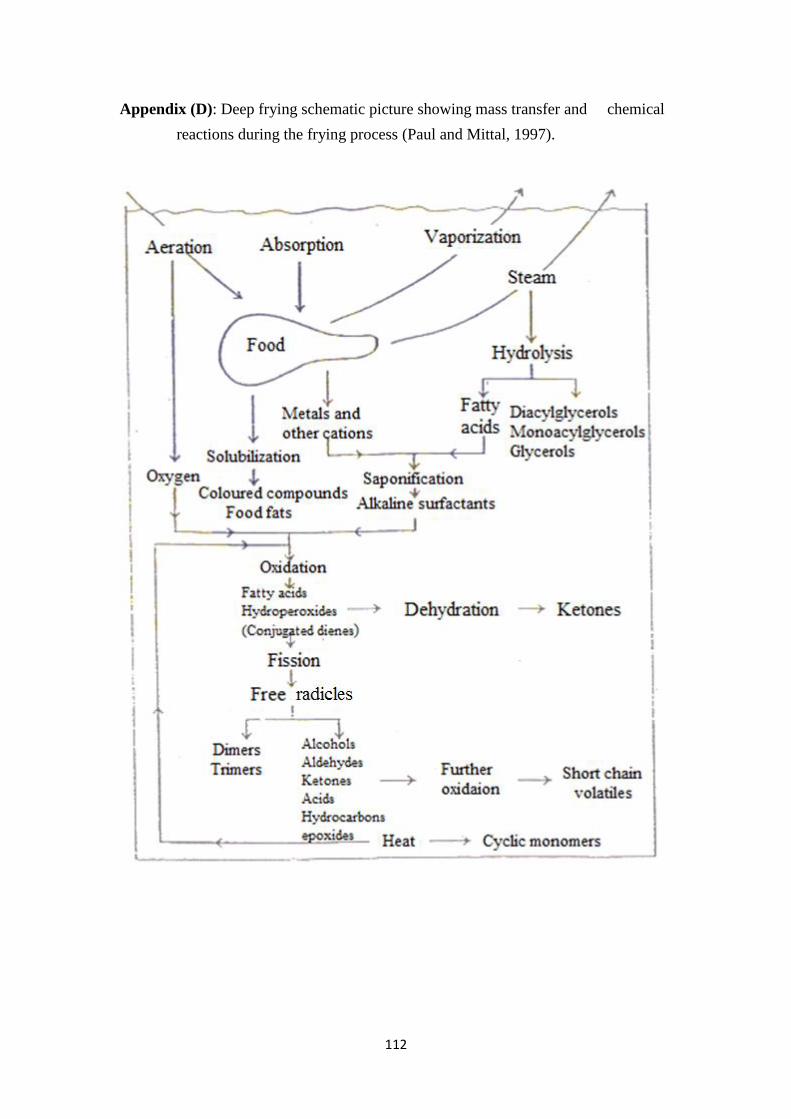
112
Appendix (D): Deep frying schematic picture showing mass transfer and chemical
reactions during the frying process (Paul and Mittal, 1997).
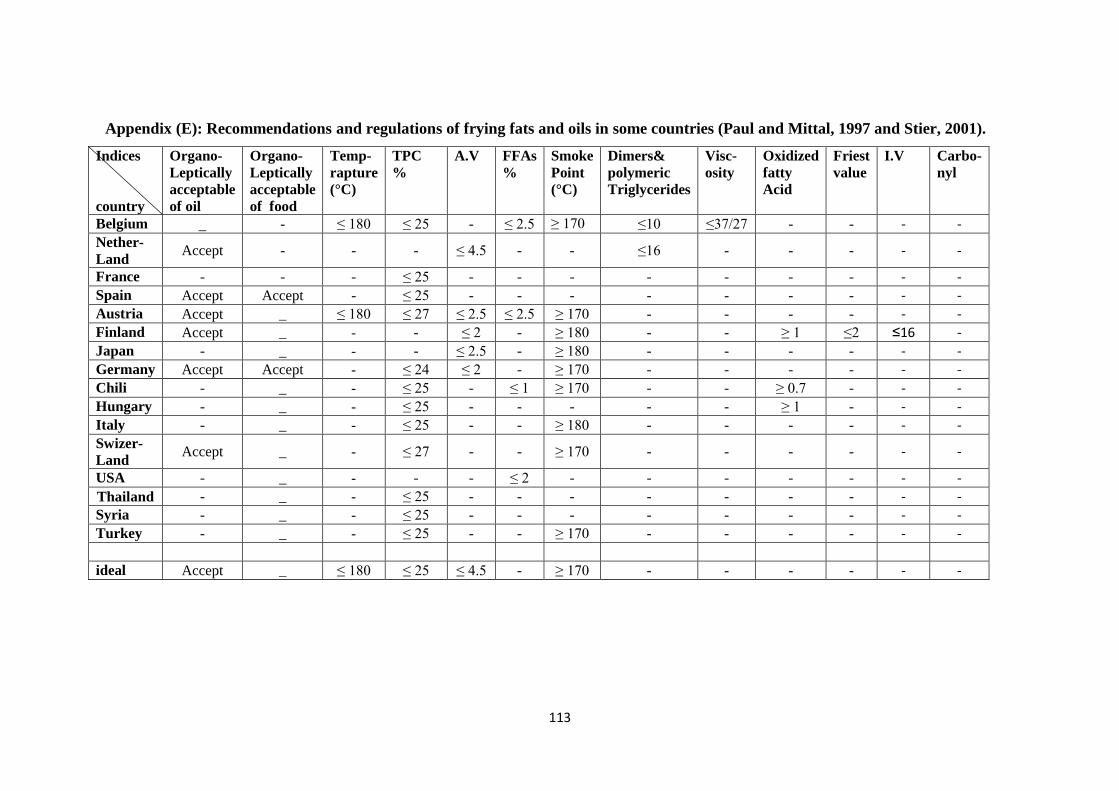
113
Appendix (E): Recommendations and regulations of frying fats and oils in some countries (Paul and Mittal, 1997 and Stier, 2001).
Indices
country
Organo-
Leptically
acceptable
of oil
Organo-
Leptically
acceptable
of food
Temp-
rapture
(°C)
TPC
%
A.V FFAs
%
Smoke
Point
(°C)
Dimers&
polymeric
Triglycerides
Visc-
osity
Oxidized
fatty
Acid
Friest
value
I.V
Carbo-
nyl
Belgium _ - ≤ 180 ≤ 25 - ≤ 2.5 ≥ 170 ≤10 ≤37/27 - - - - Nether-
Land Accept - - - ≤ 4.5 - - ≤16 - - - - -
France - - - ≤ 25 - - - - - - - - - Spain Accept Accept - ≤ 25 - - - - - - - - - Austria Accept _ ≤ 180 ≤ 27 ≤ 2.5 ≤ 2.5 ≥ 170 - - - - - - Finland Accept _ - - ≤ 2 - ≥ 180 - - ≥ 1 ≤2 ≤16 -
Japan - _ - - ≤ 2.5 - ≥ 180 - - - - - - Germany Accept Accept - ≤ 24 ≤ 2 - ≥ 170 - - - - - -
Chili - _ - ≤ 25 - ≤ 1 ≥ 170 - - ≥ 0.7 - - - Hungary - _ - ≤ 25 - - - - - ≥ 1 - - -
Italy - _ - ≤ 25 - - ≥ 180 - - - - - - Swizer-
Land Accept _ - ≤ 27 - - ≥ 170 - - - - - -
USA - _ - - - ≤ 2 - - - - - - -
Thailand - _ - ≤ 25 - - - - - - - - -
Syria - _ - ≤ 25 - - - - - - - - - Turkey - _ - ≤ 25 - - ≥ 170 - - - - - -
ideal Accept _ ≤ 180 ≤ 25 ≤ 4.5 - ≥ 170 - - - - - -
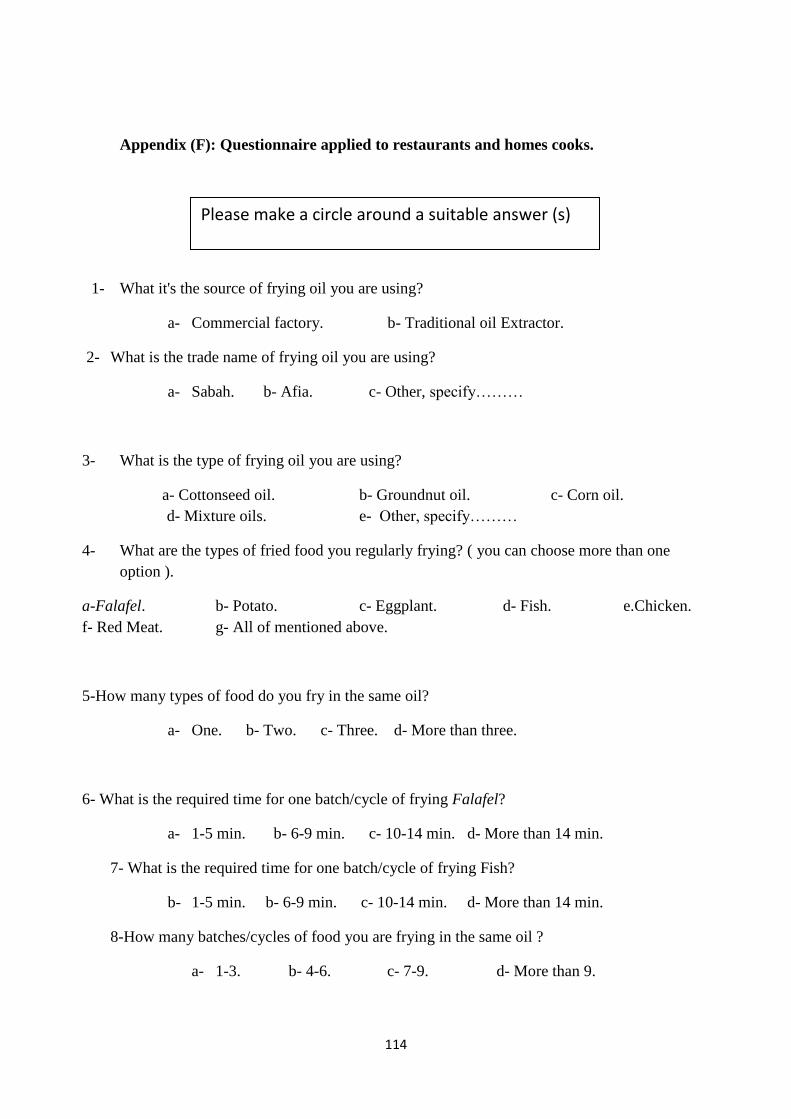
114
Appendix (F): Questionnaire applied to restaurants and homes cooks.
1- What it's the source of frying oil you are using?
a- Commercial factory. b- Traditional oil Extractor.
2- What is the trade name of frying oil you are using?
a- Sabah. b- Afia. c- Other, specify………
3- What is the type of frying oil you are using?
a- Cottonseed oil. b- Groundnut oil. c- Corn oil.
d- Mixture oils. e- Other, specify………
4- What are the types of fried food you regularly frying? ( you can choose more than one
option ).
a-Falafel. b- Potato. c- Eggplant. d- Fish. e.Chicken.
f- Red Meat. g- All of mentioned above.
5-How many types of food do you fry in the same oil?
a- One. b- Two. c- Three. d- More than three.
6- What is the required time for one batch/cycle of frying Falafel?
a- 1-5 min. b- 6-9 min. c- 10-14 min. d- More than 14 min.
7- What is the required time for one batch/cycle of frying Fish?
b- 1-5 min. b- 6-9 min. c- 10-14 min. d- More than 14 min.
8-How many batches/cycles of food you are frying in the same oil ?
a- 1-3. b- 4-6. c- 7-9. d- More than 9.
Please make a circle around a suitable answer (s)
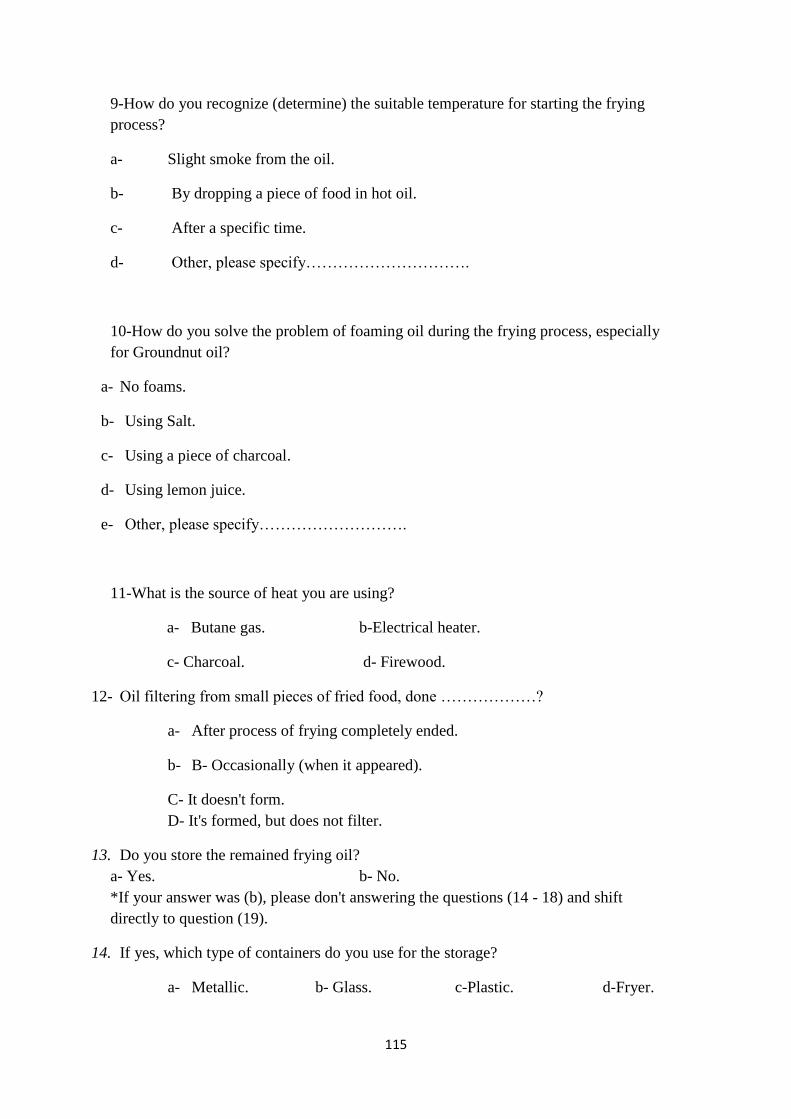
115
9-How do you recognize (determine) the suitable temperature for starting the frying
process?
a- Slight smoke from the oil.
b- By dropping a piece of food in hot oil.
c- After a specific time.
d- Other, please specify………………………….
10-How do you solve the problem of foaming oil during the frying process, especially
for Groundnut oil?
a- No foams.
b- Using Salt.
c- Using a piece of charcoal.
d- Using lemon juice.
e- Other, please specify……………………….
11-What is the source of heat you are using?
a- Butane gas. b-Electrical heater.
c- Charcoal. d- Firewood.
12- Oil filtering from small pieces of fried food, done ………………?
a- After process of frying completely ended.
b- B- Occasionally (when it appeared).
C- It doesn't form.
D- It's formed, but does not filter.
13. Do you store the remained frying oil?
a- Yes. b- No.
*If your answer was (b), please don't answering the questions (14 - 18) and shift
directly to question (19).
14. If yes, which type of containers do you use for the storage?
a- Metallic. b- Glass. c-Plastic. d-Fryer.
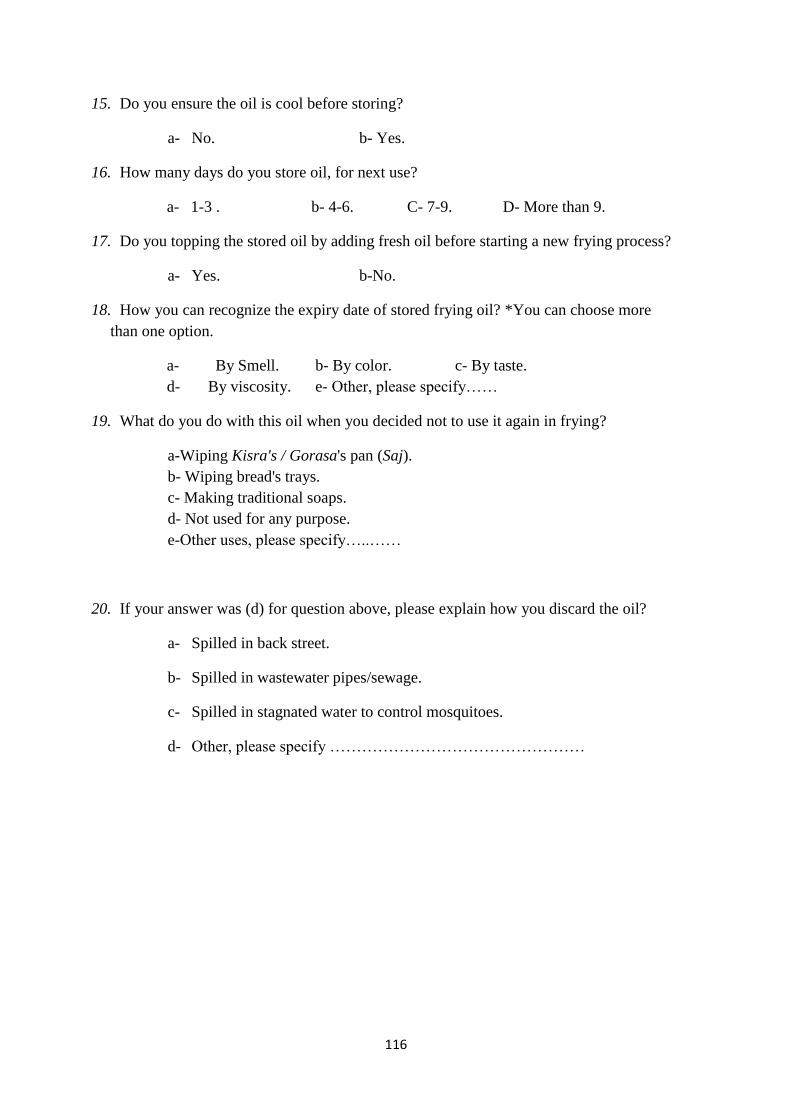
116
15. Do you ensure the oil is cool before storing?
a- No. b- Yes.
16. How many days do you store oil, for next use?
a- 1-3 . b- 4-6. C- 7-9. D- More than 9.
17. Do you topping the stored oil by adding fresh oil before starting a new frying process?
a- Yes. b-No.
18. How you can recognize the expiry date of stored frying oil? *You can choose more
than one option.
a- By Smell. b- By color. c- By taste.
d- By viscosity. e- Other, please specify……
19. What do you do with this oil when you decided not to use it again in frying?
a-Wiping Kisra's / Gorasa's pan (Saj).
b- Wiping bread's trays.
c- Making traditional soaps.
d- Not used for any purpose.
e-Other uses, please specify…..……
20. If your answer was (d) for question above, please explain how you discard the oil?
a- Spilled in back street.
b- Spilled in wastewater pipes/sewage.
c- Spilled in stagnated water to control mosquitoes.
d- Other, please specify …………………………………………
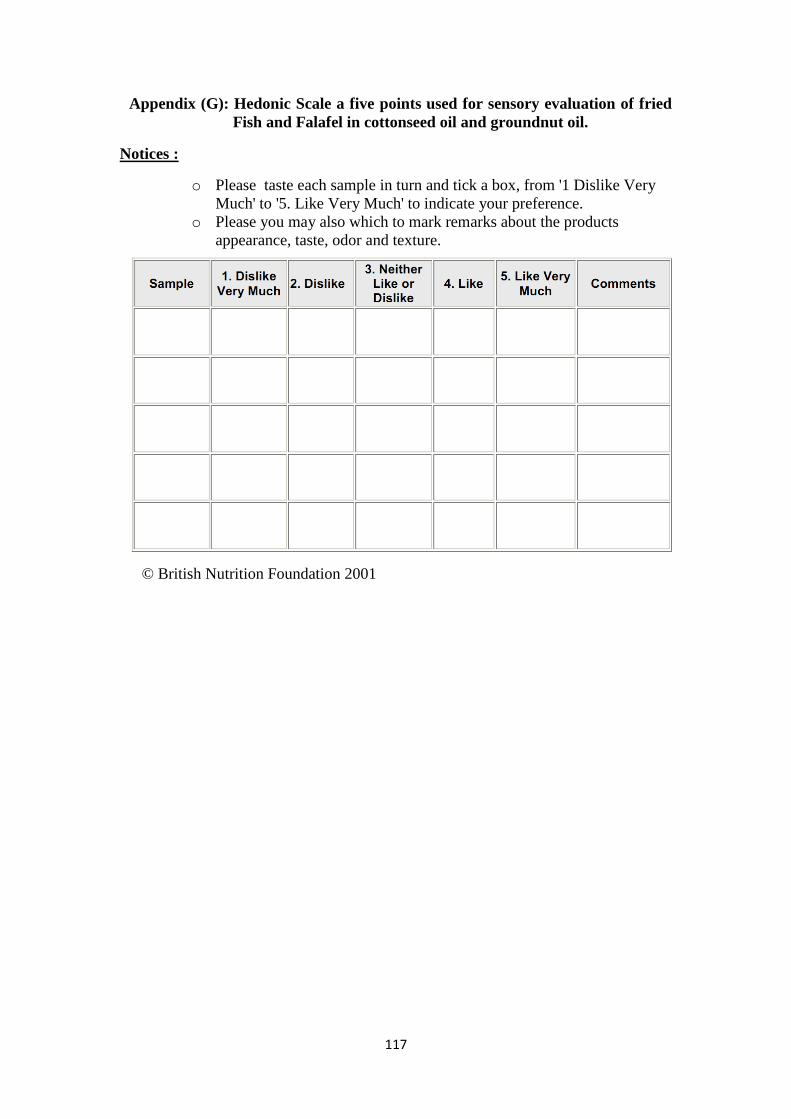
117
Appendix (G): Hedonic Scale a five points used for sensory evaluation of fried
Fish and Falafel in cottonseed oil and groundnut oil.
Notices :
o Please taste each sample in turn and tick a box, from '1 Dislike Very
Much' to '5. Like Very Much' to indicate your preference.
o Please you may also which to mark remarks about the products
appearance, taste, odor and texture.
© British Nutrition Foundation 2001