Embed Size (px)
Citation preview
14 66th AMEU Convention 2017
66thAMEUConvent ion2017
Current business models used by supply authorities within South Africa are not addressing complete solutions for the migration from electricity companies to energy companies. To become energy utilities, an approach must be formulated addressing the transition needs.
Several mixed energy solut ions can be considered for the migration to a complete energy utility. The mixed energy solutions will be unique to each region of South Africa due to environmental, financial and logistical elements.
The current capability and skills level of the various supply authorities must be addressed in order to ensure that the proposed mixed energy solutions are implemented successfully and maintained, ensuring a sustainable energy future for the supply authorities.
The proposed solution presented in this paper is a tailored solution for the middle income class, integrating electrical grid, gas and solar PV/thermal as a mixed energy package for consumers.
Background
Mixed energy packages
Most utilities have based their operational business on the monopolisation business
model which only allows streamlining their business to the distribution of electricity rather than energy. This model assumes that there are no competitors or alternatives and one remains the distributor within their area of supply forever. Utilities never anticipated that energy can even be contained without affecting the utilities network, for example liquid petroleum and natural gas, and made rules that only safeguarded their electricity distribution.
Eskom highlighted its capacity challenges but utilities lacked the innovative will to assist in overcoming these capacity challenges and they were caught off guard when consumers outsmarted them regarding alternative energy sources.
The current energy status quo within South Africa encourages supply authorities to merge from electricity utilities to energy utilities by implementing different sources of energy to meet the demands of consumers. The local market is flooded with renewable energy solutions for residential applications and if municipalities don’t adapt to mixed energy requirements, they might be left behind with individuals catering for their own needs by implementing alternative energy solutions.
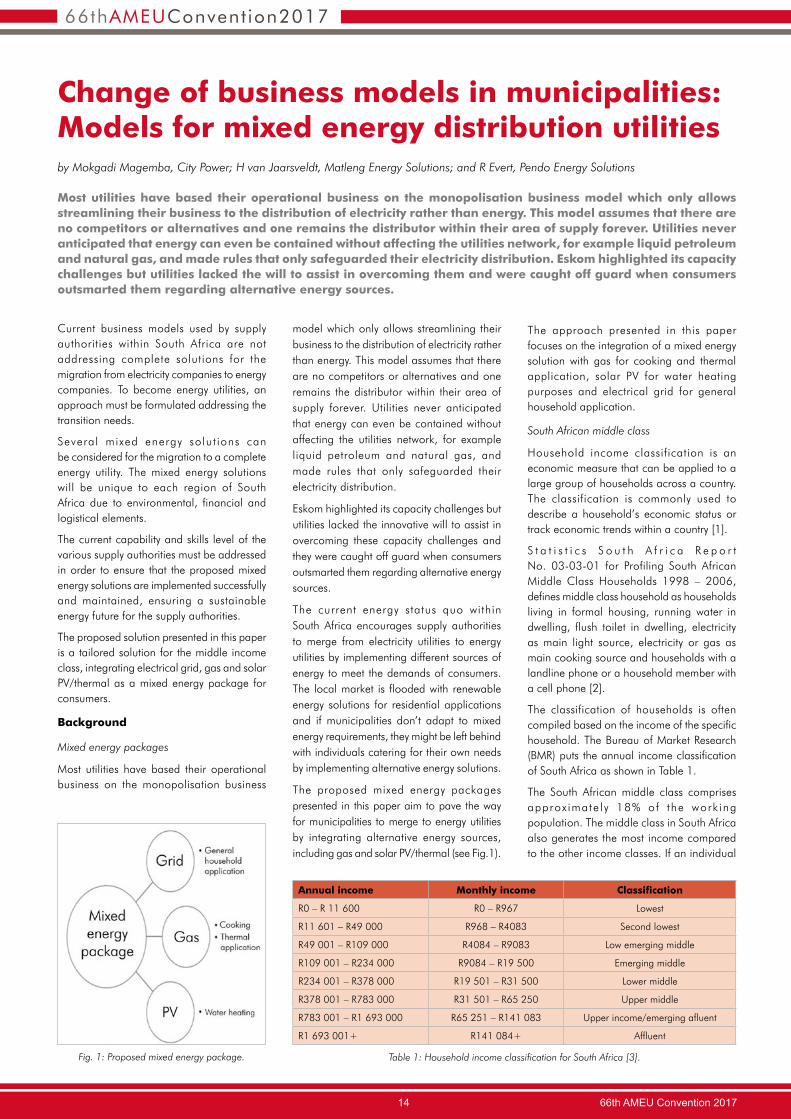
The proposed mixed energy packages presented in this paper aim to pave the way for municipalities to merge to energy utilities by integrating alternative energy sources, including gas and solar PV/thermal (see Fig.1).
The approach presented in this paper focuses on the integration of a mixed energy solution with gas for cooking and thermal application, solar PV for water heating purposes and electrical grid for general household application.
South African middle class
Household income classification is an economic measure that can be applied to a large group of households across a country. The classification is commonly used to describe a household’s economic status or track economic trends within a country [1].
S t a t i s t i c s S o u t h A f r i c a R e p o r t No. 03-03-01 for Profiling South African Middle Class Households 1998 – 2006, defines middle class household as households living in formal housing, running water in dwelling, flush toilet in dwelling, electricity as main light source, electricity or gas as main cooking source and households with a landline phone or a household member with a cell phone [2].
The classification of households is often compiled based on the income of the specific household. The Bureau of Market Research (BMR) puts the annual income classification of South Africa as shown in Table 1.
The South African middle class comprises approx imate ly 18% of the work ing population. The middle class in South Africa also generates the most income compared to the other income classes. If an individual
Change of business models in municipalities: Models for mixed energy distribution utilitiesby Mokgadi Magemba, City Power; H van Jaarsveldt, Matleng Energy Solutions; and R Evert, Pendo Energy Solutions
Most utilities have based their operational business on the monopolisation business model which only allows streamlining their business to the distribution of electricity rather than energy. This model assumes that there are no competitors or alternatives and one remains the distributor within their area of supply forever. Utilities never anticipated that energy can even be contained without affecting the utilities network, for example liquid petroleum and natural gas, and made rules that only safeguarded their electricity distribution. Eskom highlighted its capacity challenges but utilities lacked the will to assist in overcoming them and were caught off guard when consumers outsmarted them regarding alternative energy sources.
Fig. 1: Proposed mixed energy package. Table 1: Household income classification for South Africa [3].
Annual income Monthly income Classification
R0 – R 11 600 R0 – R967 Lowest
R11 601 – R49 000 R968 – R4083 Second lowest
R49 001 – R109 000 R4084 – R9083 Low emerging middle
R109 001 – R234 000 R9084 – R19 500 Emerging middle
R234 001 – R378 000 R19 501 – R31 500 Lower middle
R378 001 – R783 000 R31 501 – R65 250 Upper middle
R783 001 – R1 693 000 R65 251 – R141 083 Upper income/emerging afluent
R1 693 001+ R141 084+ Affluent
66th AMEU Convention 2017 15
66thAMEUConvent ion2017
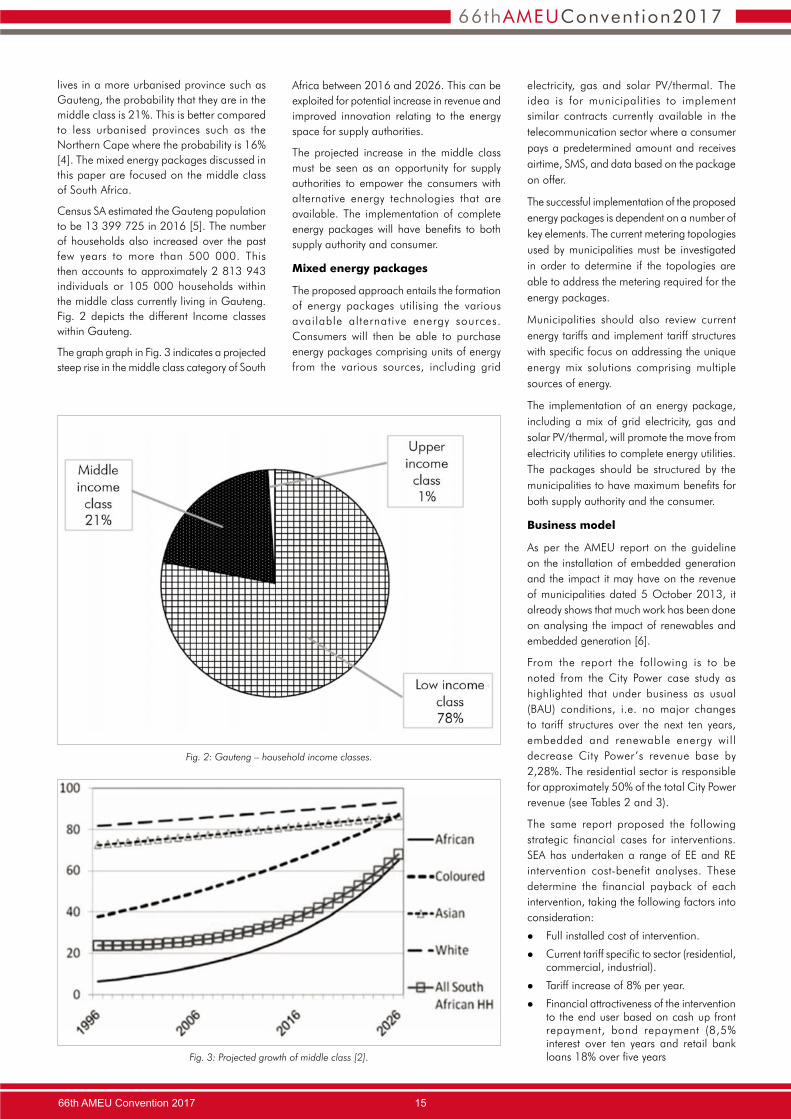
lives in a more urbanised province such as Gauteng, the probability that they are in the middle class is 21%. This is better compared to less urbanised provinces such as the Northern Cape where the probability is 16% [4]. The mixed energy packages discussed in this paper are focused on the middle class of South Africa.
Census SA estimated the Gauteng population to be 13 399 725 in 2016 [5]. The number of households also increased over the past few years to more than 500 000. This then accounts to approximately 2 813 943 individuals or 105 000 households within the middle class currently living in Gauteng. Fig. 2 depicts the different Income classes within Gauteng.
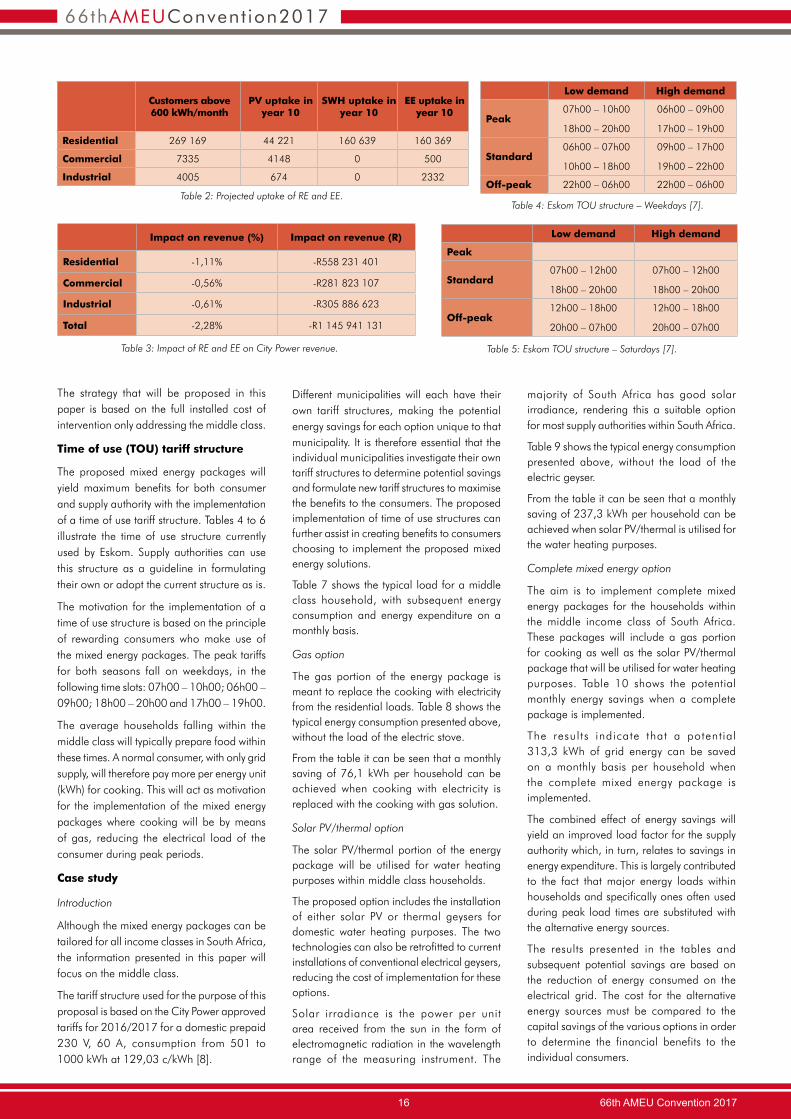
The graph graph in Fig. 3 indicates a projected steep rise in the middle class category of South
Africa between 2016 and 2026. This can be exploited for potential increase in revenue and improved innovation relating to the energy space for supply authorities.
The projected increase in the middle class must be seen as an opportunity for supply authorities to empower the consumers with alternative energy technologies that are available. The implementation of complete energy packages will have benefits to both supply authority and consumer.
Mixed energy packages
The proposed approach entails the formation of energy packages utilising the various available alternative energy sources. Consumers will then be able to purchase energy packages comprising units of energy from the various sources, including grid
electricity, gas and solar PV/thermal. The idea is for municipalities to implement similar contracts currently available in the telecommunication sector where a consumer pays a predetermined amount and receives airtime, SMS, and data based on the package on offer.
The successful implementation of the proposed energy packages is dependent on a number of key elements. The current metering topologies used by municipalities must be investigated in order to determine if the topologies are able to address the metering required for the energy packages.
Municipalities should also review current energy tariffs and implement tariff structures with specific focus on addressing the unique energy mix solutions comprising multiple sources of energy.
The implementation of an energy package, including a mix of grid electricity, gas and solar PV/thermal, will promote the move from electricity utilities to complete energy utilities. The packages should be structured by the municipalities to have maximum benefits for both supply authority and the consumer.
Business model
As per the AMEU report on the guideline on the installation of embedded generation and the impact it may have on the revenue of municipalities dated 5 October 2013, it already shows that much work has been done on analysing the impact of renewables and embedded generation [6].
From the report the following is to be noted from the City Power case study as highlighted that under business as usual (BAU) conditions, i.e. no major changes to tariff structures over the next ten years, embedded and renewable energy will decrease City Power’s revenue base by 2,28%. The residential sector is responsible for approximately 50% of the total City Power revenue (see Tables 2 and 3).
The same report proposed the following strategic financial cases for interventions. SEA has undertaken a range of EE and RE intervention cost-benefit analyses. These determine the financial payback of each intervention, taking the following factors into consideration:
l Full installed cost of intervention.
l Current tariff specific to sector (residential, commercial, industrial).
l Tariff increase of 8% per year.
l Financial attractiveness of the intervention to the end user based on cash up front repayment, bond repayment (8,5% interest over ten years and retail bank loans 18% over five years
Fig. 2: Gauteng – household income classes.
Fig. 3: Projected growth of middle class [2].
16 66th AMEU Convention 2017
66thAMEUConvent ion2017
The strategy that will be proposed in this paper is based on the full installed cost of intervention only addressing the middle class.
Time of use (TOU) tariff structure
The proposed mixed energy packages will yield maximum benefits for both consumer and supply authority with the implementation of a time of use tariff structure. Tables 4 to 6 illustrate the time of use structure currently used by Eskom. Supply authorities can use this structure as a guideline in formulating their own or adopt the current structure as is.
The motivation for the implementation of a time of use structure is based on the principle of rewarding consumers who make use of the mixed energy packages. The peak tariffs for both seasons fall on weekdays, in the following time slots: 07h00 – 10h00; 06h00 – 09h00; 18h00 – 20h00 and 17h00 – 19h00.
The average households falling within the middle class will typically prepare food within these times. A normal consumer, with only grid supply, will therefore pay more per energy unit (kWh) for cooking. This will act as motivation for the implementation of the mixed energy packages where cooking will be by means of gas, reducing the electrical load of the consumer during peak periods.
Case study
Introduction
Although the mixed energy packages can be tailored for all income classes in South Africa, the information presented in this paper will focus on the middle class.
The tariff structure used for the purpose of this proposal is based on the City Power approved tariffs for 2016/2017 for a domestic prepaid 230 V, 60 A, consumption from 501 to 1000 kWh at 129,03 c/kWh [8].
Different municipalities will each have their own tariff structures, making the potential energy savings for each option unique to that municipality. It is therefore essential that the individual municipalities investigate their own tariff structures to determine potential savings and formulate new tariff structures to maximise the benefits to the consumers. The proposed implementation of time of use structures can further assist in creating benefits to consumers choosing to implement the proposed mixed energy solutions.
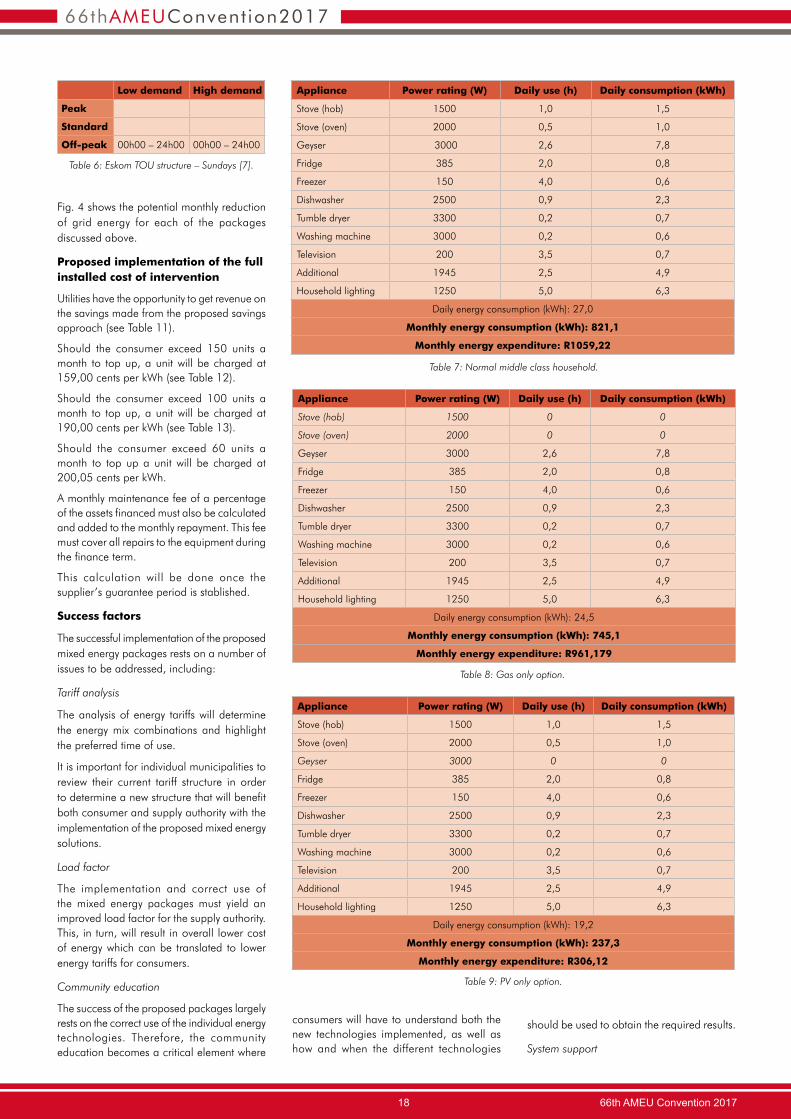
Table 7 shows the typical load for a middle class household, with subsequent energy consumption and energy expenditure on a monthly basis.
Gas option
The gas portion of the energy package is meant to replace the cooking with electricity from the residential loads. Table 8 shows the typical energy consumption presented above, without the load of the electric stove.
From the table it can be seen that a monthly saving of 76,1 kWh per household can be achieved when cooking with electricity is replaced with the cooking with gas solution.
Solar PV/thermal option
The solar PV/thermal portion of the energy package will be utilised for water heating purposes within middle class households.
The proposed option includes the installation of either solar PV or thermal geysers for domestic water heating purposes. The two technologies can also be retrofitted to current installations of conventional electrical geysers, reducing the cost of implementation for these options.
Solar irradiance is the power per unit area received from the sun in the form of electromagnetic radiation in the wavelength range of the measuring instrument. The
majority of South Africa has good solar irradiance, rendering this a suitable option for most supply authorities within South Africa.
Table 9 shows the typical energy consumption presented above, without the load of the electric geyser.
From the table it can be seen that a monthly saving of 237,3 kWh per household can be achieved when solar PV/thermal is utilised for the water heating purposes.
Complete mixed energy option
The aim is to implement complete mixed energy packages for the households within the middle income class of South Africa. These packages will include a gas portion for cooking as well as the solar PV/thermal package that will be utilised for water heating purposes. Table 10 shows the potential monthly energy savings when a complete package is implemented.
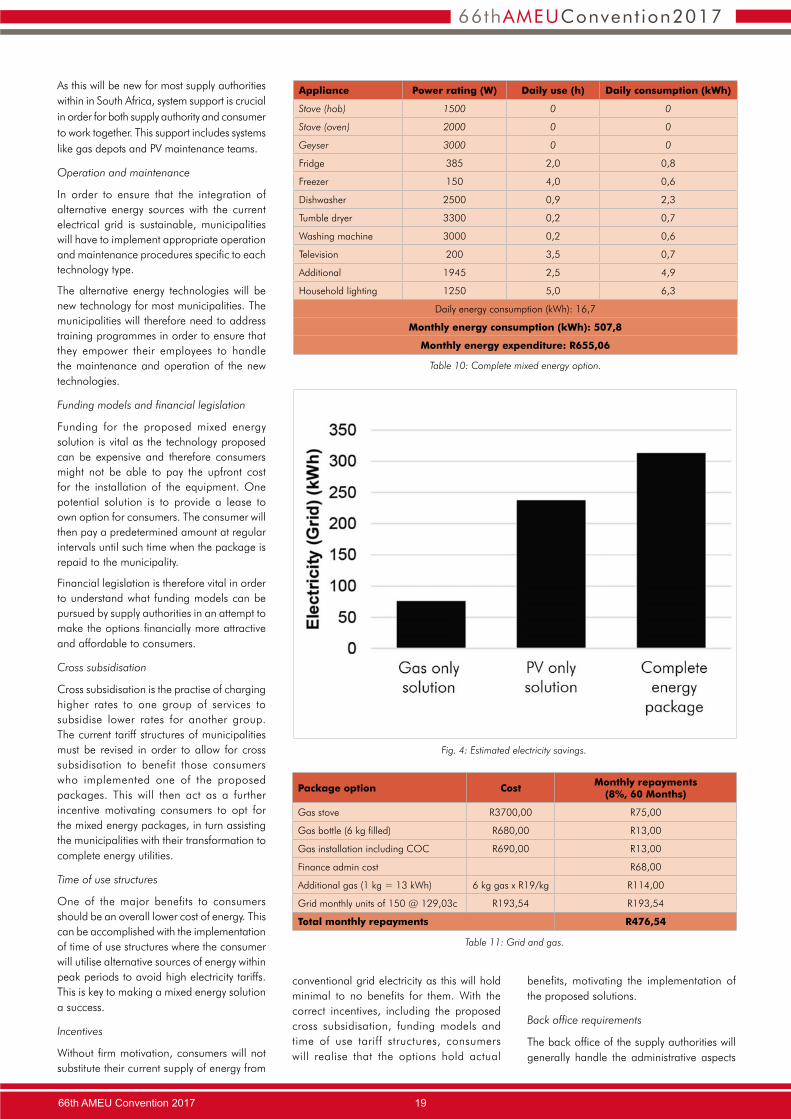
The results indicate that a potential 313,3 kWh of grid energy can be saved on a monthly basis per household when the complete mixed energy package is implemented.
The combined effect of energy savings will yield an improved load factor for the supply authority which, in turn, relates to savings in energy expenditure. This is largely contributed to the fact that major energy loads within households and specifically ones often used during peak load times are substituted with the alternative energy sources.
The results presented in the tables and subsequent potential savings are based on the reduction of energy consumed on the electrical grid. The cost for the alternative energy sources must be compared to the capital savings of the various options in order to determine the financial benefits to the individual consumers.
Table 2: Projected uptake of RE and EE.
Table 3: Impact of RE and EE on City Power revenue.
Table 4: Eskom TOU structure – Weekdays [7].
Table 5: Eskom TOU structure – Saturdays [7].
Customers above 600 kWh/month
PV uptake in year 10
SWH uptake in year 10
EE uptake in year 10
Residential 269 169 44 221 160 639 160 369
Commercial 7335 4148 0 500
Industrial 4005 674 0 2332
Impact on revenue (%) Impact on revenue (R)
Residential -1,11% -R558 231 401
Commercial -0,56% -R281 823 107
Industrial -0,61% -R305 886 623
Total -2,28% -R1 145 941 131
Low demand High demand
Peak07h00 – 10h00
18h00 – 20h00
06h00 – 09h00
17h00 – 19h00
Standard06h00 – 07h00
10h00 – 18h00
09h00 – 17h00
19h00 – 22h00
Off-peak 22h00 – 06h00 22h00 – 06h00
Low demand High demand
Peak
Standard07h00 – 12h00
18h00 – 20h00
07h00 – 12h00
18h00 – 20h00
Off-peak12h00 – 18h00
20h00 – 07h00
12h00 – 18h00
20h00 – 07h00

Green TransformersEster Dielectric Fluid application in Transformers
Increasing transformers capacity up to 20%
• Additional overloading capability while maintaining life expectation and footprint
for large population growth areas
• More compact transformers
• Kraft paper + Envirotemp FR3
Green Transformer more compact and more efficient
• 15% lower oil volume
• Up to 18% less copper
• About 5% less general materials
• Extended life expectancy
18 66th AMEU Convention 2017
66thAMEUConvent ion2017
Fig. 4 shows the potential monthly reduction of grid energy for each of the packages discussed above.
Proposed implementation of the full installed cost of intervention
Utilities have the opportunity to get revenue on the savings made from the proposed savings approach (see Table 11).
Should the consumer exceed 150 units a month to top up, a unit will be charged at 159,00 cents per kWh (see Table 12).
Should the consumer exceed 100 units a month to top up, a unit will be charged at 190,00 cents per kWh (see Table 13).
Should the consumer exceed 60 units a month to top up a unit will be charged at 200,05 cents per kWh.
A monthly maintenance fee of a percentage of the assets financed must also be calculated and added to the monthly repayment. This fee must cover all repairs to the equipment during the finance term.
This calculation will be done once the supplier’s guarantee period is stablished.
Success factors
The successful implementation of the proposed mixed energy packages rests on a number of issues to be addressed, including:
Tariff analysis
The analysis of energy tariffs will determine the energy mix combinations and highlight the preferred time of use.
It is important for individual municipalities to review their current tariff structure in order to determine a new structure that will benefit both consumer and supply authority with the implementation of the proposed mixed energy solutions.
Load factor
The implementation and correct use of the mixed energy packages must yield an improved load factor for the supply authority. This, in turn, will result in overall lower cost of energy which can be translated to lower energy tariffs for consumers.
Community education
The success of the proposed packages largely rests on the correct use of the individual energy technologies. Therefore, the community education becomes a critical element where
Table 7: Normal middle class household.
Appliance Power rating (W) Daily use (h) Daily consumption (kWh)
Stove (hob) 1500 1,0 1,5
Stove (oven) 2000 0,5 1,0
Geyser 3000 2,6 7,8
Fridge 385 2,0 0,8
Freezer 150 4,0 0,6
Dishwasher 2500 0,9 2,3
Tumble dryer 3300 0,2 0,7
Washing machine 3000 0,2 0,6
Television 200 3,5 0,7
Additional 1945 2,5 4,9
Household lighting 1250 5,0 6,3
Daily energy consumption (kWh): 27,0
Monthly energy consumption (kWh): 821,1
Monthly energy expenditure: R1059,22
Table 6: Eskom TOU structure – Sundays [7].
consumers will have to understand both the new technologies implemented, as well as how and when the different technologies
should be used to obtain the required results.
System support
Table 9: PV only option.
Table 8: Gas only option.
Low demand High demand
Peak
Standard
Off-peak 00h00 – 24h00 00h00 – 24h00
Appliance Power rating (W) Daily use (h) Daily consumption (kWh)
Stove (hob) 1500 0 0
Stove (oven) 2000 0 0
Geyser 3000 2,6 7,8
Fridge 385 2,0 0,8
Freezer 150 4,0 0,6
Dishwasher 2500 0,9 2,3
Tumble dryer 3300 0,2 0,7
Washing machine 3000 0,2 0,6
Television 200 3,5 0,7
Additional 1945 2,5 4,9
Household lighting 1250 5,0 6,3
Daily energy consumption (kWh): 24,5
Monthly energy consumption (kWh): 745,1
Monthly energy expenditure: R961,179
Appliance Power rating (W) Daily use (h) Daily consumption (kWh)
Stove (hob) 1500 1,0 1,5
Stove (oven) 2000 0,5 1,0
Geyser 3000 0 0
Fridge 385 2,0 0,8
Freezer 150 4,0 0,6
Dishwasher 2500 0,9 2,3
Tumble dryer 3300 0,2 0,7
Washing machine 3000 0,2 0,6
Television 200 3,5 0,7
Additional 1945 2,5 4,9
Household lighting 1250 5,0 6,3
Daily energy consumption (kWh): 19,2
Monthly energy consumption (kWh): 237,3
Monthly energy expenditure: R306,12
66th AMEU Convention 2017 19
66thAMEUConvent ion2017
As this will be new for most supply authorities within in South Africa, system support is crucial in order for both supply authority and consumer to work together. This support includes systems like gas depots and PV maintenance teams.
Operation and maintenance
In order to ensure that the integration of alternative energy sources with the current electrical grid is sustainable, municipalities will have to implement appropriate operation and maintenance procedures specific to each technology type.
The alternative energy technologies will be new technology for most municipalities. The municipalities will therefore need to address training programmes in order to ensure that they empower their employees to handle the maintenance and operation of the new technologies.
Funding models and financial legislation
Funding for the proposed mixed energy solution is vital as the technology proposed can be expensive and therefore consumers might not be able to pay the upfront cost for the installation of the equipment. One potential solution is to provide a lease to own option for consumers. The consumer will then pay a predetermined amount at regular intervals until such time when the package is repaid to the municipality.
Financial legislation is therefore vital in order to understand what funding models can be pursued by supply authorities in an attempt to make the options financially more attractive and affordable to consumers.
Cross subsidisation
Cross subsidisation is the practise of charging higher rates to one group of services to subsidise lower rates for another group. The current tariff structures of municipalities must be revised in order to allow for cross subsidisation to benefit those consumers who implemented one of the proposed packages. This will then act as a further incentive motivating consumers to opt for the mixed energy packages, in turn assisting the municipalities with their transformation to complete energy utilities.
Time of use structures
One of the major benefits to consumers should be an overall lower cost of energy. This can be accomplished with the implementation of time of use structures where the consumer will utilise alternative sources of energy within peak periods to avoid high electricity tariffs. This is key to making a mixed energy solution a success.
Incentives
Without firm motivation, consumers will not substitute their current supply of energy from
conventional grid electricity as this will hold minimal to no benefits for them. With the correct incentives, including the proposed cross subsidisation, funding models and time of use tariff structures, consumers will realise that the options hold actual
benefits, motivating the implementation of the proposed solutions.
Back office requirements
The back office of the supply authorities will generally handle the administrative aspects
Fig. 4: Estimated electricity savings.
Appliance Power rating (W) Daily use (h) Daily consumption (kWh)
Stove (hob) 1500 0 0
Stove (oven) 2000 0 0
Geyser 3000 0 0
Fridge 385 2,0 0,8
Freezer 150 4,0 0,6
Dishwasher 2500 0,9 2,3
Tumble dryer 3300 0,2 0,7
Washing machine 3000 0,2 0,6
Television 200 3,5 0,7
Additional 1945 2,5 4,9
Household lighting 1250 5,0 6,3
Daily energy consumption (kWh): 16,7
Monthly energy consumption (kWh): 507,8
Monthly energy expenditure: R655,06
Table 10: Complete mixed energy option.
Table 11: Grid and gas.
Package option Cost Monthly repayments (8%, 60 Months)
Gas stove R3700,00 R75,00
Gas bottle (6 kg filled) R680,00 R13,00
Gas installation including COC R690,00 R13,00
Finance admin cost R68,00
Additional gas (1 kg = 13 kWh) 6 kg gas x R19/kg R114,00
Grid monthly units of 150 @ 129,03c R193,54 R193,54
Total monthly repayments R476,54
20 66th AMEU Convention 2017
66thAMEUConvent ion2017
of the business. It is vital that the correct processes and procedures for back office support is implemented as the proposed technologies and integration thereof will be new to most or all municipalities within South Africa. The administrative component of the proposed business model is essential to ensure that the utilities ensure a sustainable mixed energy future within South Africa. Monitoring the system through the back office to establish how successful the mixed energy solutions is will be crucial.
Conclusion
Current business models used by supply authorities within South Africa are not addressing complete solutions for the migration from electricity companies to energy companies. To become energy utilities, an approach must be formulated addressing the transition needs.
Several mixed energy solutions can be considered for the migration to a complete energy utility. The mixed energy solutions will be unique to each region of South Africa due to environmental, financial and logistical elements.
The proposed solution presented in this paper is based on a total energy package integrating multiple energy sources, including electrical grid, gas and solar PV/thermal.
The success of the mixed energy packages will depend largely on the benefits to both the supply authorities and consumers. The proposed solution will yield maximum benefits for both with the revision of current tariff structures and migration to time of use tariff structures. Cross subsidisation and incentives will also play a vital role in the implementation and overall success of mixed energy solutions.
The proposed solution presented in this paper can be implemented successfully only after all issues discussed in the success factors section of this paper are addressed.
References
[1] The World Bank: "New country classifications by income level", 1 July 2016. [Online]. Available: https://blogs.worldbank.org/opendata/new-country-classifications-2016. [Accessed: August 2017].
[2] Statistics South Africa: "Profiling South African middle-class households", 1998 – 2006, Report 03-03-01, ISBN 978-0-621-39028-8, 19 January 2010.
[3] BusinessTech: "What you need to know about South Africa’s middle class", 12 May 2016. [Online]. Available: https://businesstech.co.za/news/banking/123511/what-you-need-to-know-about-south-africas-middle-class/ [Accessed: July 2017].
[4] BusinessTech: "How South Africans generate an income", 14 May 2016. [Online]. Available: https://businesstech.co.za/news/general/123493/how-south-afr icans-generate-an-income/ [Accessed: July 2017].
[5] City Population, Gauteng South Africa, 29 July 2016. [Online]. Available: www.citypopulation.de/php/ southafrica-admin.php?adm1id=7. [Accessed: August 2017].
[6] Embedded Generation: AMEU report: "Guideline on the installation of embedded generation and the impact it may have on the revenue of municipalities", the Association of Municipal Electricity Utilities (Southern Africa), 5 October 2013.
[7] Eskom: "2017/18 tariffs and charges", [Online]. Available: www.eskom.co.za/CustomerCare/ TariffsAndCharges/Pages/Tariffs_And_Charges.aspx [Accessed: August 2017].
[8] City Power Johannesburg: "FY2016/17 tariffs", [Online]. Available: www.citypower.co.za /customers/Pages/Tariff-Info.aspx [Accessed: August 2017].
Contact Mokgadi Magemba, City Power, Tel 011 090-1010, [email protected]
Table 12: Grid and PV.
Table 13: Grid, PV and gas.
Package option Cost Monthly repayments (8%, 60 months)
PV geyser high pressure 150 litres R17 000,00 R344,00
Finance admin cost R68,00
Grid monthly units of 100 @ 129,03c R129,03
Package option Cost Monthly repayments (8%, 60 months)
Gas stove R3 700,00 R75,00
Gas bottle (6 kg filled) R680,00 R13,00
Gas installation including COC R690,00 R13,00
Finance admin cost R68,00
PV geyser high pressure 150 litres R17 000.00 R344,00
Additional gas (1 kg = 13 kWh) 6 kg gas x R19/kg R114,00
Grid monthly units of 60 @ 103,22c
R 77,41
Total monthly repayments R704,41