Embed Size (px)
Citation preview

91( 585 )
Change and Continuity
in the 2009 Japanese General Election
Masamichi Ida
Abstract
The 2009 Japanese general election was a landslide victory for the
Democratic Party of Japan (DPJ) and an overwhelming defeat for the
Liberal Democratic Party (LDP). As a result, the DPJ came to power for
the first time since it was established in 1996. In contrast, the LDP had
retained power for 38 years. In the 1993 general election, the LDP lost its
majority in the lower house and thus lost administrative power for the
first time. Even while the LDP was out of power, it maintained its
status as the top party. The LDP returned to power because of a split
among the coalition parties in 1994. After that, the LDP remained in
power for fifteen years. On the other hand, the DPJ was established in
1996, and gradually expanded its support among Japanese voters. At
last, the DPJ came to power in 2009.
In order to understand the 2009 election, we need to understand the
trends of Japanese voters using electoral statistics and survey data.
The findings from these data were as follows. (1)A sudden change in
SMDs occurred in urban areas. (2)In 2005 and 2009, the second parties
were obviously disadvantaged because of the SMD system. (3)Evolving
two-party system, voter’s interest in the general election tended to in-
crease in the recent elections. (4)Middle aged and elderly voters were
alienated from the LDP in the 2009 election, as were conservative voters.
(5)The effect of occupational differences on vote choice was almost
diminished in the two most recent elections. (6)The percentage of
“party voters” who attached greater importance to a party rather than
to a candidate in the SMD vote increased largely to 61.2% in the 2009
election.
Keywords : Election, Voting behavior, Public opinion, Japanese politics,
Japanese general election

Introduction
The 45th Japanese General Election was held on August 30, 2009.
The result was a historical one because the Liberal Democratic Party
(LDP) suffered an unprecedented overwhelming defeat and the Demo-
cratic Party of Japan (DPJ) came to power for the first time since its
establishment in 1996. In contrast, the LDP had retained power for 38
years after its formation in 1955. In the 1993 general election, the LDP
lost its majority in the lower house. This first-time loss of administra-
tive power was due to the splitting of the party.
Even while the LDP was out of power, it maintained its status as
the top party. The second most powerful party at that time was the
Japan Socialist Party (JSP), but it held only about one-third of the seats
that the LDP held. At the end of June 1994, the LDP returned to power
because of a split among the coalition parties. At that time, the LDP
formed a coalition government with the JSP and the Sakigake Party,
which was formed by splitting from the LDP in 1993. Since then, the
LDP remained power. In contrast, the DPJ was established relatively
recently in 1996, and gradually expanded its support among Japanese
voters. At last, the DPJ came to power in 20091.
In order to understand the 2009 election, we need to understand the
trends of Japanese voters using electoral statistics and survey data.
This paper mainly focuses on the vote cast for the two major parties.
1. Transition of public opinion
The Taro Aso administration began at the end of September 2008,
immediately after the “Lehman Shock.” Aso was elected as president of
the LDP after former Prime Minister Yasuo Fukuda’s resignation. The
main reason for his resignation was that his administration had lost
public support, so if he were to dissolve the lower house, the LDP would
have little possibility of winning the next general election and staying
政経論叢 第 80巻第 5・6号
92 ( 586 )

in power. The main reason for Aso’s victory was his relatively high
popularity with Japanese voters as compared to other candidates for
the LDP presidential election of 2008. Many LDP Diet members ex-
pected him to dissolve the lower house immediately after his inaugura-
tion and execute a general election, given the high approval rating for
the cabinet, but Prime Minister Aso decided not to do so. Based on an
analysis of public opinion polls, it is apparent that the main reason for
Aso’s decision not to dissolve the lower house was a low public ap-
proval rating.
I now will examine the transition of public opinion during the Aso
administration. Figures 1 and 2 present the results of Fuji Television
Network’s “Shin-Hodo 2001” weekly poll, which was conducted among
metropolitan area voters in the Kanto region. Figure 1 presents the
approval and disapproval rating for the Aso cabinet, and Figure 2
shows the percentage of voting intension for the top two parties. The
results for the approval and disapproval ratings of the cabinet obtained
by Fuji Television Network were similar to those of many national polls
executed by other mass media.
Immediately after the inauguration of the Aso administration, the
approval rating of his cabinet was 47.2%. That percentage level was
lower than that expected by many LDP members in the Diet. Other
polls indicated a similar level of approval. For instance, as the first
approval rating for the Aso cabinet, the percentage in the Asahi
Shimbun national poll was 48% and that of Yomiuri Shimbun national
poll was 49.5%. According to the results of Fuji Television Network’s
“Shin-Hodo 2001” weekly poll, the first approval rating for the Abe
cabinet was 67.0% (September 2006) and that for the Fukuda cabinet
was 55.6% (September 2007). Therefore, the first approval rating for
the Aso cabinet was lower than that of the preceding two administra-
tions.
The approval rating of 40% continued only for one month and then
declined thereafter. The approval rating for the Aso cabinet sharply
decreased in November and December 2008, mainly because of the
Change and Continuity in the 2009 Japanese General Election
93( 587 )
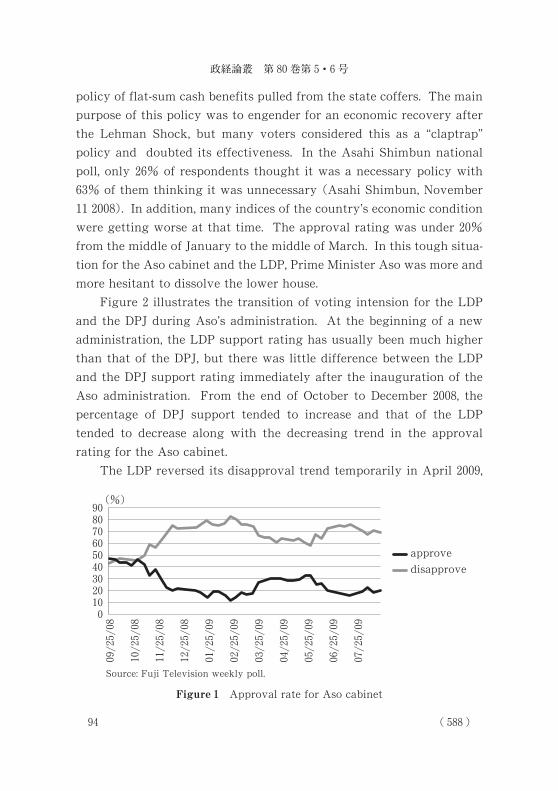
policy of flat-sum cash benefits pulled from the state coffers. The main
purpose of this policy was to engender for an economic recovery after
the Lehman Shock, but many voters considered this as a “claptrap”
policy and doubted its effectiveness. In the Asahi Shimbun national
poll, only 26% of respondents thought it was a necessary policy with
63% of them thinking it was unnecessary (Asahi Shimbun, November
11 2008). In addition, many indices of the country’s economic condition
were getting worse at that time. The approval rating was under 20%
from the middle of January to the middle of March. In this tough situa-
tion for the Aso cabinet and the LDP, Prime Minister Aso was more and
more hesitant to dissolve the lower house.
Figure 2 illustrates the transition of voting intension for the LDP
and the DPJ during Aso’s administration. At the beginning of a new
administration, the LDP support rating has usually been much higher
than that of the DPJ, but there was little difference between the LDP
and the DPJ support rating immediately after the inauguration of the
Aso administration. From the end of October to December 2008, the
percentage of DPJ support tended to increase and that of the LDP
tended to decrease along with the decreasing trend in the approval
rating for the Aso cabinet.
The LDP reversed its disapproval trend temporarily in April 2009,
政経論叢 第 80巻第 5・6号
94 ( 588 )
Source: Fuji Television weekly poll.
Figure 1 Approval rate for Aso cabinet

due to the Ichiro Ozawa financial scandal. Ozawa was the leader of the
DPJ at that time. After he resigned, Yukio Hatoyama was chosen as
party leader of the DPJ in the middle of May, and the percentage of DPJ
support quickly recovered with the percentage of LDP support decreas-
ing to less than 20% again. In the last survey before the election, the
percentage of voters who intended to vote for the LDP was 16.3%, and
the percentage of the voters who intended to vote for the DPJ was
41.2%, so the landslide victory of the DPJ was forecast.
Of course, the correlation between the cabinet approval rating and
the percentage of the vote intention for the LDP was strong at 0.819.
Following a regression analysis, it became apparent that the LDP sup-
port rating had increased 3.5 points when the cabinet approval rating
increased ten points. In contrast, the correlation coefficient between the
cabinet approval rating and the percentage of the vote intension for the
DPJ was -0.467, and therefore the DPJ support rating tended to rise
along with the decline in the cabinet’s approval rating. In the end,
Prime Minister Aso was not able to find an appropriate time to dissolve
the lower house to benefit the LDP. He finally dissolved the lower
house September 21, 2009.
After a party realignment in the 1990s, the life of the cabinet was
shorter than it was under the 1955 system where the LDP was dominant.
Change and Continuity in the 2009 Japanese General Election
95( 589 )
Source: Fuji Television weekly poll.
Figure 2 Vote intention for the DPJ and the LDP

However, we recognize that prime ministers had become careful about
dissolution since a Mixed System was introduced in 1994. I think that
the Single-Member District System is one factor that made Prime Minis-
ter Aso carefully consider the dissolution.
The possibility that the administration could be changed by a gen-
eral election was extremely low under the old electoral system (multi-
member district system, MMD). Under the 1955 system, except for the
1958 election, only the LDP could run candidates in numbers constitut-
ing a majority of total members. Therefore, it was clear that opposition
parties were not able to acquire administrative power. For the opposi-
tion parties, it was necessary to form a coalition with other opposition
parties in order to acquire administrative power. In practice, an effec-
tive coalition was not able to be formed by the opposition parties.
Ironically, there is now a danger of losing office when a contrary
wind blows against the party in power because the new SMD system
brought the possibility of a sudden change. As a result, the prime min-
ister has tended to be more careful about dissolving the lower house.
The dissolution of 2009 was a typical case of that tendency.
2. Results and analysis
2�1 Turnout and voter’s interest
Turnout
First of all, I will examine the trend of turnout in Japanese general
elections. Table 1 presents the turnout of the general elections since
1947. The 1947 election was the 23th general election, and it was also the
first election under the new constitution. From 1947 to 2009, the 23
general elections were held. The highest turnout rate was 76.99 percent
in the 1958 election that was the first election after the 1955 system was
established. The turnout rate was around 70 percent from 1960 to 1993
elections. In 1994, Japanese electoral system for the lower house elec-
tion was replaced the Multi-Member District system with the Mixed
Member Majority system2. It decreased to around 60% after the new
政経論叢 第 80巻第 5・6号
96 ( 590 )

electoral system was introduced in 1994, however, the turnout rate
tended to increase in recent general elections. In the 2005 general elec-
tion, the turnout rate rose by about eight points over the previous gen-
eral election. In the 2009 general election, the turnout rate rose to nearly
70% (69.51%).
In the 2009 election, male turnout exceeded that of women for the
first time since 1969. In Japan, women’s suffrage was introduced in 1945
under the US occupation. The first several elections after it was intro-
duced, female turnout was considerably lower than men. As Martin
Harrop and William L. Miller pointed out, “As is normal among newly-
Change and Continuity in the 2009 Japanese General Election
97( 591 )
Table 1 Turnout in Japanese general elections, 1947�2009
year total men (a) women (b) difference(a)-(b)
1947 67.95 74.87 61.60 13.27
1949 74.04 80.74 67.95 12.79
1952 76.43 80.46 72.76 7.70
1953 74.22 78.35 70.44 7.91
1955 75.84 79.95 72.06 7.89
1958 76.99 79.79 74.42 5.37
1960 73.51 76.00 71.23 4.77
1963 71.14 72.36 70.02 2.34
1967 73.99 74.75 73.28 1.47
1969 68.51 67.85 69.12 -1.27
1972 71.76 71.01 72.46 -1.45
1976 73.45 72.81 74.05 -1.24
1979 68.01 67.42 68.56 -1.14
1980 74.57 73.72 75.36 -1.64
1983 67.94 67.56 68.30 -0.74
1986 71.40 70.21 72.52 -2.31
1990 73.31 71.93 74.61 -2.68
1993 67.26 66.39 68.09 -1.70
1996 59.65 59.03 60.23 -1.20
2000 62.49 62.02 62.94 -0.92
2003 59.86 59.68 60.03 -0.35
2005 67.51 66.80 68.18 -1.38
2009 69.28 69.46 69.12 0.34
Source: Shugiin Jimukyoku (2009)

enfranchised groups, turn-out was low” (Harrop and Miller 1987, 207),
therefore the low turnout of women in the first stage was the usual fact.
From the 1950’s to 1960’s, the difference of turnout between men and
women had reduced gradually. In the 1969 election, female turnout
exceeded the male for the first time. Since then, women’s turnout al-
ways slightly exceeded the men in general elections, however, in the
2009 election, men’s turnout increased by 2.66 points compared with the
previous election. On the other hand, the increase rate of women re-
mained 0.94 points.
Increasing voter’s interest in general election
In voter’s attitudinal level, the degree of voter’s interest in general
election tended to increase recently. Figure 3 presents the result of the
public opinion polls executed by The Association for Promoting Fair
Elections (Akarui Senkyo Suishin Kyokai in Japanese). The proportion
of “highly interested” voters tended to increase since the 1996 election.
The proportion was about 20% in 1996, about 30% in 2000 and 2003,
about 40% in 2005, and about 60% in 2009. According to these polls,
voter’s interest for the general election had tended to increase greatly.
政経論叢 第 80巻第 5・6号
98 ( 592 )
Source: Akarui Senkyo Suishin Kyokai Post Election Poll.
Figure 3 Voter’s interest in the general election, 1996�2009

Table 2 shows the percentage of “highly interested” voters by social
force. The rightmost column shows regression coefficient (B). The
proportion of “highly interested” voters of men was always higher than
that of women, but the regression coefficient of men was similar to that
of women. Hence, the degree of increasing trend of men was similar to
that of women. The older voters were always more interested than the
younger voter.
The proportion of the highly interested voters was always highest
in the residents of metropolitan areas, and the degree of increasing
trend was relatively high among urban voters (the residents of metro-
politan and larger city). By educational level, the proportion of the
highly interested voters was always highest in the college graduate,
and the degree of increasing trend was relatively high among the edu-
cated voters.
Change and Continuity in the 2009 Japanese General Election
99( 593 )
Table 2 Percentage of “highly interested” voter by gender, age, region,
and educational level, 1996�2009
1996 2000 2003 2005 2009 B
men 25.4 37.7 37.3 49.1 65.4 9.1
women 14.3 21.8 24.3 34.2 53.1 9.0
20�29 years old 8.3 13.1 14.2 21.9 30.5 5.3
30�39 years old 12.9 17.4 16.6 33.8 55.0 10.140�49 years old 17.4 25.4 21.5 39.1 64.2 10.750�59 years old 22.1 34.1 34.8 41.7 61.8 8.760 and older 25.5 36.7 39.2 48.5 56.6 7.4
metropolitan 21.1 32.4 36.0 49.5 60.8 9.7
larger city 18.7 28.9 27.5 40.6 60.4 9.5smaller city 20.4 27.0 27.9 39.9 54.3 8.1rural 18.3 27.3 31.0 34.7 59.5 9.0
junior high school 17.3 23.4 26.1 31.3 43.8 6.1
high school 18.1 27.4 28.5 36.8 57.9 8.9junior college 16.1 26.6 30.7 43.4 58.5 10.2college 32.7 41.0 39.4 61.2 71.2 9.7
Source: Akarui Senkyo Suishin Kyokai Post Election Poll.

2�2 Seat and vote share
Landslide victory of the DPJ
Figure 4 shows the results of the LDP and the DPJ in the recent five
general elections. In the 1996 election that was the first election under
the new electoral system, the LDP acquired 239 seats of the total 500
seats. The seat share was 47.8%, so the LDP could not acquired the
majority of total seats. In the election, the second party was New Fron-
tier Party (NFP) that was founded in 1994. NFP aimed the top party,
but it could not attain. On the other hand, the DPJ was the status of a
third party in that election. But in December 1997, the second party
NFP dissolved by the party leader Ichiro Ozawa. As a result, the party
realignment was occurred and the number of DPJ seats increased in
1998.
In the 2000 election, the LDP acquired 233 seats of the total 480 seats.
The seat share was 48.5%, so the LDP could not acquired the majority
of total seats again. In 1999, however, the LDP formed the coalition
government with the Clean Government Party (CGP). The CGP gained
政経論叢 第 80巻第 5・6号
100 ( 594 )
Source: Shugiin Jimukyoku (2009).
Figure 4 Number of acquired seats of the LDP and the DPJ, 1996�2009

31 seats in the 2000 election, so the sum of the in-parties attained major-
ity in the lower house. On the other hand, the DPJ acquired 127 seats in
the election.
Before the 2003 election, the Liberal Party merged into the DPJ. As
a result, the number of seats of the DPJ somewhat increased before the
election. The DPJ acquired 177 seats of the total 480 seats in the 2003
general election that the number was highest of the second parties in
the post war Japan. On the other hand, the LDP acquired 237 seats in
the election. The seat share of the top two parties was 86.25%. So, we
can say a two-party system was established in 2003.
The result of the 2005 election was a landslide victory for the LDP.
The LDP acquired 296 seats of the total 480 seats. The seat share was
61.7%, so the LDP could acquired the majority of total seats after a long
time. On the other hand, the DPJ suffered overwhelmingly defeat, as a
result, Katsuya Okada decided to resign the president of the DPJ.
In contrast, the 2009 election was a landslide victory for the DPJ.
The DPJ acquired 308 of the total 480 seats and increased its number of
seats in 2005 by 195. The number of the DPJ acquired seats in 2009
election was the highest in the Japanese general elections since the
World War Ⅱ. On the other hand, the LDP acquired 119 seats, which
was a 177-seats decrease from the 2005 election. The 2009 election was
the worst performance for the party since it was formed in 1955. Before
the 2009 election, the worst performance of the LDP was 223 seats in the
1993 election.
There was a great change in the number of seats of the two major
parties because of the effect of the sudden change of the SMD system.
DPJ seats in the SMD tier increased suddenly from 52 seats in the 2005
election to 221 seats in 2009. In contrast, LDP seats in SMD’s decreased
sharply from 219 seats in 2005 to 60 seats in 2009. The LDP’s coalition
partner, the CGP acquired 21 seats, which was a 10 seat decrease from
the 2005. In the 2009 election, the CGP ran 8 candidates in the SMD tier,
but all candidates could not win.
Change and Continuity in the 2009 Japanese General Election
101( 595 )

SMD tier
The 300 seats of total 480 seats had been elected in the SMD (Single
Member District) tier since the 2000 general election. So, 62.5% of total
seats were elected in the SMD tier. Table 3 shows the pattern of the
winner in the recent three elections. About one third of the districts, the
LDP won in 2003 and 2005 and the DPJ won in 2009. The number of
districts that the seat transfer from the LDP to the DPJ in 2009 was 158,
over half of the total number of districts.
The number of districts of the LDP won in the every three elections
is only 47, and the number of districts that the DPJ won in the three
elections is 44. The sum of these districts is 91, so the fixed district is
政経論叢 第 80巻第 5・6号
102 ( 596 )
Table 3 Pattern of winners in the SMD tier, 2003�2009
2003 2005 2009 N %
L L D 97 32.3
D L D 57 19.0
L L L 47 15.7
D D D 44 14.7
O O D 8 2.7
L L O 6 2.0
L O L 5 1.7
L O D 5 1.7
O L L 5 1.7
L D L 4 1.3
O L D 4 1.3
O O L 4 1.3
L O O 3 1.0
O O O 3 1.0
O D D 2 0.7
L D D 1 0.3
D L L 1 0.3
D L O 1 0.3
D D L 1 0.3
D O O 1 0.3
O L O 1 0.3
300 100.0
�L=LPD, D=DPJ, O=other parties.
about one third. Over two thirds of the districts resulted in a seat trans-
fer between parties in recent three elections. The districts that experi-
enced a seat change between the LDP and the DPJ can be called
“swing districts”. So, the proportion of the swing districts is near two
third. This fact implies that there are many swing voters in Japan. The
result of the SMD tier in the 2009 election was clearly “landslide.” The
two major parties have few districts to which they can surely win at the
status quo.
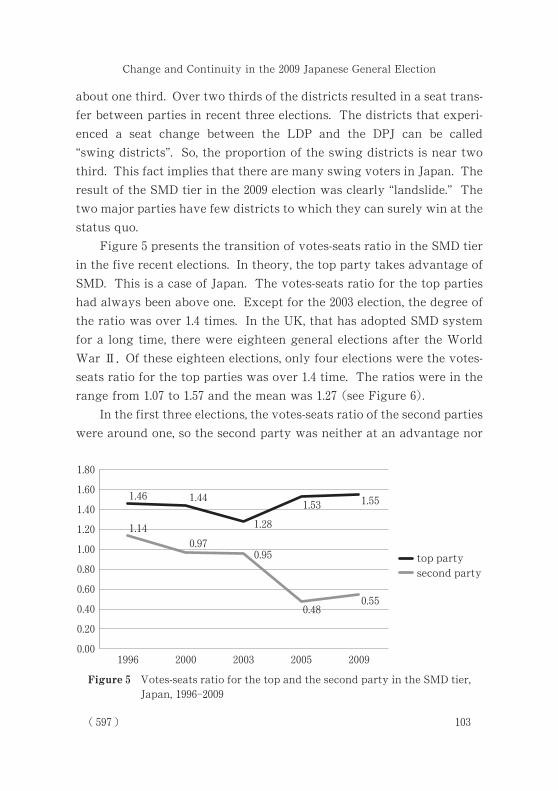
Figure 5 presents the transition of votes-seats ratio in the SMD tier
in the five recent elections. In theory, the top party takes advantage of
SMD. This is a case of Japan. The votes-seats ratio for the top parties
had always been above one. Except for the 2003 election, the degree of
the ratio was over 1.4 times. In the UK, that has adopted SMD system
for a long time, there were eighteen general elections after the World
War Ⅱ. Of these eighteen elections, only four elections were the votes-
seats ratio for the top parties was over 1.4 time. The ratios were in the
range from 1.07 to 1.57 and the mean was 1.27 (see Figure 6).
In the first three elections, the votes-seats ratio of the second parties
were around one, so the second party was neither at an advantage nor
Change and Continuity in the 2009 Japanese General Election
103( 597 )
Figure 5 Votes-seats ratio for the top and the second party in the SMD tier,
Japan, 1996�2009

at a disadvantage because of the SMD system. But in 2005 and 2009, the
second parties were obviously disadvantaged because of the SMD sys-
tem. The seat share of the second party was about half of the vote share
of them. These facts had not been seen in the UK. The mean of that in
the postwar UK was 1.05 and the lowest ratio was 0.79 in 2001. The seat
share of the second party in the 2005 and 2009 Japanese elections were
abnormally low when compared with that of the UK.
These facts mean that the percentage of swing districts in Japan
were higher than that in the UK. In other words, the percentage of
fixed districts of Japan was fewer than that of the UK, so there were
many criticisms against SMD system in Japan.
Table 4 shows the number of acquired seats for the LDP and the
DPJ by district type in 2003, 2005, and 2009. A Japanese political scien-
tist Taku Sugawara calculated the Densely Inhabitant District (DID)
population ratio of 300 electoral districts from the 2000 census data and
divided urban, intermediate, and rural type districts into 100 electoral
districts each3. In 2003, the LDP was the rural type party and the DPJ
was the urban type party. In the 2005 election, however, that pattern
collapsed. The LDP acquired over 70% of seats among every district
type, but this was an exceptional case.
In the 2009 election, the DPJ gained almost all of the urban and
政経論叢 第 80巻第 5・6号
104 ( 598 )
Figure 6 Votes-seats ratio for the top and the second party,
UK, 1945�2010

intermediate type districts, and the DPJ had a slight gain over the LDP
in the rural type elections. In 2005, the seat change was especially large
in the urban type districts. In contrast, the winning party of the rural
type district was almost constant, so, Koizumi’s whirlwind blew only in
urban areas. In the 2009 election, the number of acquired seats of the
DPJ was more than that of the LDP in every district type. In the urban
type districts, the DPJ gained 70% in 2009.
The sudden change in SMDs tended to occur in urban areas, be-
cause in urban areas, there are many floating voters. For instance, in
Tokyo, the capital prefecture, the LDP won 23 of the 25 districts in 2005,
but it won only two districts in the 2009 election. In contrast, the DPJ
won only one district in 2005, but it won 23 districts in 2009.
The candidates of the DPJ tended to be younger than those of the
LDP. The average age of the DPJ candidates in SMD’s was 48.2 and that
of the LDP candidates was 55.4. There were 263 districts in which both
major parties ran a candidate. In 176 districts of the total 263 districts,
the DPJ candidate was younger than the LDP candidate. On the other
hand, there were 84 districts that the LDP candidate was younger than
the DPJ candidate.
PR tier
Since the 2000 general election, the 180 seats of total 480 seats in the
Change and Continuity in the 2009 Japanese General Election
105( 599 )
Table 4 Result by district type, 2003�2009
2003 2005 2009 2005�2003 2009�2005
LDP
urban type (100) 31 74 10 +43 -64
intermediate type (100) 58 71 12 +13 -59
rural type (100) 79 74 42 - 5 -32
DPJ
urban type (100) 60 16 86 -44 +70
intermediate type (100) 35 25 86 -10 +61
rural type (100) 10 11 49 + 1 +38

Japanese lower house was elected by a Proportional Representation
System (PR). Figure 7 illustrates the transition of vote share in the PR
tier from 1996 to 2009. In the three out of five elections, the LDP gained
the top share, however, it gained the smallest share of votes in these
five general elections in 2009. The LDP vote share decreased in 2009 by
11.45 points compared with that of the previous election.
On the other hand, the DPJ gained the top share in 2003 and 2009.
In 2009, the vote share of DPJ was over 40 percent, and that level had
been never reached by the LDP in these five elections. The vote share
of minor parties such as the CGP (Clean Government Party, in Japanese,
New Komeito), JCP (Japan’s Communist Party), and the SDP (Social
Democratic Party of Japan) had tended to decrease.
Table 5 shows the correlation coefficient between party vote share
政経論叢 第 80巻第 5・6号
106 ( 600 )
Figure 7 Vote share in the PR, 1996�2009
Source: Shugiin Jimukyoku (2009)
Table 5 Correlation coefficient between vote share and DID
population ratio by prefecture (PR).
LDP DPJ CGP JCP SDP
2003 -.597 .386 .134 .418 -.140
2005 -.026 -.162 .034 .388 -.031
2009 -.534 .074 .129 .525 -.096

in PR and the percent of DID by prefectures. The higher a positive
correlation, the more the urban type vote structure is shown, the higher
a negative correlation, the more the rural type vote structure is shown.
In 2003, the LDP was obviously the rural type party and the DPJ had the
urban type structure as well as JCP, however, in the 2005 election, lo-
cated “postal election” by Prime Minister Koizumi, the vote structure
was changed fundamentally. There was no correlation between the
party vote share and the percent of DID. Thus, the Koizumi whirlwind
blew only urban area. In 2005, there was almost no correlation for the
DPJ. In the 2009 election, the correlation coefficient of the LDP returned
to almost the same level as in 2003. That is, the LDP became a rural type
party again. On the other hand, no correlation continued for the DPJ.
3. Trends in voting behavior
3�1 Criterion of voting in the SMD
Since the 1996 election, Japanese voters casted two votes in the
general election because of introducing the mixed electoral system. So,
one is in the SMD tier, the other was in the PR tier. Figure 8 presents
the transition of the criterion of voting behavior in the SMD tier in the
last five general elections. In the 1996 election, the first election under
the new electoral system, the percentage of “party voters” who attached
greater importance to a party rather than to a candidate was 43.4 per-
cent of the respondents. The ratio was somewhat increased in the 2005
election. In the 2005 election, half of the voters were party voters. In the
2009 election, the proportion of party voters increased largely to 61.2%.
In contrast, the percentage of “candidate voters” who attached
greater importance to candidate than to party had gradually decreased
after the new electoral system was introduced. That was over 43.8
percent in the 1996 election, but it was under 30 percent in the 2009
election. The percentage of party voters was almost equal to that of
candidate voters in the 1996 election. On the other hand, the percentage
of party voters was about twice of that of candidate voter in the 2009
Change and Continuity in the 2009 Japanese General Election
107( 601 )

election. One of the aims of electoral reform executed in 1994 was to
encourage the transition from candidate vote to party votes. Because
candidate centered campaign and candidate votes caused to expensive
electoral campaigns, and political corruption. According to the result of
the polls, the aim of electoral reform was being accomplished in the 2009
election.
Table 6 shows the percentage of party voter by social background
from 1996 to 2009. With regard to gender, the percentage of men was
always higher than that of women. On average, the percentage of men
was higher by 6.9 points than that of women. In addition, the regression
coefficient of men is higher than women. A consistent difference
among age categories is not recognized. The trend toward party voting
was relatively high in the twenties. In terms of region, the percentage
of urban voters was higher than that of rural voter. On the average, the
percentage of party voters in metropolitan area was higher by 13.0
points than that of voters in towns and villages, however, the degree of
the trend of rural voters was somewhat higher than that of the urban
voter. From the viewpoint of education, Based on the results of the five
surveys, the percentage of party voters were relatively high in the voter
who experienced higher education.
政経論叢 第 80巻第 5・6号
108 ( 602 )
Figure 8 Criterion of vote choice in the SMD tier, 1996�2009
Source: Akarui Senkyo Suishin Kyokai Post Election Poll.

3�2 Political attitude and vote choice
Party Identification
In classical findings of voting behavior, the Michigan group as-
serted the importance of Party Identification on American voting be-
havior (Campbell et al 1960). Since then, others have recognized the
importance of Party Identification in many countries. Japan was not an
exception. For instance, Ichiro Miyake, a Japanese political scientist,
argued the importance of Party Identification (Party Support) on the
Japanese voting behavior (Miyake 1985). The concept of Party Support
is not entirely equal to the concept of Party Identification advocated by
the Michigan Group, however, the concept of party support was similar
to that of Party Identification.
Figure 9 presents the percentage of the LDP and the DPJ supporter,
Change and Continuity in the 2009 Japanese General Election
109( 603 )
Table 6 Proportion of “party voter” by gender, age, region
and educational level, 1996�2009
1996 2000 2003 2005 2009 mean B
men 46.9 49.5 49.9 54.1 65.8 53.2 4.2
women 40.0 43.2 44.5 46.9 57.0 46.3 3.8
20�29 years old 40.6 44.9 40.2 57.1 65.2 49.6 6.1
30�39 years old 46.6 44.8 51.3 46.4 65.0 50.8 3.8
40�49 years old 42.7 45.1 47.5 51.3 57.6 48.8 3.6
50�59 years old 39.7 46.3 43.4 49.7 62.0 48.2 4.8
60 and older 45.0 47.0 48.4 50.5 60.6 50.3 3.5
metropolitan 50.4 55.0 51.9 61.4 64.3 56.6 3.4
larger city 46.1 46.6 48.8 49.2 62.8 50.7 3.6
smaller city 41.5 41.1 42.6 48.3 58.7 46.4 4.2
rural 35.6 41.7 42.9 43.3 54.7 43.6 4.0
junior high school 39.0 35.4 44.1 46.5 51.2 43.2 3.6
high school 42.3 45.4 43.6 47.1 61.0 47.9 3.9
junior college 45.9 52.5 50.4 51.4 60.4 52.1 2.8
college 54.1 54.4 55.0 60.3 68.6 58.5 3.5
Source: Akarui Senkyo Suishin Kyokai Post Election Poll.

and the Independent voter. In this survey, the wording of the question
wording on Party Identification is “do you usually support any party?”
In 1996, the first election for the DPJ, the percentage of the DPJ identi-
fier was only 3.6%. In the end of 1997, the second party at that time, the
New Frontier Party (NFP), dissolved. The DPJ expanded in 1998, add-
ing a part of the former NFP members of Diet to their own party. The
percentage of Democratic Party supporters increased the next two elec-
tion surveys and was over fifteen percent in 2003. But it decreased to
13.9% in 2005. The percentage rose significantly to 29.3% in 2009. On
the other hand, the percentage of the LDP identifier was relatively
stable. In 2005, it rose to 39.1%, and it was 32.3% in 2009, about 7 points
down from previous election. In 2009, the level of the percentage of DPJ
identifier was similar to that of the LDP. The percentage of Independ-
ent voters was about one third of respondents from 1996 to 2005. That
decreased to one fourth in 2009. These results implied that a part of the
Independent electorate in 2005 shifted to support the DPJ in 2009.
Figure 10 shows the transition of the proportion of the loyal voter
in the PR vote who support the LDP or DPJ in the recent five general
elections. The meaning of loyal voter is a voter who voted for the party
in which the voter identified in attitudinal level. The percentage of the
LDP loyal voters is fewer than that of the DPJ in all five surveys. In
政経論叢 第 80巻第 5・6号
110 ( 604 )
Figure 9 Party Identification, 1996�2009
Source: Akarui Senkyo Suishin Kyokai Post Election Poll.

other words, the LDP supporter defected more easily than the DPJ sup-
porters. The percentage of loyal voters among the LDP supporters was
about 70% from 1996 to 2005 in the general elections, but in 2009, that
decreased to about 50%. In 2009, 25% of the LDP supporters voted for
the DPJ in the PR tier, so the percentage of deviate voters among LDP
supporters increased in 2009. This fact implies that the party loyalty
among the LDP identifiers is weaker than that of the DPJ identifiers.
The percentage of loyal voter in PR was highest within the CGP identi-
fiers in 2009. The proportion of loyal voters among the CGP identifier
was 81% in that election. The high loyalty of the CGP identifier had
been repeatedly recognized.
Independent voters
In recent elections, the voting behavior of Independent voters had
great influence on election results. Many Japanese voters were disillu-
sioned and frustrated with politics since the collapse of the Hosokawa
coalition in 1994, gave up all party affiliations and became Independent
(Ida 2002). Needless to say, Independent voters used to be more volatile
than partisan, so they are sensitive to any given political situation.
Figure 11 shows the behavior of Independent voters in the PR tier from
2000 to 2009 (including nonvoters). In three out of four elections, the
percentage of the DPJ voter exceeded that of the LDP voter. In general,
Change and Continuity in the 2009 Japanese General Election
111( 605 )
Figure 10 Loyal voter among the LDP and the DPJ supporters in the
PR tier, 1996�2009
Source: Akarui Senkyo Suishin Kyokai Post Election Poll.

Independent voters tended to vote for the DPJ more than the LDP. An
exceptional case was the 2005 election in that the DPJ experienced a
overwhelmingly defeat. In that election, the landslide victory of the
LDP was partly attributed to the choice of Independent voters. In 2009,
the percentage of the DPJ voter was over four times that of the LDP, so
the DPJ gained much more than the LDP.
Ideology
The words frequently used to describe the ideological axis in Japan
have been “Conservative (in Japanese, Hoshu) and Progressive (in Japa-
nese, Kakushin).” The distribution on the ideological self-image of re-
spondents was almost unchanging in the results of the polls for last
twenty years. Even in 2009, when the shift of power occurred, the distri-
bution on the ideological self-image was similar to that in 2005, so the
power alternation from the LDP to the DPJ in 2009 was not accompa-
nied with ideological change of voters. The meaning of “progressive” is
somewhat similar to that of “liberal” in the USA and to “left” in Europe,
so the progressive voter had tended to vote for left-wing parties such as
the JSP under the 55 system. Needless to say, the LDP has been gener-
ally recognized as a conservative party in Japan. Therefore, con-
政経論叢 第 80巻第 5・6号
112 ( 606 )
Figure 11 Vote for the LDP and the DPJ among Independent in the
PR tier, 1996�2009
Source: Akarui Senkyo Suishin Kyokai Post Election Poll.

servative voters tend to vote for the LDP, and the progressive voters
tend not to vote for it.
Table 7 shows the voting behavior by conservative-progressive
self-image since the 1996 general election. In the 2005 election, the per-
centage of the LDP voters increased among voters who were identified
progressive, and that did not increased among the conservative voter.
Former Prime Minister Koizumi’s structural reform and the privatiza-
tion of postal service gained a portion of progressive voters in the 2005
election. This fact implied that a portion of progressive voters are
oriented towards a small government, not toward a big government.
However, this change was an exception.
In addition, the LDP lost its traditional supporter largely in the 2009
election. In previous elections, the percentage of the LDP voter among
the “conservative” voters was always over 60%, but it decreased to
40.4% in the 2009 election. The percentage of the LDP voter among the
“fairly conservative” group was about 50% in the 2005 election, but it
was only one fourth in the 2009 election.
On the other hand, the DPJ extraordinarily gained the support of
conservative voters in the 2009 election. In 2005, only one twentieth of
Change and Continuity in the 2009 Japanese General Election
113( 607 )
Table 7 Conservative-Progressive self-image and vote in the PR tier, 1996�2009
Conservative Fairly
Conservative
Middle Fairly
Progressive
Progressive B
vote for LDP
1996 70.0 49.6 25.3 9.7 7.6 -16.47
2000 74.8 45.0 22.2 8.7 6.1 -17.37
2003 64.2 38.5 19.9 7.0 9.2 -14.15
2005 66.4 49.0 30.1 20.3 22.0 -11.75
2009 40.4 25.5 16.0 5.8 6.2 - 8.81
vote for DPJ
1996 2.7 12.1 13.2 16.9 10.6 2.06
2000 7.8 22.3 23.2 33.4 20.4 3.63
2003 9.7 25.7 29.8 51.3 40.2 8.66
2005 5.1 18.7 23.9 37.2 30.0 6.83
2009 27.4 42.6 47.4 56.3 49.2 5.73
Source : Akarui Senkyo Suishin Kyokai Post Election Poll.

“conservative” voters voted for the DPJ, but in 2009, one fourth voted
for the DPJ. The percentage of the DPJ voters among “fairly conserva-
tive” group was under 20% in the 2005 election, however, that was over
40% in the 2009 election, and close to the level of the LDP voters in 2009.
One of the major characteristic of the 2009 election was “the alienation
of conservative voter from the LDP”. This fact implies the diminish of
the former ideorogical axis for Japanese politics.
3�3 Social group and vote choice
Gender
Table 8 shows the voting behavior from the viewpoint of gender.
The survey has showed a gender gap in voting behavior. For the LDP
vote, the percentage of men exceeded that of women in 1996 and 2000,
but the gender gap for the LDP vote has almost disappeared since 2003.
For the DPJ vote, the ratio among men has always exceeded the
women. The difference by gender was slight in 1996 and 2000, but it has
expanded after the amalgamation of the Democratic and the Liberal
party in 2003. The regression coefficient (B) shows that men have a
higher tendency for party vote. That is, for a decreasing tendency of
the LDP vote and an increasing tendency of the DPJ vote, men has
stronger tendency than women.
政経論叢 第 80巻第 5・6号
114 ( 608 )
Table 8 Vote choice by gender in the PR tier, 1996�2009
1996 2000 2003 2005 2009 B mean
LDP
men (a) 37.8 37.5 34.9 43.8 23.5 -2.2 35.5
women (b) 34.5 30.9 35.3 44.4 23.5 -0.9 33.7
difference (a)-(b) 3.3 6.6 - 0.4 - 0.6 0.0 -1.4 1.8
DPJ
men (a) 11.7 26.2 36.6 28.6 52.7 8.4 31.2
women (b) 10.1 25.2 30.0 20.1 45.8 6.6 26.2
difference (a)-(b) 1.6 1.0 6.6 8.5 6.9 1.8 4.9
Source: Akarui Senkyo Suishin Kyokai Post Election Poll.

Age
Among many sociological factors, it has been recognized bloadly
that age is a very important determinant factor on Japanense voting
behavior. The percentage of the LDP voter had been higher than that
of younger voters for a long time (Ida 2009a). In Japan, ageing tends to
be accompanied with conservatism in terms of political and social atti-
tudes4.
Figure 12 presents the percentage of DPJ voter by age category. In
2003, the percentage of the DPJ voter was relatively high among
younger voters and it was relatively low among the older voters; how-
ever, that voting pattern collapsed in the 2005 general election. In 2005,
the DPJ lost votes espacially among younger voters. The highest per-
centage of DPJ voters were voters aged 60�69 in 2005. In 2009, the DPJ
gained votes among over 30 voters. Except for voters in their 20’s, the
DPJ gained over 40% of voters according to the poll.
Figure 13 presents the percentage of the LDP voter by age category.
The percentage of the LDP voter increased in the middle age category
in the 2005 election when compared to 2003. This fact implied that
structural reform to smaller government advocated by Junichiro
Koizumi was supported especially by middle age voters, however, in
2009, the percentage of the LDP voter decreased largely among middle
age voters. In 2009, voters in their 40’s represented only one third of
Change and Continuity in the 2009 Japanese General Election
115( 609 )
Figure 12 Percentage of the DPJ voter by age in the PR tier, 2003�2009
Source: Akarui Senkyo Suishin Kyokai Post Election Poll.

that of 2005. The LDP voting pattern by age in 2009 is similar to that of
2003, but in 2009, the percentage of the LDP voter decreased among all
age categories in comparison to the 2003 election.
Occupation
In addition to age, occupation had been also a important social
factor on Japanese voting behavior. For a long time, the social base of
the LDP was farmers, and managerial occupation. Table 10 shows vote
choice in PR by occupation. In the 2003 election, about half of self-
employed people voted for the LDP and about a quarter of employee
voted for it.
政経論叢 第 80巻第 5・6号
116 ( 610 )
Figure 13 Percentage of the LDP voter by age in the PR tier, 2003�2009
Source: Akarui Senkyo Suishin Kyokai Post Election Poll.
Table 9 Vote choice by age in the PR tier, 1996�2009
Age Category 1996 2000 2003 2005 2009
Vote for LDP
20�39 (a) 21.8 21.5 23.1 39.5 20.5
40� (b) 39.6 37.1 37.4 45.2 24.2
difference (a)-(b) -17.8 -15.6 -14.3 - 5.7 - 3.7
Vote for DPJ
20�39 (a) 13.3 29.2 40.0 23.8 54.0
40� (b) 10.3 24.8 31.7 24.1 47.9
difference (a)-(b) 3.0 4.4 8.3 - 0.3 6.1
Source: Akarui Senkyo Suishin Kyokai Post Election Poll, re-calculated by the author.
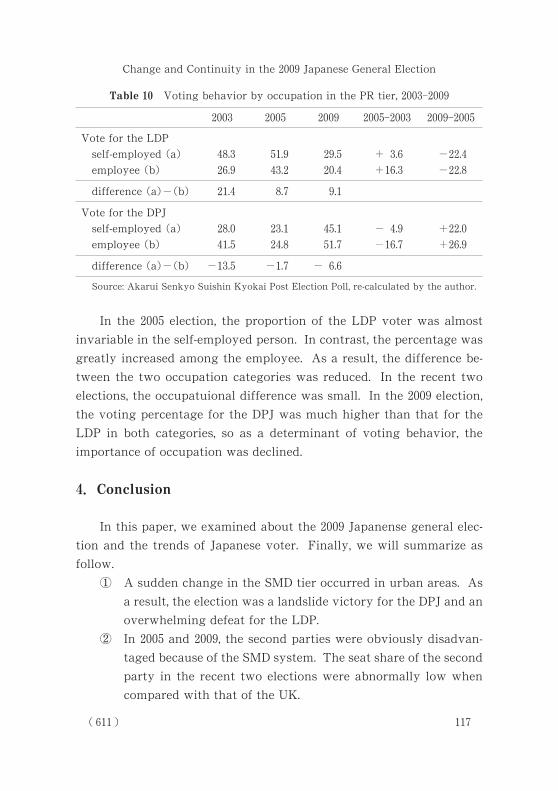
In the 2005 election, the proportion of the LDP voter was almost
invariable in the self-employed person. In contrast, the percentage was
greatly increased among the employee. As a result, the difference be-
tween the two occupation categories was reduced. In the recent two
elections, the occupatuional difference was small. In the 2009 election,
the voting percentage for the DPJ was much higher than that for the
LDP in both categories, so as a determinant of voting behavior, the
importance of occupation was declined.
4. Conclusion
In this paper, we examined about the 2009 Japanense general elec-
tion and the trends of Japanese voter. Finally, we will summarize as
follow.
① A sudden change in the SMD tier occurred in urban areas. As
a result, the election was a landslide victory for the DPJ and an
overwhelming defeat for the LDP.
② In 2005 and 2009, the second parties were obviously disadvan-
taged because of the SMD system. The seat share of the second
party in the recent two elections were abnormally low when
compared with that of the UK.
Change and Continuity in the 2009 Japanese General Election
117( 611 )
Table 10 Voting behavior by occupation in the PR tier, 2003�2009
2003 2005 2009 2005�2003 2009�2005
Vote for the LDP
self-employed (a) 48.3 51.9 29.5 + 3.6 -22.4
employee (b) 26.9 43.2 20.4 +16.3 -22.8
difference (a)-(b) 21.4 8.7 9.1
Vote for the DPJ
self-employed (a) 28.0 23.1 45.1 - 4.9 +22.0
employee (b) 41.5 24.8 51.7 -16.7 +26.9
difference (a)-(b) -13.5 -1.7 - 6.6
Source: Akarui Senkyo Suishin Kyokai Post Election Poll, re-calculated by the author.
③ Evolving two- party system,voter’s interest in general elections
tended to increase in recent elections.
④ For a long time, the LDP had gained votes from middle aged
and elderly voters. But these groups were alienated from the
LDP.
⑤ Occupation had been recognized as a important sociological
factor on the Japanese voting behavior for a long time. But, the
effect of occupational differences on vote choice was dimin-
ished in the two most recent elections.
⑥ Conservative voters alienated from the LDP in the 2009 elec-
tion. This fact implies the diminish of the former ideological
axis (“Conservative”― “Progressive”).
⑦ In additon, the percentage of “Party Voters” who attached
greater importance to a party rather than to a candidate in the
SMD increased largely to 61.2% in the 2009 election. One of the
aims of electoral reform executed in 1994 was to encourage the
transition from candidate vote to party votes. Because candi-
date centered campaign and candidate votes caused to expen-
sive electoral campaigns, and political corruption. According
to the result of the polls, the aim of electoral reform was being
accomplished in the 2009 election.
1 In 2005, Steven R. Reed expressed, “Personally, my bet on a continued
evolution toward a two-party system and an alternation in power within
three elections” (Reed 2005, 292). This forecast was supported by the re-
sults of the 2009 election.
2 The introduction of mixed system in Japan was the one that it consequen-
tially got on the fashion of the world. As Federico Ferrara, Erik S. Herron,
and Misa Nishikawa wrote, “Mixed electoral systems were regularly classi-
fied as anomalies until 1990s.” But, according to their count, “40 states used
these rules at the national level during the period 1990�2004. This figure
constitutes slightly more than 20 percent of the countries of the world”
(Ferrara, Herron, and Nishikawa 2005, 24�25).
政経論叢 第 80巻第 5・6号
118 ( 612 )
Notes

3 Taku Sugawara HP, Nihonseiji Sho Bunseki (An Analysis of Japanese Poli-
tics) http://page.freett.com/sugawara_taku/data/2003did.html.
4 In the past, Barrie Stacey referred on ageing and conservatism. He wrote as
follow. “It is part of conventional political wisdom that people become
typically conservative as they grow older. In this context the word “con-
servative” has several meanings: cautious, unwilling to take risk, opposed
to hasty changes or innovations, strongly supportive of the existing sys-
tem of law and order, convinced of the value of authority and obedience;
resistance or active opposition to influences for general change in society
or many specific kinds of change, or change which is viewed as a threat to
the existing social order, disposed to maintain existing institutions and
traditions; belief that human nature inevitably leads to inequality, conflict,
aggression, and suffering; anti-egalitarian and resistance to change which
would benefit disadvantaged segment of the population.” (Stacey 1978,
138).
Akarui Senkyo Suishin Kyokai (1997) Dai 41 kai Shugiin Giin Senkyo no Jittai
― Chosakekka no Gaiyo-.
Akarui Senkyo Suishin Kyokai (1997) Dai 41 kai Shugiin Giin Senkyo no Jittai.
Akarui Senkyo Suishin Kyokai (2000) Dai 42 kai Shugiin Giin Senkyo no Jittai
― Chosakekka no Gaiyo-.
Akarui Senkyo Suishin Kyokai (2000) Dai 42 kai Shugiin Giin Senkyo no Jittai.
Akarui Senkyo Suishin Kyokai (2004) Dai 43 kai Shugiin Giin Senkyo no Jittai
― Chosakekka no Gaiyo-.
Akarui Senkyo Suishin Kyokai (2004) Dai 43 kai Shugiin Giin Senkyo no Jittai.
Akarui Senkyo Suishin Kyokai (2006) Dai 44 kai Shugiin Giin Senkyo no Jittai
― Chosakekka no Gaiyo-.
Akarui Senkyo Suishin Kyokai (2006) Dai 44 kai Shugiin Giin Senkyo no Jittai.
Akarui Senkyo Suishin Kyokai (2010) Dai 45 kai Shugiin Giin Senkyo no Jittai
― Chosakekka no Gaiyo―.
Akarui Senkyo Suishin Kyokai (2010) Dai 45 kai Shugiin Giin Senkyo no Jittai.
Asahi Shimbun, 2008.9.26.
Asahi Shimbun, 2008.11.11.
Campbell, Angus, Phillp E. Converse, Warren Miller, and Donald Stokes (1960)
The American Voter (New York: Wiley).
Ferrara, Federico, Erik S. Herron, and Misa Nishikawa (2005) Mixed Electoral
Systems: Contamination and Its Consequences (Basingstoke: Palgrave Mac-
millan).
Harrop, Martin, and William L. Miller (1987) Elections and Voters: A Compara-
Change and Continuity in the 2009 Japanese General Election
119( 613 )
References

tive Introduction (London: Macmillan).
Ida Masamichi (2002) “1990 nendai ni Okeru Yukensha no Henshitsu,” Meiji
Daigaku Shakaikagakukenkyujho Kiyo, Dai 40 kan dai 2 go.
Ida Masamichi (2007), Nihon Seiji no Choryu (Hokujyu Shuppan)
Ida Masamichi (2009a) “55 nentaiseiki ni Okeru Seijiishiki ni Kansuru
Ichikosatsu ― Nenreikaiso to Seitousiji ni Tsuite,” Seikei Ronso, Meiji
Daigaku, 78�1・2.
Ida Masamichi (2009b) “Characteristics of the 2005 Japanese Election,” The
Bulletin of Institute of Social Science, Meiji University, Vol. 31, No. 1.
The Japanese Political Science Association (1979) 55 nen Taisei no Keisei to
Hokai, Nenpo Seijigaku 1977, Iwanamishoten.
Kavanagh, Dennis, and Phillip Cowley (2010) The British General Election of
2010 (Basingstone: Palgrave Macmillan).
Miyake Ichiro (1985) Seito Shiji no Bunseki, Sobunsha.
Shugiin Jimukyoku (2009) Dai 45 kai Shugiin Sosenkyo Ichiran, Shugiin
Jimukyoku.
Reed, Steven R. (2005) “Japan: Haltingly Toward a Two-Party System,” In
Michael Gallagher and Paul Mitchell eds., The Politics of Electoral Systems
(Oxford: Oxford University Press): 277�93.
Stacey, Barrie (1978) Political Socialization in Western Society (London:
Edward Arnold).
Yomiuri Shimbun, 2008.9.26.
政経論叢 第 80巻第 5・6号
120 ( 614 )