Embed Size (px)
Citation preview

Change Analysis of UK BAP priority habitats 2003 - 2012 Kent Habitat Survey 2012
Consultant: Nienke Eernisse In collaboration with: Kent Wildlife Trust and Natural England October 2013

Table of Contents
1 Introduction ......................................................................................................................................... 1
2 Methodology ........................................................................................................................................ 2
2.1 Species list ........................................................................................................................................ 2
2.2 Selecting areas to validate ................................................................................................................ 3
2.3 Validation procedure ........................................................................................................................ 4
2.4 Change analysis ................................................................................................................................ 5 2.4.1 Source data and initial quality checking .................................................................................. 5 2.4.2 Method ..................................................................................................................................... 6
3 Validation discussion .......................................................................................................................... 7
3.1 Issues encountered ............................................................................................................................ 7 3.1.1 Using species lists to determine BAP quality habitat ............................................................... 7 3.1.2 Using comments or keywords to assist in validation ............................................................... 7 3.1.3 Use of aerial photographs to assist in validation ...................................................................... 8 3.1.4 Examples of validation of polygons ......................................................................................... 8
3.2 Validation results ............................................................................................................................ 13
4 Change results and discussion .......................................................................................................... 14
4.1 Overall change in UK BAP priority habitats .................................................................................. 14
4.2 Detailed change in UK BAP priority habitats ................................................................................ 16 4.2.1 Grasslands changes ................................................................................................................ 16 4.2.2 Heathland and Traditional Orchard changes .......................................................................... 19
4.3 Detailed change in UK BAP priority habitats in AONB ................................................................. 21
4.4 Change in Coastal Floodplain and Grazing Marsh complex ......................................................... 25 4.4.1 Broad habitat changes ............................................................................................................ 25 4.4.2 UKBAP habitat changes ........................................................................................................ 27
4.5 Potential for restoration ................................................................................................................. 29
4.6 Limitations of the change analysis .................................................................................................. 29
5 References .......................................................................................................................................... 31
6 Glossary ............................................................................................................................................. 32

A APPENDIX Validation guidance for botanist ................................................................................ 33
A.1 Validation of potential UKBAP GNZ and GN1Z areas according to FEP .................................... 33
A.2 Areas to validate ............................................................................................................................. 33
A.3 Validation process .......................................................................................................................... 33
A.4 Deliverables .................................................................................................................................... 36
B APPENDIX FEP guidelines for assessing lowland meadow habitat ............................................. 37
C APPENDIX Change analysis method Kent Habitat Survey 2012................................................. 38
C.1 Data preparation ............................................................................................................................ 38
C.2 Data checking ................................................................................................................................. 38
C.3 Compiling the change data ............................................................................................................. 40
D Appendix Area of BAP in Kent ........................................................................................................ 41
E APPENDIX Maps ............................................................................................................................. 42

Change Analysis of UKBAP Habitats 2003 – 2012 Page 1
1 Introduction
An important objective of the Kent Habitat Survey 2012 (KHS2012) was to analyse change in habitats since 2003. The analysis was carried out for broad habitats in Kent, but could not be completed for UKBAP habitats, due to significant differences in grasslands classification, particularly neutral grasslands.
This study addresses these differences by carrying out a validation of neutral grasslands to
determine UKBAP priority status, before analysing change between the survey periods (2003 and 2012). The study follows a methodology where areas with potential for BAP quality grassland of both survey periods are selected and, based on species composition, assessed whether they are in fact of BAP quality according to Farm Environment Plan (FEP) Manual (Natural England, 2010). Where no or insufficient species have been recorded, the current classification holds.
The work forms a separate entity from the Kent Habitat 2012 survey, which followed the IHS classification using a strictly applied grassland key, different from the 2003 survey. However, the change analysis in this study is based on the results of the KHS2012, replacing areas that are re-classified following the validation process.
Section 1 and 2 describe the methodology and validation results, with examples of the validation
effort provided to illustrate the process. Section 4 describes in detail the change analyses for a Kent as a whole, the High Weald and Kent Downs AONB and the Coastal Floodplain and Grazing Marsh complex. The latter, as a UKBAP complex rather than a habitat, is analysed both by broad habitat, as well as by UKBAP habitat contained within the area.
Specific attention is paid to grassland changes in Kent, taking a closer look at the most important
threats to each type of grassland and where restoration could be effective. The analysis draws attention to type and location of changes, particularly losses of BAP, through presentation and discussion of cross tabulations and maps.

Change Analysis of UKBAP Habitats 2003 – 2012 Page 2
2 Methodology
This study builds on work previously carried out for the Kent Habitat Survey 2012 and as such uses the change analysis results from that work as its basis. A review of the changed areas is also part of this study, and is further detailed in Section 2.4.1. In addition to the changed data, further analysis of the habitats ‘Other Lowland Calcareous Grassland’ (GC1Z) and ‘Other Lowland Dry Acid Grassland’ (GA1Z), ‘Other Lowland Meadow of Importance’ (GN1Z) and ‘Other Neutral Grassland’ (GNZ) is conducted. A full glossary of codes used in this document is presented in Section 6.
GC1Z and GA1Z are simply reclassified as GC1 (Lowland Calcareous Grassland) and GA1 (Lowland Dry Acid Grassland) respectively, thus qualifying them as UKBAP priority habitat.
GN1Z and GNZ areas are selected, linked to species data and validated to determine their classification using the Farm Environment Plan (FEP) Manual (Natural England, 2010).
2.1 Species list
The species list used in the validation of areas is based on the Farm Environment Plan (FEP) Manual (Natural England, 2010) and 2003 Kent Habitat Survey for neutral grasslands (GN1Z and GNZ). A few species listed in the FEP guidelines were excluded and some others that were deemed good indictors were added (pers. comm. Natural England). Table 1 and 2 show the species used.
The criteria to qualify for UKBAP status according to the FEP guidelines read: “At least two frequent and two occasional [of the species in Table 1] in the sward”.
Table 1 List of species required for validating UKBAP status (Adapted from FEP guidance for lowland meadows)
ID English name Latin nameAbbreviation
2003ID English name Latin name
Abbreviation
2003
1 Sneezewort Achillea ptarmica Ach.ptar. 20 Lady’s bedstraw Galium verum Gal.veru.
2 Agrimony Agrimonia eupatoria NA 21 Dyer’s greenweed Genista tinctoria Gen.tinc.
3 Common bent Agrostis capillaris Agr.capi. 22 Yorkshire-fog Holcus lanatus Hol.lana.
4 Bugle Ajuga reptans Aju.rept. 23 Field scabious Knautia arvensis NA
5 Sweet Vernal grassAnthoxanthum
odoratumAnt.odor. 25 Grass Vetchling^ Lathyrus nissolia Lat.niss.
6 Marsh-marigold Caltha palustris Cal.palu. 26 Meadow vetchling Lathyrus pratensis Lat.prat.
7 Glaucous sedge Carex flacca Car.flac. 27 Autumn hawkbitLeontodon
autumnalisNA
8 Hairy Sedge Carex hirta Car.spp. 28 Rough hawkbit Leontodon hispidus NA
9 Common sedge Carex nigra Car.spp. 29 Oxeye daisyLeucanthemum
vulgareLeu.vulg.
10 Carnation sedge Carex panicea Car.spp. 30 Bird’s foot-trefoil Lotus corniculatus Lot.corn.
11 Black knapweed Centaurea nigra Cen.nigr. 31Greater Bird's-foot
TrefoilLotus pedunculatus Lot.pedu.
12 Pignut Conopodium majus Con.maju. 32 Ragged-robin Lychnis flos-cuculi Lyc.flos.
13 Crested dog’s-tail Cynosurus cristatus Cyn.cris. 33Corky-fruited Water-
dropwort^
Oenanthe
pimpinelloidesNA
14Common Spotted
Orchid^Dactylorhiza fuchsii Dac.fuch. 34
Narrow-leaved
Water-dropwort^Oenanthe silaifolia NA
15 Orchids Dactylorhiza spp. Orchid. 35 Adder's-tongue^Ophioglossum
vulgatumOph.vulg.
16 Eyebright sp Euphrasia officinalis NA 36Green-winged
Orchid^Orchis morio Orc.mori.
17 Red fescue Festuca rubra Fes.rubr. 37 Yellow-rattle Rhinanthus minor NA
18 Meadowsweet Filipendula ulmaria Fil.ulma. 38 Pepper-saxifrage Silaum silaus Sil.sila.
19 Marsh bedstraw Galium palustre Gal.palu. 39 Yellow oat-grass Trisetum flavescens NA
^ species added to official FEP guidance list

Change Analysis of UKBAP Habitats 2003 – 2012 Page 3
Table 2 Species added as indicators for UKBAP neutral grassland
ID English name Latin name
1 Common Spotted Orchid Dactylorhiza fuchsii
2 Grass Vetchling Lathyrus nissolia
3 Corky-fruited Water-dropwort Oenanthe pimpinelloides
4 Narrow-leaved Water-dropwort Oenanthe silaifolia
5 Adder's-tongue Ophioglossum vulgatum
6 Green-winged Orchid Orchis morio
2.2 Selecting areas to validate
The areas that need to be validated for this study are primarily the polygons classified as ‘GN1Z’ (Other lowland meadow of importance) in the 2012 Kent habitat data. In addition a number of polygons field surveyed in 2003 were added, with habitats of GNZ or GN1Z, as these would also meet the FEP criteria for Lowland meadow of UKBAP quality. A retrospective validation of these areas takes into account the species content, comments and keywords recorded during the field survey. Areas that were not field surveyed could not be included in the validation.
Habitat 2012 polygons with codes GA1Z and GC1Z are directly converted to become GA1 and GC1 respectively, thus achieving UKBAP status. This follows procedures used in 2003, where presence of strong calcareous or acid grassland indicators automatically classified the polygon into the UKBAP quality habitat.
Where the overlapping 2003 habitat polygon was not UKBAP, but instead GNZ or GN1Z, the 2003 data is further validated where possible (based on species list and comments recorded). Where insufficient data is available for the 2003 habitat data to be re-evaluated, the current classification will be retained and a change will be recorded from ‘no UKBAP’ in 2003 to ‘UKBAP’ in 2012.
Areas to be validated are selected based on overlap between habitat 2003 and 2012 areas. As
the geometry between the two datasets is distinctly different, the 2012 geometry and polygon outlines will be used as the reference standard. Where 2003 polygons extend much beyond the 2012 outline, only the area that overlaps will be considered.
In the GIS areas are selected for validation using a two-stage method. In the first instance all
areas in 2003 that are UKBAP quality, ‘GN1Z’ or ‘GNZ’ are selected for validation. Then all areas of 2012 that overlap with these polygons are identified and marked for validation. Finally all areas that are UKBAP quality or ‘GN1Z’ are selected and added to 2012 areas for validation. This ensures that al potentially UKBAP areas of both periods are considered for validation. A central point (centroid) is created for every selected 2012 polygon. Through a spatial join procedure in GIS this centroid file displays habitat codes and unique identifiers for both 2003 and 2012 surveys.
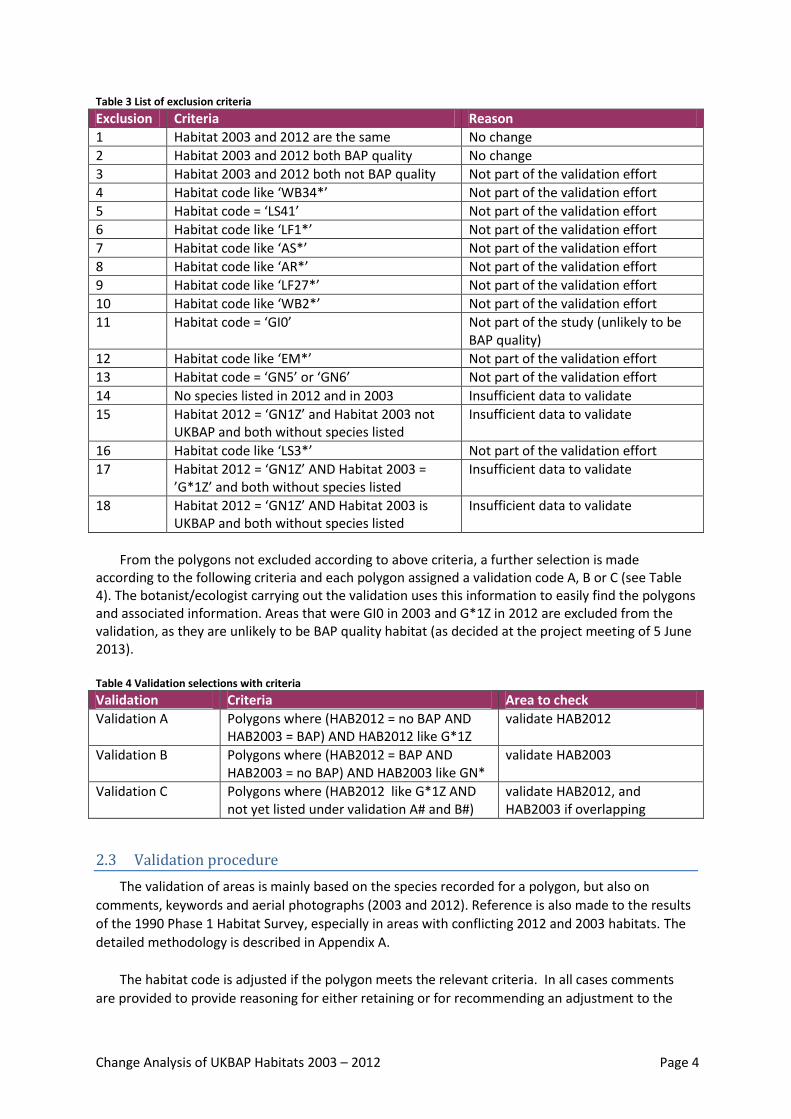
This initial selection takes into account all polygons that in 2003 or in 2012 were of UKBAP
quality or ‘GN1Z’ habitat. From this broad selection records are excluded where criteria are not met. Table 3 lists the sequence of exclusions from the initial broad selection. The centroid file is used to select corresponding polygons from both 2012 and 2003 datasets that will be validated. The final selections are saved as feature classes in a personal geo-database (an MS Access file).
Change Analysis of UKBAP Habitats 2003 – 2012 Page 4
Table 3 List of exclusion criteria
Exclusion Criteria Reason
1 Habitat 2003 and 2012 are the same No change
2 Habitat 2003 and 2012 both BAP quality No change
3 Habitat 2003 and 2012 both not BAP quality Not part of the validation effort
4 Habitat code like ‘WB34*’ Not part of the validation effort
5 Habitat code = ‘LS41’ Not part of the validation effort
6 Habitat code like ‘LF1*’ Not part of the validation effort
7 Habitat code like ‘AS*’ Not part of the validation effort
8 Habitat code like ‘AR*’ Not part of the validation effort
9 Habitat code like ‘LF27*’ Not part of the validation effort
10 Habitat code like ‘WB2*’ Not part of the validation effort
11 Habitat code = ‘GI0’ Not part of the study (unlikely to be BAP quality)
12 Habitat code like ‘EM*’ Not part of the validation effort
13 Habitat code = ‘GN5’ or ‘GN6’ Not part of the validation effort
14 No species listed in 2012 and in 2003 Insufficient data to validate
15 Habitat 2012 = ‘GN1Z’ and Habitat 2003 not UKBAP and both without species listed
Insufficient data to validate
16 Habitat code like ‘LS3*’ Not part of the validation effort
17 Habitat 2012 = ‘GN1Z’ AND Habitat 2003 = ’G*1Z’ and both without species listed
Insufficient data to validate
18 Habitat 2012 = ‘GN1Z’ AND Habitat 2003 is UKBAP and both without species listed
Insufficient data to validate
From the polygons not excluded according to above criteria, a further selection is made
according to the following criteria and each polygon assigned a validation code A, B or C (see Table 4). The botanist/ecologist carrying out the validation uses this information to easily find the polygons and associated information. Areas that were GI0 in 2003 and G*1Z in 2012 are excluded from the validation, as they are unlikely to be BAP quality habitat (as decided at the project meeting of 5 June 2013).
Table 4 Validation selections with criteria
Validation Criteria Area to check
Validation A Polygons where (HAB2012 = no BAP AND HAB2003 = BAP) AND HAB2012 like G*1Z
validate HAB2012
Validation B Polygons where (HAB2012 = BAP AND HAB2003 = no BAP) AND HAB2003 like GN*
validate HAB2003
Validation C Polygons where (HAB2012 like G*1Z AND not yet listed under validation A# and B#)
validate HAB2012, and HAB2003 if overlapping
2.3 Validation procedure
The validation of areas is mainly based on the species recorded for a polygon, but also on
comments, keywords and aerial photographs (2003 and 2012). Reference is also made to the results
of the 1990 Phase 1 Habitat Survey, especially in areas with conflicting 2012 and 2003 habitats. The
detailed methodology is described in Appendix A.
The habitat code is adjusted if the polygon meets the relevant criteria. In all cases comments
are provided to provide reasoning for either retaining or for recommending an adjustment to the

Change Analysis of UKBAP Habitats 2003 – 2012 Page 5
existing code. In accordance with advice provided by Phil Williams (Natural England) the IHS code to
be used to validate BAP quality lowland meadow is GN12. Where appropriate this code is used for
polygons from both 2003 and 2012 data.
The species list for each polygon is assessed against standard tables listed in the FEP Manual and
Technical Information Note TIN110 (Natural England, 2012). These tables provide a system for
assessing whether created or restored grass swards have reached a point at which they can be
considered species-rich and a Biodiversity Action Plan (BAP) priority habitat. If the number and
frequency of indicator species meets the habitat-specific threshold set out in the table then the
sward can be considered to be good quality priority habitat. Where the species threshold is only just
met and no additional comments hint at good quality grassland, the term ‘marginal’ is added to the
comment. The table relating to G06 (lowland meadows) has been extracted from FEP (Appendix B).
Polygons of 2012 selected for validation were all considered to meet the minimum criteria listed
in the FEP guidelines for G06: Lowland meadows, i.e. of the listed species, at least two should be
frequent and two occasional in the sward.
In 2003, not all the species were recorded by choosing from a list, but instead additional species
were captured in a free text format, and dominance was often omitted. The 2003 polygons selected
for validation did not automatically meet the full FEP species criteria, but those polygons had at least
three of the required FEP species (including the additional ones listed in Table 2).
2.4 Change analysis
2.4.1 Source data and initial quality checking
The source data sets used in this study are listed in Table 5 below. The Change 2003-2012 data from the Kent Habitat Survey 2012 forms the basis of the change analysis, with further additions of areas that are validated as described in the section ‘Validation procedure’.
The Change 2003-2012 data resulted from the change analysis carried out as part of the ARCH
project. Most change has been confirmed through a detailed checking procedure as part of the ARCH project. Automated checks are carried out initially, but geometry differences between the two periods causing mismatched overlaps dictated an intensive manual checking exercise.
Another issue is that the two datasets use slightly different codes to describe the same feature. For example, a traditional orchard in 2003 was primarily classed as grassland with management code CL3, whereas in 2012 this area would be classed as FT1. Similarly, cemeteries were classed as UR0 in 2003, and GI0/GNZ in 2012 with management code UA41. During the ARCH project these issues were resolved as much as possible, and where changes appeared in these areas, polygons were checked manually. In most cases the change was not real, but a result of a coding difference.
Table 5 Source data for change analysis
Data set Source Processed
1# Kent Habitat Survey 2012 - Change 2003 - 2012
Kent Habitat Survey 2012 (ARCH project)
All polygons >=5m2, UKBAP in 2003 or in 2012
2# Habitat 2003 Kent habitat Survey 2003 (based on aerial photography of 1999)
Polygons validated and assigned UKBAP status
3# Habitat 2012 Kent Habitat Survey 2012 (based on aerial photography of 2008)
Polygons validated and assigned UKBAP status

Change Analysis of UKBAP Habitats 2003 – 2012 Page 6
A number of manual checks are carried out to ensure that the polygon in question has really
changed, or has really remained the same (Appendix C). The majority of these polygons were already checked during the ARCH project, but especially where grassland polygons are concerned further manual checks are carried out (see Table 6).
Table 6 Manual and automated checks carried out on the KHS 2012 change data.
Check found: Action taken
Data of an area on the North Kent coast was missing
Re-analysed the missing area data and appended to the change data set
‘NULL’ values in the change data
Checked relevant areas to determine which value should be assigned and updated the change data accordingly (manual and automated checks)
Coastal grazing marsh unrecorded in change data for 2003
Added coastal grazing marsh to data where recorded as keyword or comment in 2003 (manual checks)
Duplicate polygons Attribute data checked and duplicate polygon removed (manual checks)
The results of the validation process are integrated into a single dataset with the Change 2003-
2012 data for final analysis. Areas that now show change and BAP quality habitat in either period, are added. Equally, any areas that are considered unchanged after the validation, are marked as ‘No Change’ and excluded from further analysis.
2.4.2 Method
The BAP change analysis procedure uses the results of the Change analysis of the Kent Habitat Survey 2012 (KHS, 2012. See Appendix C), with additional data produced by the neutral grassland validation of both periods.
The change analysis is carried out in two parts. The first part produces overall total changes in each habitat. The second part is more detailed and looks at how each habitat changed and where the changes took place.
The analyses are carried out in an MS Access database, with queries and macros that summarise the attribute information from the GIS change data and export results to MS Excel spreadsheets. From the latter cross-tabulations are produced, which show in detail how habitats have changed between 2002 and 2012. The GIS data is further used to display distribution of changed areas in Kent (Appendix E).

Change Analysis of UKBAP Habitats 2003 – 2012 Page 7
3 Validation discussion
3.1 Issues encountered
A discussion of the practical issues arising during the validation process is presented in this
section, along with a series of examples illustrating areas where the original classification was
adjusted on the basis of species content, aerials or field survey comments.
3.1.1 Using species lists to determine BAP quality habitat
The main validation analysis involves assessing the species recorded for each polygon against the
species list provided for Lowland Meadows BAP habitat (see section 2.3).
Areas that supported some of the characteristic grass species and where the wildflower
indicator species either met or exceeded the relevant FEP species abundance threshold, i.e. they
supported some of the characteristic grass species and either three wildflower indicator species
were occasional or four were present, were considered to be BAP quality habitat. There were many
polygons where the species lists just met the minimum threshold and unless there was good
evidence (from the comments, keywords or aerial photographs) to exclude these areas from the BAP
quality habitat classification, these were coded as GN12, with the validation comment indicating that
they are considered to be of “marginal BAP quality habitat”. Recording the word ‘marginal’ means
these polygons may be identified for additional analysis if required.
3.1.2 Using comments or keywords to assist in validation
Comments and keywords were very helpful in assisting in the determination of the BAP status of
a polygon, particularly where the species list was not sufficient to enable a clear determination to be
made. Phrases may give a clue as to the structure of the site, its management, underlying soils and
geology, and provide reasons for a limited species list. For example:
“Anthills; farmer reports field managed for hay for at least last 20 years; spp-rich, sown with
wildflower mix” Comments such as these help to reinforce the value of a species list, by
providing an indication that the grassland is likely to be long-established, and/or managed
appropriately to sustain its wildlife interest.
“Mosaic of acid / neutral patches; shows calcareous influences” There were occasions where
a species list contained a mix of indicator species, containing a similar number and
abundance of, for example, both neutral and chalk species. Statements such as these were
helpful in determining not only whether a polygon was BAP or not, but whether it was
lowland meadow, lowland calcareous grassland or lowland dry acid grassland.
“Non-optimal season; non-optimal weather; binocular view; grass cut just before visit; tightly
grazed” These phrases provide an indication that the survey may well have under-recorded
the species that might be present. At this point, a comparison would be made with the
species data (and comments/keywords) provided within the corresponding 2003/2012
polygon. If the corresponding polygon was BAP standard and if the polygon being validated
was close to meeting the BAP criteria, for example it supported two frequent, one occasional
and one rare wildflower indicator species, then allowances may be made for the difficulties
encountered during the survey.
“Grassland becoming rank; spp-poor; non-native invasives; colonising by scrub; unmanaged;
dominated by Lolium perenne” If a polygon was deemed to be of marginal BAP status i.e. it
supported four wildflower indicator species at rare abundance only and had no strong
indicator species, then these types of comments were valuable in deciding whether a
polygon was classified as GN12, or whether it retained its existing classification.

Change Analysis of UKBAP Habitats 2003 – 2012 Page 8
3.1.3 Use of aerial photographs to assist in validation
The 2003 and 2012 aerial photographs were checked for most of the polygons, as it was found
that they provide useful supplementary information. In some instances photographs demonstrated
significant structural changes to a habitat such as scrub invasion, disturbance or apparent change of
land use (e.g. land incorporated into an adjacent garden) that helped to explain why the data
between corresponding polygons from 2003 and 2012 might appear so different. The aerial photographs were also extremely useful for situations where perhaps there was no
supporting species list for one of the polygons. In these instances, the aerial photographs were assessed for structural changes such as described in the previous paragraph. Whilst some caution was required, it was particularly helpful for sites such as churchyards or cemeteries, where significant changes to the management considered unlikely. Providing the aerial photograph comparison showed no obvious changes to the sward structure then amending the code of the polygon with little or no species data could be undertaken with reasonable confidence. Examples 4 and 5 in Section 3.1.4 illustrate this point.
3.1.4 Examples of validation of polygons
Example 1 reclassification from neutral to calcareous grassland
There were occasions where it was evident that, whilst a particular polygon was already
classified as neutral grassland, the species list supported indicator species that were more closely
allied to chalk or acid grassland and therefore the analysis was widened to take into account tables
for Lowland calcareous grassland (G04) and Lowland acid grassland (G05). This situation is illustrated
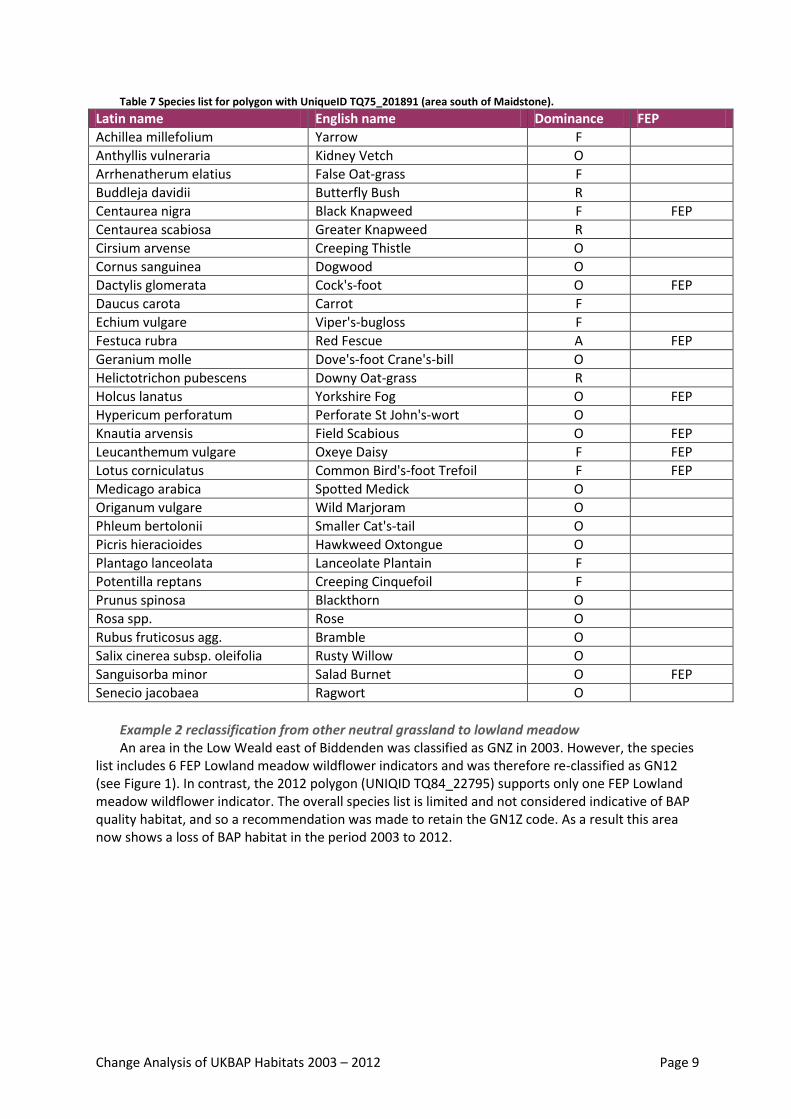
in the following example, originally classified as GN1Z. The full species list of this area in Table 7
shows which species are included in the FEP lowland meadow guidance.
The list includes a mix of both neutral and calcareous indicator species: 5 FEP G06 wildflower
indicator species (3xF; 2xO) and 7 FEP G04 wildflower indicator species (2xF; 4xO; 1xR). The field
surveyor had also commented that there was “calcareous influence from ragstone.”
The 1990 habitat survey mapped the polygon as neutral with a central area of semi-improved
calcareous grassland (SCG) and scattered scrub. Based on the species list, the survey comment and
the 1990 habitat survey data, re-classification of this area is recommended to lowland calcareous
grassland (GC1).
Change Analysis of UKBAP Habitats 2003 – 2012 Page 9
Table 7 Species list for polygon with UniqueID TQ75_201891 (area south of Maidstone).
Latin name English name Dominance FEP
Achillea millefolium Yarrow F
Anthyllis vulneraria Kidney Vetch O
Arrhenatherum elatius False Oat-grass F
Buddleja davidii Butterfly Bush R
Centaurea nigra Black Knapweed F FEP
Centaurea scabiosa Greater Knapweed R
Cirsium arvense Creeping Thistle O
Cornus sanguinea Dogwood O
Dactylis glomerata Cock's-foot O FEP
Daucus carota Carrot F
Echium vulgare Viper's-bugloss F
Festuca rubra Red Fescue A FEP
Geranium molle Dove's-foot Crane's-bill O
Helictotrichon pubescens Downy Oat-grass R
Holcus lanatus Yorkshire Fog O FEP
Hypericum perforatum Perforate St John's-wort O
Knautia arvensis Field Scabious O FEP
Leucanthemum vulgare Oxeye Daisy F FEP
Lotus corniculatus Common Bird's-foot Trefoil F FEP
Medicago arabica Spotted Medick O
Origanum vulgare Wild Marjoram O
Phleum bertolonii Smaller Cat's-tail O
Picris hieracioides Hawkweed Oxtongue O
Plantago lanceolata Lanceolate Plantain F
Potentilla reptans Creeping Cinquefoil F
Prunus spinosa Blackthorn O
Rosa spp. Rose O
Rubus fruticosus agg. Bramble O
Salix cinerea subsp. oleifolia Rusty Willow O
Sanguisorba minor Salad Burnet O FEP
Senecio jacobaea Ragwort O
Example 2 reclassification from other neutral grassland to lowland meadow An area in the Low Weald east of Biddenden was classified as GNZ in 2003. However, the species
list includes 6 FEP Lowland meadow wildflower indicators and was therefore re-classified as GN12 (see Figure 1). In contrast, the 2012 polygon (UNIQID TQ84_22795) supports only one FEP Lowland meadow wildflower indicator. The overall species list is limited and not considered indicative of BAP quality habitat, and so a recommendation was made to retain the GN1Z code. As a result this area now shows a loss of BAP habitat in the period 2003 to 2012.

Change Analysis of UKBAP Habitats 2003 – 2012 Page 10
Figure 1 Species list, including original habitat details from survey (top) and validation comments (bottom).
Example 3 reclassification taking into account previous and subsequent surveys There were also occasions where reliance on the species lists alone for the validation of
individual polygons could lead to misleading results. For example, the 2012 polygon UNIQID TR24_147886 was classified in 2012 as Lowland calcareous grassland (GC1), which is consistent with the 1990 habitat survey classification of Calcareous grassland (CG). However, the overlapping 2003 polygon is classified as GNZ and with 5 FEP lowland meadow wildflower indicator species, reflecting the neutral grassland classification of the area.
Reliance on just the 2003 species list would have led to the conclusion that the polygon should
be re-classified as GN12. However, results of the 1990 and 2012 habitat surveys, together with knowledge that the site is part of the Lydden Roadside Nature Reserve near Dover, a site designated for its chalk downland flora, indicate that the site is more likely to comprise calcareous rather than neutral grassland. The decision was therefore taken to attach more weight to the 1990 and 2012 habitat classifications than to the species list of 2003 and the classification was amended to GC1.
Change Analysis of UKBAP Habitats 2003 – 2012 Page 11
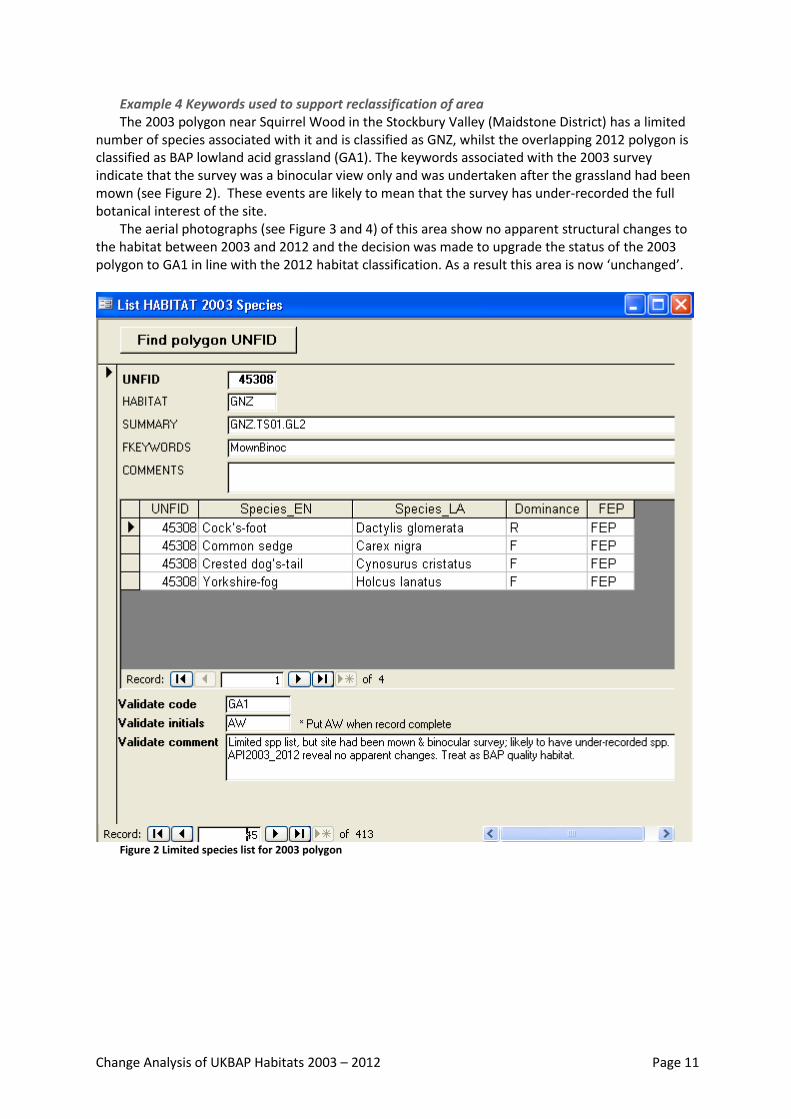
Example 4 Keywords used to support reclassification of area The 2003 polygon near Squirrel Wood in the Stockbury Valley (Maidstone District) has a limited
number of species associated with it and is classified as GNZ, whilst the overlapping 2012 polygon is classified as BAP lowland acid grassland (GA1). The keywords associated with the 2003 survey indicate that the survey was a binocular view only and was undertaken after the grassland had been mown (see Figure 2). These events are likely to mean that the survey has under-recorded the full botanical interest of the site.
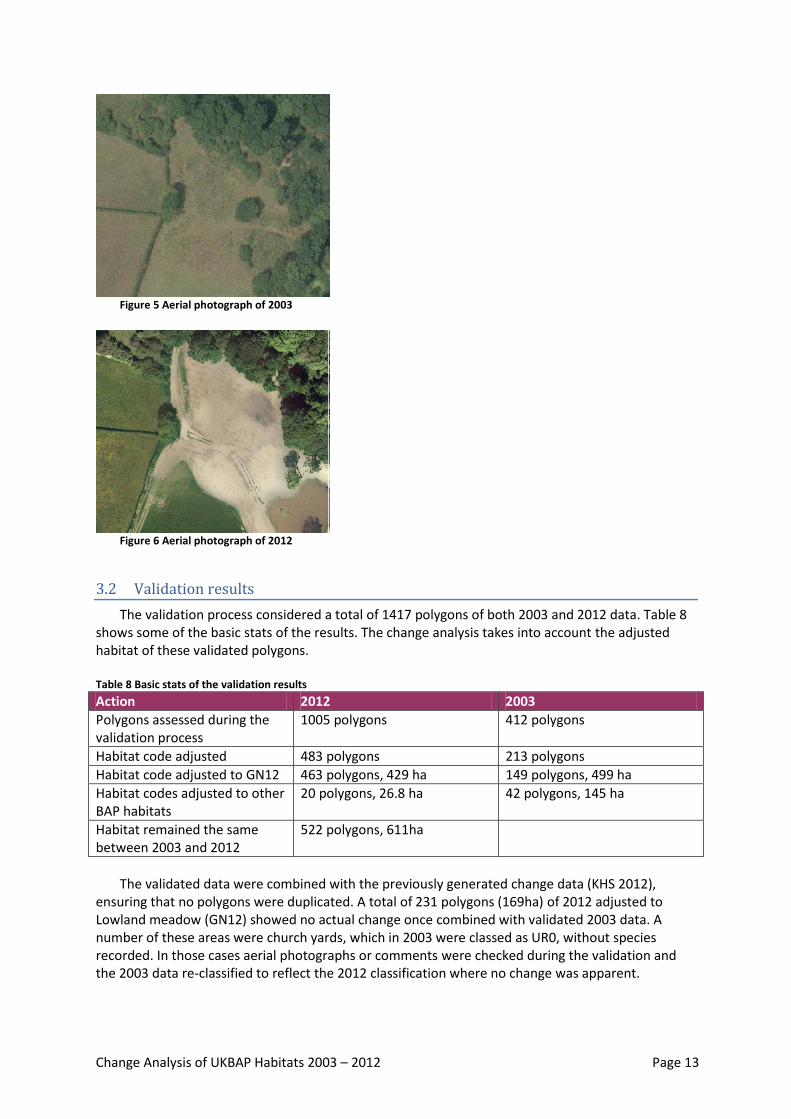
The aerial photographs (see Figure 3 and 4) of this area show no apparent structural changes to the habitat between 2003 and 2012 and the decision was made to upgrade the status of the 2003 polygon to GA1 in line with the 2012 habitat classification. As a result this area is now ‘unchanged’.
Figure 2 Limited species list for 2003 polygon

Change Analysis of UKBAP Habitats 2003 – 2012 Page 12
Figure 3 Aerial photograph of 2003
Figure 4 Aerial photograph of 2012
Example 5 Aerial photographs used to support re-classification The churchyard of Teston (southwest of Maidstone) is classified as ‘Built area’ (UR0) in 2003 and
has no associated species data. In 2012 the same area is classified as GN1Z and displays a short species list. A comparison of the aerial photographs of 2003 and 2012 shows no obvious structural changes to the habitat. Therefore, despite the lack of information available for 2003, it was considered appropriate to recommend changing the classification from UR0 to GN1Z. As a result of the re-classification this area is recorded as unchanged. As neither period resulted in a BAP classification, this area is excluded from the change analysis in this report.
Example 6 Significant change since publication of the 2012 habitat data. The species information for the 2012 an area northeast of Tenterden meets the criteria for
classification as GN12 lowland meadow. Unfortunately, a comparison of the 2003 and 2012 aerial photographs shows that the site has undergone significant disturbance since the field survey was undertaken. It was appropriate to classify the polygon as GN12, but the validation comment makes reference to the potential loss of the grassland since the survey (see Figure 5 and 6).
Change Analysis of UKBAP Habitats 2003 – 2012 Page 13
Figure 5 Aerial photograph of 2003
Figure 6 Aerial photograph of 2012
3.2 Validation results
The validation process considered a total of 1417 polygons of both 2003 and 2012 data. Table 8 shows some of the basic stats of the results. The change analysis takes into account the adjusted habitat of these validated polygons.
Table 8 Basic stats of the validation results
Action 2012 2003
Polygons assessed during the validation process
1005 polygons 412 polygons
Habitat code adjusted 483 polygons 213 polygons
Habitat code adjusted to GN12 463 polygons, 429 ha 149 polygons, 499 ha
Habitat codes adjusted to other BAP habitats
20 polygons, 26.8 ha 42 polygons, 145 ha
Habitat remained the same between 2003 and 2012
522 polygons, 611ha
The validated data were combined with the previously generated change data (KHS 2012),
ensuring that no polygons were duplicated. A total of 231 polygons (169ha) of 2012 adjusted to Lowland meadow (GN12) showed no actual change once combined with validated 2003 data. A number of these areas were church yards, which in 2003 were classed as UR0, without species recorded. In those cases aerial photographs or comments were checked during the validation and the 2003 data re-classified to reflect the 2012 classification where no change was apparent.

Change Analysis of UKBAP Habitats 2003 – 2012 Page 14
A further total of 235 polygons (264ha) were adjusted to GN12 and showed actual change, mostly from other neutral grasslands and other lowland meadows of importance. Finally a total of 4 polygons (3.5ha) adjusted to other BAP habitats also resulted in actual change.
4 Change results and discussion
4.1 Overall change in UK BAP priority habitats
The results presented in this report only concern changes involving UK BAP priority habitats, either in 2003 or in 2012, or both. For details of non-BAP habitats in both periods see the Kent Habitat Survey report (2013). Three types of change are distinguished in the results:
1. Change from and to non-BAP habitats (loss and gain) 2. Change of habitats within the same UKBAP category 3. Change of habitats between different UKBAP categories
Gain of UK BAP habitat is a complex case. In principle it indicates that new BAP habitat is
formed, which could be the result of favourable management practices, e.g. grazing and mowing, or restoration efforts, e.g. scrub removal. In some cases gain is achieved by reclassification of field surveyed data, using less strict criteria. In the validation effort carried out for this project data for a number of areas were re-interpreted, resulting in reclassification as BAP habitat. Table 9 lists the total areas, involving BAP habitats, which changed between 2003 and 2012.
Table 9 Total areas changed 2003 - 2012
Type of change Total area (ha)
BAP in 2003 – not BAP in 2012 (loss) 764
Not BAP in 2003 - BAP in 2012 (gain) 1078
Change within BAP category 293
Change between BAP categories 100
Total area changed 2,235
A cross tabulation based on the summary by period and by BAP category shows the exact area
changed from one category in 2003 to another category in 2012 (see Table 10). The table reads from left with habitats of 2003 changing to the habitats of 2012 listed in the column headings. For example ‘Coastal Saltmarsh’ in 2003 has changed to ‘Intertidal Mudflats’ (5.6ha), ‘Saline Lagoons’ (0.09ha) and ‘no-BAP’ (14.83ha) in 2012. The table shows exactly how the BAP habitats of 2003 have changed to BAP and no-BAP habitats in 2012. Equally we can see how the habitats of 2012 are made up from the various categories in 2003 (top to bottom). Figures in grey blocks show where the IHS habitat code changed, but not the overall BAP category, indicating change within the BAP category. Some of the bigger losses and gains of BAP habitat have been highlighted with a thicker cell boundary.
Map 1 in Appendix E shows the overall distribution of changes of BAP habitat, while Map 2 presents the distribution in more detail with ‘loss’ (red), ‘gain’ (green) and ‘no change’ (blue).

Change Analysis of UKBAP Habitats 2003 – 2012 Page 15
Table 10 Cross-tabulation of overall change 2003 - 2012
B AP change
C oasta l
Sa lt-
m arsh
C oasta l
Sand
D unes
C oasta l
Vegetate
d Shing le
In tertida l
C halk
In tertida l
M udfla ts
Low land
B eech
and Yew
W ood-
land
Low land
C al-
careous
G rass-
land
Low land
D ry Ac id
G rass-
land
Low land
Fens
Low land
H eath-
land
Low land
M eadow
Low land
M ixed
D ec i-
duous
W ood-
land
M aritim e
C liffs and
S lopes
Purp le
M oor
G rass
and
R ush
Pasture
R eed-
beds
Saline
Lagoons
Sheltere
d M uddy
G ravels
Trad ition
a l
O rchards
W et
W ood-
land
N o BA P
Tota l
2003
changed
1,338 455 932 419 10,079 613 1,160 261 12 73 457 153 39 11 545 286 9 1,676 663
C oasta l
Sa ltm arsh24.63 0.03 5.60 0.09 14.83 45.18
C oasta l Sand
D unes0.14 6.74 2.86 0.34 0.01 3.97 14.06
C oasta l
Vegetated 0.40 67.39 0.14 0.36 2.66 22.20 93.15
In tertida l C halk 0.41 0.02 1.37 1.80
In tertida l
M udfla ts29.41 5.26 13.84 0.31 0.23 0.01 29.90 78.96
Low land Beech
and Yew
W oodland
7.43 7.00 3.47 17.90
Low land
C alcareous 0.01 160.19 2.74 169.33 332.27
Low land D ry
Ac id G rass land0.17 0.25 9.22 0.23 6.59 0.09 0.02 48.46 65.03
Low land Fen 0.00
Low land
H eath land0.14 0.79 1.63 0.05 0.01 3.94 6.56
Low land
M eadow7.59 2.14 0.07 0.01 0.61 120.95 131.37
Low land M ixed
D ec iduous 0.00
M aritim e C liffs
and S lopes0.04 0.01 0.34 4.74 2.84 7.97
Purp le M oor
G rass and 0.11 1.45 1.56
R eedbeds 4.68 17.04 21.72
Saline Lagoons 1.17 0.25 2.41 3.83
Sheltered
M uddy G ravels0.00
Traditiona l
O rchards0.26 3.01 0.37 309.63 313.27
W et W oodland 0.35 0.71 8.80 12.47 22.33
N o BAP 78.53 4.51 46.64 0.04 34.78 0.86 246.98 55.21 3.85 20.79 254.83 1.82 3.64 1.00 64.59 13.66 176.20 69.78 1077.71
T otal 2012 changed 133.88 17.12 131.33 0.39 41.28 8.29 422.10 66.71 3.85 21.88 265.80 1.96 8.40 1.00 67.02 13.75 0.01 179.21 86.43 764.26 2234.7
2012 H abitat (ha)
2003
H abitat
(ha)
Tota l area in 2012 (ha)
Grey cell: change within a BAP category, for example GC1 in 2003 and GC113 in 2012, both of which are within the Lowland Calcareous Grassland BAP

Change Analysis of UKBAP Habitats 2003 – 2012 Page 16
4.2 Detailed change in UK BAP priority habitats
This section describes in more detail the losses and gains of UKBAP habitats, to and from other broad habitats as summarised in the pale orange and blue cells in the cross-tabulation (Table 10). Maps showing where changes occurred are presented in Appendix E.
4.2.1 Grasslands changes
Grassland habitats form an important habitat in Kent, covering more than a third of the county, with non-BAP improved and semi-improved grasslands making up the majority. Before the validation of this project the UKBAP grassland combined to 0.98% of all Kent grassland (1,448ha). Validation added 429ha of Lowland Meadow to the current UKBAP grassland resource, bringing the UKBAP portion to 1.27% of total grassland in Kent. UKBAP grassland losses combine to 44.4% of total loss of UKBAP habitat in Kent. Appendix D lists the total area of BAP habitat, including the validated grasslands of this study.
The cross-tabulation of Table 10 shows the changes from UKBAP grassland to other BAP and
non-BAP habitats. Changes within UKBAP category largely occur in the Lowland Calcareous Grassland (160.2ha) and a very small portion in Lowland Dry Acid Grassland (9.2ha) and Lowland Meadow (0.1ha). It is important to note that ‘Within BAP’ change is largely a result of different classifications used during both periods. Where in 2003 most calcareous grasslands were classed at the highest hierarchical level ‘GC1’, in 2012 a more detailed code was often used, e.g. ‘GC113’ – rank calcareous grassland. In terms of changing BAP categories, this does not constitute a real change as the habitats remain within the same BAP category of Lowland Calcareous Grassland.
Changes between UKBAP categories involving grassland make up half of the total ‘between BAP’
change. Neutral grassland sees the most ‘between BAP’ changes, to and from acid grassland, calcareous grassland and heathland (total 21.4ha). To some extent this will be a result of the validation which focused the re-classification effort on neutral grasslands.
Map 3 in Appendix E shows in green areas of ‘between BAP’ change, which were either grassland in 2003, or in 2012 or both, and UKBAP in all cases. A considerable portion of change occurs in East Kent.
From the cross-tabulation it is also apparent that a large portion of UKBAP grassland is lost to
non-BAP habitats and it is these areas that could be of interest for restoration efforts. It is therefore important to understand where the UKBAP habitat is lost and to which non-BAP habitats. Map 3 shows in red where such losses occur, particularly in East Kent, around Tunbridge Wells and Sevenoaks.
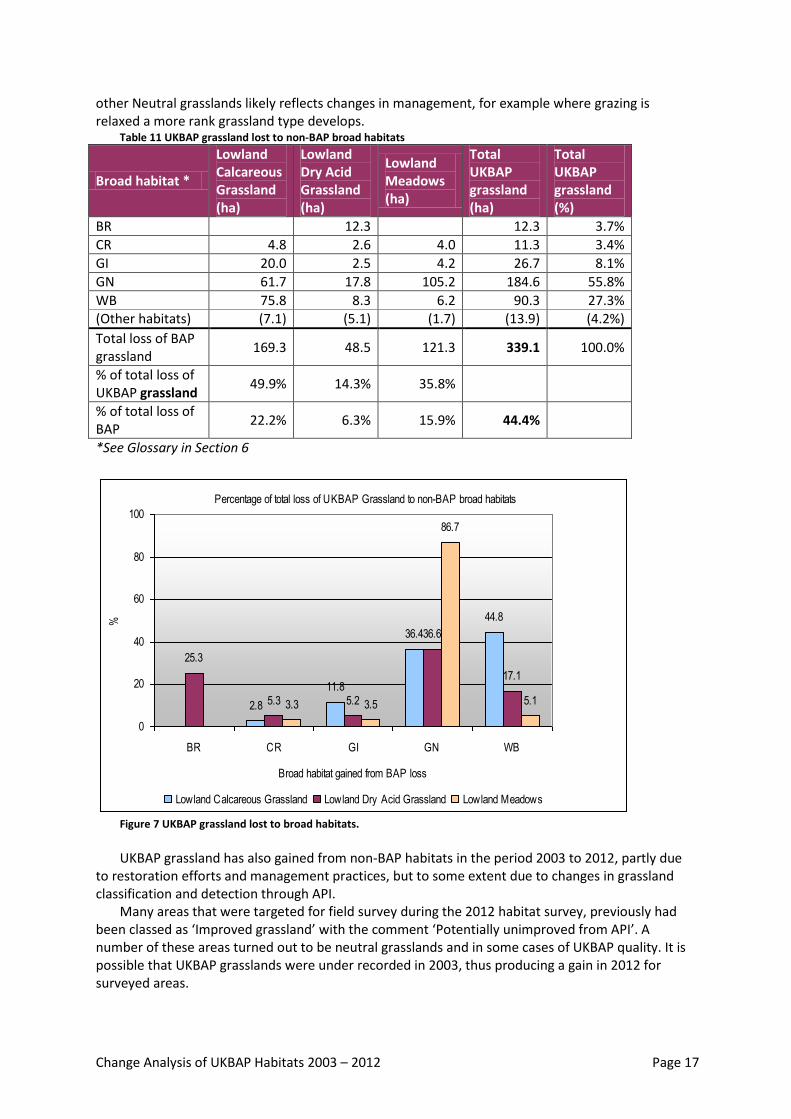
Table 11 details which broad habitats benefit most from the loss of priority habitat grassland. Overall, most of the priority grasslands are lost to non-BAP Neutral grassland (55.8%) and Woodland (27.3%), particularly scrub woodland. Map 4 highlights these areas, with losses to Neutral grassland predominantly around Tunbridge Wells and to the north of Hythe; and losses to Woodland primarily occurring around Dover, Folkestone and Snodland.
Looking in more detail the figures are slightly different for each of the BAP grasslands listed.
Lowland Calcareous grassland is mostly lost to Woodland and Neutral grassland, following the overall picture (see Figure 7). Lowland Dry Acid grassland is primarily lost to Neutral grassland and Bracken, whereas Lowland Meadow is almost exclusively lost to neutral grassland, with a very small portion to Woodland. Taking a closer look at grassland changes near Folkestone (Map 5) highlights losses of Lowland Calcareous grassland to Woodland and other neutral grasslands; and isolated area of Lowland Dry Acid grassland converted to Other Neutral grassland. Loss of Lowland Meadow to
Change Analysis of UKBAP Habitats 2003 – 2012 Page 17
other Neutral grasslands likely reflects changes in management, for example where grazing is relaxed a more rank grassland type develops.
Table 11 UKBAP grassland lost to non-BAP broad habitats
Broad habitat *
Lowland Calcareous Grassland (ha)
Lowland Dry Acid Grassland (ha)
Lowland Meadows (ha)
Total UKBAP grassland (ha)
Total UKBAP grassland (%)
BR 12.3 12.3 3.7%
CR 4.8 2.6 4.0 11.3 3.4%
GI 20.0 2.5 4.2 26.7 8.1%
GN 61.7 17.8 105.2 184.6 55.8%
WB 75.8 8.3 6.2 90.3 27.3% (Other habitats) (7.1) (5.1) (1.7) (13.9) (4.2%)
Total loss of BAP grassland
169.3 48.5 121.3 339.1 100.0%
% of total loss of UKBAP grassland
49.9% 14.3% 35.8%
% of total loss of BAP
22.2% 6.3% 15.9% 44.4%
*See Glossary in Section 6
Percentage of total loss of UKBAP Grassland to non-BAP broad habitats
2.8
11.8
36.4
44.8
25.3
5.3 5.2
36.6
17.1
3.3 3.5
86.7
5.1
0
20
40
60
80
100
BR CR GI GN WB
Broad habitat gained from BAP loss
%
Lowland Calcareous Grassland Lowland Dry Acid Grassland Lowland Meadows
Figure 7 UKBAP grassland lost to broad habitats.
UKBAP grassland has also gained from non-BAP habitats in the period 2003 to 2012, partly due
to restoration efforts and management practices, but to some extent due to changes in grassland classification and detection through API.
Many areas that were targeted for field survey during the 2012 habitat survey, previously had been classed as ‘Improved grassland’ with the comment ‘Potentially unimproved from API’. A number of these areas turned out to be neutral grasslands and in some cases of UKBAP quality. It is possible that UKBAP grasslands were under recorded in 2003, thus producing a gain in 2012 for surveyed areas.

Change Analysis of UKBAP Habitats 2003 – 2012 Page 18
From the habitat data it is not possible to say exactly which gains are due to under recording, restoration or management changes. Such an analysis would need further detailed information on location of restoration efforts and management practices for the areas that show gain. Under-recording cannot be corrected, beyond the validation effort carried out in this study.
Most BAP grassland gain is derived from Improved grassland (44.8%) and Neutral grassland
(38.7%), with smaller contributions from Crop (9.6%) and Woodland (5.9%). Table 12 shows the detail for each of the UKBAP grasslands. Calcareous grassland follows the main picture, with most gain from Improved grassland (110.5ha), Neutral grassland (69.2ha) and Crop (44.6ha), with a small portion from Woodland (21.6ha). Lowland Dry Acid grassland gains most from Neutral grassland (35ha) and Woodland (11ha), with Lowland Meadows gaining primarily from Improved Grassland (135ha) and Neutral grassland (111.4ha). Figure 8 shows these data in graphical format.
The gains in UKBAP grassland are more dispersed than the losses, although a concentration of gains from Neutral grassland shows in East Kent (see Map 6).
A 4ha field classed as Improved grassland in 2003 near Lydden (Map 5) changed to Lowland
Meadow in 2012 following re-classification in this study. Although classed as GI for 2003, the field had been used for growing maize for a few years, only reverting back to grassland in 2007-2008. The area is cattle grazed during the summer months and has developed a diverse species composition. No other management is taking place in this area. It is not certain that the area was truly Improved grassland in 2003 or in fact under-recorded neutral grassland.
Lowland Meadow gains are to an extent due to the re-classification of habitat survey records for
this project. Many areas were classed as ‘Other Lowland Meadow of Importance’ (GN1Z) in 2012, and may well have been of similar quality in 2003, but not recorded as such. It is unlikely that Improved grassland changes sufficient to gain UKBAP priority status within a period of 10-12 years, and it is likely that many areas were in fact semi-improved or unimproved grasslands in 2003.
Table 12 Broad habitats contributing to UK BAP grassland gain
Broad habitat *
Lowland Calcareous Grassland (ha
Lowland Dry Acid Grassland (ha)
Lowland Meadows (ha)
Total UKBAP grassland (ha)
Total UKBAP grassland (%)
(BR) (1.9) (1.9) (0.3%)
CR 44.6 1.0 7.8 53.4 9.6%
GA 0.0 1.0 1.0 0.2%
GI 110.5 3.7 135.4 249.6 44.8%
GN 69.2 35.0 111.4 215.6 38.7%
WB 21.6 11.1 32.7 5.9%
(Other habitats) (1.1) (1.5) (0.2) (2.8) (0.5%)
Total gain in BAP grassland
247.0 55.2 254.8 557.0 100.0%
% of total gain of UKBAP grassland
44.3% 9.9% 45.7%
% of total gain of BAP
22.9% 5.1% 23.6% 51.7%
*See Glossary in Section 6

Change Analysis of UKBAP Habitats 2003 – 2012 Page 19
Percentage of total gain of UKBAP Grassland from non-BAP broad habitats
18.1
44.8
28.0
8.76.7
63.3
20.1
3.1
53.1
43.7
0
20
40
60
80
CR GI GN WB
Broad habitat source for BAP gain
%
Lowland Calcareous Grassland Lowland Dry Acid Grassland Lowland Meadows
Figure 8 Total gain of UKBAP grassland for each category.
4.2.2 Heathland and Traditional Orchard changes
Heathland is a relatively rare and highly fragmented habitat in Kent and as such losses of even small areas have a big impact. In Table 13 the loss of the Heathland BAP habitat totals 3.9ha, a 0.5% of the total loss of BAP habitat in Kent. The habitat was mainly lost to Woodland (WB, 69.2%), Neutral Grassland (GN, 14.4%) and Bracken (BR, 9.2%). Bracken and scrub woodland invasion is a natural progression in unmanaged heathland areas, eventually leading to woodland development. Such areas may be targeted for restoration. Map 7 in Appendix E shows the locations of heathland loss and gain.
Traditional Orchards have experienced dramatic losses in Kent according to the Landcover
change analysis carried out during the Kent Habitat Survey (2013), which estimated losses since 1961 at over 60%. The Landcover change analysis employs a coarse grid of data, based on the habitat survey, whereas this project looks at the more detailed picture of individual polygons. A total loss of 309ha is recorded for the period 2003 to 2012, representing 40.5% of the total loss of BAP habitat in Kent during this period (see Table 13). The field survey encountered many orchards that were no longer managed and becoming derelict, being grubbed up or incorporated into gardens and developments. The loss of Traditional Orchards is concentrated in two main areas in the central part of Kent: around Sittingbourne and between Maidstone and Tunbridge Wells (see Map 8).
Table 13 also details which habitats benefited from the loss of Traditional Orchard habitats.
More than half of the lost orchards have become Improved Grassland (GI), 27.8% is now Crop (CR) and 16.2% Neutral Grassland (GN). A further 6.3% became Standing Water (AS), Built environment (UR) and Woodland (WB).

Change Analysis of UKBAP Habitats 2003 – 2012 Page 20
Table 13 Loss of Lowland Heathland and Traditional Orchards to other broad habitats
Broad habitat * Lowland Heathland (ha)
Lowland Heathland (% of total loss of Heathland)
Traditional Orchards (ha)
Traditional Orchards (% of total loss of Traditional Orchards)
AS 2.1 0.7%
BR 0.4 9.2%
CR 83.0 26.8%
GI 0.3 6.9% 155.5 50.2%
GN 0.6 14.4% 50.2 16.2%
UR 0.0 0.4% 10.9 3.5%
WB 2.7 69.2% 6.4 2.1%
Total loss in ha 3.9 309.6
% of total loss of BAP
0.5% 40.5%
*See Glossary in Section 6 Table 14 presents gains in the BAP habitats discussed here, with a total increase of heathland
since 2003 of 20.8ha, mainly derived from Woodland (WB, WC, 94.9%) habitats. The gains are partly due to restoration efforts around Tunbridge Wells, Pembury, Mereworth and the Blean (see Map 7). A portion of the total gain may be attributed to apparent gain, where areas were not recognised as heathland in 2003, due to difficulty in recognising the habitat through aerial photo interpretation (API) alone. It is not always possible to distinguish heath scrub from other low scrub or to detect heath partly obscured by tree canopies. Field survey generally correctly identifies these areas, and some were found in 2012, that are likely to have also been heathland in 2003, but were classed as woodland.
Table 14 Broad habitats contributing to gain of Lowland Heathland and Traditional Orchards.
Broad habitat * Lowland Heathland (ha)
Lowland Heathland (% of total gain of Heathland)
Traditional Orchards (ha)
Traditional Orchards (% of total gain of Traditional Orchards)
CR 0.0 98.9 56.2%
GI 0.1 0.4% 52.9 30.0%
GN 1.0 4.6% 6.7 3.8%
UR 1.3 0.7%
WB 15.0 72.2% 16.3 9.3%
WC 4.7 22.7% 17.1 9.7%
Total gain in ha 20.8 176.2
% of total gain of BAP
1.9% 16.3%
*See Glossary in Section 6 A total of 176ha of Traditional Orchards was apparently gained mainly from Crop (CR, 56.2%),
Improved Grassland (GI, 30%) and Woodland (WB, WC, 19%). It is unlikely that fully mature Traditional Orchards may have formed in the short space of time since 2003, and several other explanations can be given for this apparent gain.
In 2003 the traditional orchard was not listed as a separate habitat, but rather as a management type assigned to a variety of grassland habitats. In some cases the management was omitted and the keyword ‘orchard’ used instead, in other cases ‘scattered trees’ was added as a matrix and the grassland habitat listed as ‘non-amenity grassland’. In the change analysis the latter areas were

Change Analysis of UKBAP Habitats 2003 – 2012 Page 21
treated as grassland and as such, where recognised as traditional orchard in 2012, produced an apparent gain.
The distinction between traditional and intensively managed orchards is sometimes not easy to make through aerial photo interpretation, where spacing of trees is often used as an indicator. It appears that traditional orchards sometimes have closely spaced trees (3m, JNCC, 2008) and therefore may have been confused for intensively managed orchards in 2003, causing an apparent gain in traditional orchards. Equally, some traditional orchards may have been classed as woodland, on account of being overgrown, or showing a number of non-domestic fruit or nut trees. Where orchards were field surveyed these classification errors did not occur.
4.3 Detailed change in UK BAP priority habitats in AONB
A separate analysis is carried out for the High Weald and Kent Downs Areas of Outstanding Natural Beauty (AONB). The analysis only covers the Kent part of the AONB areas. All change polygons intersecting with the boundaries of these two areas are included in the analysis. A summary of the findings in relation to the total change for Kent discussed in the previous sections is listed in Table 15 below. For both AONB areas a cross tabulation is presented in Table 16 (High Weald) and Table 17 (Kent Downs). Map 9 in Appendix E shows where changes occurred throughout the AONB’s.
Table 15 Change for each AONB area and Kent.
AONB Within BAP Between BAP Loss of BAP Gain of BAP Total Change
ha % ha % ha % ha % ha % High Weald
0.4 0.1% 9.1 9.1% 107.83 14.1% 138.31 12.8% 255.7 11.5%
Kent Downs
130.9 44.7% 8.9 8.9% 189 24.7% 317.6 29.5% 646.5 28.9%
Kent 293 100.0% 100 100.0% 764 100.0% 1,078 100.0% 2,235 100.0%
Almost the entire shift of habitats ‘within BAP’ (i.e. the constituent IHS habitats changed)
occurred in the Kent Downs AONB. This type of change is largely made up of changing habitats in the Lowland Calcareous Grassland UKBAP category between 2003 and 2012 (See also Section 4.2.1). A small proportion of the total 130.9ha can be attributed to changed IHS habitats in Beech and Yew Woodland (7.43ha).
Changes ‘Between BAP’ are similar in both AONB areas, although these constitute only 18 % of the total occurring in Kent. The remaining 82% occurs outside the AONB areas.
Just over a third of total loss of BAP habitat in Kent occurred within the AONB areas (14.1% in High Weald and 24.7% in Kent Downs respectively), with nearly two-thirds occurring in the rest of the county (see Figure 9).
Overall loss of UKBAP in the Kent Downs is nearly double that of the High Weald, but certain habitats show greater loss in one or the other area. For example, loss of Traditional Orchard in the High Weald is 30% of the total loss (32ha), compared with the Kent Downs where the loss totals 13% (24.5ha). Note that the total areas of the two AONB’s differ considerably with the High Weald stretching to 37,144ha and the Kent Downs more than double the size at 87,885ha.

Change Analysis of UKBAP Habitats 2003 – 2012 Page 22
Loss of UKBAP habitat in Kent
467 ha
61%
189 ha
25%
108 ha
14%
High Weald Kent Downs Outside AONB
Figure 9 Loss of UK BAP habitat in Kent
Lowland Meadow losses are mostly occurring in the High Weald (68.3ha), with only minimal
losses in the Kent Downs (2.53ha). An apparent gain of Lowland Meadow, from non-BAP habitats totals 85.6ha. These gains are mostly a result of the validation effort of this report, but may not necessarily constitute real change. It is possible that areas of Lowland Meadow were under-recorded in 2003.
Lowland Calcareous Grassland has not been recorded in the High Weald and losses therefore exclusively appear in the Kent Downs (132.5ha). These losses are off-set by total gains of Lowland Calcareous Grassland from non-BAP habitats of 200.8ha.
Lowland Dry Acid Grassland losses in both areas were surpassed by total gains from non-BAP habitats: 3.8 and 10.3ha for High Weald, and 25.2and 30.8ha for Kent Downs.

Change Analysis of UKBAP Habitats 2003 – 2012 Page 23
Table 16 Cross-tabulation for High Weald AONB
BAP change
Lowland
Dry Acid
Grass-land
Lowland
Heathland
Lowland
Meadow
Purple
Moor Grass
and Rush
Pasture
ReedbedsTraditional
Orchards
Wet
WoodlandNo BAP
Total 2003
changed
Lowland Dry Acid
Grassland0.08 6.59 3.83 10.50
Lowland
Heathland0.01 0.01 2.93 2.95
Lowland Meadow 2.07 0.07 68.33 70.47
Purple Moor
Grass and Rush
Pasture
0.00
Reedbeds 0.14 0.14
Traditional
Orchards0.30 0.37 32.07 32.74
Wet Woodland 0.02 0.53 0.55
No BAP 10.29 7.28 85.58 0.91 0.37 29.42 4.46 138.31
Total 2012 changed 12.44 7.36 92.17 0.91 0.37 29.72 4.86 107.83 255.7
2012 Habitat (ha)
2003
Habitat
(ha)
Grey cell: change within a BAP category

Change Analysis of UKBAP Habitats 2003 – 2012 Page 24
Table 17 Cross-Tabulation for Kent Downs AONB
BAP changeCoastal
Salt-marsh
Intertidal
Mudflats
Lowland
Beech and
Yew Wood-
land
Lowland
Cal-
careous
Grass-land
Lowland
Dry Acid
Grass-land
Lowland
Fen
Lowland
Meadow
Maritime
Cliffs and
Slopes
ReedbedsTraditional
Orchards
Wet Wood-
landNo BAP
Total
2003
changed
Coastal
Saltmarsh0.05 0.08 0.13
Intertidal
Mudflats0.09 0.03 0.12
Lowland
Beech and
Yew
Woodland
7.43 7.00 3.36 17.79
Lowland
Calcareous
Grassland
117.79 0.37 132.48 250.64
Lowland Dry
Acid
Grassland
0.36 25.15 25.51
Lowland Fen 0.00
Lowland
Meadow0.38 0.07 2.53 2.98
Maritime Cliffs
and Slopes0.34 2.59 0.27 3.20
Reedbeds 0.00
Traditional
Orchards0.05 24.56 24.61
Wet
Woodland0.61 2.69 0.64 3.94
No BAP 0.20 0.84 200.79 30.82 0.11 47.39 0.02 1.54 26.11 9.77 317.59
Total 2012 changed 0.09 0.25 8.27 326.30 31.25 0.11 47.76 2.61 2.15 26.16 12.46 189.10 646.5
2012 Habitat (ha)
2003
Habitat
(ha)
Grey cell: change within a BAP category

Change Analysis of UKBAP Habitats 2003 – 2012 Page 25
4.4 Change in Coastal Floodplain and Grazing Marsh complex
Coastal and Floodplain Grazing Marsh UKBAP is defined by JNCC (2008) as “periodically inundated pasture, or meadow with ditches which maintain the water levels, containing standing brackish or fresh water. The ditches are especially rich in plants and invertebrates. Almost all areas are grazed and some are cut for hay or silage. Sites may contain seasonal water-filled hollows and permanent ponds with emergent swamp communities, but not extensive areas of tall fen species like reeds; although they may abut with fen and reed swamp communities.”
Coastal and Floodplain Grazing Marsh UKBAP (abbreviated to CFGM for this text) is assigned to areas as a complex, and may contain a variety of habitats, including further UKBAP priority habitats (e.g. Wet Woodland). The JNCC gives a narrow definition of the BAP habitat, but in accordance with the IHS used throughout the 2003 and 2012 habitat surveys a slightly wider definition is used here. The CFGM complex BAP habitat may contain lowland wet grassland showing varying degrees of improvement, arable, ruderal communities, mire, wet woodland and saltmarsh, aquatic, swamp, fen-meadow and tall-herb fen communities. In 2012 some grassland was classed as ‘Grazing Marsh Pasture’ as well as given the CFGM complex definition. In 2003 this habitat type was not distinguished, but instead called ‘Improved grassland’ or ‘Other neutral grassland’.
In the 2003 Kent Habitat Survey the area of Coastal and Floodplain Grazing Marsh was defined
by the 5m contour, where lower lying areas connected to sea and/or river these were assigned the comment ‘Grazing marsh’. For best comparison, that same method is applied here to determine changes in this BAP complex. A number of habitats are excluded from the analysis as they are not part of the BAP complex, including urban areas, roads and railways, domestic gardens and tidal habitats. In general CFGM also excludes arable fields, but for this study these areas are included as they may be used to assess potential for habitat creation (Kent BAP, 2011).
4.4.1 Broad habitat changes
For its complex nature it is useful to include an analysis of the broad habitats of the CFGM, in addition to the UK BAP priority habitats. A cross-tabulation is produced for the broad habitats of this complex (Table 18). Large areas have changed from Crop to Improved grassland (CR to GI: 2,643ha) and vice versa (GI to CR: 967ha).
A considerable area changed IHS classification, but remained within the Neutral Grassland broad habitat (GN to GN: 517ha). This change may be partially explained by the fact that the 2012 habitat survey introduced codes to describe semi-improved CFGM grassland: GN4 – Grazing Marsh Pasture and GN5 – Inundation Grassland. Both grassland types exclusively occur in the CFGM complex and were often assigned from API without verification from field survey. This may therefore represent apparent change, due to classification differences in both periods, rather than real change.
A total of 228.2ha changed from grassland to built environment (GI, GC and GN to UR and LF), with a smaller 107ha apparently reverted from built environment to grassland (UR and LF to GI and GN).
Distribution of the overall broad habitat change within the complex is shown in Map 10.

Change Analysis of UKBAP Habitats 2003 – 2012 Page 26
Table 18 Cross tabulation of broad habitats in the Coastal and Floodplain Grazing Marsh Complex (<5m contour). For abbreviations see Glossary in Section 6
AR AS BR CR EM FT GA GC GI GN LF LS RE SR SS UR WB WCTotal
2003
AR 0.2 0.3 0.5
AS 1.6 43.7 1.5 13.3 14.9 31.2 1.5 2.4 0.4 4.7 3.6 118.7
BR 1.0
CR 59.8 373.3 3.8 0.7 2,643.4 323.7 11.0 1.0 27.6 5.3 40.5 3.3 3,493.4
EM 12.2 6.2 1.7 22.3 0.6 0.6 0.0 2.5 5.8 51.7
FT 7.7 0.3 2.7 10.7
GA 0.4 0.4
GC 0.1 0.2 0.4 0.7
GI 0.1 22.7 966.9 20.1 0.1 298.2 22.9 0.9 5.0 4.8 93.1 16.5 0.1 1,451.5
GN 53.4 0.1 70.8 48.0 0.2 131.0 517.4 24.4 0.6 9.1 3.2 87.3 39.9 985.2
LF 4.6 1.7 6.3
LS 3.5 12.5 2.3 2.0 3.3 0.2 6.2 0.3 0.6 30.7
RE 7.5 4.5 3.3 27.6 34.4 0.7 2.1 80.0
SR 0.2 0.2
SS 3.1 1.4 3.2 2.7 0.1 2.9 0.5 14.0
UR 1.4 1.1 0.3 88.8 11.9 0.3 2.7 106.5
WB 1.2 1.2 0.8 2.1 19.5 14.9 5.8 0.4 9.8 11.6 67.3
WC 0.0
Total 2012 1.7 208.4 1,439.4 99.7 0.7 0.0 2.4 2,939.7 1,262.1 66.4 9.8 44.6 0.0 14.9 238.7 89.4 0.6 6,418.5
2012 Habitat (ha)
2003
Habitat
(ha)
Grey cell: change within a Broad Habitat, for example change from CR0 in 2003 to CR31 in 2012, remains within the broad habitat CR.
Change Analysis of UKBAP Habitats 2003 – 2012 Page 27
4.4.2 UKBAP habitat changes
Although the Coastal and Floodplain Grazing Marsh is a UKBAP priority habitat complex, it contains areas that are UKBAP habitats in their own right. These are described here.
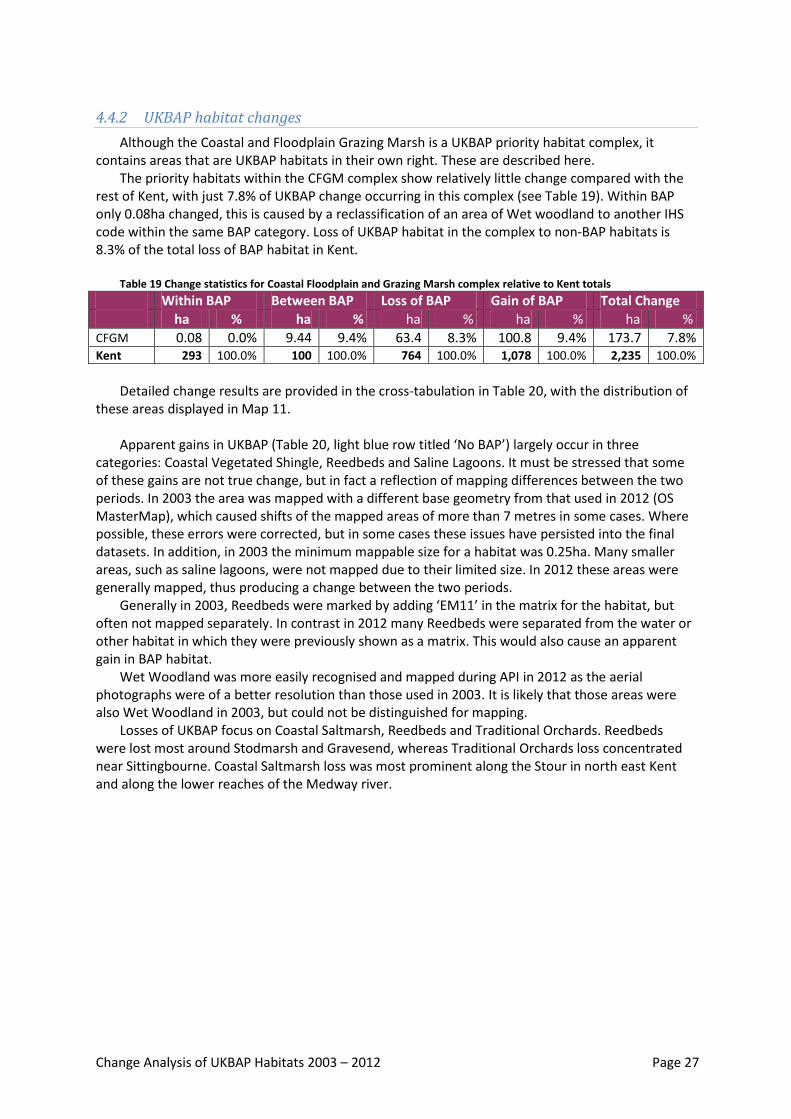
The priority habitats within the CFGM complex show relatively little change compared with the rest of Kent, with just 7.8% of UKBAP change occurring in this complex (see Table 19). Within BAP only 0.08ha changed, this is caused by a reclassification of an area of Wet woodland to another IHS code within the same BAP category. Loss of UKBAP habitat in the complex to non-BAP habitats is 8.3% of the total loss of BAP habitat in Kent.
Table 19 Change statistics for Coastal Floodplain and Grazing Marsh complex relative to Kent totals
Within BAP Between BAP Loss of BAP Gain of BAP Total Change
ha % ha % ha % ha % ha % CFGM 0.08 0.0% 9.44 9.4% 63.4 8.3% 100.8 9.4% 173.7 7.8% Kent 293 100.0% 100 100.0% 764 100.0% 1,078 100.0% 2,235 100.0%
Detailed change results are provided in the cross-tabulation in Table 20, with the distribution of
these areas displayed in Map 11. Apparent gains in UKBAP (Table 20, light blue row titled ‘No BAP’) largely occur in three
categories: Coastal Vegetated Shingle, Reedbeds and Saline Lagoons. It must be stressed that some of these gains are not true change, but in fact a reflection of mapping differences between the two periods. In 2003 the area was mapped with a different base geometry from that used in 2012 (OS MasterMap), which caused shifts of the mapped areas of more than 7 metres in some cases. Where possible, these errors were corrected, but in some cases these issues have persisted into the final datasets. In addition, in 2003 the minimum mappable size for a habitat was 0.25ha. Many smaller areas, such as saline lagoons, were not mapped due to their limited size. In 2012 these areas were generally mapped, thus producing a change between the two periods.
Generally in 2003, Reedbeds were marked by adding ‘EM11’ in the matrix for the habitat, but often not mapped separately. In contrast in 2012 many Reedbeds were separated from the water or other habitat in which they were previously shown as a matrix. This would also cause an apparent gain in BAP habitat.
Wet Woodland was more easily recognised and mapped during API in 2012 as the aerial photographs were of a better resolution than those used in 2003. It is likely that those areas were also Wet Woodland in 2003, but could not be distinguished for mapping.
Losses of UKBAP focus on Coastal Saltmarsh, Reedbeds and Traditional Orchards. Reedbeds were lost most around Stodmarsh and Gravesend, whereas Traditional Orchards loss concentrated near Sittingbourne. Coastal Saltmarsh loss was most prominent along the Stour in north east Kent and along the lower reaches of the Medway river.

Change Analysis of UKBAP Habitats 2003 – 2012 Page 28
Table 20 Cross tabulation of UKBAP habitats in the Coastal and Floodplain Grazing Marsh Complex (<5m contour)
BAP
change
Coastal
Salt-marsh
Coastal
Sand
Dunes
Coastal
Vegetated
Shingle
Intertidal
Mudflats
Lowland
Cal-
careous
Grassland
Lowland
Dry Acid
Grass-
land
Lowland
Fens
Lowland
Meadow
Reed-
beds
Saline
Lagoons
Traditional
Orchards
Wet Wood-
landNo BAP
Total
2003
changed
Coastal
Saltmarsh0.03 0.09 13.71 13.83
Coastal
Sand
Dunes
0.01 3.08 3.09
Coastal
Vegetated
Shingle
0.36 2.63 7.83 10.82
Intertidal
Mudflats0.23 1.84 2.07
Lowland
Cal-
careous
Grassland
0.64 0.64
Lowland
Dry Acid
Grassland
0.17 0.24 0.02 0.43
Lowland
Fen0.00
Lowland
Meadow0.61 4.06 4.67
Reedbeds 4.11 16.23 20.34
Saline
Lagoons0.25 2.41 2.66
Traditional
Orchards0.26 10.40 10.66
Wet
Woodland0.35 0.10 0.08 3.19 3.72
No BAP 1.90 12.02 2.38 0.28 0.63 59.86 13.66 0.72 9.30 100.75
Total 2012 changed 1.90 0.20 12.61 0.00 2.38 0.00 0.28 0.63 61.68 13.75 0.72 16.12 63.41 173.7
2012 Habitat (ha)
2003
Habitat
(ha)
Grey cell: change within a BAP category

Change Analysis of UKBAP Habitats 2003 – 2012 Page 29
4.5 Potential for restoration
The losses and gains of BAP habitat from and to non-BAP habitat suggest a fluctuation that is in part due to classification changes, but also in part the result of restoration efforts and appropriate management practices aimed at reversing the historical decline of important habitats such as UKBAP grasslands. Because of the refinements and evolution of habitat mapping techniques and classification, we cannot unequivocally link the apparent gain in UKBAP grasslands (see Table 12) to these efforts, or conclude that habitat loss no longer exceeds the gains. Map 5, which details grassland changes around Folkestone, shows numerous areas of significant loss, mainly from BAP grassland to non-BAP neutral grassland and scrub, which need further investigation. They provide a focus for habitat restoration, although in each individual case an assessment needs to be made of the reasons for the apparent change, and they indicate the huge potential for restoration that exists particularly within the grassland category.
Historically heathland has been subject to very large declines, but as Map 7 illustrates, the
overall change in this habitat appears positive, with an apparent gain of 20.8 ha (Table 14) reflecting the efforts made in recent years to restore this important habitat. There is still a very great potential for restoring heathland in Kent, particularly in areas where secondary woodland has developed on former common grazing land.
The dramatic decline of Traditional Orchards is well documented, and if continued losses are to
be halted, more efforts are required to assist land owners to manage and enhance the commercial value of these orchards.
4.6 Limitations of the change analysis
Throughout this document references have been made to limitations of the change analysis. The main issues are:
Differences in geometry of base mapping, causing a shift in location of objects on the map, thus producing incompatible mapping between 2003 and 2012. This issue is explained in more detail in Appendix C and in the ARCH project methodology (www.archnature.eu).
Differences in codes used in both periods. Where possible these were made compatible before the change analysis.
Differences in criteria for similar habitat classifications. Although the codes used are the same for both periods, the criteria determining the classification may be different. This was especially noticed in the neutral grasslands.
Differences in delineating habitats. In 2012 many areas were delineated by the OS Mastermap base data, with habitats assigned by aerial photography interpretation. In 2003 deliniation was done manually, resulting in larger, more generalised polygons. E.g. an urban area with houses, gardens, roads and sidewalks would be represented by a single polygon classed as ‘UR0’. Equally areas of scrub or trees within grassland setting were represented by a matrix code, whereas in 2012, these areas would be delineated into a separate polygon.
A specific note must be made of coastal habitats showing change. The coastal areas were
mapped in detail in 2006 and further updated in 2009 by the Environment Agency. Since then, an OS datum adjustment has caused a shift in mapped areas, apparently moving habitats up to 15 metres in coastal areas especially. Although an attempt has been made during the ARCH project to accurately map the current habitats, many slivers remain from previous efforts. It is not recommended to rely on the figures for changes in the dynamic coastal habitats of ‘Coastal Saltmarsh’ and ‘Intertidal Mudflats’. Thes especially represent real changes through the dynamics of the coastal environment, as well as apparent changes caused by mapping and a datum shift.

Change Analysis of UKBAP Habitats 2003 – 2012 Page 30
In future mapping efforts, it may be worth using some of the automated mapping techniques recommended in the ARCH project (Activity 3). Image analysis tools allow mapping of intricate areas through automated tools, which rely on recognition of the digital signature of a feature on the ground. The assumption is that the aerial photographs or satelite imagery is mapped to the current datum and no further shifts have taken place between the periods being compared.

Change Analysis of UKBAP Habitats 2003 – 2012 Page 31
5 References
Higher Level Stewardship - Farm Environment Plan (FEP) Manual Third edition March 2010, Natural England (www.naturalengland.org.uk/publications) Kent BAP 2011, Kent Biodiversity Action Plans (www.kentbap.org.uk) Kent Habitat Survey 2003 2003, the Kent Habitat Survey Partnership ARCH Kent Habitat Survey 2012 2013, Kent County Council (www.archnature.eu) Technical Information Note 110: Assessing whether created or restored grassland is a BAP Priority Habitat. 2012, Natural England (www.naturalengland.org.uk/publications) UK BAP list of priority habitats 2008, Joint Nature Conservation Committee (jncc.defra.gov.uk)

Change Analysis of UKBAP Habitats 2003 – 2012 Page 32
6 Glossary
IHS code IHS description
AR Rivers and streams
AS Standing open water
BR Bracken
CR Arable and horticulture
EM Fen, marsh and swamp
EM11 Reedbeds
FT Orchard
FT1 Traditional orchard
GA Acid grassland
GA1 Lowland dry acid grassland
GA1Z Other lowland dry acid grassland
GC Calcareous grassland
GC1 Lowland calcareous grassland
GC113 Rank calcareous grassland
GC1Z Other lowland calcareous grassland
GI/GI0 Improved grassland
GN Neutral grassland
GN12 Lowland meadows and pastures
GN1Z Other lowland meadow of importance
GN5 Inundation grassland
GN6 Sea wall grassland
GNZ Other neutral grassland
HE Heathland
LF Boundary and linear features
LF1 Hedges/line of trees
LF27 Transport corridors
LS Littoral sediment
LS3 Coastal saltmarsh
LS41 Mudflats and sandflats not covered by sea water at low tide
RE Inland rock exposure, screes and spoil
SR Supralittoral rock
SS Supralittoral sediment
UA41 Churchyards and cemeteries (management code)
UR Built up areas
WB Broadleaved woodland
WB2 Scrub woodland
WB34 Wet woodland
WC Coniferous woodland
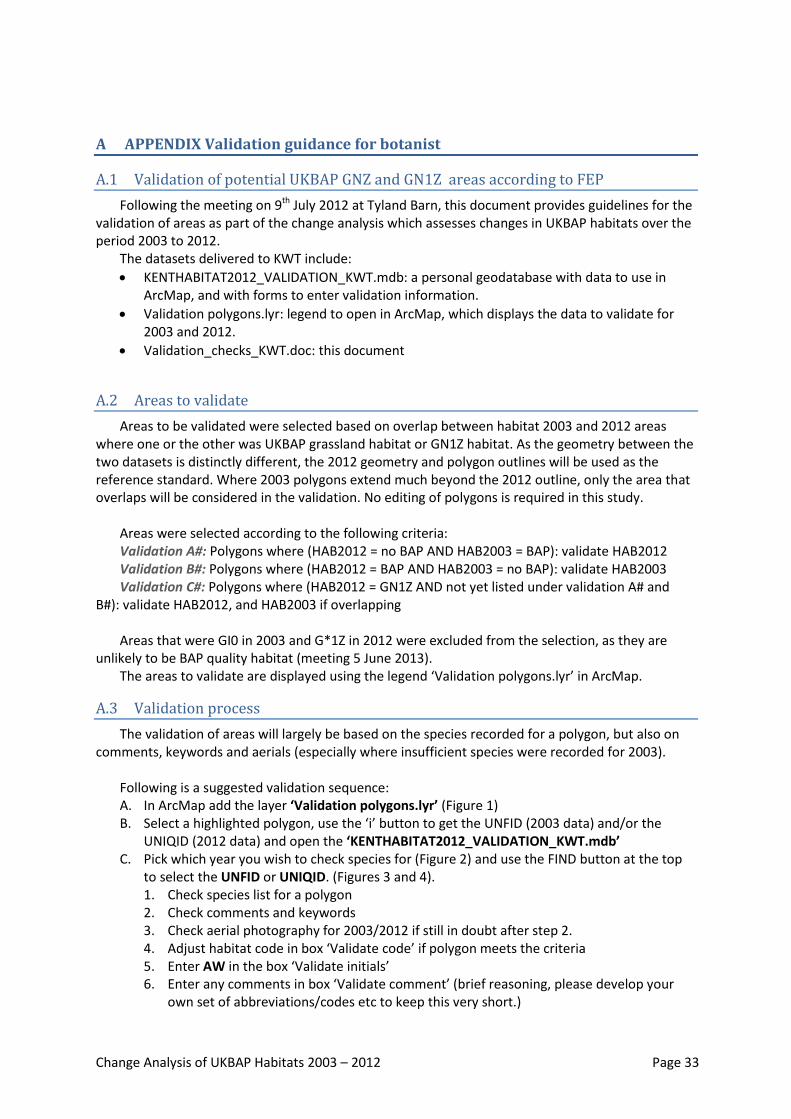
Change Analysis of UKBAP Habitats 2003 – 2012 Page 33
A APPENDIX Validation guidance for botanist
A.1 Validation of potential UKBAP GNZ and GN1Z areas according to FEP
Following the meeting on 9th July 2012 at Tyland Barn, this document provides guidelines for the validation of areas as part of the change analysis which assesses changes in UKBAP habitats over the period 2003 to 2012.
The datasets delivered to KWT include:
KENTHABITAT2012_VALIDATION_KWT.mdb: a personal geodatabase with data to use in ArcMap, and with forms to enter validation information.
Validation polygons.lyr: legend to open in ArcMap, which displays the data to validate for 2003 and 2012.
Validation_checks_KWT.doc: this document
A.2 Areas to validate
Areas to be validated were selected based on overlap between habitat 2003 and 2012 areas where one or the other was UKBAP grassland habitat or GN1Z habitat. As the geometry between the two datasets is distinctly different, the 2012 geometry and polygon outlines will be used as the reference standard. Where 2003 polygons extend much beyond the 2012 outline, only the area that overlaps will be considered in the validation. No editing of polygons is required in this study.
Areas were selected according to the following criteria: Validation A#: Polygons where (HAB2012 = no BAP AND HAB2003 = BAP): validate HAB2012 Validation B#: Polygons where (HAB2012 = BAP AND HAB2003 = no BAP): validate HAB2003 Validation C#: Polygons where (HAB2012 = GN1Z AND not yet listed under validation A# and
B#): validate HAB2012, and HAB2003 if overlapping Areas that were GI0 in 2003 and G*1Z in 2012 were excluded from the selection, as they are
unlikely to be BAP quality habitat (meeting 5 June 2013). The areas to validate are displayed using the legend ‘Validation polygons.lyr’ in ArcMap.
A.3 Validation process
The validation of areas will largely be based on the species recorded for a polygon, but also on comments, keywords and aerials (especially where insufficient species were recorded for 2003).
Following is a suggested validation sequence: A. In ArcMap add the layer ‘Validation polygons.lyr’ (Figure 1) B. Select a highlighted polygon, use the ‘i’ button to get the UNFID (2003 data) and/or the
UNIQID (2012 data) and open the ‘KENTHABITAT2012_VALIDATION_KWT.mdb’ C. Pick which year you wish to check species for (Figure 2) and use the FIND button at the top
to select the UNFID or UNIQID. (Figures 3 and 4). 1. Check species list for a polygon 2. Check comments and keywords 3. Check aerial photography for 2003/2012 if still in doubt after step 2. 4. Adjust habitat code in box ‘Validate code’ if polygon meets the criteria 5. Enter AW in the box ‘Validate initials’ 6. Enter any comments in box ‘Validate comment’ (brief reasoning, please develop your
own set of abbreviations/codes etc to keep this very short.)

Change Analysis of UKBAP Habitats 2003 – 2012 Page 34
Figure 10 Legend of areas to validate in ArcMap. When initials in the database are changed to AW, the polygon will
automatically change colour indicating that the validation for that polygon is completed.
Figure 11 Menu to select forms for listing species, comments and keywords by polygon

Change Analysis of UKBAP Habitats 2003 – 2012 Page 35
Figure 12 Form to check data for 2012 polygons and to enter validation information
Figure 13 Form to check data for 2003 polygons and to enter validation information

Change Analysis of UKBAP Habitats 2003 – 2012 Page 36
With regards to the species lists, following discussions with Phil Williams (Natural England) several species were added to the FEP list used to qualify areas for UKBAP neutral grassland (see Table 1).
Table 1 Species in official FEP guidance added as indicators for UKBAP neutral grassland
ID English name Latin name
1 Common Spotted Orchid Dactylorhiza fuchsii
2 Grass Vetchling Lathyrus nissolia
3 Corky-fruited Water-dropwort Oenanthe pimpinelloides
4 Narrow-leaved Water-dropwort Oenanthe silaifolia
5 Adder's-tongue Ophioglossum vulgatum
6 Green-winged Orchid Orchis morio
Please note that the polygons of 2012 selected for validation all meet the minimum criteria
listed in the FEP guidelines (FEP criteria for lowland meadows: Of the listed species, at least two frequent and two occasional in the sward). In the species list showing on the forms a column called FEP indicates whether the species is listed in the FEP guidelines (or where it says ‘added’ this was an addition for this project as per the table above).
In 2003 not all species were recorded using a picklist, but instead additional species were
captured in a free text format, and dominance was often omitted. Where this is the case, the species name is listed, but dominance is shown as ‘p’ for presence (for example: Grass vetchling in Figure 4). Although these species may not be meeting FEP criteria of dominance, they do give an overall ‘feel’ of the area and may be helpful in the validation.
The 2003 polygons for validation do not yet meet the full FEP species criteria, as Phil Williams felt that the species are not the only means to classify an area. The polygons have at least 3 of the required FEP species (including the additional ones listed in Table 1), although not necessarily the required dominance.
A.4 Deliverables
The final dataset to deliver is the geodatabase ‘KENTHABITAT2012_VALIDATION_KWT.mdb’, which will include validation codes, initials and comments added during the validation process.

Change Analysis of UKBAP Habitats 2003 – 2012 Page 37
B APPENDIX FEP guidelines for assessing lowland meadow habitat

Change Analysis of UKBAP Habitats 2003 – 2012 Page 38
C APPENDIX Change analysis method Kent Habitat Survey 2012
C.1 Data preparation
The 2003 habitat data was based on Ordnance Survey 1:10,000 mapping base data, whereas the 2012 data used OS MasterMap at 1:1,250 as the base data. Considerable positional shifts occurred between the data, partly due to the difference in scale, but also due to positional changes in the OS base data since 2003, causing the habitat datasets to line up incorrectly in many places. This lateral shift varied from 0.1m to about 7m in severe cases. Because of the change in geometry in both datasets a direct comparison in the GIS through e.g. a UNION or INTERSECT procedure was not feasible. Too many sliver polygons would occur, indicating change, which was in fact only a change due to position, not a real change of habitat.
For this reason the 2010 OS MasterMap base data used for the Habitat 2012 data was also used
for the 2003 data. In the 2012 data a column with Habitat 2003 data had been included from the start. Data from this column formed the basis of the comparison between 2003 and 2012 habitat values, largely through database queries.
Re-creating the Habitat 2003 data used the final 2012 survey data as the basis. The advantage of
using the final habitat survey is that an immediate change analysis can be made, by comparing the values of the column ‘Habitat2003’ and column ‘Habitat2012’. The field survey values give the best possible classification of a polygon and can aid the (re-)interpretation of the 2003 data set.
The comparison only takes into account the habitat code and ignores matrix and management
codes. Through the comparison a number of polygons greater than 250m2 were marked for manual checking. In the next stage gardens and houses smaller than 250m2 were also marked if their habitat was different from 2003.
Where the 2003 data had been field surveyed this data was considered correct and, if different from 2012, classed as real change.
Several issues caused problems with this method.
Not all polygons had the actual original 2003 habitat codes. The OS MasterMap details were used to update polygons to the current IHS codes (e.g. gardens, road verges, paths and tracks), but only classified polygons that existed in 2010. For those polygons that did not yet exist in 2003, these values are incorrect and where possible have been reverted to actual 2003 values.
The habitat code for 2003 was changed if found to be different from 2012. If field surveyed in 2003, then the value was changed to that found in the field survey. If the polygon was also field surveyed in 2012 with a different value, then a decision on the 2003 value was based on the likelihood of the 2003 classification being one or the other. For example, if ‘Improved grassland’ (GI0) in 2003 then it is unlikely to be ‘Other lowland meadow of importance’ in 2012 (GN1Z), so a check of 1990 data to see if the area was classed as semi-improved (SNG), then the 2003 data is kept as GN1Z classification, even though it was surveyed in 2003 as improved grassland.
C.2 Data checking
Manual checking All polygons where it appeared that a change had occurred between 2003 and 2012, based on
the above method were checked manually. If a change was real then the habitat code was confirmed

Change Analysis of UKBAP Habitats 2003 – 2012 Page 39
and initials of the checker added in a separate column. If the change was not real the habitat code was updated with the correct value and initials added in a separate column.
A check was also made to ensure that no polygons that existed in 2003 had disappeared in 2012, thus producing a ‘no change’, which was in fact a change. Where necessary those polygons were re-instated and the habitat confirmed.
Polygons not selected for checking were ignored in the manual checking procedure, although on occasion the checker would find such polygons and perform a manual check if it appeared that a change had occurred.
A few exceptions to the procedure:
Areas smaller than 250m2 were ignored due to time limitations, except for houses/buildings
It was assumed that changes from improved grassland to crop were not particularly interesting and therefore these changes were not checked manually, but included in the automated changes. The reverse, from crop to improved or other grassland was checked manually
Manually checked polygons were classed with CHANGE = ‘Y’ (Confirmed change). Automated checking Automated checking was carried out in the database, by comparing the habitat codes for both
periods through database queries. All polygons that had changed, but not been checked manually were classed with CHANGE = ‘L’
(Likely changed), to indicate that the change was not yet confirmed. Any polygons where either 2003 or 2012 had no data were excluded from the analysis.
Additional checking was necessary to find change caused by polygons that were introduced to
OS Mastermap since 2003. This check looked at polygons that existed in 2012, but not in 2003 and compared the 2012 habitat with that found in the original 2003 habitat data. Because of the partial incompleteness of some 2003 habitat codes this is a crude process. In most cases the incomplete codes of 2003 were excluded from analysis to avoid reporting false change (For example, Built area in 2003, garden in 2012. From the codes it could not be determined if the 2003 code also represented a garden and this polygon was excluded from the analysis). Manual checking again may reveal that actual change has occurred, but in the current project no time was available to carry out these additional checks.
The following codes were used to indicate the different levels of confidence of the change:
Y = confirmed change N = Confirmed not changed L = likely changed, habitat_cd not adjusted X = likely changed, habitat_cd adjusted to previous Hab2003, except where roads U = one period has no habitat code to compare O = OS new polygon, likely change, based on habitat in the original habitat 2003 data via
spatial join of the polygon centroid Values that were excluded through incompleteness, or confusion with codes in 2012:
if LF271/2 in 2012 and UR0 in 2003 (roads/paths)
if LT4 in 2012 and UR0 in 2003 (road verge)
if UA32 in 2012 and UR0 in 2003 (garden)
if UA41 in 2012 and UR0 in 2003 (cemetery)
if SUMMARY in 2003 had only CR0 or UR0, but lacked management and/or matrix codes

Change Analysis of UKBAP Habitats 2003 – 2012 Page 40
In 2003 domestic gardens were classed as UR0, without a specific code to indicate the area as a
garden. It is therefore not possible to distinguish change in gardens, unless a polygon has been checked manually.
C.3 Compiling the change data
The manually and automatically checked polygons were loaded into a new personal geo-database and further columns were added to hold information on UKBAP habitat for each period.
Some final data cleaning was carried out manually to filter out sliver polygons and overlapping
polygons introduced by the integration with EA coastal data. Also all polygons <10m2 were removed as these are slivers caused by positional changes and geometric differences in the source datasets and are not considered real change.

Change Analysis of UKBAP Habitats 2003 – 2012 Page 41
D Appendix Area of BAP in Kent
UKBAP habitat (2012) Area (ha) Area after validation (ha)
Coastal Saltmarsh 1,338.2 1,338.2
Coastal Sand Dunes 454.5 454.5
Coastal Vegetated Shingle 932.4 932.4
Intertidal Chalk 418.7 418.7
Intertidal Mudflats 10,078.8 10,078.8
Lowland Beech and Yew Woodland 613.2 613.2
Lowland Calcareous Grassland 1,160.2 1,160.2
Lowland Dry Acid Grassland 260.8 260.8
Lowland Fens 12.3 12.3
Lowland Heathland 73.4 73.4
Lowland Meadows 27.7 456.7
Lowland Mixed Deciduous Woodland 152.8 152.8
Maritime Cliffs and Slopes 38.5 38.5
Mesotrophic Lakes 0.2 0.2
Purple Moor Grass and Rush Pasture 11.0 11.0
Reedbeds 544.6 544.6
Saline Lagoons 286.0 286.0
Seagrass Beds 29.5 29.5
Sheltered Muddy Gravels 9.3 9.3
Traditional Orchards 1,676.1 1,676.1
Wet Woodland 663.4 663.4
TOTAL 18,781.4 19,210.4

Change Analysis of UKBAP Habitats 2003 – 2012 Page 42
E APPENDIX Maps
Map 1 Total change of UKBAP habitats .................................................................................................................................................................................................................................................................................................................. 43 Map 2 Detailed change of UKBAP habitats ............................................................................................................................................................................................................................................................................................................ 44 Map 3 Change of UKBAP grassland ........................................................................................................................................................................................................................................................................................................................ 45 Map 4 Loss of UKBAP grassland to neutral grassland and woodland habitats ...................................................................................................................................................................................................................................................... 46 Map 5 Detail of grassland changes around Folkestone ......................................................................................................................................................................................................................................................................................... 47 Map 6 Gain of UKBAP grassland from neutral grassland and woodland habitats ................................................................................................................................................................................................................................................. 48 Map 7 Overall change of Heathland ....................................................................................................................................................................................................................................................................................................................... 49 Map 8 Overall change of Traditional Orchards ...................................................................................................................................................................................................................................................................................................... 50 Map 9 Changes in UKBAP habitat in Areas of Outstanding Natural Beauty in Kent .............................................................................................................................................................................................................................................. 51 Map 10 Change in broad habitats in Coastal and Floodplain Grazing Marsh ........................................................................................................................................................................................................................................................ 52 Map 11 Changes in UKBAP habitats in Coastal and Floodplain Grazing Marsh ..................................................................................................................................................................................................................................................... 53

Change Analysis of UKBAP Habitats 2003 – 2012 Page 43
Map 1 Total change of UKBAP habitats

Change Analysis of UKBAP Habitats 2003 – 2012 Page 44
Map 2 Detailed change of UKBAP habitats

Change Analysis of UKBAP Habitats 2003 – 2012 Page 45
Map 3 Change of UKBAP grassland

Change Analysis of UKBAP Habitats 2003 – 2012 Page 46
Map 4 Loss of UKBAP grassland to neutral grassland and woodland habitats

Change Analysis of UKBAP Habitats 2003 – 2012 Page 47
Map 5 Detail of grassland changes around Folkestone

Change Analysis of UKBAP Habitats 2003 – 2012 Page 48
Map 6 Gain of UKBAP grassland from neutral grassland and woodland habitats

Change Analysis of UKBAP Habitats 2003 – 2012 Page 49
Map 7 Overall change of Heathland

Change Analysis of UKBAP Habitats 2003 – 2012 Page 50
Map 8 Overall change of Traditional Orchards

Change Analysis of UKBAP Habitats 2003 – 2012 Page 51
Map 9 Changes in UKBAP habitat in Areas of Outstanding Natural Beauty in Kent

Change Analysis of UKBAP Habitats 2003 – 2012 Page 52
Map 10 Change in broad habitats in Coastal and Floodplain Grazing Marsh

Change Analysis of UKBAP Habitats 2003 – 2012 Page 53
Map 11 Changes in UKBAP habitats in Coastal and Floodplain Grazing Marsh


![Drivers of biodiversity change in British alpine habitats [Andrea Britton]](https://img.dokumen.tips/doc/110x75/5586220ed8b42a0e4a8b5196/drivers-of-biodiversity-change-in-british-alpine-habitats-andrea-britton.jpg)