Embed Size (px)
Citation preview
11th Global Meeting of the National Transfer Accounts Network Demographic Dividends and African Development
Challenges to increase female labor force participation: Gender inequality in Costa Rica
Pamela Jiménez-Fontana
Pamela Jiménez-Fontana. Working paper.
2
Index 1. Introduction........................................................................................................................................................3
2. Background........................................................................................................................................................42.1. Population aging and inequalities in the labor market.................................................................42.2. Childcare and elderly care networks in Costa Rica.......................................................................9
2.3. Making visible the unpaid work..............................................................................................................93. Sources of information...............................................................................................................................103.1. Unpaid production and consumption profiles...............................................................................103.2. Market production and consumption profiles...............................................................................11
4. Methodology....................................................................................................................................................114.1. 1. Unpaid consumption and production..........................................................................................114.2. Scenario.........................................................................................................................................................13
4.3. Market consumption and production profiles...............................................................................135. Results...............................................................................................................................................................145.1. Gender inequality on the distribution of time................................................................................145.2. 2. Differences on unpaid production profiles by labor condition..........................................17
5.3. What is the impact of an increase of female labor force?........................................................195.4. Evolution of the labor income profile................................................................................................226. Conclusions.....................................................................................................................................................26
References..................................................................................................................................................................27
Pamela Jiménez-Fontana. Working paper.
3
Challenges to increase female labor force participation: Gender inequality on Costa Rica
Pamela Jiménez-Fontana1
1. Introduction Costa Rica is at the end of the demographic transition with an insufficient
educational profile to meet the demands of the market. The benefits of the first demographic dividend were not materialize due to the lack of public policies that did not promote better skills for the new generations that will have to support an aging population. In this context, a potential opportunity arises: low female labor force participation poses a scope for accelerating economic growth through greater incorporation of women into the market. This opportunity known as gender dividend, only materialize if public policies reduce the barriers that limit a greater female participation. Despite the rapid growth of the participation rate of women in the market, in the last five years a stagnation of this indicator is observed, which suggests that factors such as care and unpaid work limit the participation of women on the market.
Gender inequality in Costa Rica is evident: low female political participation, women as the main responsible for care and policies do not encourage parental responsibility. Some efforts such as childcare networks intend to reduce female unpaid work. However, many of these programs have low coverage and also are target only for people on poverty.
In this article I analyze gender inequality on market and unpaid production using the methodology developed by international Counting Women's Work and the project National Transfer Accounts. Also, per capita profiles of key domestic activities by age and sex were are analyzed. 1 Researcher at the Centro Centroamericano de Población at Universidad de Costa Rica and researcher in charge of the economic chapter of Informe Estado de la Nación. Email: [email protected]/[email protected]. This research was conducted as part of the project Counting Women's Work, with funds of the International Development Research Centre, and the collaboration of Universidad de Costa Rica and Programa Estado de la Nación. The author thanks Luis Rosero Bixby, and Gretchen Donehower for their valuable comments, and Esteban Alvarado and Maria Fernanda Duran for their research assistance.

Pamela Jiménez-Fontana. Working paper.
4
2. Background
2.1. Population aging and inequalities in the labor market In 1970, Costa Rica began the process of the demographic transition, which was characterized by a sustained reduction in mortality and fertility rates (Rosero-Bixby and Robles, 2008). In the last stage of this process, the base of the population pyramid is reduced and aging increases, this is shown as a slowdown in the growth rate of people at working ages. Between 1950 and 1980, the number of people between 15 and 64 grew at an annual average rate of 22% (Figure 1), since then, this group is growing at a slower pace. According to population projections (CCP-INEC, 2013), in 2045 the number of people at working ages will not increase, and by 2050 this group is expected to start reducing. The end of the demographic transition and aging are a challenge for economic growth, which means a possible shortage of labor force (Rosero-Bixby and Jimenez-Fontana, 2012). This does not imply a reduction in economic growth if the new generations have higher productivity levels as a result of improvements in education.
Figure 1 Population at working ages
Source: Author’s calculations with data of Instituto Nacional de Estadísticas y Centro Centroamericano de Población.
In Costa Rica, the labor force represents more than 65% of people at working ages, similar to the world average (PEN, 2015). It is important to consider the quadratic relationship between GDP per capita and the labor force participation (Figure 2). Three thresholds were identified. The first is composed of countries with low income levels and high rates of labor force participation, over 80%. Most of the countries in this group are part of sub-Saharan Africa. The second threshold are mostly middle-income countries,
!5%
0%
5%
10%
15%
20%
25%
0
500.000
1.000.000
1.500.000
2.000.000
2.500.000
3.000.000
3.500.000
4.000.000
4.500.000
1950
1955
1960
1965
1970
1975
1980
1985
1990
1995
2000
2005
2010
2015
2020
2025
2030
2035
2040
2045
2050
Crecimiento
Absolutos
Año
Absolutos Crecimiento

Pamela Jiménez-Fontana. Working paper.
5
which have a smaller labor force rate, such as the case of Costa Rica. Finally, the third threshold consists of countries with high per capita income and greater participation in the workforce. Therefore, if Costa Rica wants to stimulate economic growth, it is necessary to pay attention to the barriers that restrict a greater participation at the labor market.
Figure 2 Real GDP per capita and labor force participation. 2011
a/ Labor force participation of 2007. Real GDP of 2011. Source: Author’s calculations with World Bank and ILO data.
The availability of labor force is necessary condition for growth. Population aging might difficult economic growth due to the reductions in the workforce. Between 2015 and 2020, the number of people at working age will grow by 5%, with an annual average of approximately 20,000 additional workers every year. The opportunity to increase the Costa Rican labor force depends on the participation rates by sex and age. Although Costa Rica’s labor force participation is average comparing with the rest of the world, there are important gaps by gender. In Costa Rica, male labor force participation rate is about 85%, above the level of Spain, Chile, Mexico, Sweden, and slightly above the world average (Figure 3). In the past 23 years, a slight reduction in the indicator was observed in most countries. This might be explained by two factors: i) men reduce their time dedicated to work, because women are participating more in the market and ii) the male labor force participation reached a level close to the frontier. In other words, the possibility of having a significant increase on the male workforce participation in Costa
45
50
55
60
65
70
75
80
85
90
95
4 5 6 7 8 9 10 11
Labo
r for
ce p
artic
ipat
ion
rate
(15-
64)
GDP per capita real (log)
Asia Oriental y Pacífico Europe and Central Asia Sub-Saharan Africa
Latin America and Caribbean North America South Asia
Costa Rica

Pamela Jiménez-Fontana. Working paper.
6
Rica is low. Countries with rates above 90% belong mostly to countries in sub-Saharan Africa with poor employment conditions. In Costa Rica, public policies related to male employment should be focused on reducing unemployment.
Figure 3
Male labor force participation. 1990-2013
Source: Author’s calculations World Bank.
Despite the economic growth of the last twenty years, the main indicators of inequality reflect a slow progress on reducing gender gaps. Women suffer a higher poverty and unemployment levels (CEPAL, 2012). The higher educational qualifications of women are not being reflected on better employment opportunities (PEN, 2015). Costa Rica is the fourth Latin American country with the lowest female participation. Although since 1990 the country increased this indicator by almost 15 percentage points, it still remains low compared to the world average (Figure 4). In other words, there is room to increase female labor force participation. The countries with higher female labor force participation include Norway, Sweden and Finland, countries that are recognized by low levels of gender inequality and generous family policies. These countries have a female labor force participation rate of approximately 75%, 25 percentage points above Costa Rica. Currently, Costa Rica is located on the 68th place of 187 countries worldwide in the gender inequality index, which reflects the broad gender inequalities that still remain in the country (United Nations, 2016).
0%
20%
40%
60%
80%
100%
Fran
cia
Finl
andi
a
Chi
le
Espa
ña
Nor
uega
Arge
ntin
a
El S
alva
dor
Boliv
ia
Col
ombi
a
Nic
arag
ua
Vene
zuel
a, R
B
Suec
ia
Mex
ico
Cos
ta R
ica
Hon
dura
s
Beliz
e
Bras
il
Ecua
dor
Uru
guay
Pana
ma
Perú
Para
guay
1990 2013 World Average

Pamela Jiménez-Fontana. Working paper.
7
Figure 4
Female labor force participation. 1990- 2013
Source: Author’s calculations with World Bank data.
Gender gaps are more evident by looking at participation rates by age group. Out of every 100 men between 25 and 49 years, there are 95 on the workforce, while for women this rate is 64 per 100 (Figure 5). This confirms that there is small margin to increase male labor, while the main opportunity is on the female labor force. Also, the graph shows that women retire early from the labor market, which might be a generational effect. Changes in the participation of women on the labor market depend on the incentives of public and private policies. In addition, a generational change depends not only on educational qualifications, also influences the availability of support networks and family responsibility in domestic work.
Why is this important? We need to ensure women have the freedom to choose if they want to work on the labor market or they want to specialize on housework. What if a woman wants to stay at the house cleaning or doing childcare? Working or not at the labor market has to be part of a personal decision and not a result of cultural norms.
20%
40%
60%
80%
100%H
ondu
ras
Mex
ico
Nic
arag
ua
Cos
ta R
ica
El S
alva
dor
Gua
tem
ala
Beliz
e
Pana
ma
Vene
zuel
a, R
B
Arge
ntin
a
Chi
le
Ecua
dor
Para
guay
Col
ombi
a
Bras
il
Boliv
ia
Fran
cia
Uru
guay
Espa
ña
Perú
Finl
andi
a
Nor
uega
Suec
ia
1990 2013 World average

Pamela Jiménez-Fontana. Working paper.
8
Figure 5 Labor force participation rates. Costa Rica 2014
Source: Author’s estimations using Household Surveys (INEC).
Given the inevitable process of aging, it is a public concern that the country might not have the labor force required to generate economic expansion. Considering the labor participation rates by sex, further increases in the labor force must be the result of a sustainable incorporation of women. This is known as gender dividend, which is explained as the potential economic growth derived from increased participation of women in the labor market (Martínez-Gómez, Miller and Saad, 2013). The implementation of a comprehensive care policy could increase the participation of women in the market and boost economic growth (ILO, 2010)
Although in recent years Latin America has reduced gender gaps, women still bear great inequalities and discrimination throughout their life. Women are the main responsible for unpaid work, and in many cases maintain a double burden for their role in the labor market (Inamu, 2011, INEC and Inamu, 2008). There are few public or private solutions to balance housework with work market in Latin America (ECLAC, 2010). Women's empowerment is a prerequisite for achieving gender equality condition. The lack of autonomy combined with low family responsibilities limit the freedom of women to act on their own decisions (Benavente & Valdes, 2014). Chile and Uruguay are the countries of the region showing further progress on designing childcare and elderly care public policies. In the case of Costa Rica, the country implemented different models of care, but with a low coverage relative to the potential demand.
0%
20%
40%
60%
80%
100%
15-19 20-24 25-29 30-34 35-39 40-44 45-49 50-54 55-59 60-64Age
Male Female

Pamela Jiménez-Fontana. Working paper.
9
2.2. Childcare and elderly care networks in Costa Rica In 2014, Costa Rica approved a law that officialized the National Network for
Child Care and Development (REDCUDI). The beneficiaries of this program are mainly families in poverty condition. The program seeks to encourage women’s participation on the labor market and improve the educational development of children under seven years in social vulnerability. According to official reports, the program registers approximately 32,000 children. The network works with a number of programs and institutions that functioned before the law was created. According to Guzman (2014), the REDCUDI is formed by the Ministry of Social Welfare, the Institute for Social Assistance, the Ministry of Public Education, Public Universities, the Ministry of Health, the National Institute of Technical Education, the National Institute of Women, the Costa Rican Social Security and communities. The aim of the law was to establish a comprehensive policy on child care. The network gives priority to beneficiaries who are below the poverty line, therefore many families in vulnerable economic situation are excluded of the network, but at the same time these families do not have the income to pay for private care centers. REDCUDI is not limited to the care service, they also subsidize companies, individuals and organizations which aim to improve childcare development. The main challenge of the Network is to expand the program’s coverage to a larger number of beneficiaries, which could run through partial subsidies or copayment that facilitate access to different strata of the population.
In order to ensure the care of all vulnerable sectors, the Progressive Care Network program was established for the care of elderly 65 years or older in poverty condition. Like the childcare network, this project is formed by multiple public and private actors dedicated to the care of older adults in 41 of the 81 cantons of the country. By 2012 the network provided support to 5.071 seniors. Among the main weaknesses of these programs are lack of monitoring and evaluation, inadequate human resources, low coverage of beneficiaries and lack of a record of information (Conapam, 2012; Conapam, 2016)
2.3. Making visible the unpaid work The System of National Accounts (SNA) led by the United Nations registers the
paid work that takes place in the labor market (United Nations, 2009). The Central Bank of Costa Rica uses this methodology to account for the size of the country's economy. The main limitations of the SNA is that registers only macroeconomic aggregates and it does not include unpaid work. If market production is disaggregated by sex, it might seem that women's contribution to the economy is less than half men's (Donehower and Mejia, 2011). This conclusion is biased and it also minimizes unpaid work done mostly by women (Landefeld and McCulla, 2000). Given the above, satellite accounts seek to complement national accounts by using different sources of information. In Costa Rica, the Congress recently approved a law for the creation of a satellite account of unpaid work in Costa Rica (INAMU, 2015).
The National Transfer Accounts (NTA) project aims to measure and analyze the generational economy, which widening the horizon of macroeconomic aggregates. The project estimates the age profile of production, consumption, savings and transfers. In order to include unpaid work and to draw attention of gender inequalities in production,

Pamela Jiménez-Fontana. Working paper.
10
the NTA network develops the Counting Women's Work project, an initiative that complements the methodology by estimating profiles production unpaid by age and sex. Previous studies of this project in Costa Rica confirm that women are primarily responsible for unpaid work and that there is little family responsibility (Jimenez-Fontana, 2015b).
3. Sources of information
3.1. Unpaid production and consumption profiles
Since unpaid work is not register on the System of National Accounts, traditional sources of information such as administrative records cannot be used to measure unpaid work. This study uses time use surveys to estimate the time spent on productive and non productive activities. In Costa Rica there is not a nationally representative survey of time use. As a background, in the 2004 Household Survey (INEC) included a cluster of time use questions; however, this section does not include a breakdown of time spent on various activities at home. Given past experience, the National Women's Institute built the first time use survey for the Great Metropolitan Area (INAMU, CICTF, 2011). This survey is not nationally representative, since fieldwork was developed only for the metropolitan area. Despite the above, this survey has detailed information that allow the analysis of unpaid domestic work. The survey interviews approximately 4,800 people aged twelve or more, regarding various activities. Figure 6 shows the distribution of the sample of the entire family by age group.
Figure 6
Sample distribution by age groups and sexa/. Costa Rica, 2011
a/ Sample adjusted by the population factor. Source: Author’s estimations using the Metropolitan Time Use Survey, 2011.
0102030405060708090
100
0 10 20 30 40 50 60 70 80 90
Thou
sand
of p
eopl
e
Age
Male Female

Pamela Jiménez-Fontana. Working paper.
11
One of the limitations of the survey is that the interviewee did not limit the total
time reported to 24 hours a day. Therefore, an important excess of time was observed. To correct these cases, each activity was adjusted proportionally in order to not affect the distributions. The correction adjustment is shown on the equations (1) and (2) (Jimenez-Fontana, 2015b). For the per capita profiles of unpaid production and consumption the adjustment is performed only for the cases of an excess of time reported. If the surplus is negative (underreporting), the methodology establishes that the remaining time is not productive, so this will not affect the estimate of the profiles. Only when the total distributions of time spent on all household chores, including nonproductive activities are estimated, underreporting of time is corrected to adjust to 24 hours.
1 𝜖$ = 24 − 𝑇*$
+
*,-
2 𝑇*$. = 𝑇*$ − 𝜀$×𝑇*$𝑇*$+
*,-
𝑖: person 𝜖: surplus 𝜆: activity 𝑇*$: timespentontheactivityλforthepersoni 𝑇*$. : timeadjusteddedicatedontheactivityλforthepersoni
3.2. Market production and consumption profiles
The household income surveys of 2004 and 2013 were used to estimate the labor income profiles and market consumption. Both surveys are representative at a national level.
4. Methodology
4.1. 1. Unpaid consumption and production This study is based on the methodology developed by the international project
Counting Women's Work (Donehower, 2014), led by the University of California, Berkeley and the University of Cape Town. The activities of the survey were classified into three groups: paid or registered activities in national accounts, unpaid production and non-productive activities. Regarding the former, it consists on activities that received in exchange for work a remuneration in kind or cash. The second group consists of productive activities that did not receive remuneration in return. To determine whether an activity is considered production unpaid or not, the criterion of the third person developed by Reid (1934) is used. This criterion states that unpaid production are all the activities that can be delegated on a third party, like cooking, washing, cleaning, care and home maintenance. The activities that do not meet this criterion are classified as non-productive group, which includes time spent on activities like sleeping, studying, eating and recreation (Jimenez-Fontana, 2015b). Once you

Pamela Jiménez-Fontana. Working paper.
12
have identified the unpaid productive activities, the per capita profiles for each activity are estimated as the average time spent on each activity by sex and single ages weighted by the expansion factor.
The unpaid production profiles allow an insight into the contribution of women in the economy. However, it is necessary to determine who is consuming this production. This unpaid consumption is obtained by indirect methods, because the survey does not include questions of who is consuming the time produced by each household member. Two types of consumption were constructed: general and specific. The first one includes those activities whose beneficiaries are all household members. This group consists of activities such as cleaning, washing, cooking and home maintenance. For the estimation of these profiles, the total time produce of each activity is divided equally among all household members, including the producer (equation 3). For example, in a household of three members, if one person produces three hours a day cleaning the house, then each member of the household will consume one hour of cleaning per day.
3 𝐶*J =𝑇*$K+
$,-
𝑛
𝑖: person j:household𝜆: activity n: totalhouseholdmembers 𝑇*$K: timeproduceontheactivityλbytheperson𝑖onthehousehold𝑗 𝐶*J:avaragetimeconsumedontheactivityλbyeachhouseholdmember𝑗
Regarding the specific consumption, it is defined when the question identifies the age range of the consumer. For the case of Costa Rica, the only specific consumption was childcare for children under twelve. To assign this consumption a linear regression between the time of child care produced as the dependent variable and age as independent variables (equation 4) is estimated. The regression coefficients are used as weights to assign the childcare produced to the potential consumers. The linear regression allows to assign greater weight to small children, given the estimated variability between households with different structures by age and sex
4 𝐶(𝑐𝑖)$ = 𝛼 𝑎 𝑀K 𝑎 +W
𝛽 𝑎 𝐻K 𝑎W
+ 𝜀K𝑠𝑖𝑎 < 12
𝑎: age 𝑗:household 𝑀K 𝑎 : numberofwomenproducersofchildcareattheageainthehouseholdj 𝐻K 𝑎 : numberofmenproducersofchildcareattheageainthehouseholdj 𝐶(𝑐𝑖)K: childcareconsumptionfortheindividualionthehouseholdj𝑗
Regarding the production of elderly care, care of disabled and people outside the household, the methodology of general consumption was used given the small sample size and the lack of specification on the survey. The care of other household members aged twelve or more, also was assigned with the general method, since producers belong to the same age range potential consumers, so it can not estimate the weights by linear regression.

Pamela Jiménez-Fontana. Working paper.
13
An economic value was imputed to all of the profiles using the specialist replacement method (Donehower, 2013). The wages were estimated with the Household Survey of 2011 (INEC).
4.2. Scenario In order to analyze in depth, the barriers that women face in entering the labor
market in Costa Rica, this study estimates the theoretical impact on unpaid production by an increase on the female labor force. According to the Time Use Survey (2011), 57% of women in the greater metropolitan area are engaged in the labor market. This indicator is higher than the average national level, which explains why the GAM excludes an important part of rural areas. The methods and assumptions used to estimate the impact of the increase in female labor force are detailed below:
• Two types of women were considered: women working at the labor market and women that do not work at the labor market. The unpaid production profiles disaggregated by employment status were estimated.
• The scenario considered an increase of 4 percentage points on the female labor force participation, in order to reach 61%. The increase was achieved through a random selection of women aged between 20 and 35, that were not working on the market.
• To estimate the impact on unpaid production the following assumption was made: if a woman who did not work on the market decides to join the labor force, then the time spent on each activity of unpaid production was reduced by the average time spent by a woman of the same age that was working in the labor market, as shown in the equation (5).
5 𝑇*$W∗ 𝑁 = 𝑇*W 𝑆 si𝑇*$W 𝑁 > 𝑇*W 𝑆
𝑖: individual 𝜆: activity 𝑎: age 𝑇*$W 𝑁 : Timespendontheactivity𝜆bywoman𝑖attheage𝑎thatdoesnotworkatthemarketTdef∗ N : Adjustedtimespendonactivityλbywomaniattheageathatnowwillbeworkingonthemarket 𝑇*W 𝑆 : Promediodeltiempoquededicaunamujeralaactividad𝜆conedad𝑎quetrabajaenelmercado
4.3. Market consumption and production profiles These profiles were estimated using the manual of the National Transfer Account Project (United Nations, 2013). The macroeconomic adjustment was made using the Central’s Bank National Accounts report base on SNA manual of 1991. Recently, the Central Bank published a new set of National Accounts indicators with the manual of 2008. Therefore, the estimates presented in this study are preliminary, given that the macroeconomic aggregates have to be updated.

Pamela Jiménez-Fontana. Working paper.
14
5. Results
5.1. Gender inequality on the distribution of time Figure 7 shows the gender gaps on time distribution of all the activities of daily
living. Regarding non-productive activities, the biggest difference is observed in daily hours devoted to leisure and recreation, in which men under age 40 spend almost one hour more than women. Women spend more time on education than men. The social pressure of men to enter quickly at the labor market could explain the lower time dedicated to education.
Figure 7 Gender gaps on time usea/.
Costa Rica, 2011.
a/ The profiles were adjusted for underreporting and reporting for 24 hours per day per person. Source: Author’s calculation using Time Use Survey (2011) and Donehower, 2014.
Regarding the productive activities, important gender gaps were found explained by a sexual division of labor: men are the main responsible for paid work, while women bear much of unpaid production. Men spend more than 2 hours on average than women on the labor market, while women spend 3 hours more than men doing unpaid work. The main objective of this research is to identify some of the barriers that explain the difficulty for women to enter the labor market.
Using the methodology developed by Donehower (2014), the unpaid production profiles by sex (Figure 8) were estimated. When the profiles are disaggregated, the
-5
-4
-3
-2
-1
0
1
2
3
4
5
10 15 20 25 30 35 40 45 50 55 60 65
Gap
men
-wom
en (h
ours
per
day
)
Age
Education Labor market Unpaid work Leisure Sleeping Others
Men dedicate
more time
Women dedicate
more time

Pamela Jiménez-Fontana. Working paper.
15
gender gaps are evident. Men spend on average only 9 minutes per day washing the dishes, 18 minutes doing housecleaning and 31 minutes cooking, there are no important differences in the distribution by age. Meanwhile, time spent by women in these activities increases with age until about 50 years. In other words, women dedicate most of their lives to unpaid work. On average, the time spent by women on the most important unpaid activities, triples men.
Figure 8 Unpaid production profiles for the 6 main activities
Costa Rica, 2011 (hours per day)
0
0,6
1,2
1,8
2,4
3
10 20 30 40 50 60 70
Horas
Edad
Cooking
Male Female
0
0,4
0,8
1,2
1,6
10 20 30 40 50 60 70Horas
Edad
Cleaning
Male Female
0
0,2
0,4
0,6
0,8
1
10 20 30 40 50 60 70
Horas
Edad
Laundry
Male Female
0
0,4
0,8
1,2
1,6
10 20 30 40 50 60 70
Horas
Edad
Childcare
Male Female

Pamela Jiménez-Fontana. Working paper.
16
Source: Author’s calculation using Time Use Survey (2011).
The time dedicated to child care is concentrated on reproductive ages. Proportionately, men contribute more to child are than other general work such as cleaning or cooking. This finding is consistent with previous studies on time use module 2004 (Jimenez-Fontana, 2015a). Despite this, women maintain most of the burden of caring for children.The methodology to allocate unpaid consumption assumes there is no gender inequality on non remunerated consumption; however, this does not mean the gaps do not exist. Future research should focus on using different weights in the allocation of overall consumption. Overall, the distribution of unpaid consumption is relatively constant until age 40, age at which consumption start to slightly increase, especially for women (Figure 9).
Figure 9 Unpaid consumption for general activities, by sexa/.
Costa Rica, 2011. (hours per day)
0
1
2
3
4
5
0 5 10 15 20 25 30 35 40 45 50 55 60 65 70
Hours
Age
Male Female
0
0,1
0,2
0,3
0,4
0,5
10 20 30 40 50 60 70
Horas
Edad
Administrative
Male Female
0
0,1
0,2
0,3
0,4
0,5
10 20 30 40 50 60 70
Horas
Edad
Shopping
Male Female
Pamela Jiménez-Fontana. Working paper.
17
a/ Time spent cleaning, washing, cooking, home repairs, gardening, administrative, pet care, shopping, and others. Excludes care to older adults and other household members. Source: Author’s calculation using Time Use Survey (2011).
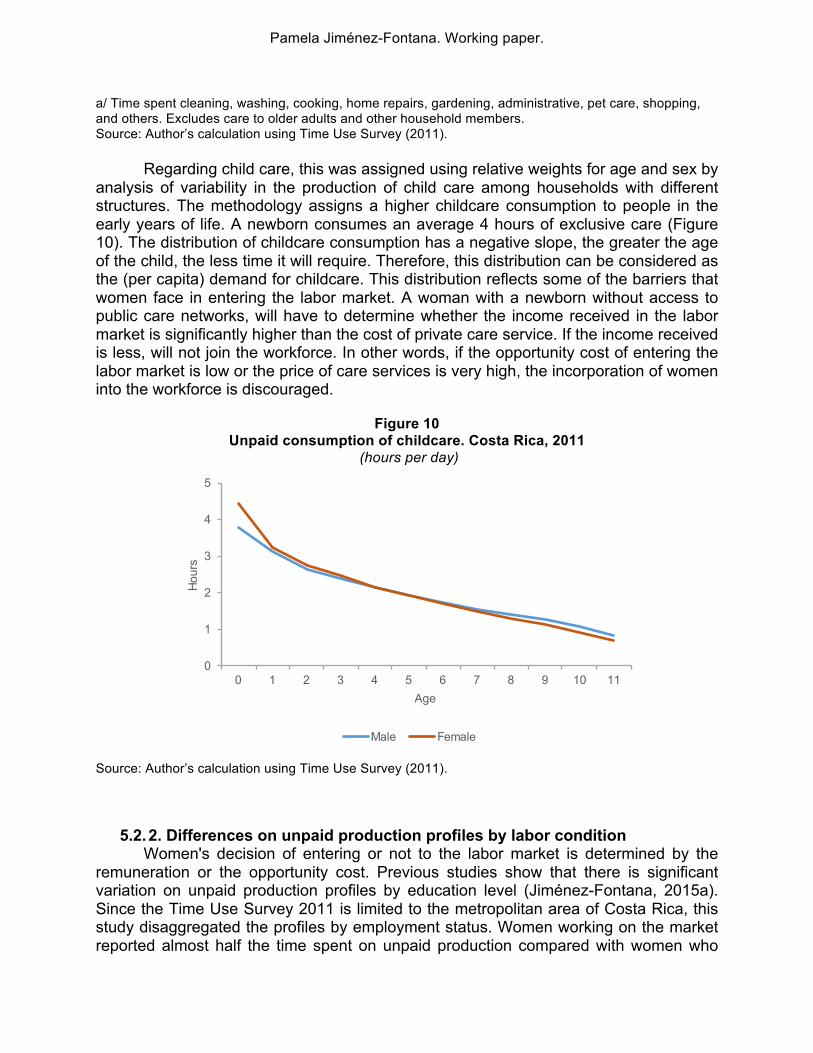
Regarding child care, this was assigned using relative weights for age and sex by analysis of variability in the production of child care among households with different structures. The methodology assigns a higher childcare consumption to people in the early years of life. A newborn consumes an average 4 hours of exclusive care (Figure 10). The distribution of childcare consumption has a negative slope, the greater the age of the child, the less time it will require. Therefore, this distribution can be considered as the (per capita) demand for childcare. This distribution reflects some of the barriers that women face in entering the labor market. A woman with a newborn without access to public care networks, will have to determine whether the income received in the labor market is significantly higher than the cost of private care service. If the income received is less, will not join the workforce. In other words, if the opportunity cost of entering the labor market is low or the price of care services is very high, the incorporation of women into the workforce is discouraged.
Figure 10 Unpaid consumption of childcare. Costa Rica, 2011
(hours per day)
Source: Author’s calculation using Time Use Survey (2011).
5.2. 2. Differences on unpaid production profiles by labor condition Women's decision of entering or not to the labor market is determined by the
remuneration or the opportunity cost. Previous studies show that there is significant variation on unpaid production profiles by education level (Jiménez-Fontana, 2015a). Since the Time Use Survey 2011 is limited to the metropolitan area of Costa Rica, this study disaggregated the profiles by employment status. Women working on the market reported almost half the time spent on unpaid production compared with women who
0
1
2
3
4
5
0 1 2 3 4 5 6 7 8 9 10 11
Hours
Age
Male Female
Pamela Jiménez-Fontana. Working paper.
18
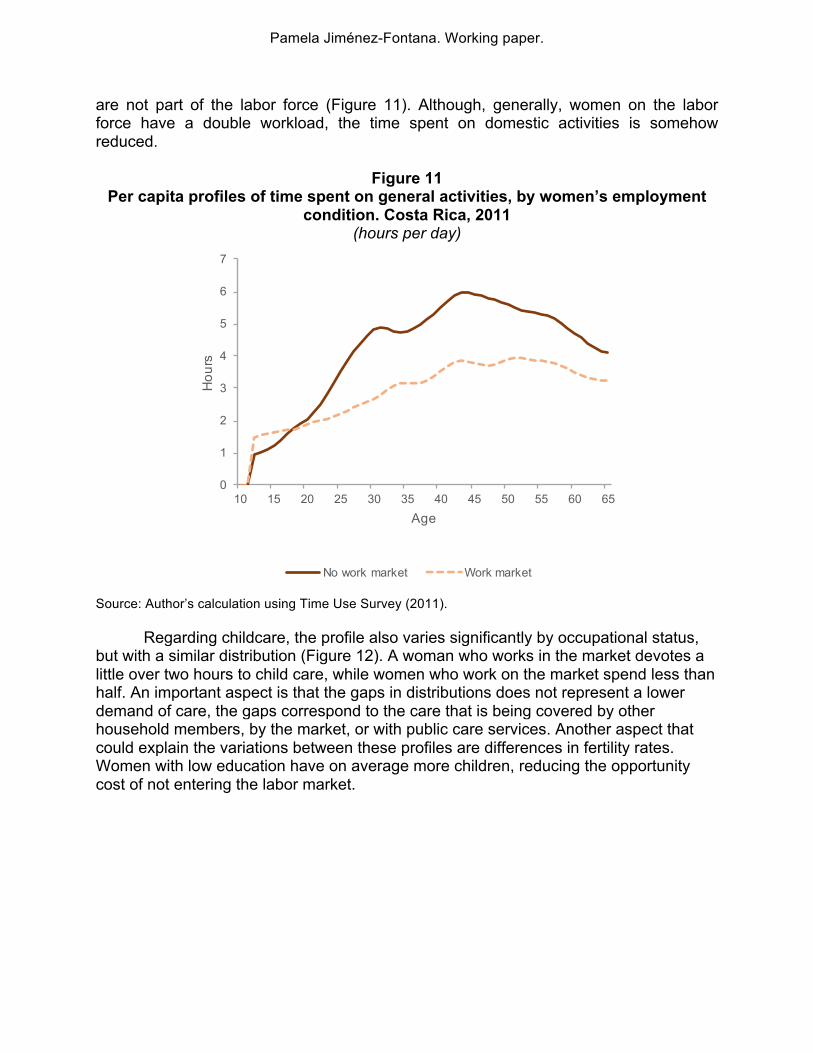
are not part of the labor force (Figure 11). Although, generally, women on the labor force have a double workload, the time spent on domestic activities is somehow reduced.
Figure 11 Per capita profiles of time spent on general activities, by women’s employment
condition. Costa Rica, 2011 (hours per day)
Source: Author’s calculation using Time Use Survey (2011).
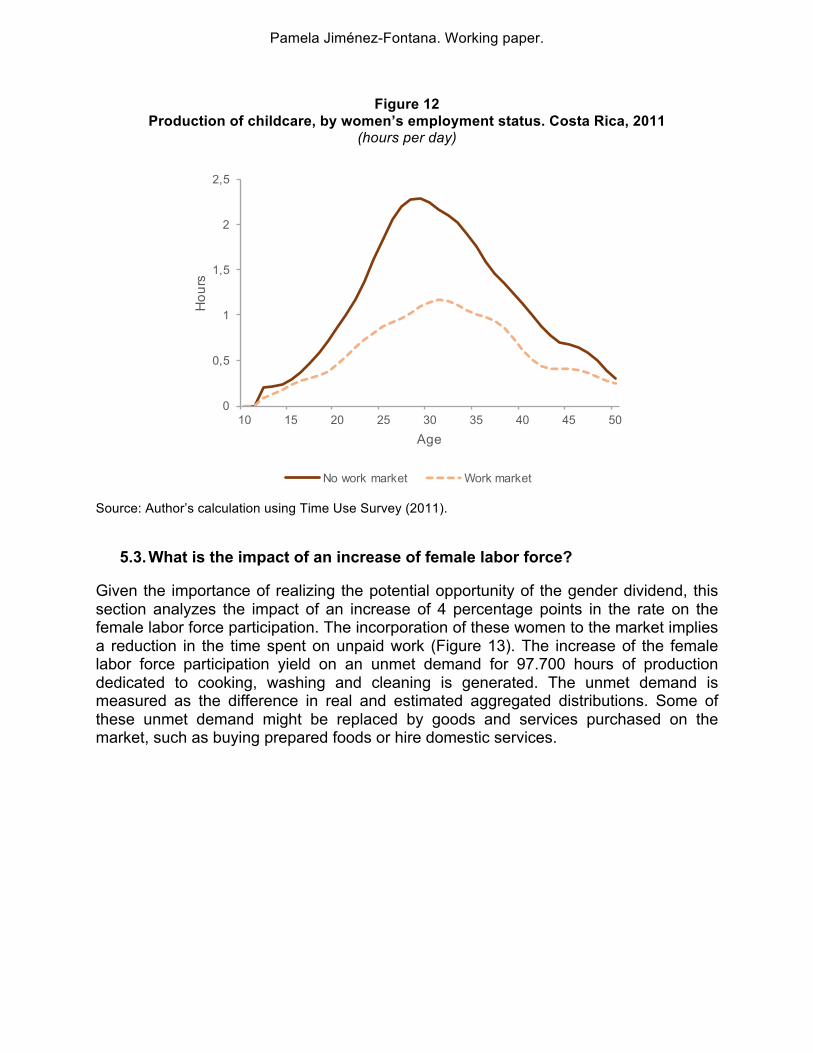
Regarding childcare, the profile also varies significantly by occupational status, but with a similar distribution (Figure 12). A woman who works in the market devotes a little over two hours to child care, while women who work on the market spend less than half. An important aspect is that the gaps in distributions does not represent a lower demand of care, the gaps correspond to the care that is being covered by other household members, by the market, or with public care services. Another aspect that could explain the variations between these profiles are differences in fertility rates. Women with low education have on average more children, reducing the opportunity cost of not entering the labor market.
0
1
2
3
4
5
6
7
10 15 20 25 30 35 40 45 50 55 60 65
Hou
rs
Age
No work market Work market
Pamela Jiménez-Fontana. Working paper.
19
Figure 12 Production of childcare, by women’s employment status. Costa Rica, 2011
(hours per day)
Source: Author’s calculation using Time Use Survey (2011).
5.3. What is the impact of an increase of female labor force?
Given the importance of realizing the potential opportunity of the gender dividend, this section analyzes the impact of an increase of 4 percentage points in the rate on the female labor force participation. The incorporation of these women to the market implies a reduction in the time spent on unpaid work (Figure 13). The increase of the female labor force participation yield on an unmet demand for 97.700 hours of production dedicated to cooking, washing and cleaning is generated. The unmet demand is measured as the difference in real and estimated aggregated distributions. Some of these unmet demand might be replaced by goods and services purchased on the market, such as buying prepared foods or hire domestic services.
0
0,5
1
1,5
2
2,5
10 15 20 25 30 35 40 45 50
Hou
rs
Age
No work market Work market

Pamela Jiménez-Fontana. Working paper.
20
Figure 13 Aggregate production of unpaid work dedicated to general activities. Costa Rica, 2011
(hours per day)
Source: Author’s calculation using Time Use Survey (2011).
Childcare is more difficult to delegate given the high price of private childcare services. By increasing 4 percentage points female participation in the market, there would be an unmet demand for care of 26.020 hours per day that were being covered by women (Figure 14). If the government decide to cover through public policies this unmet demand for care to encourage women's participation, this could involve hiring 3,252 workers in child care specialists who work 8 hours per day; however, in this scenario economies of scale should be taken into account. For example, if there is one child per household, the care center can take care at least 10 children. In other words, a public policy that encourages the incorporation of women into the market, is a platform for economies of scale in child care networks.
0
20.000
40.000
60.000
80.000
10 15 20 25 30 35 40
Hour
s pe
r day
Age
Observed Scenario

Pamela Jiménez-Fontana. Working paper.
21
Figure 14 Aggregate production of unpaid childcare. Costa Rica, 2011
(hours per day)
Source: Author’s calculation using Time Use Survey (2011).
0
2.000
4.000
6.000
8.000
10.000
12.000
14.000
16.000
18.000
20.000
10 15 20 25 30 35 40
Hour
s pe
r day
Age
Observed Scenario

Pamela Jiménez-Fontana. Working paper.
22
5.4. Evolution of the labor income profile In 2004, women's labor income starts to increase later than men’s. On average,
women contributed to the labor income only 27%, less than half of what men produce (Figure 15). After ten years, gender gaps have been reduced due to the increase on women's labor income and a reduction on men’s. Also, men and women are spending more time on studying given the delay on their entrance to the labor market; however, men do start earlier than women. The cavity on the labor income profile between 35 and 45 might correspond to the lost generation of the 80's, this cohort were the kids that quit school during one of the worst economic crisis of Costa Rica.
Figure 15 Labor Income profiles, by sex. Costa Rica 2004 & 2013
Source: Author’s calculation using the Household Income Surveys of 2004 and 2013 (INEC).
Changes on the educational qualifications explain the evolution of the labor income (Figure 16). Women invest more time on their own human capital. Men due to the social pressure of being a provider, household start earlier their participation to the labor market sacrificing their own human capital, in other words, gender inequality is also affecting men. In the other side, women are doing very well on their educational achievement, and that explains the increase in the labor income, however, women still have higher unemployment rate and higher participation on the informal sector.
0
0.2
0.4
0.6
0.8
1
1.2
1.4
1.6
1.8
0 5 10 15 20 25 30 35 40 45 50 55 60 65 70 75 80 85 90
Inco
me
units
Age
Labor income 2004 y 2013
Men 2004 Women 2004 Men 2013 Women 2013

Pamela Jiménez-Fontana. Working paper.
23
Figure 16 Average years of schooling by sex. Costa Rica.
Source: Author’s calculation using the Household Surveys (INEC).
If only the market economy is considered, the final balance measure is that men are the main providers of dependents (children and elderly) (Figure 17), even though, women's life cycle deficit reduced.
Figure 17 Market Life Cycle Deficit, by sex. Costa Rica 2004 & 2013
Source: Author’s calculation using the Household Income Surveys of 2004 and 2013 (INEC).
6
7
8
9
10
11
1987
19
88
1989
19
90
1991
19
92
1993
19
94
1995
19
96
1997
19
98
1999
20
00
2001
20
02
2003
20
04
2005
20
06
2007
20
08
2009
20
10
2011
20
12
2013
20
14
2015
Average years of schooling by sex Costa Rica 1987-2015
av schooling men av schooling women
-1
-0.6
-0.2
0.2
0.6
1
0 5 10 15 20 25 30 35 40 45 50 55 60 65 70 75 80 85 90
Inco
me
units
Age
Men LCD 2004
Wom LCD 2004
Men LCD 2013
Wom LCD 2013

Pamela Jiménez-Fontana. Working paper.
24
It is necessary to include unpaid work to have a complete picture of the
economy. The total non market production of the metro area represent about 13% of GDP. The unpaid life cycle deficit has a different distribution than the figure presented above. Men have a deficit at early ages while women have an important surplus after the age of 20 (Figure 18).
Figure 18 Non market Life Cycle Deficit, by sex. Costa Rica 2011
Source: Author’s calculation using the Time Use Survey (INAMU, 2011)
The unpaid estimations are only for the metropolitan area of Costa Rica for 2011,
which means that it excludes most of the rural areas in which women invest a lot of time on unpaid work. The market estimations are nationally representative for 2013. Given that the estimates are normalized by labor income at productive ages, the profiles can market and unpaid profiles can be compared. Even though the profiles are excluding the unpaid work of rural areas, the combination of the profiles can suggest the distribution of the complete life cycle deficit. Figure 19 shows the full life cycle deficit by sex. It seems that men and women have a similar life cycle deficit, the main differences are that men have a bigger deficit at more advanced ages. Given that the unpaid production of rural areas is missing, women's surplus might be bigger than men's if the unpaid production of rural areas is included.
-1
-0.5
0
0.5
1
1.5
0 5 10 15 20 25 30 35 40 45 50 55 60 65 70 75 80 85
Inco
me
un
its
Age
Non market life cycle deficit
LCD no remunerado Wom LCD no remunerado Men

Pamela Jiménez-Fontana. Working paper.
25
Figure 19 Complete Life Cycle Deficit, by sex. Costa Rica
Source: Author’s calculation using the Time Use Survey (INAMU, 2011) and the Household Income Surveys (INEC, 2013).
-1
-0.5
0
0.5
1
1.5
2
0 5 10 15 20 25 30 35 40 45 50 55 60 65 70 75 80 85
Inco
me
units
Age
Life cycle deficit: market and non market
LCD total Wom LCD total Men

Pamela Jiménez-Fontana. Working paper.
26
6. Conclusions The estimates presented in this article evidence gender inequalities on the
intergenerational transfers. Women are the main responsible for unpaid work, especially in activities like cleaning, cooking, washing and caring for children. On average, a man spends two hours more than a woman in the labor market hours, while women spend 3 hours more than men doing unpaid production. Men contribute proportionately more to care than other activities.
Unpaid production is an obstacle for women to enter the market. This is clear when the profiles are disaggregated by employment status. Women who report being part of the labor market dedicate fewer hours to housework. Some activities such as cooking or cleaning can be easily delegated to a third party, while care have a high cost. Estimates of the potential demand for care show the challenges to increase the participation of women. On average, a child under two years demands approximately 4 hours of exclusive care. In the short run, public policies should increase the coverage of childcare networks and should encourage a greater participation of women on quality jobs in the formal sector. On the long run, the challenge is to create a culture of family responsibilities among all household members.

Pamela Jiménez-Fontana. Working paper.
27
References Benavente, M. y Valdés, A. (2014). Políticas públicas para la igualdad de género: un
aporte a la autonomía de las mujeres. Santiago de Chile: CEPAL.
CCP e INEC (2013) Estimaciones y Proyecciones de Población por sexo y edad 1950 -2050. San José: INEC.
CEPAL. (2010). ¿Qué Estado para qué igualdad? Brasilia: CEPAL.
________. (2012). Informe Anual 2012. Los bonos en la mira: aporte y carga para las mujeres. Santiago de Chile: CEPAL.
Conapam. (2012). Red de atención progresiva para el cuido integral de las personas adultas mayores: informe sobre la implementación del programa año 2012. Recuperado de: http://webmail.conapam.go.cr/mantenimiento/FOLLETO%20RED%20DE%20CUIDO%20-%20%20CONAPAM.pdf
________. (2016). Red de Atención Progresiva para el Cuido Integral de las Personas Adultas Mayores. Sitio oficial, recuperado de: http://www.conapam.go.cr/red-cuido/
Donehower, G. (2014). Incorporating Sex and Time Use into NTA: National Time Transfer Accounts Methodology. Recuperado de http://www.ntaccounts.org/web/nta/show/Gender,%20Time%20use
Donehower, G. y Mejía I. (2011). Everybody Works: Gender, Age and Economic Activity. Recuperado de http://epc2012.princeton.edu/papers/120225
Guzmán, J. (2014). Red Nacional de Cuido y Desarrollo Infantil en Costa Rica. Recuperado de: http://repositorio.cepal.org/bitstream/handle/11362/36819/S1420021_es.pdf?sequence=1
INAMU. (2011). Las brechas de género en Costa Rica. San José: INAMU.
________. (2015). Valorización del trabajo doméstico no remunerado-TDNR. Recuperado de http://www.inamu.go.cr/web/inamu/valorizacion-del-trabajo-domestico-no-remunerado
INAMU, Comisión Interinstitucional para la Contabilización del Trabajo Femenino. (2011). Encuesta de Uso de Tiempo de la Gran Área Metropolitana [Base de datos]. San José: INAMU.
INEC e INAMU (2008). Principales resultados del módulo de uso del tiempo. San José: INEC.
Pamela Jiménez-Fontana. Working paper.
28
Jiménez-Fontana, P. (2015a). Analysis of non-remunerated production in Costa Rica, en The Journal of the Economics of Ageing (5).
________. (2015b). Retos para materializar el dividendo de género: perfiles de uso de tiempo en Costa Rica, en Revista Población y Salud en Mesoamérica 13 (2)
Landefeld, J. S., y McCulla, S. H. (2000). Accounting for nonmarket household production within a national accounts framework. Review of Income and Wealth, 46(3), 289-307.
Martínez-Gómez, C., Miller, T., y Saad, P. (2013). Participación laboral femenina y bono de género en América Latina. Recuperado de: http://repositorio.cepal.org/bitstream/handle/11362/35897/S20131095_es.pdf?sequence=1
OIT. (2010). Trabajo decente y corresponsabilidad social en el cuido: Retos en el camino hacia la igualdad. San José: Organización Internacional del Trabajo.
PEN. (2015). Vigésimo primer Informe Estado de la Nación en Desarrollo Humano Sostenible. San José: Programa Estado de la Nación.
Reid, M. (1934). Economics of Household Production. Pp. 408. New York: John Wiley and Sons.
Rosero-Bixby, L. y Jiménez-Fontana, P. (2012). Retos y oportunidades del cambio demográfico para la política fiscal. San José: Universidad de Costa Rica.
Rosero-Bixby, L. y Robles, A. (2008). Los dividendos demográficos y la economía del ciclo vital en Costa Rica. Toluca: Universidad Autónoma del Estado de México.
United Nations. (2009). National System of National Accounts 2008. New York: United Nations.
________. (2013). National Transfer Accounts Manual: Measuring and Analyzing the Generational Economy. New York: United Nations.
________. (2016). Índice de desarrollo de género. Sitio oficial, recuperado en http://hdr.undp.org/es/faq-page/gender-development-index-gdi