Embed Size (px)
Citation preview
Challenges of Influenza Control
W. Paul Glezen, M.D.
Baylor College of Medicine
Houston

Newly Recognized Respiratory Agents
1. SARS coronavirus – SARS - CoV
2. Human metapneumonvirus - hmpv
3. Avain influenzaviruses
a) A (H5N1)
b) A (H7N7)
4. Hendra – Nipah viruses
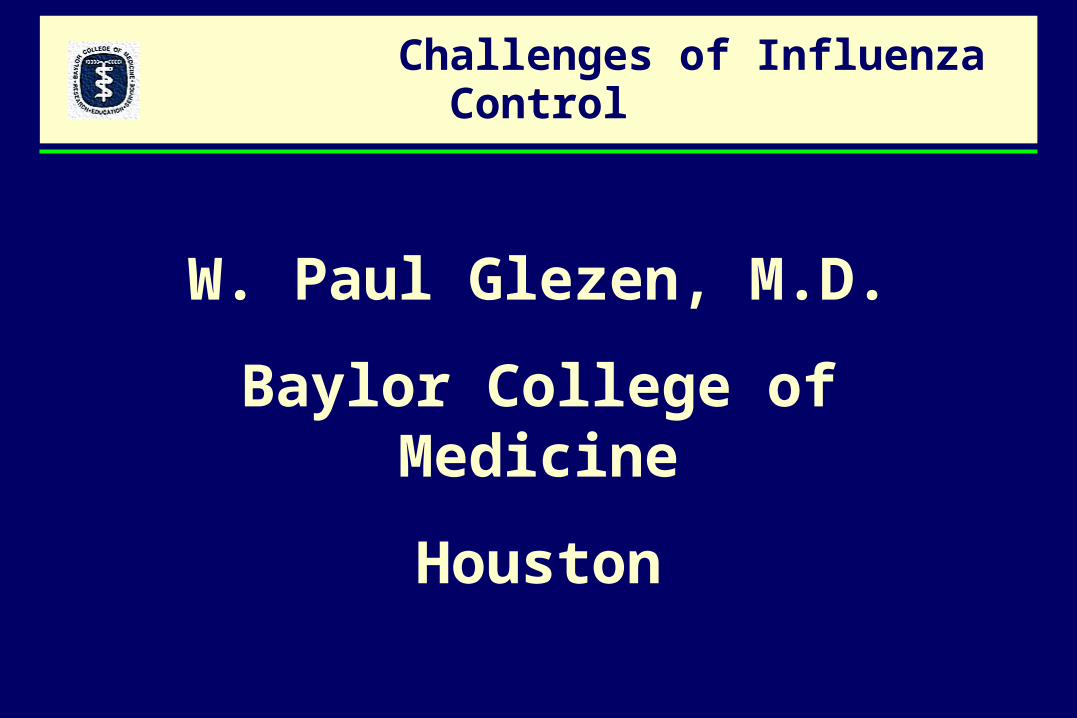
Hemagglutinin Subtypes of Influenza A Virus
Adapted with permission from Levine AJ. Viruses. 1992;165.
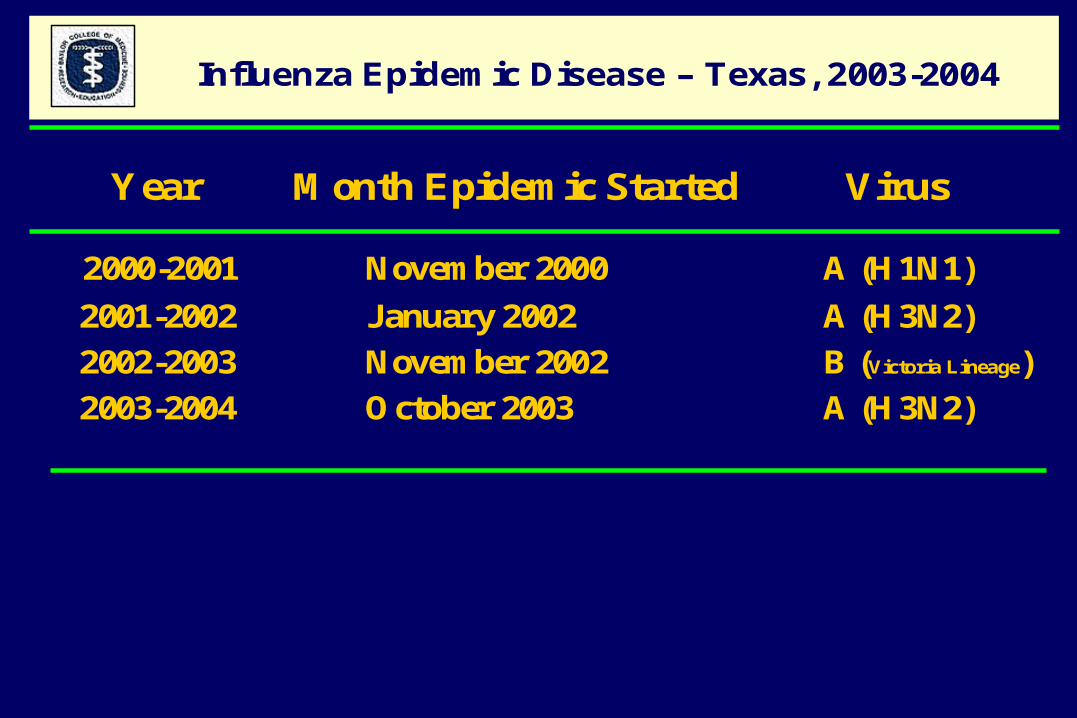
Influenza Epidemic Disease – Texas, 2003-2004
Year Month Epidemic Started Virus
2000-2001 November 2000 A (H1N1)
2001-2002 January 2002 A (H3N2)
2002-2003 November 2002 B (Victoria Lineage)
2003-2004 October 2003 A (H3N2)
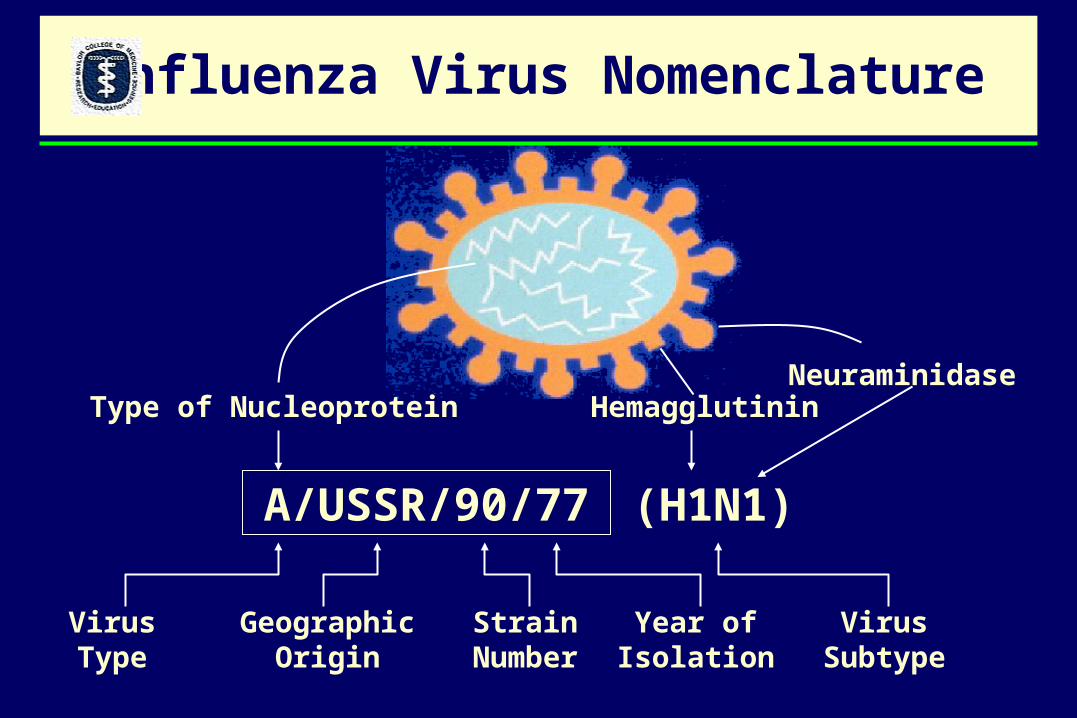
Type of Nucleoprotein HemagglutininNeuraminidase
VirusType
GeographicOrigin
StrainNumber
Year ofIsolation
VirusSubtype
A/USSR/90/77 (H1N1)
Influenza Virus Nomenclature
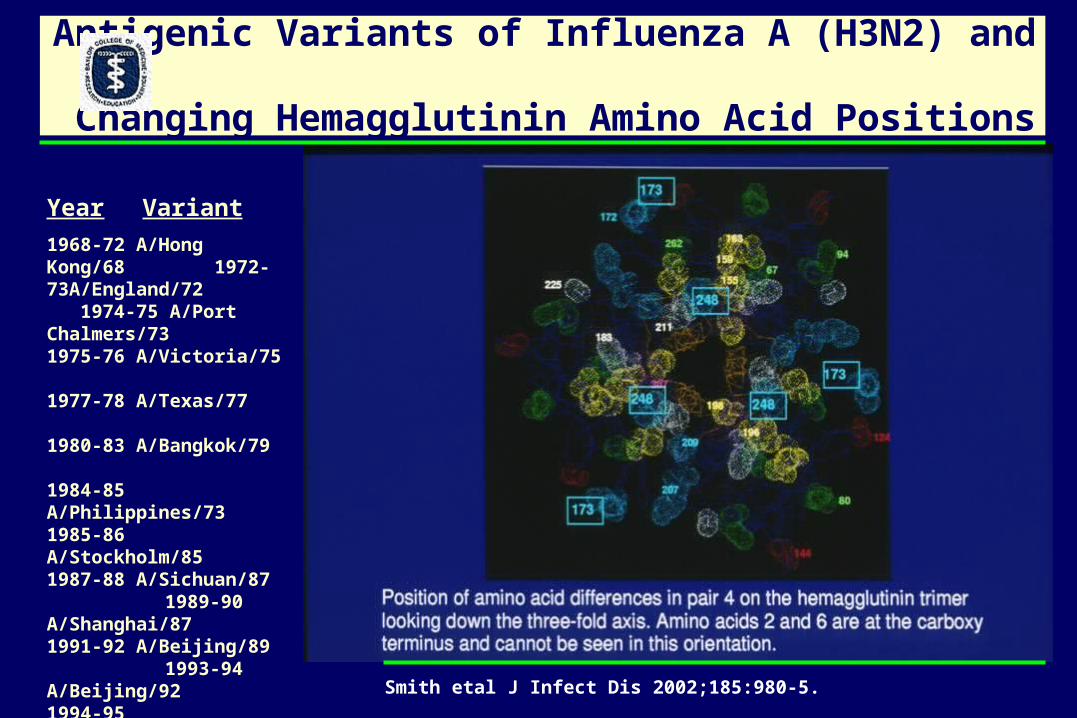
Antigenic Variants of Influenza A (H3N2) and Changing Hemagglutinin Amino Acid Positions
Year Variant
1968-72 A/Hong Kong/68 1972-73A/England/72 1974-75 A/Port Chalmers/73 1975-76 A/Victoria/75 1977-78 A/Texas/77 1980-83 A/Bangkok/79 1984-85 A/Philippines/73 1985-86 A/Stockholm/85 1987-88 A/Sichuan/87 1989-90 A/Shanghai/87 1991-92 A/Beijing/89 1993-94 A/Beijing/92 1994-95 A/Shangdong/93 1995-96 A/Johannesburg/94 1996-97 A/Wuhan/95 1997-00 A/Sydney/97 2001-02 A/Panama/99
Smith etal J Infect Dis 2002;185:980-5.
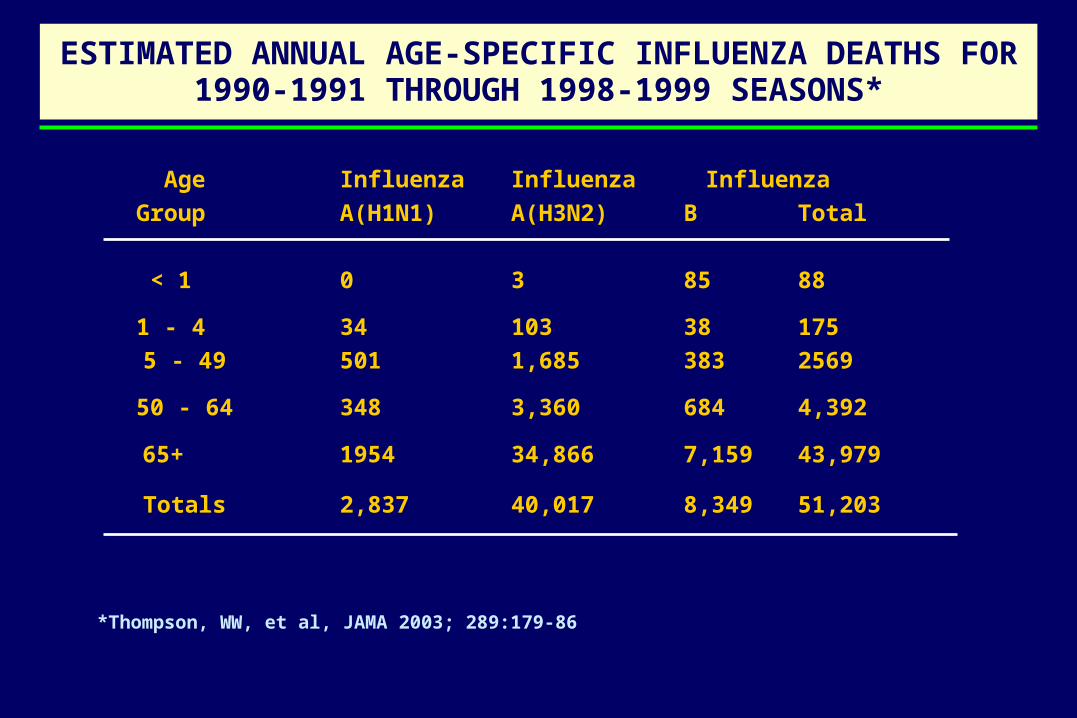
ESTIMATED ANNUAL AGE-SPECIFIC INFLUENZA DEATHS FOR 1990-1991 THROUGH 1998-1999 SEASONS*
Age Influenza Influenza Influenza
Group A(H1N1) A(H3N2) B Total
< 1 0 3 85 88
1 - 4 34 103 38 175
5 - 49 501 1,685 383 2569
50 - 64 348 3,360 684 4,392
65+ 1954 34,866 7,159 43,979
Totals 2,837 40,017 8,349 51,203
*Thompson, WW, et al, JAMA 2003; 289:179-86

Season A(H1N1) A(H3N2) B Total1990-1991 1,988 6,033 17,549 25,570
1991-1992 6,518 45,928 566 53,012
1992-1993 1,190 19,892 19,030 40,112
1993-1994 173 48,923 404 49,500
1994-1995 572 33,767 7,129 41,468
1995-1996 14,727 23,605 7,509 45,841
1996-1997 0 55,937 12,609 68,546
1997-1998 66 70,701 649 71,416
1998-1999 293 55,367 9,698 65,358
Mean (SD) 2,836 (4,909) 40,017 (20,656) 8,349 (7,105) 51,203 (15,081)
Estimated Annual Influenza-Associated Deaths for 1990-1991 Through 1998-1999 Seasons Using the Influenza Model
No. of Influenza DeathsAll-Cause Deaths
Thompson WW et al. JAMA. 2003;289:179-186.
Abbreviations: NA, not applicable.*Pneumonia and influenza estimates are based on the 1990-1991 through 1997-1998 seasons.
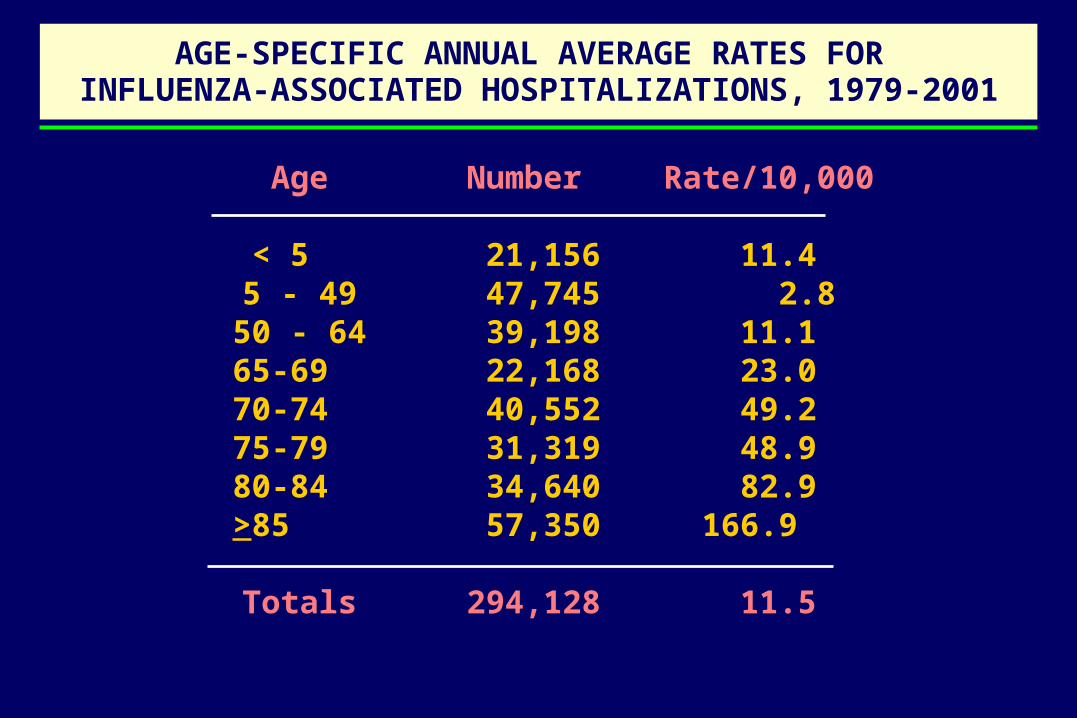
AGE-SPECIFIC ANNUAL AVERAGE RATES FOR INFLUENZA-ASSOCIATED HOSPITALIZATIONS, 1979-2001
Age Number Rate/10,000
< 5 21,156 11.4 5 - 49 47,745 2.850 - 64 39,198 11.165-69 22,168 23.070-74 40,552 49.275-79 31,319 48.980-84 34,640 82.9>85 57,350 166.9
Totals 294,128 11.5

ANNUAL INFLUENZA-ASSOCIATED HOSPITALIZATIONS, U.S., 1990-2001
Year Predominant Number Rate/10,000 Virus
1990-91 B 221,412 8.8 1991-92 A(H3N2) 326,331 12.8
1992-93 B+A(H3N2) 304,898 11.91993-94 A(H3N2) 322,736 12.41994-95 A(H3N2)+B 288,417 11.0 1995-96 A(H1N1)+(H3N2) 296,312 11.2 1996-97 A(H3N2)+B 490,246 18.3 1997-98 A(H3N2) 530,225 19.6 1998-99 A(H3N2)+B 503,896 18.4 1999-00 A(H3N2) 544,909 19.7 2000-01 A(H1N1)+B 316,588 11.3
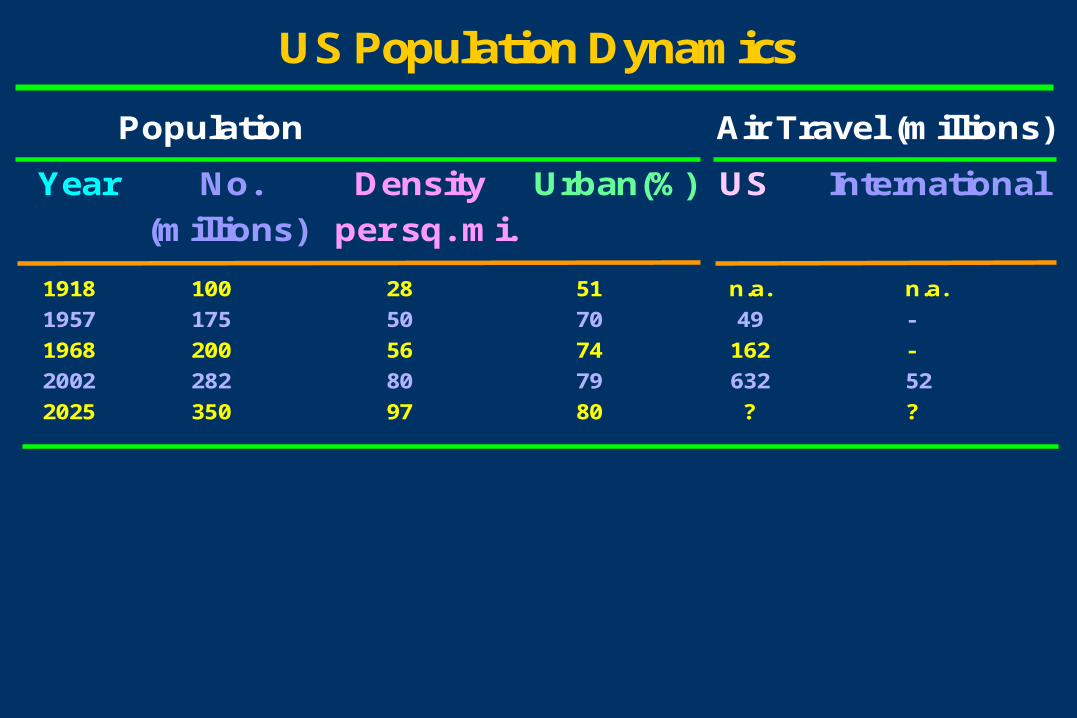
1918 100 28 51 n.a. n.a.
1957 175 50 70 49 -
1968 200 56 74 162 -
2002 282 80 79 632 52
2025 350 97 80 ? ?
US Population Dynamics
Population Air Travel (millions)
Year No. Density Urban(%)
(millions) per sq. mi.
US International

Estimated number of persons, influenza vaccine target groups, United States, July 1, 2002
Group Population (millions)
Increased Risk 82.8
Aged > 65 y 35.6
Chronic illness 39.7
Pregnant women 2
Other children aged 6-23 mo 5.5
Other (healthy) target groups 102.6
Health care personnel aged < 65 y 7
Household contacts of persons at increased risk 75.5
Other persons aged 50-64 y 20.1
Total, target groups 185.4
Total, persons aged > 6 mo 286.4 O’Mara etal, Infect Med 2003 (Nov) 548-54.
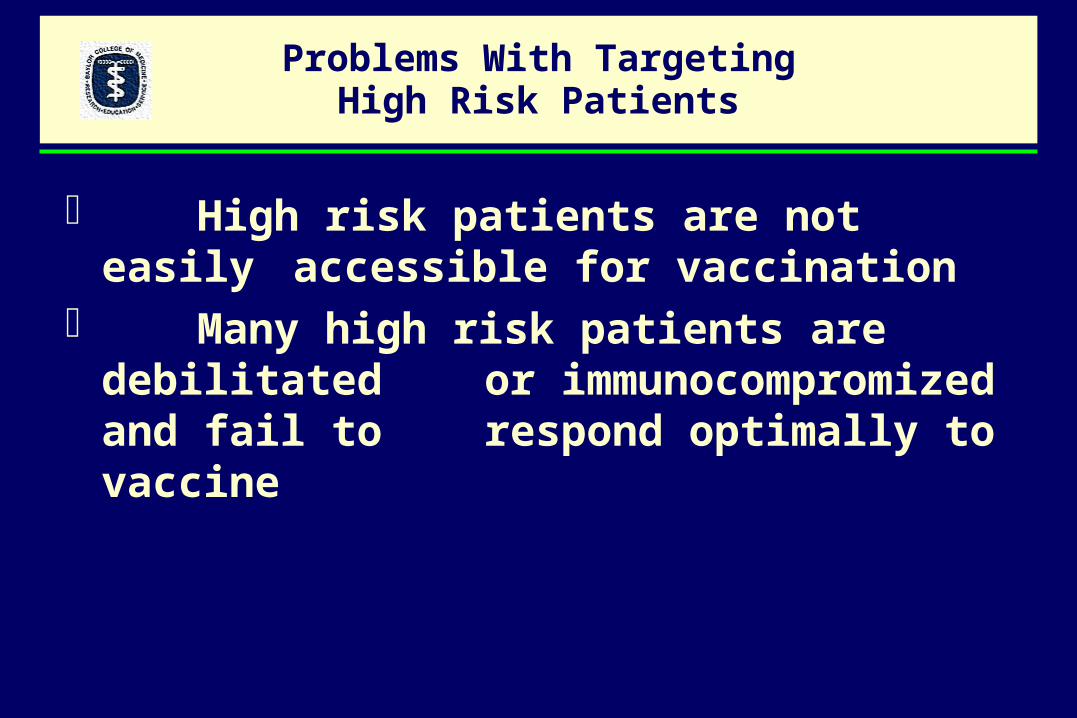
Problems With TargetingHigh Risk Patients
High risk patients are not easily accessible for vaccination
Many high risk patients are debilitated or immunocompromized and fail to
respond optimally to vaccine
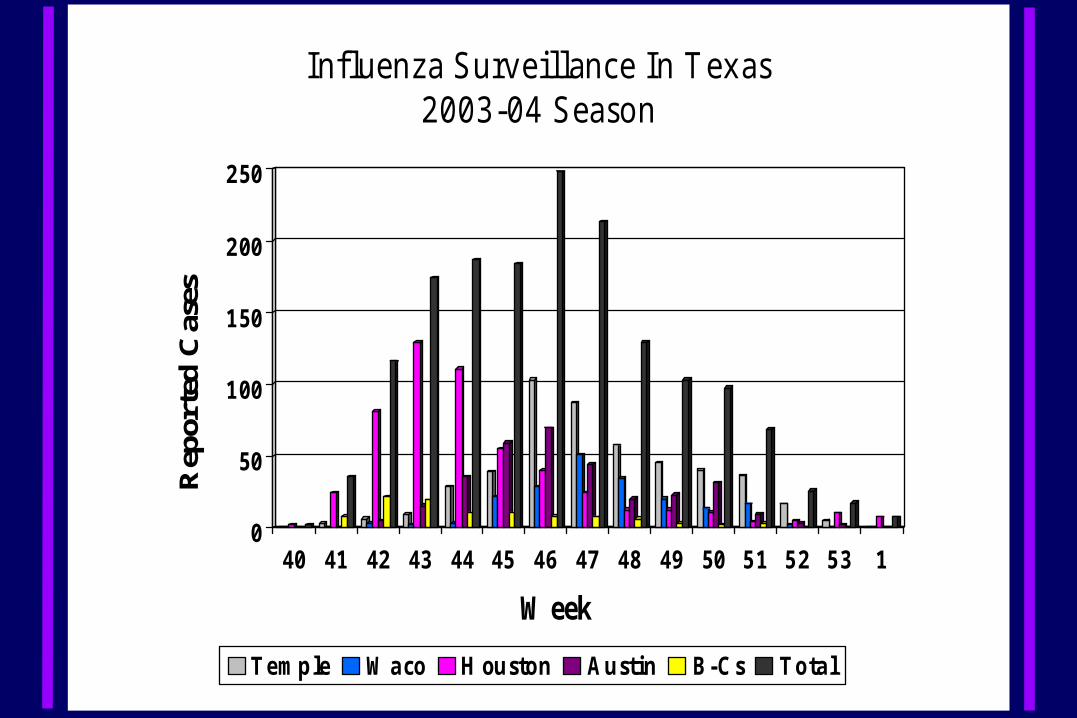
In flu en za S u rv e illan ce In T ex as2 0 0 3 -0 4 S easo n
0
50
1 00
1 50
2 00
2 50R
epor
ted
Cas
es
40 41 42 43 44 45 46 47 48 49 50 5 1 5 2 5 3 1
W eek
Te m p le W a co H ou sto n A u stin B-C s To ta l
Update: Influenza Activity, US. January 18--24, 2004 - Centers for Disease Control and Prevention. www.cdc.gov/flu. MMRW January 30, 2004 / 53(03);63-65
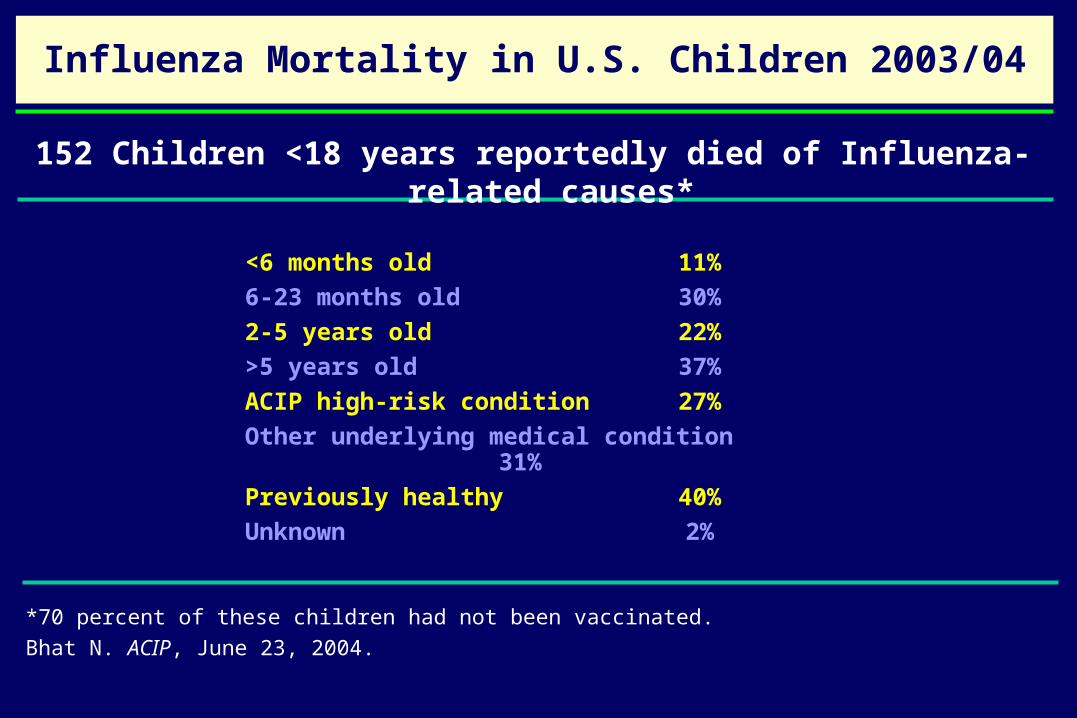
<6 months old 11%
6-23 months old 30%
2-5 years old 22%
>5 years old 37%
ACIP high-risk condition 27%
Other underlying medical condition 31%
Previously healthy 40%
Unknown 2%
Influenza Mortality in U.S. Children 2003/04
152 Children <18 years reportedly died of Influenza-related causes*
*70 percent of these children had not been vaccinated.
Bhat N. ACIP, June 23, 2004.

Influenza Virus Infection and Illness Rates Houston Family Study, 1976-1984
0
10
20
30
40
50Infection
ARI
LRI
<2 2-5 6-10 11-17 18-24 25-34 35Age (years)
Rat
e P
er 1
00 P
erso
ns


Excess illness episodes 28*
Secondary illness episodes (family members) 22*
Days of work missed by parents 20*
Average school days missed/child 2.25*
Impact of Influenza on School Children and Their Families
Influenza-associated outcomes Rate/100*
*Prospective cohort study of 313 children (K-8) in 216 families followed during 1 influenza season.
Neuzil KM, et al. Arch Pediatr Adolesc Med., 2002;156:986-991.
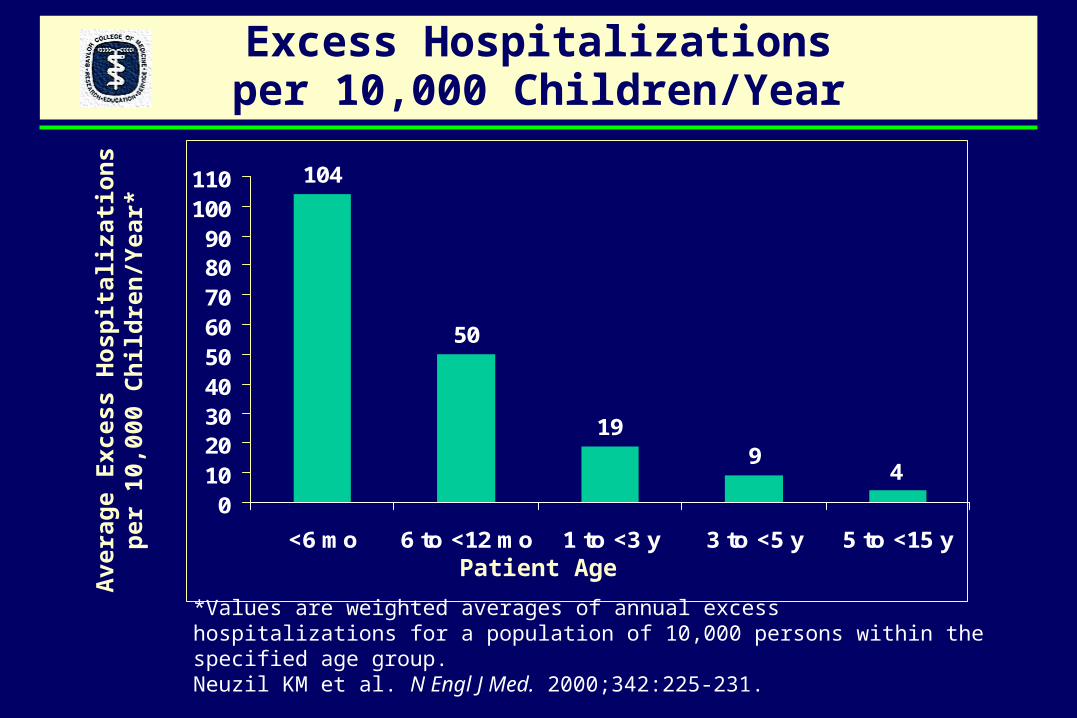
Excess Hospitalizationsper 10,000 Children/Year
104
50
199
4
0102030405060708090
100110
<6 mo 6 to <12 mo 1 to <3 y 3 to <5 y 5 to <15 y
Patient Age
Ave
rag
e E
xces
s H
osp
ital
izat
ion
s p
er 1
0,00
0 C
hil
dre
n/Y
ear*
*Values are weighted averages of annual excess hospitalizations for a population of 10,000 persons within the specified age group. Neuzil KM et al. N Engl J Med. 2000;342:225-231.

Respiratory Virus Infections Associated with Hospitalizations for Acute Respiratory
Conditions, Houston, 1991-1995
Influenza Viruses
Parainfluenza Viruses
<5 5-17 18-44 45-64 65 Age (years)
30
20
10
0
30
20
10
0
30
20
10
0
Nu
mb
er P
osi
tive
per
100
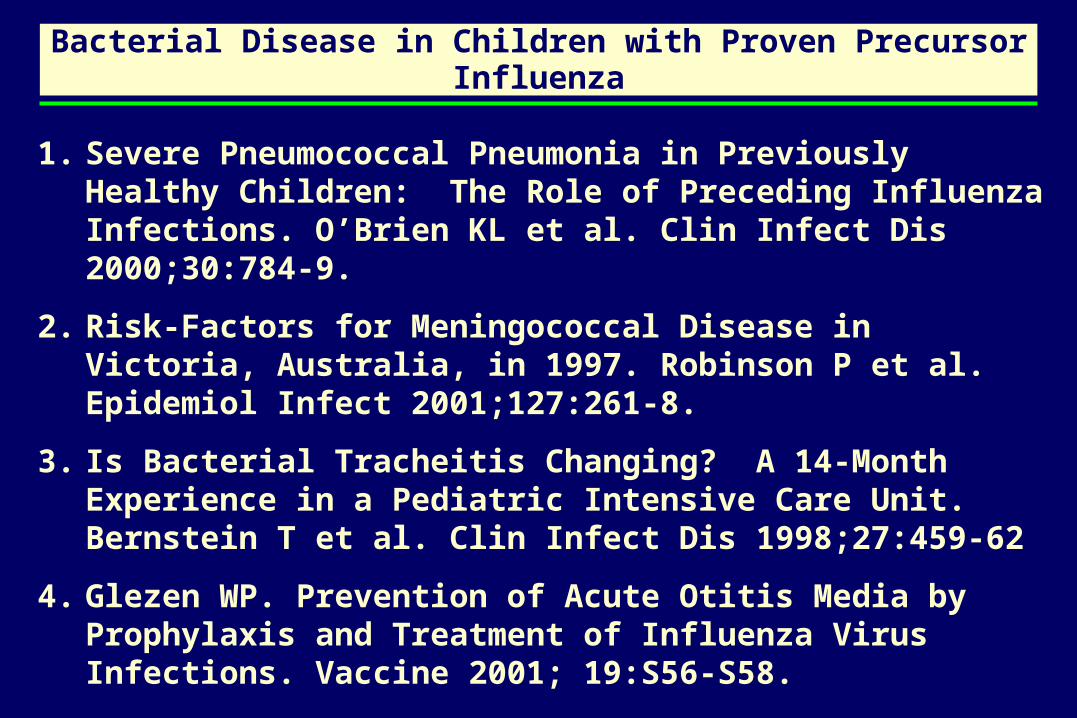
Bacterial Disease in Children with Proven Precursor Influenza
1. Severe Pneumococcal Pneumonia in Previously Healthy Children: The Role of Preceding Influenza Infections. O’Brien KL et al. Clin Infect Dis 2000;30:784-9.
2. Risk-Factors for Meningococcal Disease in Victoria, Australia, in 1997. Robinson P et al. Epidemiol Infect 2001;127:261-8.
3. Is Bacterial Tracheitis Changing? A 14-Month Experience in a Pediatric Intensive Care Unit. Bernstein T et al. Clin Infect Dis 1998;27:459-62
4. Glezen WP. Prevention of Acute Otitis Media by Prophylaxis and Treatment of Influenza Virus Infections. Vaccine 2001; 19:S56-S58.
Other Complications of Influenza
• Acute myositis
• Neurologic– Reye’s syndrome– Encephalopathy– Febrile convulsions
• Cardiac– Pericarditis– Myocarditis
Rationale forAlternative Approaches
School children and working adults are the major spreaders of influenza in the community and introducers into the
household
School children have the highest annual attack rate for influenza
Rationale forAlternative Approaches
Immunization of school children and working adults to:
decrease absenteeism for school and work
decrease visits for medical care decrease antibiotic prescriptions
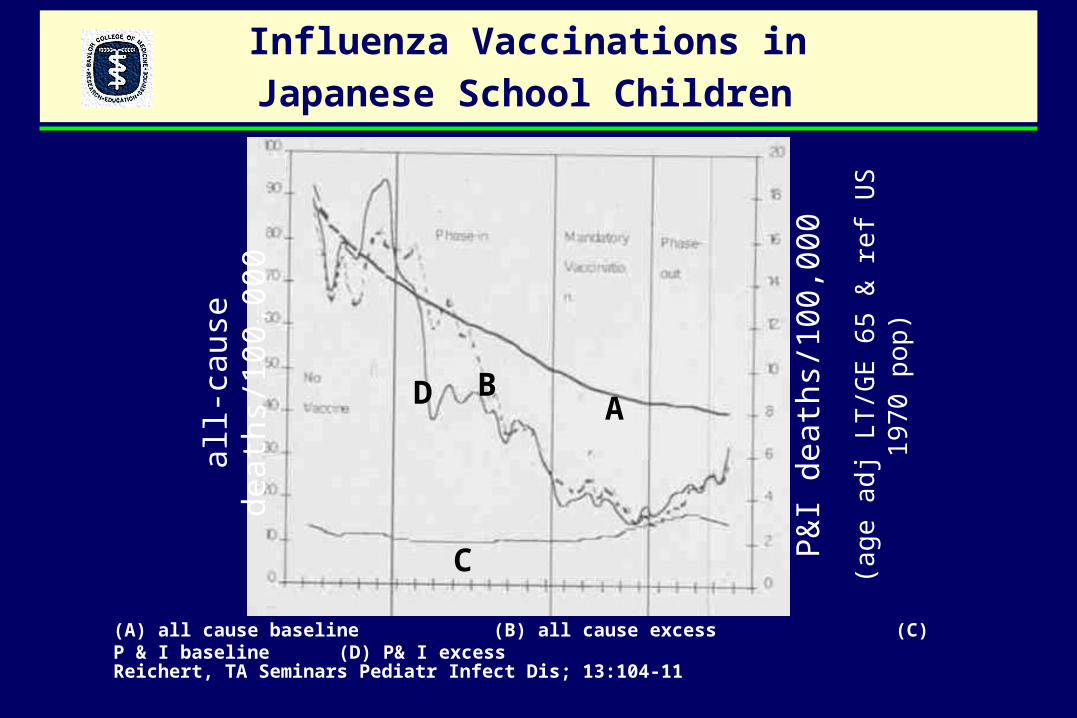
Influenza Vaccinations in
Japanese School Children
all-
caus
e de
aths
/100
,000
P&
I de
aths
/100
,000
(age
adj
LT
/GE
65
& r
ef U
S 1
970
pop)
(A) all cause baseline (B) all cause excess (C) P & I baseline (D) P& I excess
AB
C
D
Reichert, TA Seminars Pediatr Infect Dis; 13:104-11
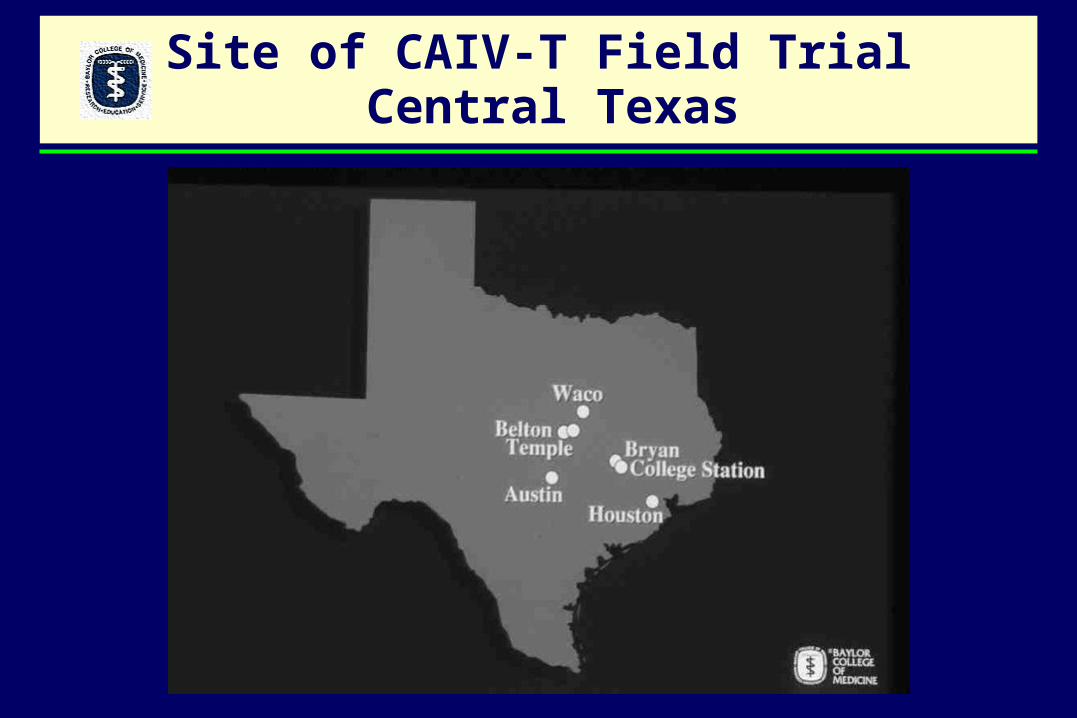
Site of CAIV-T Field Trial Central Texas

Non-randomized, Open Label Field Trial of Trivalent ColdAdapted Influenza Vaccine (CAIV-T) in Central Texas, 1998-2001
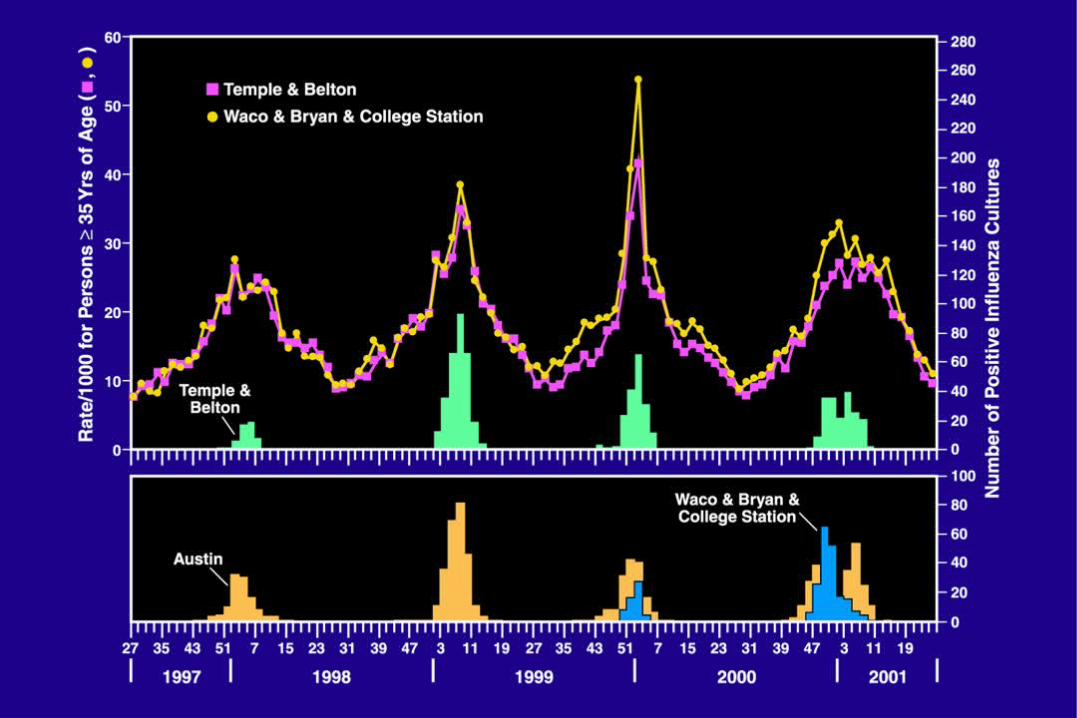
Indirect Effectiveness (Herd Immunity) – Age-specific rates of medically-attended acute respiratory illness (MAARI) for the intervention site compared to those for the comparison sites.
Direct Effectiveness and Adjusted Efficacy – MAARI rates in CAIV-T recipients compared to rates in 9,325 age-eligible non-recipients at the intervention site and adjusted for culture-positive MAARI.
Total Effectiveness – MAARI rates in CAIV-T recipients compared to rates in 16,264 age-eligible non-recipients in the comparison sites.
Safety: a) Occurrence of serious adverse events (SAEs) for 42 days after vaccination b) Occurrence of rare events associated with natural influenza virus infectionc) Comparison of MAARI rates 0-14 days after vaccination to the pre-vaccination.
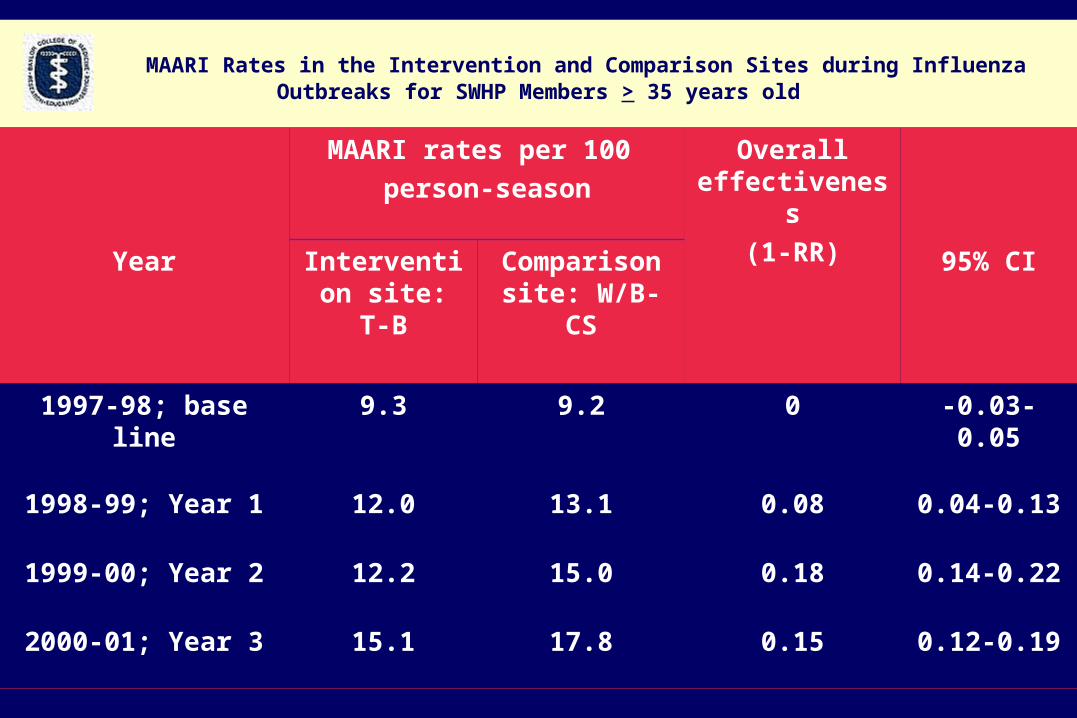
MAARI Rates in the Intervention and Comparison Sites during Influenza Outbreaks for SWHP Members > 35 years old
MAARI rates per 100
person-season
Overall effectiveness
(1-RR)Year Intervention
site: T-BComparison site: W/B-CS
95% CI
1997-98; base line 9.3 9.2 0 -0.03-0.05
1998-99; Year 1 12.0 13.1 0.08 0.04-0.13
1999-00; Year 2 12.2 15.0 0.18 0.14-0.22
2000-01; Year 3 15.1 17.8 0.15 0.12-0.19

CAIV-T Direct Effectiveness for all MAARI and Adjusted Efficacy for Culture-Positive MAARI with both Influenza A(H1N1) and B,
Temple-Belton, TX, 2000-01
Age Direct (95% CI) Adjusted (95% CI)
(years) Effectiveness Efficacy
1.5-4 0.20* (0.14,0.25) 0.91 (-0.34,0.99)
5-9 0.25 (0.15,0.34) 0.80 (0.26,0.95)
10-18 0.14 (0.01, 0.26) 0.70 (0.13,0.90)
Total 0.18 (0.11,0.24) 0.79 (0.51,0.91)
Subsets Influenza A(H1N1) 0.92 (0.42,0.99)
Influenza B 0.66 (0.09,0.87)
*statistically significant in bold numbers

Safety Summary
• Years 1, 2, 3 and 4: 18,780 doses of CAIV-T have been administered to 11,096 children in this community-based, open-label trial
• No CAIV-T vaccine attributable serious adverse event has been observed
• No CAIV-T vaccine attributable rare or unusual adverse event has been observed
• Six pregnancies originating proximal to receipt of vaccine were uncomplicated (healthy full-term infants).
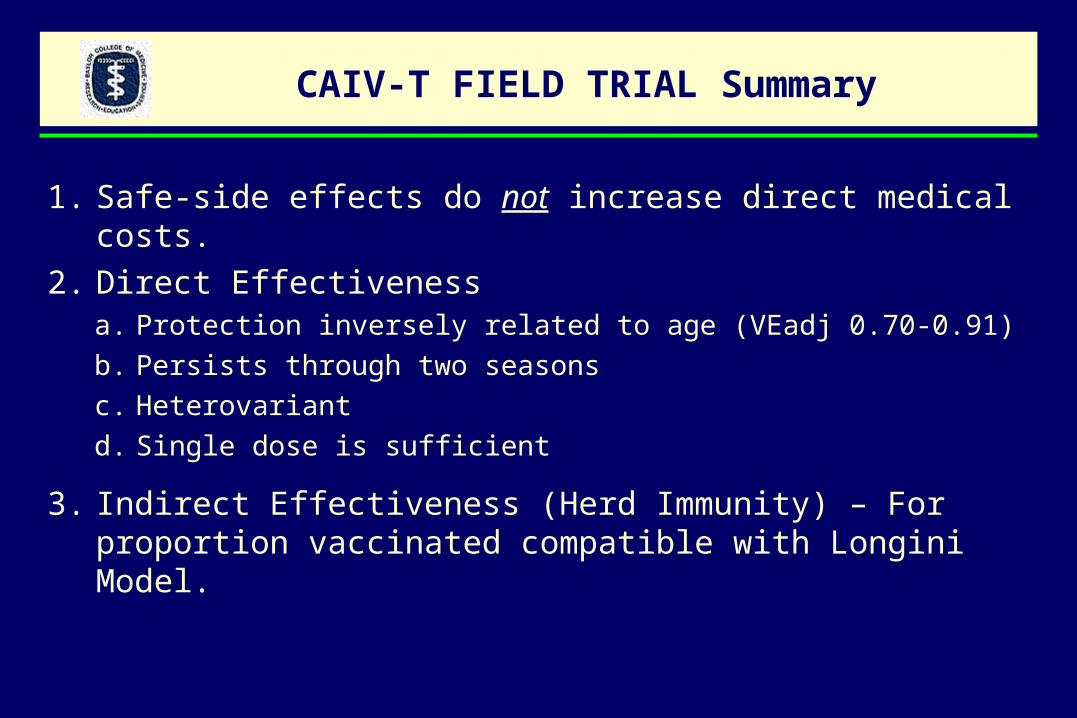
CAIV-T FIELD TRIAL Summary
1. Safe-side effects do not increase direct medical costs.
2. Direct Effectivenessa. Protection inversely related to age (VEadj 0.70-0.91)
b. Persists through two seasons
c. Heterovariant
d. Single dose is sufficient
3. Indirect Effectiveness (Herd Immunity) – For proportion vaccinated compatible with Longini Model.
Implications for Control of Both Interpandemic and Pandemic Influenza
School children have the highest attack rates for influenza.
School children are the principle spreaders of influenza.
School children are accessible for rapid distribution of influenza vaccine.

Acknowledgements
W. Paul Glezen – Control of Epidemic Influenza Grant
Co-Investigators: Pedro A. Piedra – PI, Baylor College of Medicine
Mangusha Gaglani – PI, Scott & White Clinics
Gayla Herschler – Coordinator, S & W
Mark Riggs – Biostatistics, S & W
Claudia Kozinetz – Analysis and Data Management, BCM
Consultants: Ira Longini – Emory University
Elizabeth Halloran – Emory University
Vaccine: Paul Mendelman, MedImmune Vaccines
Colin Hessel, Biostatistics, Safety Analysis, MedImmune
Program Officer: Linda Lambert - NIAID