Embed Size (px)
Citation preview

Challenges for Navy OfficerPersonnel Management
Ann D. Parcell • Jonathon D. Mintzwith
David L. Reese
DAB-2014-U-007152-Final
April 2014

CNA’s annotated briefings are either condensed presentations of the results of formal CNA studies that have been further documented elsewhere or stand-alone presentations of research reviewed and endorsed by CNA. These briefings repre-sent the best opinion of CNA at the time of issue. They do not necessarily represent the opinion of the Department of the Navy.
Distribution unlimited. Specific authority: N00014-11-D-0323.Copies of this document can be obtained through the Defense Technical Information Center at www.dtic.milor contact CNA Document Control and Distribution Section at 703-824-2123.
Copyright 2014 CNAThis work was created in the performance of Federal Government Contract Number N00014-11-D-0323. Any copyright in this work is subject to the Government's Unlimited Rights license as defined in DFARS 252.227-7013 and/or DFARS 252.227-7014. The reproduction of this work for commercial purposes is strictly prohibited. Nongovernmental users may copy and distribute this document in any medium, either commercially or noncommercially, provided that this copyright notice is reproduced in all copies. Nongovernmental users may not use technical measures to obstruct or control the read-ing or further copying of the copies they make or distribute. Nongovernmental users may not accept compensation of any manner in exchange for copies. All other rights reserved.
Approved for distribution: April 2014
David Rodney, DirectorFleet and Operational Manpower TeamResource Analysis Division

1
For some time now, there has been a call to increase forward presence by carrier strike groups. Last year, USFF explored alternative ways to increase forward presence, including changing the FRP cycle to include two 7-month deployments in a 36-month cycle instead of one 7-month deployment in a 32-month cycle. The proposed FRP cycle was called enhanced CSG (E-CSG).
The Navy must maintain an acceptable level of readiness as it achieves more forward presence. There has been concern that, although ships achieve an acceptable level of readiness by the end of the training phase of the FRP cycle, the level of readiness may decrease during the deployment phase because of the rotation of crew members. This problem will be exacerbated if deployment time is increased without mitigating the effect of rotating crew members.
To counter the potential decrease in readiness during deployment, USFF proposed “locking down” the crews of the combatants that make up the CSG through the whole FRP cycle. It was proposed that an entirely new crew of officers would be assigned to each platform in the CSG at the beginning of the FRP cycle (the maintenance phase). The officers would be kept in those positions (i.e., locked down) until the end of the cycle.

2
This study was originally intended to examine the impact of E-CSG and the proposed officer crew lockdowns on officer careers and community management. Specifically, the sponsor was interested in the effect of the “double-pump” deployments (i.e., two 7-month deployments in a 36-month FRP cycle) on the retention of conventional surface warfare officers (SWOs) and aviators. There was also interest in the effect of crew lockdowns on tour lengths and command opportunities, particularly for the aviation community, and interest in identifying which crew positions should be locked down if it were infeasible to lock down the entire officer crew.
This study was sponsored by BUPERS-3, Director, Military Community Management. Because this study focuses on officers only, it was largely shaped by BUPERS-31, Head, Officer Community Management. In addition, N131, Head, Officer Plans and Policies, was also involved in shaping the study.
During the early part of this study, the Navy determined that SWOs with the nuclear subspecialty would not be part of any crew lockdown plan. All of the analysis in this study excludes these officers.

3
This is the original tasking for the study. In task 1, we were asked to estimate the effect of double-pump CSG deployments on conventional SWO and aviator retention. Double-pump deployments occur when CSGs are deployed twice in an FRP cycle with little advance notice of the second deployment. We examined the retention of officers who experienced a double-pump CSG deployment from 2009 to 2012 and compared it with the retention of officers who experienced a regular CSG deployment in the same time period.
The intent of task 2 was to examine how officers moved from assignment to assignment over a career. Effectively, in task 2, we were asked to create a simple model of officer career flow in order to address task 3. Because it directly supported task 3─an aviator-specific task─we were asked to focus on aviator careers in task 2.
The third task was motivated by the concern that, if all officers in a CSG were locked down for the entire 36-month FRP cycle, both executive officer (XO) and commanding officer (CO) tours would double in length from their current 18-month durations. Doubling the length of these tours would halve the number of officers who could experience an XO and a CO tour, thus substantially reducing command opportunity. The aviation community was especially concerned about the effect of decreased command opportunity on retention.
Task 4 requested that we address the possibility that it may not be feasible to lock down the entire officer crew. We were asked to consider if a limited number of officers could be locked down for the entire FRP cycle or if a crew could be locked down for only part of the FRP cycle.

4
After several months of intensive study by stakeholders in 2013, it was determined that two 7-month deployments in a 36-month FRP cycle was not the most efficient way to increase forward presence. One 8-month deployment in a 36-month FRP cycle, along with a substantial sustainment period, has been proposed instead.
In addition, a total officer crew lockdown was not considered feasible. The adverse effect on officer career progression and management was considered too great. Instead, the Navy is now exploring the possibility of a partial lockdown, in which certain key positions may be locked down for the whole FRP cycle. (Note that it has not yet been determined which positions should be locked down.) The Navy is also exploring the possibility that the whole officer crew may be locked down through the training and deployment part of the FRP cycle (approximately 20 months) instead of all 36 months of the cycle. It may also be possible to combine these two types of lockdowns, whereby certain positions would be locked down for a portion of the cycle.
In light of the shift in focus for the study, we considered some broader questions about the relationship between officer crew tenure, individual officer experience, and readiness. These relationships are key to understanding how readiness may be affected throughout the FRP cycle by crew rotation practices.

5
We had completed most of the double-pump retention analysis when the change in the study direction occurred. We kept this original first task so that the sponsor could understand the relationship of retention and exposure to double-pump CSG deployments for conventional SWOs and aviators.
In the new task 2─the focal point of the analysis of crew lockdowns─we focus less on precisely which positions should be locked down and more on understanding the benefits and costs of locking down the officer crew for part of the FRP cycle. We also examine the relationship between average crew tenure and performance.
In the new task 3, we summarize the relationship between cumulative officer experience (i.e., for individual officers, not crew tenure) and readiness that has been found in previous analyses. We also examine how cumulative sea duty and cumulative time deployed has changed over time for conventional SWOs and aviators.
We provide some conclusions from our analysis and recommendations for the way forward.

6
Some have speculated that more time at sea and/or unannounced double-pumps may decrease morale and, thus, retention. A CNA study compared the first-term reenlistment rates of enlisted sailors who experienced both deployments in a double-pump CSG with those of sailors who experienced a single deployment in the same period [1]. Holding constant other factors, the results showed lower first-term reenlistment rates for sailors who experienced both deployments in a double-pump. The difference was especially pronounced for sailors with long initial contracts.
To examine the relationship between experiencing a double-pump deployment and officer retention, we use the personnel records for conventional SWOs and aviators who deployed with a CSG between 2009 and mid-2012. We compare the loss behavior of those who had single-deployment CSGs with those who had exposure to any part of a double-pump CSG.
For analytical purposes, the 2009–2012 timeframe is fixed because it is the only time in recent history when double-pump deployments have occurred. Also, most conventional SWOs in a CSG are not assigned to the carrier, which is the only platform in a CSG that must complete both deployments of a double-pump. As a result, very few junior SWOs actually experienced both deployments of a double-pump CSG. The small sample sizes prohibit us from comparing the loss behavior of SWOs who experienced both deployments vice those who experienced just one deployment of the double-pump. Instead, we examine whether any exposure to a double-pump may have a negative effect on junior officer retention. The idea is that, even if SWOs are not personally exposed to both deployments, double-pumps may affect their loss behavior if overall crew morale is negatively affected.
We make a similar comparison for aviators, though, unlike SWOs, most aviators are assigned to the carrier, so those who were exposed to a double-pump CSG were much more likely to have experienced both deployments.

7
The CSGs shown above experienced two deployments in an FRP cycle (i.e., they were double-pumped) from 2009 to 2012. They are listed by the carrier name in chronological order of the first deployment. Most of the double-pump deployments for each of the five CSGs occurred within about 6 to 8 months of each other. It is our understanding that there was little lead time in announcing the second deployment, so CSG personnel would not have expected it.

8
These are the surface escort ships that deployed with the carriers to make up the CSGs. Of the 28 DDGs associated with these CSGs, only one did both deployments of a double-pump. Another four DDGs deployed twice in the period with different CSGs. Of the nine CGs associated with these CSGs, four did both deployments of a double-pump. In total, only five escort ships took part in both deployments of a double-pump; they are listed in the “Both” column. Four other escort ships (all DDGs) were exposed to two double-pump deployments, but not with the same CSG. They are indicated in the two single-deployment lists.
Although the carriers in the CSGs completed both deployments of a double-pump, few of the surface escort ships did. Since conventional SWOs are concentrated on the escort ships and not on the carrier, few conventional SWOs actually experienced both deployments.

9
The DDGs were the least likely to have completed both deployments in a double-pump CSG. Of the 28 DDGs involved, five had two deployments with CSGs in the period (17 percent). Only one of those five DDGs took part in both deployments of the same CSG. Four of nine CGs had two deployments with CSGs in the period (44 percent). All four of those CGs took part in both deployments of the same CSG.

10
In order to observe officer loss behavior after the deployments, we include only the CSG double-pumps that concluded by mid-2012. We then observe loss behavior from the end of the double-pump until the end of calendar year (CY) 2012. This means that we observe the loss behavior of some officers who were on the second deployments of the Abraham Lincoln and Carl Vinson CSGs for only about half a year, whereas we observe the behavior of officers from the Eisenhower CSG for several years.
We also observe the loss rates of conventional SWOs and aviators associated with any of the CSGs that had a single deployment between 2009 and mid-2012. These include the Nimitz, Harry S. Truman, George H. W. Bush, Ronald Reagan, Theodore Roosevelt, and John C. Stennis CSGs. (The Stennis CSG had a single deployment in early 2009 and a double-pump deployment in 2011 through 2012).
We limit our SWO sample to those in year groups (YGs) 2004 through 2007 because they reached their minimum service requirements (MSRs) during or soon after the CSG deployments. We found only four conventional SWOs from these YGs who had completed both deployments of the double-pump CSGs. Thus, we included any SWO or aviator who took part in either deployment of a double-pump in the sample of those exposed to a double-pump.
To observe loss behavior after MSR for aviators, we limit our sample to those in YGs 1998 through 2002. Many more aviators experienced both deployments of the double-pump because many were assigned to the carrier.

11
These are the results from the comparison of loss rates for conventional SWOs in YGs 2004 through 2007 who were deployed with CSGs sometime from January 2009 to mid-2012. The loss rate through the end of 2012 for SWOs who were assigned to CSGs that were double-pumped was 36 percent, while the loss rate of SWOs who were assigned to CSGs that were not double-pumped was 30 percent. Although these rates are different, the difference is not statistically significant.
Note that our calculations are simple cross-tabulations. We have not controlled for other factors that could affect retention, such as marital status, accession source, and college major. Our small sample sizes make this difficult to do. Likewise, some of these SWO community losses are officers who were slated to move to another community. (Note, however, that we have no reason to believe that the characteristics of officers exposed to double-pump CSGs differed from those who were assigned to single-deployment CSGs.)
Note also that these loss rates are lower than the loss rates that are usually reported for junior SWOs. Often, the reported loss rates for junior SWOs span years of commissioned service (YCS) 3 through 8—a long observation period. Our calculations include multiple year groups whose loss behavior we observe for different lengths of time, although none as long as five years. For some YGs, we observe post-MSR loss behavior for several years after the CSG deployment (e.g., YGs 2004 and 2005); for others, we observe only months of this loss behavior (e.g., YG 2007). Again, sample sizes are the cause. If we didn’t combine YGs, our samples would be too small to analyze.

12
We find similar results for aviators. There was no statistically significant difference in the loss rates of aviators in YGs 1998 through 2002 who deployed with a double-pump CSG between January 2009 and mid-2012 and those on all other deployments during the same time. (As in the SWO analysis, these loss rates are unadjusted for other officer characteristics.)
This was also true when we looked only at the jet aviators (the only platform that has enough observations to make the comparison); the difference in loss rates for those assigned to double-pump CSGs vice those assigned to other CSGs was not statistically significant.
The completion of the minimum service requirement is difficult for us to observe for individual aviators, and it can range from approximately YCS 7 to YCS 12. To ensure that we included aviators who reached their MSR in our sample timeframe, we did the same calculations for aviators in YGs 2000 through 2004 and found the same result. There was no statistically significant difference in the loss rates of aviators on double-pump CSG deployments vice those on other deployments during the same time period.

13
Our results suggest that junior officers who were exposed to double-pump CSGs had similar community retention as the other officers who were assigned to single-deployment CSGs during the same time period. This was true for both conventional SWOs and aviators.
Although it does not appear that exposure to a double-pump CSG had a negative effect on conventional SWOs and aviator loss rates, we urge caution in making broad conclusions about the effect of double-pump deployments on officer loss behavior, particularly for conventional SWOs. First, only four conventional SWOs from YGs 2004 through 2007 completed both deployments in the double-pump CSGs, so we were not able to conclude anything about the effect of two deployments on loss rates. We can say with more confidence that it does not appear that association with a double-pump CSG (i.e., having served on one of the deployments) affected loss rates. Second, we did not control for other differences in officers that could affect loss rates, such as accession source, marital status, and college major.
About 40 percent of conventional SWO sea duty billets are found in CSGs, so, if double-pump deployments became widespread, this would affect a significant part of the community. The analysis should be revisited if the Navy uses double-pumps in the future.
It could be that officers are less sensitive to double-pumps and more sensitive to total time deployed. Depending on the quality of the data, more research could be done to examine the relationship of retention and personnel tempo, which is the count of deployment days away from homeport, duty station, or unit for each officer.

14
A goal of training in the FRP cycle is to achieve a certain level of readiness—typically a minimum of C-2. The challenge is to maintain C-2 readiness (or higher) throughout the deployment that follows the training period. This is true no matter what FRP construct is in place (i.e., two 7-month deployments or one 8-month deployment).
One concern is that CSGs may achieve acceptable levels of readiness by the end of the training phase of the FRP cycle. Because crew members rotate, however, CSGs may not maintain (and may even decrease) their readiness during other phases of the FRP cycle, specifically during deployment.
To avoid this readiness loss, it has been proposed to lock down CSG crews over the training and deployment phases of the FRP cycle. That is, crew members would be allowed to rotate only at very low rates (or not at all) from the beginning of the training phase to the end of the deployment phase. This has the potential of maintaining or even increasing readiness during the periods of the cycle when it is most critical.
The first step is to understand how average officer crew tenure changes with different rotational assumptions. Then, we examine the relationship between average crew tenure and readiness. To date, this relationship has not been well established empirically.
Finally, we examine the potential costs of locking down officer crews. These include challenges of synchronizing the schedules of all the ships in the CSG, potential incompatibility with the demands of officer career paths, the fixed promotion windows, current sea-shore rotation plans, and other constraints in the distribution system.

15
As of November 2013, the Navy had proposed two variations for an Optimized Fleet Response Plan (O-FRP). In each, the first 6 months of the cycle is the maintenance phase. The next 12 months consist of (in varying order) basic training, integrated training, and a predeployment sustainment period that includes Preparation for Overseas Movement (POM). The deployment phase occurs over the next 8 months. The final 10 months of the cycle have not yet been fully specified; however, conceptually, it is a postdeployment sustainment phase with an unspecified goal for readiness level.

16
Average officer crew tenure changes over the FRP cycle depending on monthly crew turnover rates. We show how average crew tenure changes over the FRP cycle with and without a lockdown.
In the no-lockdown model, we assume that the crew would rotate at a constant rate of 3 percent per month, which roughly corresponds to full crew turnover in 36 months. Using this rotational assumption, we calculate average crew tenure for each month of the FRP cycle.
In a lockdown model, we assume that the crew would minimally rotate (i.e., rotations only for emergencies or poor behavior) from month 7 through month 26 of the cycle—or 20 months of lockdown from the beginning of basic training through the end of the deployment. In the final 10 months of the cycle, we assume that the crew rotates at 3 percent per month. During the maintenance phase, we assume that the crew rotates at 11 percent per month to make up for the lockdown period. Using these rotational assumptions, we calculate average crew tenure for each month of the FRP cycle again.
The next slide shows the comparison of average crew tenure over time for the no-lockdown and the lockdown models.

17
In the no-lockdown model, during which the officer crew rotates at a constant rate of 3 percent per month, the officer average crew tenure peaks at about 15 months in the middle of the first FRP cycle. Average crew tenure then begins to trend toward its steady-state level of 9.4 months. It takes about 8 years, or almost three FRP cycles, to reach the steady-state average crew tenure.
In the lockdown model, the crew reaches a peak average crew tenure of 18 months at the end of the first lockdown period. It then settles into an average crew tenure pattern of peaking at about 12.5 months at the end of the deployment phase (the result of almost no rotation during the previous 20 months) and reaching a low of about 7.6 months at the end of the maintenance phase (the result of very high rotation during the maintenance phase) in each cycle.
The graph illustrates that, in the lockdown model, the Navy trades a higher average crew tenure during training and deployment for a lower average crew tenure during the maintenance phase. Specifically, using our assumptions about tour length and lockdown vs. no-lockdown rotational patterns, the lockdown model yields a 33-percent-higher average officer crew tenure at the end of the deployment phase (12.5 months vs. 9.4 months) and almost a 25-percent-lower average crew tenure at the end of the maintenance phase (7.6 months vs. 9.4 months) in the steady state.
18
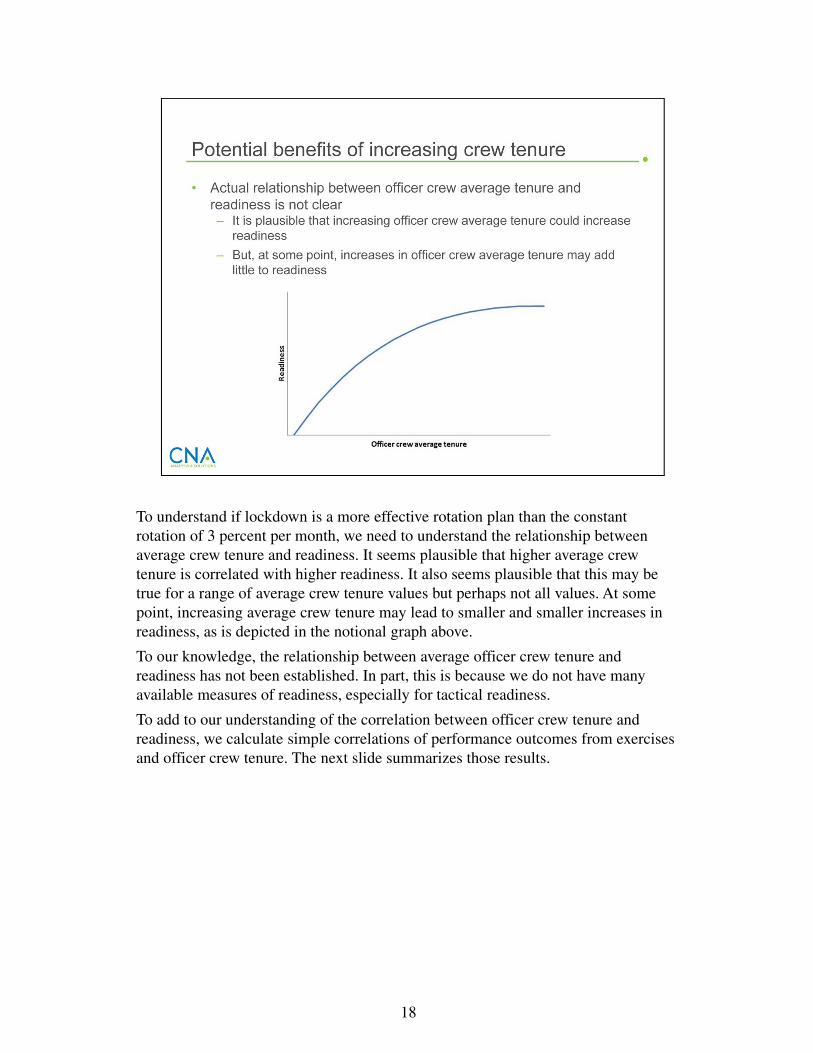
To understand if lockdown is a more effective rotation plan than the constant rotation of 3 percent per month, we need to understand the relationship between average crew tenure and readiness. It seems plausible that higher average crew tenure is correlated with higher readiness. It also seems plausible that this may be true for a range of average crew tenure values but perhaps not all values. At some point, increasing average crew tenure may lead to smaller and smaller increases in readiness, as is depicted in the notional graph above.
To our knowledge, the relationship between average officer crew tenure and readiness has not been established. In part, this is because we do not have many available measures of readiness, especially for tactical readiness.
To add to our understanding of the correlation between officer crew tenure and readiness, we calculate simple correlations of performance outcomes from exercises and officer crew tenure. The next slide summarizes those results.

19
We have data on four performance outcomes from 11 CSG training events. Because of secret classification, we cannot give more detail on these performance measures here, but they can be found in [2] and [3]. We also have data on median number of days that the conventional SWOs were in the CSG crew (combined across the surface platforms in the CSG) by each of the 11 training event dates. We calculated a correlation coefficient for median crew tenure and each of the four performance metrics. We find that none of the four correlation coefficients are statistically different from zero at the 5-percent confidence level, and only one is statistically different from zero at the 10-percent level. This correlation was positive—indicating that, the higher the median crew tenure, the higher the performance score. Given the low confidence level, however, we believe this outcome suggests further research rather than a clear-cut indication of a crew tenure-performance correlation.
Performance could be correlated with the percentage of officers who are new to the crew. To test this, we also calculated a correlation coefficient for each training performance metric and the percentage of officers who had rotated into the crew in the 90 days before the event. We find that none of these four correlation coefficients are statistically different from zero at the 5-percent confidence level, and only one is statistically different from zero at the 10-percent confidence level. (Note that this was not the same performance metric that was correlated with median crew tenure at the 10-percent confidence level.) This correlation was positive—indicating that, the higher the percentage of new officer crew members, the higher the performance score. This is counter to our hypothesis.
We find almost no statistical significance in the correlations between crew characteristics and performance. This is likely due in part to our very small sample of 11 observations.

20
There are other potential benefits to locking down CSG officer crews. For example, consider what happens when a key officer on a surface combatant in a CSG rotates. The ship (and CSG) leadership must establish a working relationship with the newly assigned officer. Although the Navy has a long history of accommodating rotating crew members, it does impose a cost on leadership to have to learn the strengths of their new subordinates and incorporate that information into their leadership plan. This is especially critical if the rotation takes place during deployment. Crew lockdowns would minimize the costs to leadership of rotation even if there is no apparent effect on readiness and performance.
Although we do not have data from surveys or focus groups to support this idea, it has been suggested by some subject matter experts (SMEs).

21
Even if increasing average officer crew tenure may bring benefits to CSG operations, there are costs to locking down the crews. This is true even when only part of the officer crew is locked down over part of the FRP cycle.
First, there are a number of community management issues to consider. For example, how can officers be detailed to ships in a CSG at just the right point to accommodate both the lockdown and the critical junctures in the officer career path, which are dictated in part by fixed promotion points and other career milestone events?
Second, locking down the crew may keep the Navy from assigning officers across platforms as it does now. The current plan is to assign SWOs to two 18-month divisional officer tours usually on different ships (and usually different ship types) and to two 18-month department head tours usually each on a different ship. This allows SWOs to be developed as generalists across a number of different platforms. It is not clear if instituting a lockdown, which would constrain rotational patterns for the platforms in CSGs, would disrupt the development of junior SWOs across multiple platforms.

22
A policy to lock down officer crews (or portions of the officer crews) will only be effective if the platforms assigned to the CSG remain part of the CSG for at least the duration of the training and deployment phases of the FRP cycle. Thus, the first change necessary for lockdown effectiveness is to align the CSG ship schedules. Assuming that the ship schedules can be synchronized to keep the same platforms together for the training and deployment phases, the next step is to assign conventional SWOs to the CSG platforms such that they can be locked down for the 20-month period.
Enforcing a lockdown period significantly lowers the time available to detail to the surface platforms in the CSG. Across the FRP, the lockdown period (20 months) amounts to 55 percent of the 36-month cycle for a single CSG. It would be a substantial constraint in the SWO assignment process to have the surface platforms associated with all (or most) CSGs available for assignment only half the time.
This constraint may be especially problematic for officers who have screened for department head (DH). From a career progression perspective, it is beneficial for officers to begin their back-to-back DH tours between YCS 7 and 8 so that their performance as a DH can be evaluated before they are required to go before the O-4 promotion board. Any margin of error in ship scheduling that resulted in a delayed DH assignment could potentially move a SWO’s DH tour to a less advantageous time with regard to promotion. Similarly, changes in CSG platform schedules that alter the start of the lockdown period may lengthen the waiting time for a sea assignment.

23
Locking down officer crews may also result in less ability to assign SWOs across platforms. This may be contrary to another SWO community goal, which is to have broad experience across a number of different platforms, especially early in the career. Under a lockdown scenario, SWOs may have to be assigned to fewer platforms for longer periods during their DIVO and DH tours to accommodate the current sea/shore rotation plan and any other constraints in the distribution system.
To understand how variation in platform assignments has evolved over time, we examined data on SWOs and the platforms to which they were assigned in their first four sea duty assignments. Because there are many potential assignments across platforms, we show as an example what happened to SWOs whose first sea assignment was on an amphibious ship. (The pattern of ship assignments for those starting on another platform is similar to that displayed in the next few slides.)

24
This slide shows how, over the past 20 years, the first sea assignment for conventional SWOs has shifted toward cruiser-destroyers (CRUDES) and frigates (FFGs). On average, about 70 percent of the SWOs in YGs 2006 through 2010 were first assigned to a CRUDES platform. This is an increase from about 55 percent for SWOs in YGs 1980 through 1985.
First assignments to carriers changed notably over time as well. About 10 percent of the SWOS from YGs 1980 through 1985 were first assigned to carriers, whereas no SWOs from recent cohorts were first assigned to carriers.
Although first assignments used to be spread more evenly across platforms, there is still variety in first-assignment platforms for recent SWO cohorts. Slightly more than half were first assigned to a CRUDES platform, while the remaining half were assigned to amphibious ships (amphibs), FFGs, and support and other ships (support/other).

25
We show the second sea duty assignment given that the first was an amphibious ship. Including loss from the Navy as a possible outcome, the chances of being assigned to another amphib ranged from about 15 percent for the SWOs in YGs 1980 through 1985 to just over 20 percent for the 2006–2009 cohorts. For the cohorts since the mid-1990s, the most likely second sea duty assignment was to a CRUDES or FFG platform. The next most likely was to a support/other ship or to another amphib.

26
For SWOs in cohorts 1980 through 2000 whose second sea assignment was to an amphib, the most likely third sea duty assignment was to a support/other ship. For more recent cohorts, the most likely third sea duty assignment was to a CRUDES or FFG platform. This is followed by assignment to a support/other ship and finally to another amphib.
For many SWOs, the third sea assignment is the first DH tour. These data show that over time there has been significant variation in assignments across platforms through the first half of SWO careers.

27
Finally, by the fourth sea tour (and likely the second DH tour), there is some convergence on platform assignment. In this case, SWOs are more likely to be assigned to a support/other ship or to another amphib given that their third assignment was to an amphib. Note, however, that the chances of being assigned to a CRUDES or FFG platform for the fourth assignment rose substantially for YGs 2001 and 2002.
It is not clear exactly how a crew lockdown would affect the ability of the SWO community to assign across platforms over time. Given that the lockdown adds another constraint in the distribution system and may favor assigning SWOs for longer periods of time to the same platform, assignment variation could be negatively affected.
(A set of these assignment slides with FFG assignments broken out separately from CRUDES assignments is available on request from the authors.)

28
If CSG officer crews were locked down for the training and deployment phases of the FRP, the maximum average crew tenure in the steady state is a third higher than the maximum obtained by the crew that was not locked down (the increase is from 9.4 to 12.5 months in the steady state). Likewise, the minimum average crew tenure in the steady state is about 25 percent lower in the lockdown scenario compared with the no-lockdown scenario (the decrease is from 9.4 to 7.6 months). If only a portion of the crew is locked down, the differences in maximum and minimum crew tenure under the two scenarios change proportionally with the percentage of the crew that is locked down.
Locking down crews for part of the FRP cycle increases average crew tenure through a critical part of the cycle, but it is not clear if increasing average crew tenure affects readiness or performance. To our knowledge, there are no studies that attempt to correlate average crew tenure and readiness. Using a very small sample, we found almost no correlation between certain CSG training outcomes and median crew tenure. Similarly, we found almost no correlation between these same training outcomes and the percentage of the officers who were new to the crew. Our sample sizes, however, were very small. More analysis should be done to understand the relationship between crew tenure characteristics and readiness.
To enjoy any potential benefits of a locked-down CSG officer crew, there will potentially be costs to officer career development and to community management. Assuming that CSG ship schedules can be synchronized, there will likely have to be changes made to detailing and to other facets of officer career management. Crew lockdowns also increase the possibility that SWOs will experience fewer platforms over their careers, which may be counter to the generalist development approach.

29
As with average officer crew tenure, individual officer tenure on the ship and/or overall experience level may matter for readiness. Past studies indicate modest evidence of this; we review those findings in the next slide. Then we examine data on how individual officer experience accumulation has changed over time.

30
One CNA study found a modest positive relationship between the time that the CO had spent on the ship and a better MCI score [4]. Another study found a small positive relationship between time that the CO had spent on the ship and fewer CASREPs [5]. The authors of [4] also showed a small positive relationship between the number of commands an XO had held and a better MCI score. In both of these studies, the authors controlled for other factors that could affect these readiness measures, such as months since last overhaul, fleet (Pacific or Atlantic), steaming hours, percentage of the enlisted crew new to the ship in the past quarter, and level of enlisted manning relative to requirements.
The effects of officer characteristics on readiness were small compared with the effects of certain enlisted crew characteristics. For example, the authors of [4] showed that the percentage of the enlisted requirements that were filled and the percentage of the enlisted crew that had rotated into the crew in the last quarter had substantially larger estimated effects on material readiness (positive and negative, respectively) than any of the officer attributes.
These results were based on MCI scores and CASREP filings from several classes of cruisers, destroyers, and frigates in the 1980s. Newer classes of ships have been introduced to the fleet, and they are manned differently today than they were in the1980s. It would be useful to revisit these estimates with more recent data.
Readiness is often measured on the material condition of ships because we have reasonably good data on it. Although maintaining/improving material readiness is important, it may not be the key reason for proposing a lockdown of officer billets. Tactical readiness/performance may be a bigger concern. Thus, in addition to updating older studies on the relationship of crew characteristics and the material readiness of ships, we also need to consider other measures of readiness that reflect tactical capability.

31
Individual officer cumulative experience could also affect readiness. To our knowledge, [4] is the only study to suggest that overall experience level may be related to readiness. (The authors found that the number of commands that an XO had held was positively related to the MCI score.)
We are not able to estimate the correlation of individual experience level and readiness in this study. We can, however, lay the groundwork for future research. We examine whether the accumulation of sea duty experience and deployed time has changed over time. In this slide, we show the median cumulative deployed time for conventional SWO accession cohorts since 1980. We identify all of the conventional SWOs who stay in the community to the YCS of interest (e.g., YCS 3 or 6). Most SWOs have completed part of the DIVO tours by YCS 3, and they are between their DIVO and DH tours by YCS 6. We calculated each SWO’s cumulative time assigned to a sea duty UIC and the time that those UICs are deployed. We then calculated the median cumulative deployed time across the cohort. We used the median because a few SWOs accumulated unusually large amounts of deployed time by the YCS of interest, while others accumulated very little deployed time. Using the median for the cohort avoids the undue influence of outliers.
The median cumulative deployed time for conventional SWOs by YCS 3 changed little over time; it has remained between 6 and 7 months for nearly 30 years. By YCS 6, there was a decrease in median cumulative deployed time from about 13 months to about 10 months for the accession cohorts in the early 1980s. Since the accession cohorts of the early 1990s, however, the median cumulative deployed time for each cohort has remained between 8 and 10 months.

32
There was a more obvious decline in median cumulative deployed time by YCS 9, 12, and 16 over the period. By YCS 9, the median cumulative deployed time fell from about 15 months for the early 1980 cohorts to about 10 months for the cohorts of the early 2000s. The decrease in median cumulative deployed time by YCS 6 shown in the previous slide explains the decrease by YCS 9 for the accession cohorts in the 1980s. The graph above, however, shows an additional 2-month decrease in median cumulative deployed time by YCS 9 for the accession cohorts from the early 1990s to the early 2000s.
Moreover, in general, this decline is not reversed when we look at the median deployed times by YCS 12 and YCS 16. It appears that the 5-month loss in cumulative deployed time incurred by YCS 9 for the accession cohorts of 1980 through the late 1990s was not made up in subsequent sea tours.

33
Passage of the GNA in 1986 increased the demand for joint, international, and interagency tours. Since the officer career length and promotion timing remained the same, officers had to find ways to complete these new tours as well as the traditional operational milestones. This may have led to shortening some tours.
The drawdown in the 1990s could also have slowed the accumulation of experience at sea. During a drawdown, billets can be cut quickly, but the services usually cannot decrease endstrength quite so fast. One result is that the manpower and personnel system may have more bodies than billets during the drawdown. One way that the services can manage the excess endstrength while allowing due-course officers to reach career milestones is to shorten tour lengths.
The decrease in the median cumulative deployed time to YCS 6 for the accession cohorts from the mid-1980s to about 1990 is consistent with the drawdown of the early to mid-1990s. The additional decrease in median cumulative deployed time at YCS 9, 12, and 16 for these same accession cohorts and subsequent ones is consistent with the challenges of managing the career paths brought about by the GNA.
Sufficiently large changes in retention rates for SWOs could also affect tour lengths. For example, if retention rates increase enough, tour lengths may need to be shortened. There has been an upward trend in SWO retention rates over the last 25 years (with many fluctuations around the trend line). If the number of SWO sea duty billets grew relatively more slowly than the increase in retention, this would be consistent with a decrease in median cumulative deployed time.

34
Because we found a decrease in median cumulative deployed time for accession cohorts over the time period, we were interested to know if this was mirrored by a decrease in cumulative sea duty time. We find that median cumulative sea duty time by YCS 3 did not vary at all over time until the FY 2002 accession cohort. Then, it jumped from 25 months to 32 months—almost certainly as the result of a policy change. This appears to have had little to no effect on median cumulative deployed time.
By YCS 6, there is variation over time in median cumulative sea duty time, but it has no apparent pattern. For the accession cohorts in the mid-1980s (specifically, the FY 1984–1987 cohorts), there is a decrease in median cumulative sea duty time of roughly 20 percent, from about 50 months to 40 months. The median cumulative sea duty time rebounded quickly for the FY 1988 cohort, only to start another longer, slower decline for the FY 1993–2002 accession cohorts of about 11 percent (from 45 months to 40 months). It has rebounded again to 45 months for the most recent observable cohorts at YCS 6. There appears to be little relationship between median cumulative sea duty time and deployed time by YCS 6 for these cohorts.

35
The median cumulative sea duty time by YCS 9 has been decreasing since the FY 1996 cohort, while the decreases by YCS 12 and 16 started with the FY 1991 cohort. At YCS 12 and 16, the decreases were about 14 percent (110 months to 95 months) and 11 percent (90 months to 80 months), respectively. These only roughly correspond to the decreases in median cumulative deployed time, so, while both median cumulative sea duty and median cumulative deployed time has fallen for more recent cohorts, it is not clear that the decreases are driven by the same things. Again, however, these patterns are somewhat consistent with the drawdown, a delayed response to the GNA, and a general upward trend in retention.
We again caution that, just because we observe a decrease in median cumulative sea duty over time, this does not automatically mean that there were adverse consequences to readiness. More research needs to be done to explore that possibility.

36
This slide shows the median cumulative sea duty time for aviators by various YCS milestones. With the exception of a decrease in the median time for cohorts in the early 1980s by YCS 6, 9 and 12, there has been little variation over time. We were unable to do the same calculation for median cumulative deployed time because it is very difficult to track when certain squadrons were deployed over the time period.
The generally decreasing pattern of median cumulative sea duty and deployed times for conventional SWOs was somewhat consistent with the idea that the early 1990s drawdown, the passage of GNA, and an upward trend in retention may have shortened sea duty/deployed times. In contrast, we find limited evidence of this for aviators.

37
To summarize, we see an apparent decrease in median cumulative deployed time and sea duty time for the conventional SWO accession cohorts of 1980 to the early 2000s. Some of the decrease coincides with the drawdown in the early 1990s, during which the Navy may have been more successful in cutting billets than personnel. There have been decreases since then, however, so the drawdown is not likely to be the only explanation. It may also be that, since the passage of the GNA in 1986, officer careers had to be managed with slightly less time at sea and more time in joint and other billets ashore. In addition, a general upward trend in SWO retention may also have led to a decreasing median cumulative deployed time and sea duty time.
We do not find the same pattern for aviators, whose cumulative sea duty time fell modestly for the accession cohorts in the 1980s but has since been relatively stable.
Note that a decrease in median cumulative sea duty time or in median cumulative deployed time does not necessarily mean that readiness has been negatively affected. A more thorough examination would be necessary to understand that relationship.

38
We do not have any evidence to date that the double-pump CSG deployments that occurred from 2009 to mid-2012 adversely affected junior conventional SWO or aviator retention. Note, however, that for conventional SWOs we were unable to make separate estimates of the effect for officers who experienced both deployments of a double-pump CSG and for those who experienced only one deployment of the double-pump. Instead, we can say that retention for junior conventional SWOs who experienced one of the two double-pump CSG deployments did not appear to be adversely affected.
We also found that a CSG officer crew lockdown for part of the O-FRP cycle (i.e., the 20-month period that encompasses the training periods and the deployment) would increase average crew tenure by about 33 percent—from 9.4 to 12.5 months—at the peak tenure level in the steady state (i.e., at the end of the deployment). Crew lockdowns over part of the cycle also lower average crew tenure by about 25 percent—from 9.4 to 7.6 months—at the lowest tenure level (i.e., at the end of the maintenance phase).
The question is whether the increase in average crew experience yields readiness benefits that outweigh the potential costs to changing officer career management and the generalist SWO development approach to accommodate the lockdown. In this study, using a very small sample, we found little evidence that median officer crew tenure was correlated with certain CSG performance metrics.
We also found that the median cumulative deployed time and sea duty experience for conventional SWOs has declined in the past 25 years. It is possible that the GNA, the drawdown in the early 1990s, and a general upward trend in SWO retention affected the accumulation of deployed time and time on sea duty for SWOs. We do not find a decline in median cumulative sea duty time for aviators. We also do not yet know if the decrease has had any effect on readiness.

39
We make one general and two specific recommendations. In general, as the Navy explores various options for the FRP cycle to enhance forward presence while maintaining appropriate readiness levels, it must continue to examine the relationships between crew tenure, individual officer (and enlisted) experience levels, and readiness.
Specifically, our knowledge about the relationship between officer tenure on the ship (or CSG) and readiness (as measured by material readiness) is dated. Ship manning has changed substantially since the 1980s, but we have not updated our models of crew experience/readiness. Similarly, our understanding of the relationship between individual officer experience accumulation and readiness is both limited and dated. In addition, to our knowledge, before this study, there has been no estimation of the relationship between average officer crew tenure and readiness/performance outcomes. All of these relationships should be estimated using recent data.
In past studies, enlisted crew characteristics had a substantially larger effect on readiness than officer crew characteristics did. Going forward, we should examine the effect of characteristics of the whole crew on readiness, including the combined effects of officer and enlisted tenure.
These proposed analyses depend on appropriate measures of readiness or performance. Past studies focused on material readiness, which is critical to mission success; however, tactical readiness is just as critical and may be the bigger concern with regard to crew rotation policies. As a result, we need to explore all available data on tactical readiness to be able to examine its relationship to crew characteristics.

40
[1] Diana S. Lien et al. Crossing the Red Line: Personnel Implications of an Increase in Presence-Based Deployments. CNA Annotated Briefing DQR-2012-U-003424-Final. Dec. 2012.
[2] Anna B. Williams, Lyntis H. Beard, and Annette M. Matheny. Air Defense Manning and Training: Resource Gaps and Performance Penalties (U), Confidential. CNA Annotated Briefing DAB-2013-C-004943-Final. Aug. 2013.
[3] Jonathon D. Mintz and Ann D. Parcell. Is officer crew tenure correlated with CSG training performance? (U), Confidential. Apr. 2014.
[4] Donald J. Cymrot. The Effect of Officer Characteristics on the Material Condition Index Scores of Surface Ships. CNA Memorandum 86-0011. Jan. 1986.
[5] Aline Quester, Russell Beland, and William Mulligan. Ship Material Readiness. CNA Professional Paper 467 (Revised). Feb. 1991.


4825 Mark Center Drive, Alexandria, VA 22311-1850 703-824-2000 www.cna.org
DAB-2014-U-007152-Final