Embed Size (px)
Citation preview

Challenges, Design and Analysis of a Large-scale P2P-VoDSystem
Yan Huang∗, Tom Z. J. Fu†, Dah-Ming Chiu†, John C. S. Lui‡ and Cheng Huang∗∗{galehuang, ivanhuang}@pplive.com, Shanghai Synacast Media Tech.†{zjfu6, dmchiu}@ie.cuhk.edu.hk, The Chinese University of Hong Kong
‡[email protected], The Chinese University of Hong Kong
ABSTRACTP2P file downloading and streaming have already becomevery popular Internet applications. These systems dramat-ically reduce the server loading, and provide a platform forscalable content distribution, as long as there is interest forthe content. P2P-based video-on-demand (P2P-VoD) is anew challenge for the P2P technology. Unlike streaming livecontent, P2P-VoD has less synchrony in the users sharingvideo content, therefore it is much more difficult to allevi-ate the server loading and at the same time maintainingthe streaming performance. To compensate, a small storageis contributed by every peer, and new mechanisms for co-ordinating content replication, content discovery, and peerscheduling are carefully designed. In this paper, we describeand discuss the challenges and the architectural design issuesof a large-scale P2P-VoD system based on the experiencesof a real system deployed by PPLive. The system is alsodesigned and instrumented with monitoring capability tomeasure both system and component specific performancemetrics (for design improvements) as well as user satisfac-tion. After analyzing a large amount of collected data, wepresent a number of results on user behavior, various systemperformance metrics, including user satisfaction, and discusswhat we observe based on the system design. The study ofa real life system provides valuable insights for the futuredevelopment of P2P-VoD technology.
Categories and Subject DescriptorsC.2 [Computer-Communication Networks]: DistributedSystems
General TermsDesign, Measurement, Performance
KeywordsPeer-to-Peer/Overlay Networks, Video-on-Demand, ContentDistribution
Permission to make digital or hard copies of all or part of this work forpersonal or classroom use is granted without fee provided that copies arenot made or distributed for profit or commercial advantage and that copiesbear this notice and the full citation on the first page. To copy otherwise, torepublish, to post on servers or to redistribute to lists, requires prior specificpermission and/or a fee.SIGCOMM’08, August 17–22, 2008, Seattle, Washington, USA.Copyright 2008 ACM 978-1-60558-175-0/08/08 ...$5.00.
1. INTRODUCTION AND CONTRIBUTIONThe effectiveness of using the P2P approach for content
distribution has been proven by many deployed systems [1,2, 3, 4, 9, 21]. These P2P systems offer many different ser-vices. One type of service is P2P file downloading, for exam-ple implemented by BitTorrent [9] and Emule [1]. When afile is downloaded by many users, these users help each otherso that the server load is significantly reduced. The peersmay experience different downloading rates, often depend-ing on how much they are able to contribute to the process.Another type of service is P2P live streaming (for exampleimplemented by a university project Coolstreaming [21] andmany commercial systems such as PPLive [2]). When a livevideo is watched by many users, again these users can helpeach other to alleviate the load on the server. In this case,the new challenge to system design is to ensure all peers canreceive the streamed video at the playback rate.
More recently, the interest has turned towards a new kindof service, P2P video-on-demand (P2P-VoD). Based on adetailed analysis of a current client-server VoD system atMicrosoft, it was pointed out in [17] that P2P-VoD couldbring significant savings in server loading. Apparently thisconclusion was already shared among P2P-VoD developers,since a number of P2P-VoD systems were deployed at aboutthe same time as the publication of [17]. These P2P-VoDsystems are already enjoying a large viewer population [3,4, 5, 6, 7]. Like P2P streaming systems, these P2P-VoDsystems also deliver the content by streaming, but peers canwatch different parts of a video at the same time, hence di-luting their ability to help each other and offload the server.To compensate, this new genre of P2P systems requires eachuser to contribute a small amount of storage (usually 1GB)instead of only the playback buffer in memory as in the P2Pstreaming systems. This additional resource opens up vastnew opportunities for arranging suitable patterns of contentreplication to meet diverse user demands. Essentially, thenew system is a highly dynamic P2P replication system, plusa sophisticated distributed scheduling mechanism for direct-ing peers to help each other in real time.
In this paper, we conduct an in-depth study of P2P-VoDbased on a real-world P2P-VoD system built and deployedby PPLive in the fall of 2007. Since the deployment of thisP2P-VoD service, the system has been keeping track of thenumber of users. As of late November 2007, a total of 2.2million independent users had tried the system. A totalof 3900 movies were published in November and Decemberof 2007, with around 500 movies on-line simultaneously. Inlate January 2008, the number of simultaneous users reached
375

over 150K and was still growing. The point is that this isa system with a reasonable scale, and there are valuablelessons to be learned by measuring and analyzing its behav-ior.
The organization of the paper is as follows. In Section2, we first describe a general architecture and its impor-tant building blocks. This general model serves to provide aframework and taxonomy for studying different design issuesin a P2P-VoD system; for example, strategies for replication,information search and lookup, peer service scheduling, andother building blocks. In Section 3, we discuss metrics forevaluating a P2P-VoD system, and how to instrument themeasurement in a real-life system. Real-life measurementdata were collected from the deployed PPLive VoD system.In Section 4, we show the collected data, and analyze userdemand, the effectiveness of the system design (for exam-ple the replication and transmission scheduling strategies)to satisfy user demand, and user satisfaction. Finally, wediscuss related work and conclusions.
2. DESIGN AND BUILDING BLOCKSIn this section, we describe the general architecture of a
P2P-VoD system in terms of various building blocks. Inthe process, we explain many specific design decisions inthe PPLive P2P-VoD system, as specific examples. We alsocompare the P2P-VoD building blocks to those of P2P filedownloading and streaming: there are some similarities, butalso some notable differences.
2.1 Major components of the systemSimilar to many P2P file sharing or streaming systems, a
P2P-VoD system has the following major components: (a)a set of servers as the source of content (e.g., movies); (b) aset of trackers to help peers connect to other peers to sharethe same content; (c) a bootstrap server to help peers to finda suitable tracker (e.g. based on which geographical regionthe peer is located), and to perform other bootstrappingfunctions; (d) other servers such as log servers for loggingsignificant events for data measurement, and transit serversfor helping peers behind NAT boxes. These servers are typ-ically provided by the P2P-VoD operator.
The other major component, of course, is the set of peers.They typically run software downloaded from the P2P-VoDoperator. The P2P-VoD peer software comes with protocolsto talk to all the servers above, as well as protocols to talkto other peers to share content. The peers also implementDHT (distributed hash table) function to back up certainbootstrapping servers.
2.2 Segment sizesIn the design of a P2P-VoD system, a fundamental deci-
sion is about segmentation of content, or how to divide avideo into multiple pieces. There are many considerationsfor making this decision. From a scheduling point of view,it is desirable to divide the content into as many pieces aspossible (i.e., small segment size), so that it gives the mostflexibility to schedule which piece should be uploaded fromwhich neighboring peer. This is specially so when peers allhave different upload capacity. From the overhead point ofview, the larger the segment size the better, to minimizeoverheads. There are several types of overheads including:(a) Each piece of content comes with some header to de-scribe the content, for example its sequence number and
Segment Designed for Sizemovie entire video > 100MBchunk unit for storage 2MB
and advertisementpiece unit for playback 16KB
sub-piece unit for transmission 1KB
Table 1: Different units of a movie
timestamp, and authentication information. The larger thesegment, the smaller the header overhead. (b) Each peerneeds to let other (neighboring) peers know which piecesit is holding. This information is usually represented by abitmap, for ease of processing. The larger the segment size,the smaller the size of the bitmap, hence this is advertizingoverhead. (c) In order for a peer to get a piece of contentfrom another peer, there will be some protocol overhead,in terms of request packets or other protocol packets. Thelarger the segment size the smaller is such protocol over-heads. A third perspective is due to the real-time nature ofstreaming. The video player expects a certain minimum sizefor a piece of content to be viewable (so a viewable piece al-ways consists of multiple packets), and such viewable unitsmust be delivered to the player with deadlines. By mak-ing these units (exchanged between the transport and theplayer) too large, it increases the chance that the transportfails to collect a complete viewable unit of content beforethe deadline.
Due to these conflicting requirements, there are three lev-els of segmentation of a movie in PPLive’s VoD system, asdefined in Table 1.
The size of piece is dictated by the media player and asize of 16KB is chosen. PPLive uses the WMV format forvideo encoding. The source video rate is usually between381 to 450 Kbps. For high-definition video, the rate can goup to 700 Kbps or higher. Using the 16KB size, a piece willcontain a viewable segment as long as the source rate is lessthan 1.4 Mbps.
The size of piece is too large for efficient scheduling oftransmission, so sub-piece is used. If piece is advertised toother peers, then a bitmap of thousands of bits would beneeded (e.g., a 2GB movie would need a bitmap of size 64Kbits. So chunk is defined and used for the purpose of ad-vertizing to neighbors what parts of a movie a peer holds.In summary, a movie is composed of a number of chunks, achunk is composed of a number of pieces, while a piece iscomposed of a number of sub-pieces.
Given these choice of segment sizes, PPLive experiencesan overhead rate of 6.2%, considering all three types of over-heads mentioned above, but assuming operating under per-fect conditions with no losses, no unnecessary requests andno duplicate transmissions. Under real-life network condi-tions, the average overhead rate is about 10%.
2.3 Replication strategyEach peer is assumed to contribute a fixed amount of hard
disc storage (e.g., 1GB). The entire viewer population thusforms a distributed P2P storage (or file) system. A chunk isthe basic unit for storing movies on a hard disc. Only whenall the pieces in a chunk are available locally, the chunk isadvertised to other peers.
The goal of the replication strategy is to make the chunks
376

as available to the user population as possible to meet users’viewing demand while without incurring excessive additionaloverheads. This is probably the most critical part of theP2P-VoD system design. There are many possible replica-tion strategies, many exploiting the various user demandcharacteristics. This is an important area for continued re-search.
The first design issue is whether to allow multiple moviesbe cached if there is room on the hard disc. If so, a peermay be watching one movie while providing uploading to an-other movie at the same time. This is referred to as multiplemovie cache (MVC) rather than single movie cache (SVC).The design of SVC is simpler, but MVC is more flexible forsatisfying user demands and is the choice by PPLive VoD.
The next important design consideration is whether topre-fetch or not. Without pre-fetching, only those moviesalready viewed locally could possibly be found in a peer’sdisk cache. While Pre-fetching may improve performance,it may also unnecessarily waste precious peer uplink band-width. Also, for ADSL (commonly found in China), a peer’scapacity to provide upload can be affected if there is simul-taneous downloading. Furthermore, it is observed that thevisit duration for the majority of peers is currently no morethan one hour, which increases the risk of wastage. For thesereasons, the design choice is no pre-fetching.
Another important choice by the replication algorithm iswhich chunk/movie to remove when the disk cache is full.In PPLive’s case, this decision is primarily made on a moviebasis. This means once a movie has been chosen as the nextone to go, all the chunks of the movie immediately becomecandidates for removal one by one. Doing it at a chunklevel would incur more overheads (for collecting necessaryinformation about different chunks). How is the next moviepicked? The favorite choices by many caching algorithmsare least recently used (LRU) or least frequently used (LFU).Indeed, LRU is the original choice in PPLive VoD. Afterfurther studies, the simple LRU is replace by a weight-basedevaluation process.
Each movie is assigned a weight based on primarily twofactors: (a) how complete the movie is already cached lo-cally; (b) how needed a copy of the movie is. The need levelis determined by the availability to demand ratio (ATD).Suppose a movie is cached (including being viewed) by cpeers and being viewed by n peers; then the ATD is c/n.The need of a movie is then defined as a decreasing functionof its ATD, reaching a maximum value for all ATD beyond6 (or 8). The value of this threshold (6-8) is determinedby the prevailing uplink bandwidth contributed by peers,normalized by the source bitrate. For current situation inChina, many peers have relatively low uplink bandwidth tocontribute, therefore it takes 6-8 peers to offload the source(server).
The ATD information for weight computation is providedby the tracker. So the implementation of the weight-basedreplication strategy incurs additional overheads. This over-head depends on how often the caching decision is made. Incurrent systems, the average interval between caching deci-sions is about 5 to 15 minutes, so this is not a significantoverhead. The benefit of weight-based replication over LRUis significant. It improves the server loading from 19% downto a range of 11% to 7%. This is the biggest performanceimprovement achieved by a design change.
More detailed discussion of how to measure the effective-
ness of the replication algorithms, will be discussed in sec-tion 3. Measurement results and analysis will be includedin section 4.
2.4 Content Discovery and Peer Overlay Man-agement
It is not enough to have good replication of content -peers must also be able to discover the content they needand which peers are holding that content. The challengeis to accomplish this with the minimum overhead. With-out exception, P2P systems rely on the following methodsfor content advertising and look-up: (a) tracker (or supernode); (b) DHT; (c) gossiping method. These methods pro-vide different levels of availability, freshness and robustness,with commensurate levels of overhead. In PPLive VoD, allthese mechanisms are used to some extent, depending onthe different requirements for the information.
Trackers are used to keep track of which peers replicatea given movie (or part of that movie). As soon as a user(peer) starts watching a movie, the peer informs its trackerthat it is replicating that movie; conversely, a peer also tellsits tracker when it no longer holds a movie in its cache.When a peer wants to start watching a movie, it goes tothe tracker to find out which other peers have that movie.Those other peers become this peer’s neighbors.
The information about which chunks a peer has is kept ina Chunk Bitmap. A peer asks its neighbors for their ChunkBitmaps. Based on this information, it selects which neigh-bor to download from. So discovering where chunks are isby the gossip method. This cuts down on the reliance onthe tracker, and makes the system more robust. Even if thetracker is not available, a peer can switch to the gossip modeto find other peers watching the same movie.
In fact, each peer also regularly sends keep-alive messagesto a tracker to report its chunk bitmap and other statistics.This information is collected for monitoring and manage-ment purposes, rather than for operational reasons. We willdescribe how this information is used to compute a (replica-tion) health index.
Originally, DHT (implemented by tracker nodes) is usedto automatically assign movies to trackers to achieve somelevel of load balancing. In later versions, peers also imple-ment DHT so as to provide a non-deterministic path to thetrackers. This prevents the trackers to be possibly blockedby some ISPs.
2.5 Piece selectionA peer downloads chunks from other peers using a pull
method. For P2P-VoD, there are three considerations forselecting which piece to download first:
1. sequential : Select the piece that is closest to what isneeded for the video playback.
2. rarest first : Select the piece that is the rarest (usuallythe newest piece in the system). Although it seemscounter-intuitive for streaming, selecting the rarest piecehelps speeding up the spread of pieces, hence indirectlyhelps streaming quality. This strategy tends to helpthe system scale, which is clearly explained in [22].
3. anchor-based : In VoD, users may skip parts of a movieand jump forward (backward). To support such VCRfeatures, a number of video anchor points are defined
377

for a movie. When a user tries to jump to a particularlocation in the movie, if the piece for that location ismissing then the closest anchor point is used instead.
In PPLive’s system, a mixed strategy is used, giving the firstpriority to sequential, then rarest-first. The anchor-basedmethod is not used in current design for two reasons. (a)From current experience, users do not jump around much.On average, only 1.8 times per movie is observed. (b) Byoptimizing the transmission scheduling algorithm, the initialbuffering time after a jump can be reduced to an acceptablelevel1 without implementing anchoring. For these reasons,the anchoring idea is still under study for future implemen-tation.
2.6 Transmission strategyAfter selecting a particular chunk to download, suppose
this chunk is available at a number of neighbor peers, how toselect which neighbor to download from? How many neigh-bors to use for simultaneous download? How to schedulerequests and set timeouts to multiple neighbors for simulta-neous download? All these are accomplished by the trans-mission scheduling algorithm.
There are two (sometimes conflicting) goals in designingthe transmission algorithm: (a) maximize (to achieve theneeded) downloading rate; (b) minimize the overheads, dueto duplicate transmissions and requests.
In a data-driven overlay, the neighbors a peer connects tocan be highly dynamic, since each neighbor may be answer-ing to multiple requests at a time. So a peer must constantlyjuggle how to send download requests to different neighborsand how to deal with timeouts. There are different levels ofaggressiveness: (i) a peer can send a request for the samecontent to multiple neighbors simultaneously, to ensure itgets the content in time; (ii) a peer can request for differentcontent from multiple neighbors simultaneously; when a re-quest times out, it is redirected to a different neighbor; (iii)work with one neighbor at a time; only when that neighbortimes out, try to connect to a different neighbor.
Strategy (i) is very aggressive for achieving the deadlinefor downloads, but invariably generates duplicate transmis-sions. Strategy (iii) is very conservative in resource utiliza-tion. Both strategy (ii) and (iii) may still general dupli-cate transmissions because of timeouts, but the likelihood ismuch lower than (i). PPLive VoD’s transmission algorithmis based on strategy (ii). In implementing strategy (ii), thealgorithm tries to proportionally send more requests to theneighbor based on response time. A critical parameter fortuning is the number of simultaneous neighbors to send re-quests to. For playback rate of around 500Kbps, our experi-ence is that 8-20 neighbors is the sweet spot. More than thisnumber can still improve the achieved rate, but at the ex-pense of heavy duplication rate. If the desired rate is 1Mbps,then 16-32 simultaneous neighbors tends to provide the bestresult. These numbers are highly empirical, depending onthe prevailing uplink bandwidth of peers and many otherfactors. Overall, how to design the best transmission algo-rithm is an interesting topic for further research.
Finally, it should be pointed out that when the neigh-boring peers cannot supply sufficient downloading rate, thecontent server can always be used to supplement the need.
1In recent tests, the average buffering time is around 18seconds.
2.7 Other design issuesAfter describing the basic design for normal networking
conditions, we describe a number of mechanisms designedto deal with abnormal operating conditions. These include:incentives for contribution; traversing NAT and firewalls;and content authentication.
It is well-known that the P2P file downloading protocolBitTorrent [9] uses tit-for-tat as incentive to induce peers tohelp each other. In P2P streaming, this does not work sincemany peers cannot contribute uploading bandwidth greaterthan or equal to the playback rate. So what incentives areused? In the PPLive system, the users do not have any built-in controls for adjusting their contribution levels. In orderfor the software to continue to deliver content for playback,the client software must regularly advertise its chunk bitmapto the tracker; else playback would be automatically turnedoff.
Another impediment to P2P overlay networks is the NATboxes and firewalls. The PPLive VoD system uses standardmethods2 for peers to discover different types of NAT boxeson their path to the Internet, and advertize their addressesaccordingly. This is quite necessary in the current Internetsince about 60%-80% of peers are found to be behind NAT.We have included some data to show the distribution of theNAT types in section 4.
Also, a significant number of peers are protected by fire-walls. For this reason, the PPLive software carefully pacethe upload rate and request rate to make sure the firewallswill not consider PPLive peers as malicious attackers.
It is important for the P2P-VoD system to include mecha-nisms to authenticate content, so that the system is resistantto pollution attacks [10]. Such authentication can be imple-mented based on message digest or digital signature. In thecase of a proprietary system, it is not difficult for the oper-ator to implement some means to distribute a key for eachmovie.
Authentication can be done at two levels: chunk level orpiece level. If chunk level, authentication is done only whena chunk is created and is stored to the hard disc. In thiscase, some pieces may be polluted and cause poor viewingexperience locally at a peer. However, further pollution isstopped because the peer would detect a chunk is bad anddiscard it. The advantage of the chunk level authenticationis its minimal overhead.
Chunk-level authentication has at least two significantdrawbacks. Sometime, polluted pieces may cause more dam-age than poor viewing experience, for example it may crashor freeze the player. Secondly, chunk is a rather large seg-ment of content. There is some non-zero probability that apiece is bad not due to pollution; but this would cause theentire chunk to be discarded. For these reasons, it is wiseto do authentication at the piece level to ensure good videoquality. In the current version of PPLive VoD, a weaker formof piece level authentication is also implemented, leveragingon the same key used for chunk level authentication.
3. PERFORMANCE METRICS AND MEA-SUREMENT METHODOLOGY
An important goal of this paper is to study a large-scalereal-life P2P-VoD system through measurement. A large
2Similar to the STUN protocol.
378

User ID Movie ID Start time End time Start pos.
Table 2: MVR format
amount of information was measured, and we will focus onthose aspects most interesting. In this section, we first de-scribe what we try to measure and the metrics used for mea-surement. Then we explain how we collected the data.
3.1 What to measureWhat we measure can be roughly grouped into three areas:
1. User behavior : This includes the user arrival patterns,and how long they stayed watching a movie. One ma-jor difference between VoD and live streaming is thatusers may not be watching the same thing at the sametime, but there is often some overlap (for example,they are watching different parts of the same movie).Another important difference is in VoD users can jumpfrom one position to another in a movie, while skippingthe content in between. Understanding these kinds ofuser behavioral information can be used to improvethe design of the replication strategy.
2. External performance metrics: This includes user sat-isfaction and server load. Server load can be objec-tively defined in terms of CPU, memory, and band-width resources needed from the server at differentloading (number of peers). The definition of user sat-isfaction is more subjective. These metrics are used tomeasure the system performance perceived externally.
3. Health of replication: In comparison to P2P streamingor file downloading, replication is a new aspect of P2Ptechnology designed for VoD. It is therefore particu-larly important and interesting to design yardsticks tomeasure how well a P2P-VoD system is replicating acontent. This is an internal metric used to infer howwell an important component of the system is doing.
3.2 Measuring User BehaviorIn a P2P-VoD system, a typical user does not just watch
a movie sequentially, but rather, he is allowed to jump fromone movie to another; and when viewing one movie, is al-lowed to skip parts of the movie and jump to a new positionin the movie. Therefore, the most basic user activity is thecontinuous viewing of a stretch of a movie. This basic ac-tivity is recorded in a movie viewing record (MVR). Theimportant parts of an MVR record are shown in Table 2,where ST is the starting time, ET is the ending time, andSP is the starting position.
Each user has a unique User ID, which is included as partof the MVR. To ensure uniqueness, part of this ID is derivedfrom the hardware component serial numbers (HCSN) of thecomputer (or the memory module on that computer) that isrunning the P2P-VoD client software. Each movie also hasa unique ID, which is usually a hash of the movie content.The MVR records the starting time (ST) and ending time(ET), as well as the starting position (SP) of a particularcontinuous viewing activity. Based on these three numbers,the ending position can also be computed. In most cases, assoon as a user finishes recording one MVR, a new MVR isinitialized to record the next viewing activity.
t0
t1
t2 t3
Startwatchingfrom thebeginning
Jump to30% ofthemovie
Jump to65% ofthemovie
Stopwatching
T
U1 M1 t0
t1
0%U1 M1 t1 t2 30%U1 M1 t2 t3 65%
MVR1:
MVR2:MVR3:
UID MID ST ET SP
Figure 1: Example to show how MVRs are gener-ated
Figure 1 illustrates how MVRs are generated based ona sequence of user viewing activities. In this example, theuser’s ID is U1 and the movie’s ID is M1. The user startsto watch the movie at t0 from the beginning of the movie.After watching for a duration of (t1 − t0), he/she jumps toposition 30% of the movie (i.e., if the length of the movieis 5000 seconds, this user jumps to the 1500th second ofthe movie). At t2, the user jumps again to start watchingat position 65% (or the 3250th second of the 5000-secondmovie) and he stops watching at t3. As a result of thissequence of activities, three MVRs are generated as shownin Figure 1.
Clearly, a complete user behavior information can be rep-resented by these MVR records. We explain later how thisinformation is collected.
3.3 User satisfactionFrom the MVRs, we can determine the total viewing time
of each user for each movie. A very crude statistic for theP2P-VoD service is the total viewing time (TVT) for all usersand all movies.
TVT gives us the total amount of service provided by theP2P-VoD system, but it does not tell us the level of usersatisfaction. How to measure user satisfaction is in itself aninteresting research problem.
Let us first consider a simple version of user satisfaction.Given an MVR, actually part of the duration between starttime and end time is not spent on viewing, but on buffer-ing. Assume this information is captured by the P2P-VoDclient software together with the MVR, denoted as BT (forbuffering time). Let R(m, i) denote the set of all MVRs for agiven movie m and user i, and n(m, i) the number of MVRsin R(m, i). Let r denote one of the MVRs in R(m, i). Thenwe can define the fluency F (m, i) for a movie m and user ito be:
F (m, i) =
∑r∈R(m,i)(r(ET )− r(ST ) − r(BT ))
∑r∈R(m,i)(r(ET ) − r(ST ))
. (1)
In simple words, F (m, i) measures the fraction of time a userspends watching a movie out of the total time he/she spendswaiting for and watching that movie.
Ideally, we want something more refined than fluency toguage the user satisfaction. For the time spent viewing amovie, a user may not be satisfied with the quality of the
379
delivery of the content3. Let us go one step further andassume that the user gave a grade for the average viewingquality for an MVR r, denoted as r(Q). Let the value ofthe grade be in the range of [0, 1]. The fluency expressionin Eq. (1) can be rewritten in terms of the contribution ofeach MVR:
F (m, i) =
n(m,i)∑
k=1
Wk, (2)
where each k indexes a particular MVR for movie m anduser i, and
Wk =(rk(ET ) − rk(ST ) − rk(BT ))∑
r∈R(m,i)(r(ET ) − r(ST )).
Now, we can define a more sophisticated version of user sat-isfaction index, S(m, i), as:
S(m, i) =
n(m,i)∑
k=1
Wkrk(Q). (3)
To illustrate, consider the example in Fig. 1, and assumethere is a buffering time of 10 (time units) for each MVR.The fluency can be computed as:
F =(t1 − t0 − 10) + (t2 − t1 − 10) + (t3 − t2 − 10)
(t3 − t0).
Suppose the user grade for the three MVR were 0.9, 0.5,0.9 respectively. Then the user satisfaction index can becalculated as:
S =0.9(t1−t0−10)+0.5(t2−t1−10)+0.9(t3−t2−10)
(t3−t0).
In reality, it is not likely (or even possible) for the P2P-VoD software to get explicit user feedback for his viewingexperience. Instead, what can be done is for the P2P-VoDclient software to infer/estimate user satisfaction for eachMVR based on user actions. For example, if the user’s view-ing duration for the MVR exceeds a certain minimum timeTmin, that may indicate that the user is basically satisfiedwith the viewing and the subsequent jump is not due to poorviewing quality but due to content reasons. Another exam-ple is if the termination of the viewing is due to a manualcontrol to ”STOP” the viewing altogether, it may also beinferred that the user is likely to be terminating the viewingsession for some other activities rather than poor viewingquality. Based on these kinds of additional events and infer-ences, it is possible to estimate a suitable value for r(Q). Adetailed study of this topic, however, is beyond the scope ofthis paper. It is a good topic for further research. For thedata analysis in the next section, we simply take fluency asthe indicator for user satisfaction.
3.4 Health of ReplicationThe health index (for replication) can be defined at three
levels:
a. Movie level : For a given movie m, the movie levelhealth index is defined simply as the number of ac-tive peers who have advertised storing chunks of thatmovie. This is basically the information that the trackercollects about movies.
3Note, this is different than when the user is not happy withthe content itself.
b. Weighted movie level : The movie level index is verycoarse. Some peers may store a very small part of amovie but are still counted towards the index. So theweighted movie level index takes the fraction of chunksa peer has into account in computing the index. If apeers stores 50 percent of a movie, it is counted as 0.5.
c. Chunk bitmap level : The movie level indexes do notshow how well individual chunks are replicated. Thechunk level health index is in fact a vector representingthe number of copies each chunk of a movie is storedby peers in a P2P-VoD system. Given the chunk levelhealth index, various other statistics can be computed.For example, the average number of copies of a chunkin a movie; the minimum number of chunks; the vari-ance of the number of chunks, and so on.
In this study, we instrumented the P2P-VoD system tocollect the chunk level health index information, to be shownin the next section.
3.5 Measurement MethodologyWe now explain how measurement data are collected in
the P2P-VoD system we studied. The general mechanismis supported by a log server that collects various sorts ofmeasurement data from peers. Sometimes, the measurementdata are part of information that the tracker collects, forexample the chunk replication information. In that case,peers would send the collected information to the tracker,and the tracker can then aggregated the information andpass it on to the log server.
Generally speaking, to avoid a large amount of traffic anda large number of interruptions on the log server, peers col-lect data and do some amount of aggregation, filtering andpre-computation before passing them to the log server. Forexample, peers do not report individual MVRs as they aregenerated. Instead, a peer sends a single report to the logserver when the user generates a“STOP”event (pressing theSTOP button, changing to another movie or turning off theclient software). Furthermore, the report also includes theuser satisfaction index (in this case the fluency) computedby the local peer. Based on these MVRs, various other userbehavior information can be deduced by post processing,either as online or offline.
For replication health index, a peer needs to report itschunk bitmap to the log server whenever one of the followingevents occurs:
1. Some of the chunks or a whole movie is removed fromthe storage due to the replication strategy.
2. The local user starts to watch a new movie, and chunksof the new movie are added to local storage.
3. A refresh timer (pre-defined, e.g. 10 minutes) goes off.
4. MEASUREMENT RESULTS AND ANAL-YSIS
In this section, we present the measurement and data anal-ysis of the P2P-VoD system in PPLive. We summarize themeasurement results into five categories, namely, statisticsfor the video objects, user behavior, system health index,user satisfaction index, and server loads.
380

4.1 Statistics on video objectsWe have collected the data trace on ten movies from the
P2P-VoD log server. As mentioned before, whenever a peerselects a movie for viewing, the client software creates theMVRs and computes the viewing satisfaction index, andthese information are sent to the log server. The collectionof MVRs of a particular movie constitutes the data traceof that movie. All these data traces were collected fromDecember 23, 2007 to December 29, 3007 (about one weekworth of trace). For the ease of presentation, we select three“typical”movies to illustrate the measurement results. Table3 lists the overall statistics of these three typical movies.
Movie Index: Movie 1 Movie 2 Movie 3
Total Length (in sec) 5100s 2820s 6600sNo. of Chunks 121 67 151
Total No. of MVRs 56157 322311 15094Total No. of MVRs with
Start Position = 0 35160 95005 8423(or # of unique viewers)
Ave. # of Jump 1.6 3.4 1.8Ave. viewing Duration
for a MVR 829.8s 147.6s 620.2sNormalized viewing
Duration (normalized 16.3% 5.2% 9.4%by the movie duration)
Table 3: Overall statistics of the three typicalmovies.
Based on these statistics, we have the following observa-tions:
1. Given that the size of a chunk is about 2 MBytes(assuming the playback rate is about 380kbps), thisimplies that the viewing duration of a chunk is ap-proximately 40 seconds. Movie 2 is the smallest videoobject with a viewing duration of about 45 minutes,while Movie 3 is the longest video object with a view-ing duration of about 110 minutes.
2. To determine the most popular movie, we count onlythose MVRs whose starting position (SP) is equal tozero (e.g., MVRs which view the movie at the begin-ning). From the measurement, one can determine thatMovie 2 is the most popular movie with 95005 userswhile Movie 3 is the least popular movie with 8423users.
3. One interesting statistics we like to extract is the av-erage number of jumps for a given movie. Note that apeer generates at least one MVR (with starting posi-tion being zero) and possibly a number of MVRs dueto viewing jumps. Therefore, the average number ofjumps for a given movie is approximately equal to thetotal number of MVRs divided by the total numberof MVRs with starting position being zero. Based onthis computation, we can conclude that Movie 2 hasthe highest average number of jumps (3.4) while Movie1 has the lowest average number of jumps (1.6).
4. Each MVR indicates a viewing activity and one in-teresting characteristics is to determine the viewingduration per viewing activity. One can extract thisinformation by computing the difference between theend time (ET) and start time (ST) of each MVR; by
averaging over all MVRs of a movie, we obtain theaverage viewing duration per viewing action. Table 3shows that Movie 1 has the largest viewing duration(829.8s), and this is consistent since Movie 1 has theleast average number of jumps.
5. From the derived statistics mentioned above, we canalso derive the normalized viewing duration (or aver-age viewing duration divided by the movie length) andthis is listed in the last row of Table 3, which showsthat for Movie 1, each viewing length lasts on average16.3% of the movie duration, while for Movie 2, eachviewing length is around 5.2% of the movie duration.
4.2 Statistics on user behavior
4.2.1 Interarrival time distribution of viewersOne characteristic we are interested to study is the view-
ers’ interarrival time to a particular movie. Again, this canbe derived from the trace. Given a particular movie, onecan extract all those MVRs with a start time (ST) equal tozero. These MVRs represent viewers who start to watch thevideo object from the beginning. Given this set of MVRs,we can sort them in an increasing order based on the starttime (ST) field. The differences of the ST fields between toconsecutive MVRs represent the interarrival times of view-ers.
0 50 100 150 200 250
0
0.02
0.04
0.06
0.08
0.1
0.12
0.14
0.16
0.18
Time (second)
Pro
bab
ility
den
sity
fu
nct
ion
The PDFs of the interarrival times of three movies
The average interarrival timeMovie1: 19.07sMovie2: 7.25sMovie3: 79.04sMovie 2
Movie 1
Movie 3
Figure 2: PDFs of the interarrival times of Movie 1,2 and 3.
Figure 2 represents the probability density functions (PDFs)of the interarrival time distributions of Movie 1, 2 and 3.From the figure, we can observe that Movie 2 is the mostpopular movie (also can be verified by data in Table 3) andthe average interarrival time between viewers is about 7.25s,while the interarrival times for Movie 1 and 3 are 19.07s and7.25s respectively.
We can easily represent the PDF of the interarrival timeby a simple mathematical model. In here, we use the fol-lowing function to approximate the PDF:
f(t) = atb where a > 0, b < 0. (4)
For Movie 1, we have a = 0.1152, b = −0.7894 and theroot mean square error (RMSE) is 0.0032. For Movie 2, wehave a = 0.1893, b = −0.9283 and the RMSE is 0.0051. ForMovie 3, we have a = 0.0647, b = −0.7052 and the RMSE
381

is 0.0012. Figure 3 illustrates the PDF of all three moviesand the corresponding f(t).
0 50 100 150 200 2500
0.05
0.1
The PDFs and fitting curves f(t) of the interarrival times
0 50 100 150 200 2500
0.1
0.2
PD
F
0 50 100 150 200 2500
0.05
0.1
Time (second)
a = 0.1152 b = − 0.7894RMSE = 0.003206
a = 0.1893 b = − 0.9283RMSE = 0.005133
a = 0.0647 b = − 0.7052RMSE = 0.001275
Movie 1
Fitting curve
Movie 2
Fitting curve
Movie 3
Fitting curve
Figure 3: Mathematical models for the PDF of in-terarrival times of Movie 1, 2 and 3.
4.2.2 View duration distribution, residence distribu-tion and start position distribution
When viewing a movie, users can jump to different posi-tions of the movie. The knowledge of which positions userstend to jump to is important because it can help us designwhere to put the anchor points for a movie. For this pur-pose, it also helps to know the distribution of the viewingdurations of MVRs.
Figure 4 illustrates the cumulative distribution function(CDF) of the viewing duration of the three movies. Notethat the viewing duration is measured in terms of MVRscollected from the log server. As discussed before, when auser drags the track-bar to a different position of the movie(a jump event), or when the user presses the STOP buttonto stop watching the movie, or when the user changes toanother movie or programme, or when the user turns off thesoftware, any one of these operations will generate an MVRand the duration of this MVR is just the difference betweenthe End Time (ET) and the Start Time (ST). From Figure4, we can observe that a very high percentage of MVRs areof short duration (e.g., less than 10 minutes). This impliesthat for these three movies, the viewing stretch is of shortduration with high probability.
Given the above statistics, we want to find out whetherpeers can assist each other in the movie viewing. To answerthis question, we examine the residence distribution of peers.Residence measures how long a peer stays in a P2P-VoDsystem, and it is the time interval when a user activatesthe P2P-VoD client software and that the client successfullycontacts the tracker server, to the time when a user turns offthe client software. Figure 5 shows the residence distributionof peers staying in the P2P-VoD system during the one weekmeasurement period. From this figure, we can observe thatthere is a high fraction of peers (i.e., over 70%) which staysin the P2P-VoD system for over 15 minutes, and these peersprovide upload services to the community.
Based on the observation on Figure 4 and Figure 5, wecan conclude that:
• Although the length of these three movies are different,
0 600 1200 1800 2400 3000 3600 4200 4800 5400 6000 66000
0.1
0.2
0.3
0.4
0.5
0.6
0.7
0.8
0.9
1
1.1
Time (second)
CD
F
The CDF of view duration distribution of MVRs
Average duration:Movie1: 829.8sMovie2: 147.6sMovie3: 620.2s
Movie 2Length: 2820s
Movie 1Length: 5100s
Movie 3Length: 6600s
Figure 4: The CDF of view duration distribution ofMVRs.
12/24 12/25 12/26 12/27 12/28 12/29 12/30 12/310
0.05
0.1
0.15
0.2
0.25
0.3
0.35
0.4
Date
Pro
bab
ility
den
sity
fu
nct
ion
The residence distribution of users staying in the P2P VoD system
> 120 min. 60 − 120 min. 30 − 60 min. 15 − 30 min. 5 − 15 min. 0 − 5 min.
Total number of users:12/24: 20862212/25: 21485912/26: 21626212/27: 22668712/28: 23311012/29: 28356612/30: 33673112/31: 344074
Figure 5: The residence distribution of users stayingin the P2P-VoD system.
users tend to watch Movie 1 with a higher viewingduration.
• Most of the viewing duration of the MVRs are short,e.g., less than 10 minutes.
• There is a high percentage (e.g., over 70%) of userswho stay in the P2P-VoD system for longer than 15minutes. This is significant because even though theduration of an viewing action is short, but since peersstay in the system for a long duration, they still assisteach other in viewing movie, and this translates togood system scalability.
• From the above two points, we infer that when usersstart the P2P-VoD client software, they probably firstquickly scan a few movies or programmes until theyfind an interesting one and continue to watch thatmovie; or just leave the system if nothing is of theirinterest. This process would cause a large number ofshort duration MVRs. After they find a movie thatthey are interested in, they might watch it for a longduration, and this could explain why there is a certainfraction of users stay in the system for more than onehour.
382
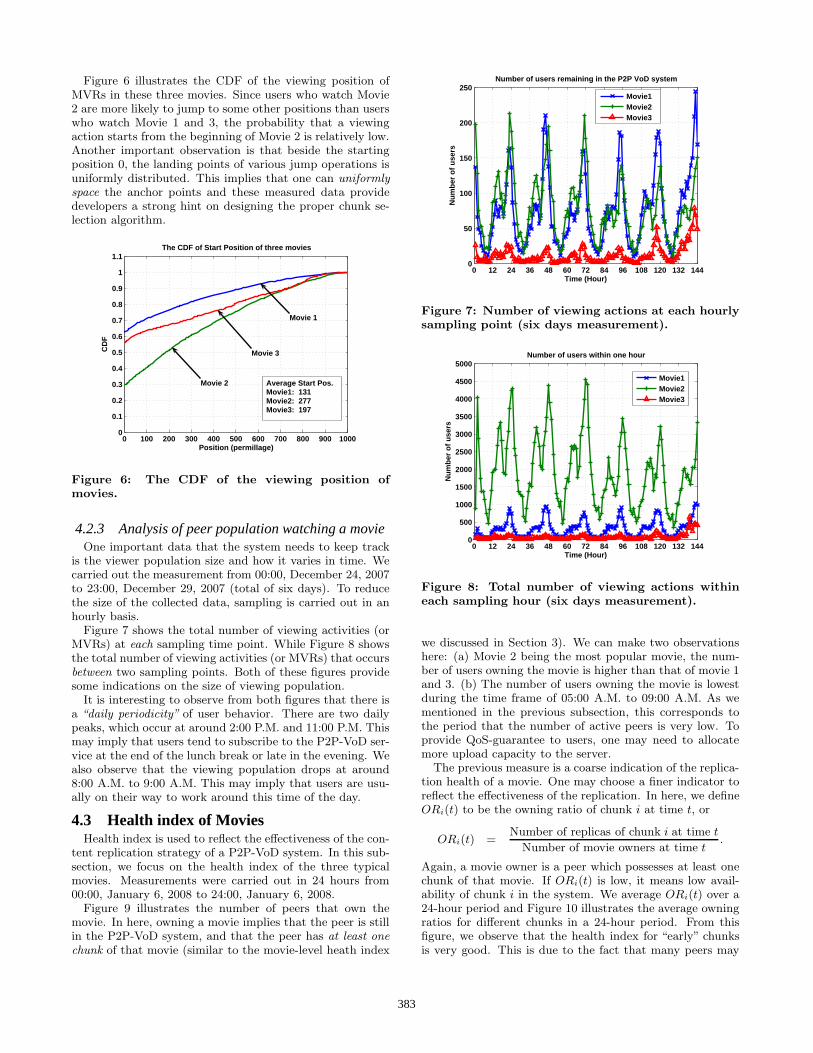
Figure 6 illustrates the CDF of the viewing position ofMVRs in these three movies. Since users who watch Movie2 are more likely to jump to some other positions than userswho watch Movie 1 and 3, the probability that a viewingaction starts from the beginning of Movie 2 is relatively low.Another important observation is that beside the startingposition 0, the landing points of various jump operations isuniformly distributed. This implies that one can uniformlyspace the anchor points and these measured data providedevelopers a strong hint on designing the proper chunk se-lection algorithm.
0 100 200 300 400 500 600 700 800 900 10000
0.1
0.2
0.3
0.4
0.5
0.6
0.7
0.8
0.9
1
1.1
Position (permillage)
CD
F
The CDF of Start Position of three movies
Average Start Pos.Movie1: 131Movie2: 277Movie3: 197
Movie 1
Movie 3
Movie 2
Figure 6: The CDF of the viewing position ofmovies.
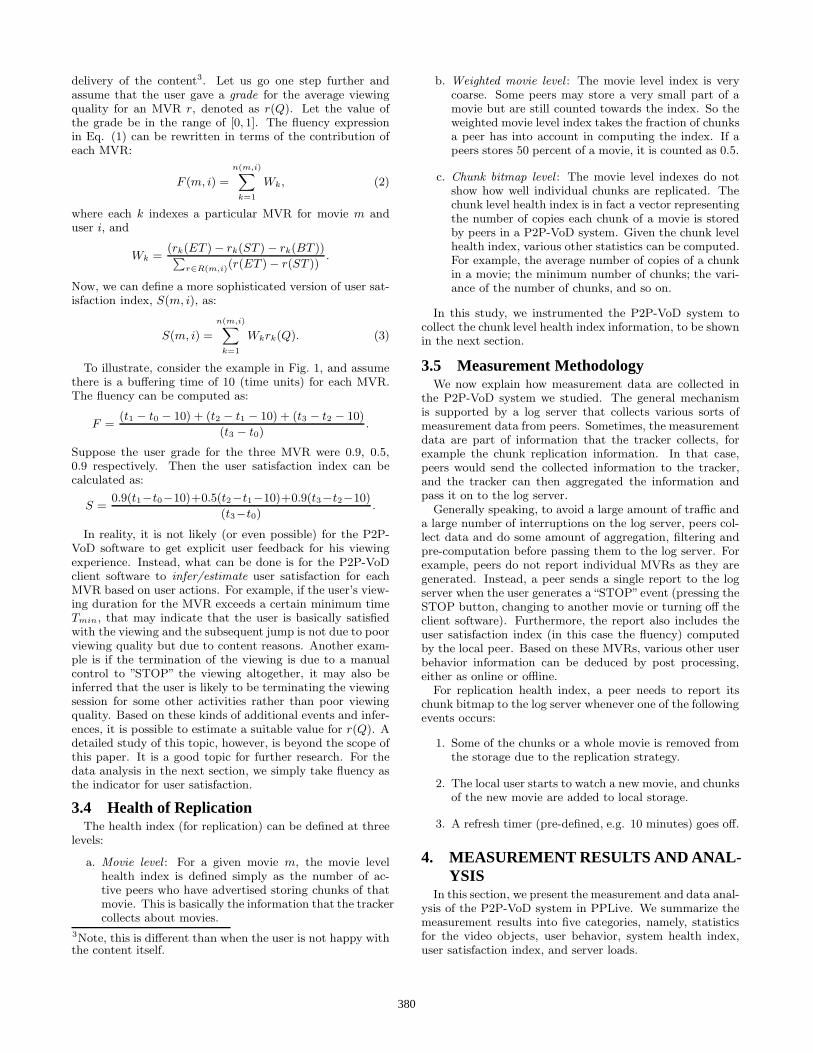
4.2.3 Analysis of peer population watching a movieOne important data that the system needs to keep track
is the viewer population size and how it varies in time. Wecarried out the measurement from 00:00, December 24, 2007to 23:00, December 29, 2007 (total of six days). To reducethe size of the collected data, sampling is carried out in anhourly basis.
Figure 7 shows the total number of viewing activities (orMVRs) at each sampling time point. While Figure 8 showsthe total number of viewing activities (or MVRs) that occursbetween two sampling points. Both of these figures providesome indications on the size of viewing population.
It is interesting to observe from both figures that there isa “daily periodicity” of user behavior. There are two dailypeaks, which occur at around 2:00 P.M. and 11:00 P.M. Thismay imply that users tend to subscribe to the P2P-VoD ser-vice at the end of the lunch break or late in the evening. Wealso observe that the viewing population drops at around8:00 A.M. to 9:00 A.M. This may imply that users are usu-ally on their way to work around this time of the day.
4.3 Health index of MoviesHealth index is used to reflect the effectiveness of the con-
tent replication strategy of a P2P-VoD system. In this sub-section, we focus on the health index of the three typicalmovies. Measurements were carried out in 24 hours from00:00, January 6, 2008 to 24:00, January 6, 2008.
Figure 9 illustrates the number of peers that own themovie. In here, owning a movie implies that the peer is stillin the P2P-VoD system, and that the peer has at least onechunk of that movie (similar to the movie-level heath index
0 12 24 36 48 60 72 84 96 108 120 132 1440
50
100
150
200
250
Time (Hour)
Nu
mb
er o
f u
sers
Number of users remaining in the P2P VoD system
Movie1Movie2Movie3
Figure 7: Number of viewing actions at each hourlysampling point (six days measurement).
0 12 24 36 48 60 72 84 96 108 120 132 1440
500
1000
1500
2000
2500
3000
3500
4000
4500
5000
Time (Hour)
Nu
mb
er o
f u
sers
Number of users within one hour
Movie1Movie2Movie3
Figure 8: Total number of viewing actions withineach sampling hour (six days measurement).
we discussed in Section 3). We can make two observationshere: (a) Movie 2 being the most popular movie, the num-ber of users owning the movie is higher than that of movie 1and 3. (b) The number of users owning the movie is lowestduring the time frame of 05:00 A.M. to 09:00 A.M. As wementioned in the previous subsection, this corresponds tothe period that the number of active peers is very low. Toprovide QoS-guarantee to users, one may need to allocatemore upload capacity to the server.
The previous measure is a coarse indication of the replica-tion health of a movie. One may choose a finer indicator toreflect the effectiveness of the replication. In here, we defineORi(t) to be the owning ratio of chunk i at time t, or
ORi(t) =Number of replicas of chunk i at time t
Number of movie owners at time t.
Again, a movie owner is a peer which possesses at least onechunk of that movie. If ORi(t) is low, it means low avail-ability of chunk i in the system. We average ORi(t) over a24-hour period and Figure 10 illustrates the average owningratios for different chunks in a 24-hour period. From thisfigure, we observe that the health index for “early” chunksis very good. This is due to the fact that many peers may
383

0 1 2 3 4 5 6 7 8 9 10 11 12 13 14 15 16 17 18 19 20 21 22 23 240
500
1000
1500
2000
2500
3000
3500
4000
4500
5000
5500
6000
6500
7000
Time of a day (Hour)
Nu
mb
er o
f u
sers
Number of users own the movie in one day
Movie1
Movie2
Movie3
Figure 9: Number of users owning at least one chunkof the movie at different time points
1 11 21 31 41 51 61 71 81 91 101 111 121 131 141 1510
0.1
0.2
0.3
0.4
0.5
0.6
0.7
0.8
0.9
1
Chunk Index
Rat
io
Average ratio users own chunks within one day
Movie1 (total # of chunks: 121)
Movie2 (total # of chunks: 67 )
Movie3 (total # of chunks: 151)
Figure 10: Average owning ratio for all chunks inthe three movies
browse through the beginning of a movie. The health indexof other chunks, is still acceptable since at least 30% of thepeers have those chunks.
To obtain a finer granularity of the health index, we com-pare the number of replication of chunk i versus the totalnumber of demand for chunk i. The total number of demandof chunk i in one day is derived from the user-behavior data,MVRs, and they were collected at the same measurementtime as the health index data (from 00:00, January 6, 2008to 24:00, January 6, 2008). Based on the starting viewingtime (ST), ending viewing time (ET) and the starting posi-tion (SP), one can determine which chunks a peer demandedduring the viewing action. Figure 11 shows the chunk avail-ability and chunk demand within a 24-hours measurementperiod. From the figure, we can conclude that: (a) Thehealth index for these three movies are very good since thenumber of replicated chunk is much higher than the work-load demand. (b) The large fluctuation of the chunk avail-ability for Movie 2 is due to the high interactivity of users.(c) Users tend to skip the last chunk of the movie (whichcorresponds to the movie epilog). To improve the quality ofviewing, one may want to provide an anchor point at thatposition.
Another way to evaluate the replication health of a movieis to determine the ratio between the number of available(or replicated) chunks to the number of chunks demandedas time evolves. Let ATDi(t) be the available to demandratio for chunk i at time t, or
ATDi(t) =Number of replicated chunk i at t
Number of demand for chunk i at t,
then the available to demand ratio for movie m at time t is:
ATDm(t) =
∑Ni=1 ATDi(t)
N,
where N is the total number of chunks for movie m. Figure 12shows the available to demand ratios, ATD1(t), ATD2(t)and ATD3(t) in a 24-hours period. Figure 13 shows thetemporal average (means) and standard deviations on thenumber of available (replicated) chunks of these three moviesin a 24-hours period.
0 1 2 3 4 5 6 7 8 9 1011121314151617181920212223240
10
20
30
40
50
60
70
80
90
100
Time (hour)
AT
D (
t)
The availabe to demand ratio of three movies in one day
Movie1Movie2Movie3
Figure 12: The ratio of the number of availablechunks to the demanded chunks within one day
0 1 2 3 4 5 6 7 8 9 1011121314151617181920212223240
1000
2000
3000
4000
5000
6000
7000
Time (Hour)
Val
ue
Mean and standard deviation of chunks of three movies in one day
Movie1 Movie2 Movie3
Figure 13: Temporal means and standard deviationsof the number of replicas of all chunks of these threemovies within one day
To provide good scalability and quality viewing, ATDi(t)has to be greater than 1. From Figure 12, we observe thatATDi(t) ≥ 3 for all time t. One can also observe from
384

1 11 21 31 41 51 61 71 81 91 101 111 1210
5000
10000
15000
20000
25000
Chunk Index
Nu
mb
er o
f ch
un
ks
Demand and available chunk volume in one day − Movie 1
AvailableDemand
1 7 13 19 25 31 37 43 49 55 61 660
10000
20000
30000
40000
50000
60000
Chunk Index
Nu
mb
er o
f ch
un
ks
Demand and available chunk volume in one day − Movie 2
AvailableDemand
1 16 31 46 61 76 91 106 121 136 1510
1000
2000
3000
4000
5000
6000
7000
Chunk Index
Nu
mb
er o
f ch
un
ks
Demand and available chunk volume in one day − Movie 3
AvailableDemand
Figure 11: Comparison of number replicated chunks and chunk demand of three movies in one day
Figure 13 that these three movies have high temporal meansand low standard deviations. This indicates that the overallreplication health of these video object is very good. Oneinteresting observation is that we have two peaks for Movie 2at 12:00 or 19:00. At these two peaks, the ATD2(t) and thetemporal mean of Movie 2 are very high. This is contributedby the fact that there is a large number of arrivals at thesetimes (refer to Figure 9) and all these users want to watchMovie 2.
4.4 User satisfaction indexUser satisfaction index is used to measure the quality of
viewing as experienced by users. A low user satisfactionindex implies that peers are unhappy and these peers maychoose to leave the system. As a result, this will reducethe service capacity and scalability of a P2P-VoD system.From the view point of a streaming content provider, this isprobably one of the most important measures that he/sheneeds to keep track.
To measure the user satisfaction index, we use the flu-ency F (m, i) as defined in Equation (1). The computationof F (m, i) was described in Section 3. Note that this com-putation is carried out by the client software in examiningall the MVRs generated during the viewing period. There-fore, the fluency computation is carried out in a distributedmanner. The client software reports all MVRs and the flu-ency F (m, i) to the log server whenever a “stop-watching”event occurs, that is, either the STOP button is pressed, oranother movie/programme is selected, or the user turns offthe P2P-VoD software.
We give a simple example in Figure 14 to illustrate thegeneration of MVRs and fluency index. As shown in Figure14, a user starts to watch the movie at time t0 and he dragsthe track-bar to position i at time t1. The first MVR iscreated (and stored in the peer’s local disk) at this time.After then, the user drags the track-bar again and jumps tothe (N−1)th position of the movie and the second MVR iscreated. Finally, the user presses the STOP button to stopviewing the movie at time t3. At this point, the last MVRis created and because it is a stop-watching event, the clientsoftware computes the fluency index F . All three MVRs aswell as the fluency index will then be transmitted to the logserver.
To quantify the fluency index, we collected one day worthof trace for the three movies and the measurement durationis the same as the measurement period of the movie healthindex data, that is, from 00:00, January 6, 2008 to 24:00,January 6, 2008. To reduce the amount of data traffic, sam-pling is carried out once every hour.
t0 t1 t2 t3 t
U1 M1 t0 t1 0U1 M1 t1 t2 iU1 M1 t
2t3
N-1
MVR1:MVR2:MVR3:
UID MID ST ET SP
0 1 2 3 .. .. i .... .. N-1 NMovie Length Position
b1 d1 b21 d21 b22 d22 b3 d3
MVR1 MVR2 MVR3
fluencyindex+
STOP
Figure 14: Example of generating fluency index
0 1 2 3 4 5 6 7 8 9 1011121314151617181920212223240
100
200
300
400
500
600
700
800
Time (Hour)
Nu
mb
er o
f fl
uen
cy r
eco
rds
Number of fluency indexes reported in one day
Movie1
Movie2
Movie3
Figure 15: Number of fluency indexes reported byusers to the log server
Figure 15 shows the number of fluency records that arereported to the log server at different times during the oneday period. The number of fluency records is a good indi-cator of the number of viewers of that movie. We observethat the number of viewers drops after 01:00. Then it startsto increase after 09:00 and reaches the peak around 16:00.The number of viewers drop afterward and again picks upafter 19:00 and reaches the second peak at time 24:00. Insummary, this figure illustrates the number of viewers in thesystem at different time points.
Figure 16 illustrates the distribution of fluency index ofthese three movies within a 24-hour period. First, we di-vide the fluency interval [0, 1] into ten sub-intervals: [0, 0.1),[0.1, 0.2), . . ., [0.9, 1.0). A fluency value greater than 0.8 is
385

[0,0.1) [0.1,0.2)[0.2,0.3)[0.3,0.4)[0.4,0.5)[0.5,0.6)[0.6,0.7)[0.7,0.8)[0.8,0.9) [0.9,1]0
5
10
15
20
25
30
35
40
45
50
Fluency ∈ [0, 1]
Per
cen
t (%
)
Distribution of fluency index of three movies in one day
Movie1 Movie2 Movie3
Figure 16: Distribution of fluency index of userswithin a 24-hour period
considered as having a good viewing quality while a fluencyvalue less than 0.2 is considered as having a poor viewingquality. One can observe that there is a high percentageof fluency indexes whose values are greater than 0.7. How-ever, around 20% of the fluency indexes are less than 0.2.One explanation of this phenomenon is that there is a highbuffering time (which causes long start-up latency) for eachviewing operation. This indicates an area for improvementin the current system.
One interesting question is how does the rate of changeof viewer’s population affects the fluency index. Figure 17shows the change in percentage of good fluency index (i.e.,fluency value between 0.8 and 1.0) and bad fluency index(i.e., fluency value between 0.0 and 0.2) when the number ofviewers changes. When the rate of change of viewer’s pop-ulation takes on a negative (positive) value, it implies thatthe number of viewers is decreasing (increasing). One canobserve that when the rate of change in viewer’s populationis of negative value, there is no effect on the percentage ofgood or bad fluency indexes. But when the rate of changein viewer’s population goes from negative value to positivevalue (which corresponds to a sudden increase in viewer’spopulation), then the percentage of good (bad) fluency in-dex will decrease (increase). This is contributed by the factthat more users need to spend time to buffer the data beforeviewing the video.
4.5 Server Load and NAT related statisticsFigure 18 shows the load conditions of one content pub-
lishing server within a 48-hour measurement period. Theserver provides 100 movies, and it is a Dell PowerEdge 1430server equipped with Intel DueCore 1.6GHz CPU, 4GB RAMand a Gigabit Ethernet Card. Figure 18 shows the uploadrate, CPU utilization and memory usage in the measurementperiod. As shown in Figure 18, the patterns of upload rateand CPU usage vary with time and this pattern is similarwith the pattern of number of users as shown in Figure 7.The server upload rate and CPU utilization are correlatedwith the number of users viewing the movies. Although weobserve that there are some periods with high upload de-mand and high CPU utilization, comparing to the resultsreported in [17] (a client/server architecture), one can con-clude that the P2P technology helps to reduce the server’s
load. The server has implemented the memory-pool tech-nique which makes the usage of the memory more efficientand this could be observed at the bottom sub-figure of Fig-ure 18 that the memory usage is very stable.
12:00 18:00 24:00 6:00 12:00 18:00 24:00 6:00 12:000
4080
120160200
Mb
ps
Upload rate
12:00 18:00 24:00 6:00 12:00 18:00 24:00 6:00 12:000
20406080
100CPU usage
Per
cen
t (%
)
12:00 18:00 24:00 6:00 12:00 18:00 24:00 6:00 12:00303234363840
Memory usage
Time (hour)
Per
cen
t (%
)
Figure 18: Server load within a 48-hour period.
Figure 19 shows the ratio of peers behind NAT boxesand Figure 20 shows the distribution of different NAT typeswithin a 10-day measurement period from May 3 to May12, 2008. From Figure 19, we observe that the ratio of peersbehind NAT boxes remains stable, around 80%. Figure 20implies that the Full Cone NAT has the largest proportion(47%) and the Symmetric NAT is the second (30%) andthe Port-restricted NAT is the third (23%) while there is noRestricted Cone NAT.
Table 4 illustrates the distribution of peers’ average up-load and download rate measured on May 12, 2008. A totalof 182544 peers are recorded. The average rate of a peerdownloading from the server is 32Kbps and 352Kbps fromthe neighbor peers. On the other hand, the average uploadrate of a peer is about 368Kbps. The average server loadingduring this one-day measurement period is about 8.3%.
Upload # of Peers Download # of Peers(Kbps) (%) (Kbps) (%)[0, 200) 65616(35.94%) [0, 360) 46504(25.47%)
[200, 360) 51040(27.96%) [360, 600) 118256(64.78%)[360, 600) 45368(24.86%) [600, 1000) 14632(8.01%)[600, 1000) 9392(5.14%) [1000, 2000) 3040(1.67%)
> 1000 11128(6.10%) > 2000 112(0.07%)Total 182544 Total 182544
Table 4: Distribution of average upload and down-load rate in one-day measurement period
5. RELATED WORKNowadays, P2P steaming technology attracts great re-
search interests. A number of P2P live streaming systemsare deployed with high viewing quality but low server bur-den, including CoolStreaming [21], PPLive [2], PPStream[6], UUSee [7], AnySee [19] and Joost [3] etc. Meanwhile, thetheoretical analysis and measurement on P2P living stream-ing applications could help to improve the viewing qualityand make the P2P live streaming system more robust andscalable. Hei et al. [18] have applied queueing theory and
386

0 1 2 3 4 5 6 7 8 9 101112131415161718192021222324−1
−0.9−0.8−0.7−0.6−0.5−0.4−0.3−0.2−0.1
00.10.20.30.40.50.60.70.80.9
1
Time (Hour)
Rat
io
Ratio of GOOD and BAD fluency vs. user increasing rate of Movie1
Ratio of fluency ∈ [0, 0.2]Ratio of fluency ∈ [0.8, 1]Increasing rate of users
0 1 2 3 4 5 6 7 8 9 101112131415161718192021222324−0.7−0.6−0.5−0.4−0.3−0.2−0.1
00.10.20.30.40.50.60.70.80.9
1
Time (Hour)
Rat
io
Ratio of GOOD and BAD fluency vs. user increasing rate of Movie2
Ratio of fluency ∈ [0, 0.2]Ratio of fluency ∈ [0.8, 1]Increasing rate of users
0 1 2 3 4 5 6 7 8 9 101112131415161718192021222324−1
−0.9−0.8−0.7−0.6−0.5−0.4−0.3−0.2−0.1
00.10.20.30.40.50.60.70.80.9
1
Time (Hour)
Rat
io
Ratio of GOOD and BAD fluency vs. user increasing rate of Movie3
Ratio of fluency ∈ [0, 0.2]Ratio of fluency ∈ [0.8, 1]Increasing rate of users
Figure 17: Comparison of the ratio of ”good”and ”bad” fluency vs. the rate of change in viewer’s populationwithin a 24-hour period
5/3 5/4 5/5 5/6 5/7 5/8 5/9 5/10 5/11 5/120
1
2
3
4
x 105
Date
Nu
mb
er o
f p
eers
Ratio of peers behind NAT
0
0.25
0.5
0.75
1
Ratio
Ratio of nodes behind NATPeers with Public IPPeers behind NAT
Figure 19: Ratio of peers behind NAT boxes withina 10-day period
stochastic fluid process to model the P2P streaming system.Zhou et al. [22] proposed a model to calculate the fillingprobability of streaming buffers based on a sliding windowmechanism. They have used the peers’ playing back conti-nuity and start-up latency as the performance metrics. Twokinds of measuring methods, passive sniffing [8], and activecrawling [15] have been applied to measure the existing P2Plive streaming software from the client side. Wu et al. [20]have reported results of a measurement from a popular P2Plive streaming system via the server side.
However, there are vital differences between live streamingand VoD streaming. For example, users’ interactive behav-iors like pausing and random jumping are allowed when theyare subscribe to VoD services but live streaming systems donot provide these features. As a result, the design and de-ployment of a real world P2P-VoD system is more difficultthan a P2P live streaming system.
In fact, on demand video streaming is not a new topicand the research begins since early 90’s. IP multicast basedproposals like patching [12], periodic broadcasting [16] andmerging [11] faced the deployment problems of IP multi-cast. Later on, there are a number of proposals for peer-assisted Video-on-Demand streaming such as tree-based ap-proach [14] and overlay tree based patching [13]. RecentlyHuang et al. [17] have carried out analysis through mea-surement and simulation on the data trace from an existingclient-server based VoD system. To the best of our knowl-
5/3 5/4 5/5 5/6 5/7 5/8 5/9 5/10 5/11 5/120
0.1
0.2
0.3
0.4
0.5
0.6
Date
Rat
io
NAT type distribution
Full Cone NAT Symmetric NAT Port−restricted NAT
Figure 20: Distribution of peers with different NATtypes within a 10-day period
edge, our work is the first to conduct an in-depth study onpractical design and measurement issues deployed by a real-world P2P-VoD system. In addition, we have measured andcollected data from this real-world P2P-VoD system withtotally 2.2 million independent users.
6. CONCLUSION AND REMARKSP2P-VoD streaming service is an up and coming applica-
tion for the Internet. As we prepare this paper, the P2P-VoDservice in PPLive is already supporting up to over 150K si-multaneous users, and we expect the number of users to growfurther. In this paper, we present a general architecture andimportant building blocks of realizing a P2P-VoD system.One can use this general framework and taxonomy to fur-ther study various design choices. The building blocks wepresented include the file segmentation strategy, replicationstrategy, content discovery and management, piece/chunkselection policy, transmission strategy and authentication.We also define various performance measures and illustratehow to instrument the measurement so as to evaluate thehealth of the systems and the user satisfaction (e.g., fluencyindex). We carried out a large scale measurement analysis toquantify the users’ behavior, the effectiveness of the replica-tion scheduling strategies, and the level of user satisfaction.In closing, this paper provides the general framework for fur-ther research in P2P-VoD systems, in particular, to addressthe following important issues: (1) how to design a highly
387

scalable P2P-VoD system to support millions of simultane-ous users; (2) how to perform dynamic movie replication,replacement, and scheduling so as reduce the workload atthe content servers; (3) how to quantify various replicationstrategies so as to guarantee a high health index; (4) howto select proper chunk and piece transmission strategies soas to improve the viewing quality; (5) how to accuratelymeasure and quantify the user satisfaction level.
7. REFERENCES[1] “Emule”, http://www.emule.com/.
[2] “PPLive”, http://www.pplive.com/.
[3] “Joost”, http://www.joost.com/.
[4] “GridCast”, http://www.gridcast.cn/.
[5] “PFSVOD”,http://www.pplive.com/subject/20070808pfsvod/.
[6] “PPStream”, http://www.ppstream.com/.
[7] “UUSee”, http://www.uusee.com/.
[8] S. Ali, A. Mathur, and H. Zhang. Measurement ofcommercial peer-to-peer live video streaming. In 1st
Workshop on Recent Advances in P2P Streaming,August 2006.
[9] B. Cohen. Incentives build robustness in bittorrent.http://bitconjurer.org/BitTorrent/bittorrentecon.pdf,May 2003.
[10] P. Dhungel, X. Hei, K. W. Ross, and N. Saxena. Thepollution attack in p2p live video streaming:measurement results and defenses. In Proceedings ofPeer-to-Peer Streaming and IP-TV workshop(P2P-TV’07), Kyoto, Japan, August 2007.
[11] D. Eager, M. Vernon, and J. Zahorjan. Bandwidthskimming: a technique for cost-effectivevideo-on-demand. In Proceedings of SPIE/ACMConference on Multimedia Computing and Networking(MMCN), San Jose, CA, USA, January 2000.
[12] L. Gao, D. Towsley, and J. Kurose. Efficient schemesfor broadcasting popular videos. In Proceedings of the8th ACM International Workshop on Network andOperating Systems Support for Digital Audio andVideo (NOSSDAV), Cambridge, UK, July 1998.
[13] Y. Guo, K. Suh, J. Kurose, and D. Towsley. P2cast:peer-to-peer patching scheme for vod service. InProceedings of the 12th ACM International WorldWide Web Conference (WWW), Budapest, Hungary,May 2003.
[14] A. A. Hamra, E. W. Biersack, and G. Urvoy-Keller. Apull-based approach for a vod service in p2p networks.In IEEE HSNMC, Toulouse, France, July 2004.
[15] X. Hei, C. Liang, Y. Liu, and K. W. Ross. Ameasurement study of a large-scale P2P iptv system.IEEE Transactions on Multimedia, 9(8):1672–1687,December 2007.
[16] A. Hu. Video-on-demand broadcasting protocols: acomprehensive study. In Proceedings of IEEEINFOCOM’01, Anchorage, AK, USA, April 2001.
[17] C. Huang, J. Li, and K. W. Ross. Can internetvideo-on-demand be profitable? In Proceedings ofACM SIGCOMM’07, Kyoto, Japan, August 2007.
[18] R. Kumar, Y. Liu, and K. W. Ross. Stochastic fluidtheory for p2p streaming systems. In Proceedings ofIEEE INFOCOM’07, May 2007.
[19] X. Liao, H. Jin, Y. Liu, L. M. Ni, and D. Deng.Anysee: Peer-to-peer live streaming. In Proceedings ofIEEE INFOCOM’06, April 2006.
[20] C. Wu, B. Li, and S. Zhao. Multi-channel live p2pstreaming: refocusing on servers. In Proceedings ofIEEE INFOCOM’08, April 2008.
[21] X. Zhang, J. Liu, B. Li, and T. S. P. Yum.Coolstreaming/donet: A data-driven overlay networkfor efficient live media streaming. In Proceedings ofIEEE INFOCOM’05, March 2005.
[22] Y. Zhou, D. M. Chiu, and J. C. S. Lui. A simplemodel for analyzing p2p streaming protocols. InProceedings of IEEE ICNP’07, October 2007.
388


![Is High-Quality VoD Feasible using P2P Swarming?of unstructured P2P networks, the authors in [28,38] propose to use mesh-P2P networks for live video streaming. Similarly to our approach,](https://img.dokumen.tips/doc/110x75/5f76b2fc1d22ab0b9c318091/is-high-quality-vod-feasible-using-p2p-swarming-of-unstructured-p2p-networks-the.jpg)