Embed Size (px)
Citation preview

LABORATORY MANUAL
ENGINEERING CHEMISTRY LABORATORY
(For First Year B.Tech. Programmes)
COURSE CODE: CY 151
(Images are used for the non-commercial academic purposes, non-profit)
Name of the student:
Roll No.:
Department of Chemistry
National Institute of Technology, Meghalaya

CH 151 Engineering Chemistry Laboratory
2
General instructions to the students
I. Laboratory safety
The following points are important and must be followed to avoid any kind of accidents
inside the laboratory:
a) Do not smoke, drink and eat inside the laboratory.
b) Try to wear laboratory coat and safety goggles.
c) Do not perform any unauthorized experiments without the permission of the
instructors.
d) For any kind of chemical burn, wash the area with plenty of water and inform your
instructor promptly.
e) Do not pipette out liquids by mouth use suction bulbs.
f) Do not try to smell, taste any chemicals without the instructions of the concerned
person.
g) Do not add water to the concentrated acids.
h) Do not touch any unknown chemicals by hands.
i) Before leaving the laboratory, wash your hands properly.
II. General rules
a) Try to understand the experiment before you start it. If you have any query, discuss
with the instructor.
b) If some reagent/apparatus is not found, ask your laboratory attendant.
c) Finish the experiments within the specified time period.
d) Regular submission of the laboratory note book is mandatory. Late submission will
not be entertained for evaluation.
e) Never use mobile phones inside the laboratory.
III. Scientific aspects
While you are in the process of writing laboratory notebook, please keep the following points
in mind:
a) Scientific notations
b) Proper units
c) Number of significant digits
d) Error analysis
e) Graphs
i. it must have a name and the axes should be specified
ii. the data points should be clear on the graph
iii. if possible, the error bars may be provided

CH 151 Engineering Chemistry Laboratory
3
List of experiments
Sl. No. Title of the experiment Page No.
1 Estimation of Fe(II) in Mohr’s salt solution using standard
KMnO4 solution via Redox titration.
5-8
2 Estimation of Fe(II) in a solution using standard K2Cr2O7
solution via potentiometric titration.
9-11
3 Precipitation titration of potassium chloride versus silver nitrate
(potentiometric titration).
12-14
4 Conductometric titration of an unknown acid solution using a
standard base solution.
15-17
5 Conductometric determination of CMC of a surfactant (sodium
lauryl sulphate).
18-21
6 pH-metric titration of an unknown acid solution using a
standard base solution.
22-24
7 Complexometric determination of hardness of water. 25-28
8 Determination of polymer molecular weight via viscosity
measurements.
29-32
9 Kinetic study of ester hydrolysis catalyzed by acid and base. 33-36
10 Spectrophotometry on copper sulphate solution. 37-39

CH 151 Engineering Chemistry Laboratory
4
Experiment No.: 1
Estimation of Fe(II) in Mohr’s salt solution using standard KMnO4 solution via Redox
titration.
Theory: Titrations in which a reducing agent is titrated against an oxidizing agent or vice
versa are called Redox titration. In a redox reaction if one substance is oxidized the other is
reduced. Oxidation is defined as the process in which loss of electron from the element takes
place and reduction is a process where electrons are accepted by the element or the ion. The
reagent which undergoes reduction is an oxidizing agent and the reagent which undergoes
oxidation is a reducing agent. The oxidation and reduction are complementary to one another
and takes place simultaneously.
The equivalent weight of an oxidizing and reducing agent can be obtained by dividing
molecular weight of the compound by the total number of electrons that are gained or lost in
a reaction per molecule of the substance.
As the change in colour in acid – base indicator depends on the pH of the reaction mixture,
the change in colour of the indicator in redox titration depends upon the electrode potential of
the system. Therefore, a redox indicator has to be chosen in such a way that its potential lies
within that of the system. In this titration, KMnO4, the oxidizing agent is the self indicator as
it is strongly coloured (purple) and decolorizes afterreduction. Potassium permanganate is
purple in its oxidized form (MnO4–) but its reduced form (Mn
2+) is colorless in acidic
medium.

CH 151 Engineering Chemistry Laboratory
5
As, the titration proceeds, the MnO4– will converted to Mn
2+ and simultaneously Fe
2+ will
converted to Fe3+
. When whole of the reducing agent (Fe2+
) will consumed, the oxidizing
agent (MnO4–) cannot be reduced, then the addition even one drop of KMnO4 solution given
its colour to the solution. This indicates the end point of the titration.
Apparatus: Burette, pipette, conical flask, burette stand and clamp
Chemicals: KMnO4, H2SO4, Mohr’s salt [(NH4)2SO4, FeSO4, 6H2O].
Procedure:
1. Primary standard Mohr’s salt solution was provided.
2. Secondary standard KMnO4 and unknown Fe(II) solution was provided.
3. Standardization of KMnO4 solution by standard Mohr’s salt solution: Pipette out 20
mL of standard Mohr’s salt solution into a 100 mL conical flask, add 20 mL of dilute H2SO4
(1:8 V/V). Titrate with standard KMnO4 solution from the burette with constant stirring till
the first permanent pink color develops in the solution. Repeat thrice.
4. Estimation of Fe (II) in the given solution: Pipette out 20 mL of unknown Fe(II) solution
in a 100 mL conical flask, add 20 mL of dilute H2SO4 (1:8 V/V). Titrate with standard
KMnO4 solution of known strength till the first permanent pink color develops throughout the
whole mass of the solution. Take minimum 3 readings.
CH 151 Engineering Chemistry Laboratory
6

CH 151 Engineering Chemistry Laboratory
7

CH 151 Engineering Chemistry Laboratory
8
Experiment No. 2:
Estimation of Fe(II) in a solution using standard K2Cr2O7 solution via potentiometric
titration
Theory: This experiment involves the determination of the percentage of ferrous iron in an
unknown samplemixture by redox titration with potassium dichromate solution as the
standard using:
(i) ferroin indicator
(ii) potentiometric titration.
The net ionic balanced equation for the titration is:
Apparatus:Burette, pipette, conical flask, burette stand, clampand potentiometer/pH-meter
with electrode.
Chemicals: K2Cr2O7 (M/40) solution, 1 M H2SO4, Mohr’s salt [(NH4)2SO4, FeSO4, 6H2O],
phosphoric acid (85%), indicator solution.
Procedure:
Standardization of K2Cr2O7 solution can be performed against a standard Mohr’s salt
solution using ferroin or diphenylamine indicator (optional for this experiment).
Do three (3) indicator titrations and one (1) potentiometric titration, not necessarily in that
order. For theindicator titrations, 20.0 mL aliquots of this unknown solution are titrated with
the K2Cr2O7 solution usingferroin as the indicator. The color change is from red to yellow
green. (The best is just as it changes colorwhich is when it is bluish grey in color).
For the potentiometric titrations, use the potentiometer in mV mode with a platinum indicator
electrode and acalomel reference electrode (set to (+) to have it fall within the scale; if it goes
below 0, switch it to make itreturn to scale). The ferroin indicator is not needed for this
titration. Carry out the titration using a 150 mLbeaker provided with a magnetic stirrer.
(check with the instructor or GA to make sure you are using thecorrect potentiometer). To
simplify obtaining a first derivative curve plot, add the titrants to change the mVreading by
0.03 mV at a time, recording the volume, VCr2O7:
[As an example only: Suppose that the initial mV reading is 0.20 mV. Add enough titrant to
increase thepotential to 0.23 mV. Proceed to 0.26 mV, etc. Note that as the endpoint is

CH 151 Engineering Chemistry Laboratory
9
reached a drop or less may causethe needle to change dramatically. It is important to control
the titrant volume to obtain good volumereadings for your titration curve.]
Observation and calculations:
To determine the end point in the potentiometric titrations, plot the following curves:
(i) E(mV) vs. volume (v in mL) of titrant,
(ii) ΔE/Δv (mV/mL) vs. average v (mL). (This second graph may be omitted if the first graph
allowsfor precise determination of the equivalence point.
Compare the results of the two types of titrations.
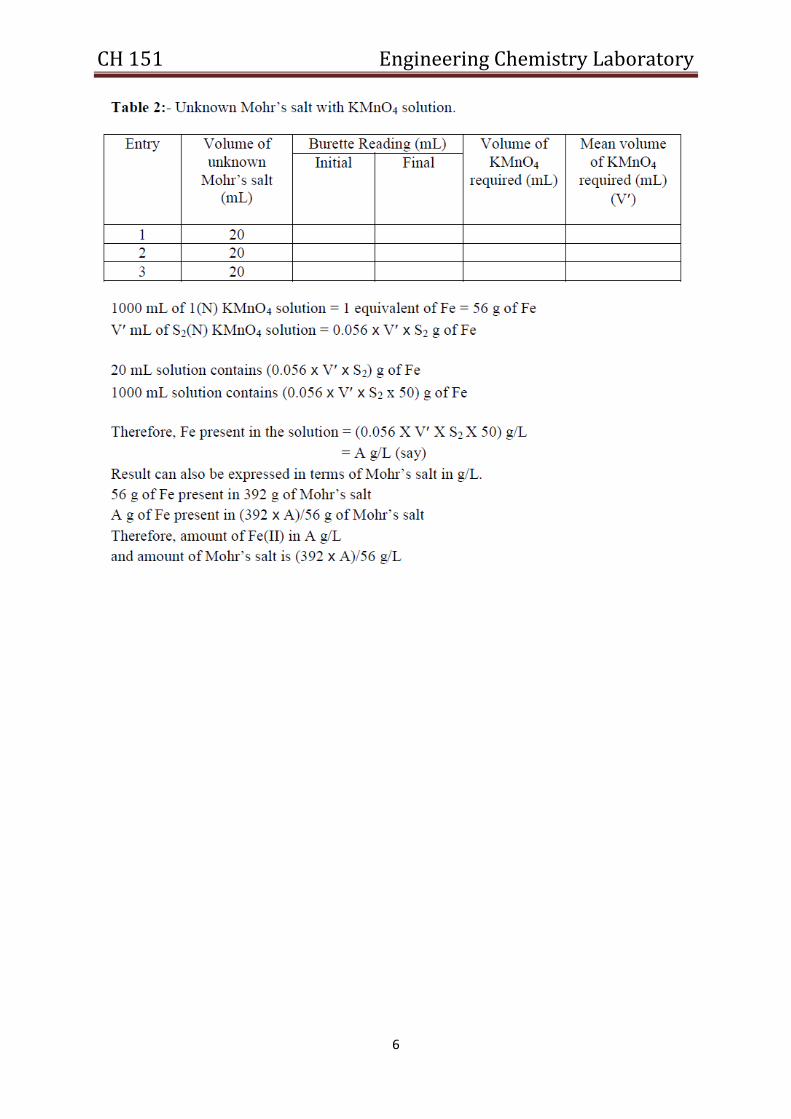
Table 1: First derivative plot for the determination of end point of the titration
ΔV = difference of the two subsequent volumes. A second-derivative curve of a log plot, i.e.
(Δ2mV/ΔV
2) vsavg. volume (Vavg), yields an evenmore accurate plot than the first-derivative
curve because a transverse line across the volume axis is obtainedat the endpoint. (treat this is
as optional).
Calculation of Fe in the sample:
We note that the 2 half reactions are:
(Note: similar type of calculation may be followed as mentioned in the expt. no. 2)
Precautions:

CH 151 Engineering Chemistry Laboratory
10
1. Dichromate is toxic to the environment. After the experiment, excess dichromate and
the analyte are to be discarded in the designated waste bottles located on the reagent
bench.
2. Dichromate solution should be freshly prepared.
3. Burette and pipette should be rinsed with the solution to be taken in it.
4. There should not be any leakage in the burette.
5. Concentrated sulfuric acid waste must be placed in the plastic, labeled acid waste
container under the acid fume hood. (Alternatively, it may be neutralized with sodium
bicarbonate safety solution)
Appendix: Standardization of K2Cr2O7 solution
1. Fill up the burette with the given K2Cr2O7 solution and mount the burette on a stand.
2. Pipette out 10 mL of standard solution of Mohr’s salt into a clean 250 mL titrating flask.
3. Add one test tube (10-15 mL) of dil. H2SO4 (1M) to the solution in the titration flask.
4. And then add half test tube (5-7 mL) of phosphoric acid.
5. Then add 5-6 drops of 1% diphenylamine indicator to the titration mixture and place the titration flask
over a glazed tile.
6. Start addition of K2Cr2O7 solution slowly from the burette, while giving a swirling motion to the
titration flask.
7. Continue the addition of K2Cr2O7 solution until a persistent violet colour is obtained.
8. Note the final reading of the burette and record it.
(Repeat in triplicates)

CH 151 Engineering Chemistry Laboratory
11
Experiment no: 3
Precipitation titration of potassium chloride versus silver nitrate (potentiometric
titration).
Introduction:
In this experiment you are going to perform a precipitation titration. EMF change during the
titration is measured by potentiometer. The equivalence point of the titration is detected by
plotting a titration curve.
Objectives:
After performing this experiment you will be able to:
• Discuss how the potential changes with change in the concentration of precipitated ions
during titration.
• Perform a precipitation titration of chloride ions using silver nitrate as precipitating agent.
• Determine the equivalence point of the titration by plotting titration curve using potential
change values and amount of precipitating agent added during titration.
• Estimate the chloride content in the given solution.
• State the advantages of potentiometry titrations.
• Practice the precautions while performing a potentometric titration experiment.
Theory
In this experiment, chloride ions are precipitated by addition of AgNO3 and change in
potential is measured by the potentiometer. The indicator electrode must be reversible to one
or the other of the ions which is being precipitated, therefore, for this experiment, the
electrode must be a silver electrode, which consists of a silver wire or a Pt wire plated with
silver and sealed in a glass tube. Since a halide is to be determined, the salt bridge must be a
saturated solution of KNO3-Agar.
The E.M.F. of the cell is given by
Ecell = Eo Ag+ /Ag – ESCE
Ecell = Eo Ag+ /Ag + RT ln [Ag+] = (Eo Ag+ /Ag – ESCE) + 0.0591 log [Ag+]
Since (Eo Ag+/Ag – ESCE) is constant at a given temperature; the EMF of the cell is directly
proportional to [Ag+] or concentration of Ag+ in solution.

CH 151 Engineering Chemistry Laboratory
12
Requirements
Apparatus:
Burette, pipette, volumetric flasks, beakers, magnetic stirrer, potentiometer, SCE, silver
indicator electrode, potassium nitrate-agar salt bridge, connecting wires etc.
Chemicals:
Silver chloride(AgCl), Potassium chloride(KCl), Potassium nitrate(KNO3) and agar.
Procedure
1. Prepare 0.1 M AgNO3 solution and solution of sodium chloride by dissolving 0.117 g KCl
in 100 cm3 distilled water.
2. Take the above prepared solution of KCl in a 250 cm3 beaker.
3. Use silver wire electrode (silver plated Pt wire) as the indicator electrode.
4. Ag-AgCl or calomel electrode is used as reference electrode separated from the solution by
a potassium nitrate-Ag or salt bridge. Potentiometer is standardised and the standard cell is
replaced with the working cell.
5. Add 2 cm3 0.1 M AgNO3. Use a magnetic stirrer for efficient stirring. After stirring the
solution for 2 minutes, stop stirrer and wait for a minute so that the EMF value becomes
steady, before noting the potential reading. Record your reading in the Observation Table.
6. Repeat this step, each time adding 2 cm3 of AgNO3 at a time, stirring, waiting of and
noting the potential value.
7. When the Volume of titrant reached near about 1 cm3 of the expected end point, add the
solution from the burette in 0.5 cm3 instalments and note the potential readings each time.
Continue these additions up to 5 cm3 more beyond the end point.
8. Draw the plot and find out the equivalence point. Calculate the amount of chloride from
the equivalence point.
Observations
Sr.No. Volume (V) of
AgNO3
added (cm3)
EMF of (E)
the cell
(millivolts)
Δ V Δ E Δ E/ Δ V
1
2
……………… …………….. …………… ………… ………… ………….
20

CH 151 Engineering Chemistry Laboratory
13
Calculations
Draw the titration plots E vs V and Δ E/ Δ V vs V using the values from observation Table 1.
Find out the equivalence point. Let it be V cm3 ……. cm
3.
Apply the molarity equation to calculate molarity of potassium chloride solution.
M1V1 = M2V2
(Silver nitrate solution) (KCl)
M2 =M1V1/V2 moldm–3
…………. moldm–3
= strength of Cl- ions …….. moldm
–3
Results
Strength of chloride ions in the solution is ………… moldm–3

CH 151 Engineering Chemistry Laboratory
14
Experiment No.: 4
Conductometric titration of an unknown acid solution using a standard base solution.
Theory: Electrolytic conductivity is a measure of the ability of a solution to carry electric
current. Electric solutions conduct electric current by the migration of ions under the
influence of electric field. According to Ohm’s Law, the current strength flowing through a
conductor is directly proportional to the potential difference (E) and inversely proportional to
the resistance (ρ) of the conductor.
i.e. I = E/R or, R = E/I
Where the resistance (R) is the hindrance provided by the solution. The resistance of any
conductor varies directly with the length and inversely with its area of cross-section.
R = ρ × (l/a)
Where, ρ is the specific resistance and it is the resistance of a unit length of conductor of unit
cross-section. l/a is called cell constant.
The reciprocal of specific resistance is called specific conductance or conductivity.
Specific conductance (κ) = 1/ ρ = (l/a) x (1/R)
Conductance of electrolyte depends upon i) number of free ions, ii) changes on the free ions
and iii) mobility of the ions on the substitution of one ion by another of different mobility
(speed of ions). So, conductometric method can be used to determine the end point of ionic
titrations like i) acidimetric titration, ii) precipitation titration, iii) titration involving the
formation of complex ion.
When hydrochloric acid solution (HCl) is titrated with sodium hydroxide solution (NaOH),
the highly mobile hydrogen ions (λ°H
+ = 350 ohm
–1 cm
–1) are progressively replaced by
slower moving sodium ions (λ°Na
+ = 50 ohm
–1 cm
–1) and the conductance of the solution
decreases. After the end point, the conductance of the solution rises sharply due to the
presence of excess, highly mobile hydroxide ion (λ°OH
- = 198 ohm
–1 cm
–1). Thus the
neutralization of a strong acid by addition of a strong base leads to a minimum conductance
at the end points. This is due to the disappearance of H+ ions and theirreplacement by slower
moving Na+ ions of the base followed by the presence of highly mobile OH
–ions after the end
point.
Therefore the nature of the plot (conductance of the solution versus volume of base added)
will be as given below:

CH 151 Engineering Chemistry Laboratory
15
Figure 1:Conductometric titration of a strong acid against a strong base.
The conductivity cell used for this titration should permit stirring by shaking and to which the
reagent can be added from burette. A large increase in volume during titration should be
avoided.
Apparatus: Conductometer, conductivity cell, beaker, pipette, burette, conical flask.
Chemicals: Hydrochloric acid (HCl), sodium hydroxide (NaOH), conductivity water.
Procedure:
1. HCl solution of unknown strength is provided.
2. 0.1 (N) NaOH solution is provided.
3. Calibration of the instrument done at room temperature.
4. Conductometric Titration:
i) Rinse the conductivity cell a number of times with conductivity water or double distilled
water.
ii) Pipette out 20 mL of HCl in a beaker and dip the conductivity cell in it, so that the cell
should dip completely in solution.
iii) Note the temperature of the sample solution and accordingly set the temperature control
or keep the cell in a thermostat at room temperature.
iv) Add small amount of NaOH solution (few drops) from burette, stir it and measure the
conductance after each addition.
v) Take at least five readings beyond the end point.

CH 151 Engineering Chemistry Laboratory
16
Plot a graph between conductance and volume of titrant (NaOH solution). Two intersecting
lines will be obtained (as given in the Figure 1) and the points of intersection of these lines
represent the equivalent point.
Conclusion: The strength of the acid is ______ (N)
Discussions:
i) Normally, the coloured solution which cannot be titrated with volumetric method using
indicator can be titrated by the conductometric method.
ii) The conductometric titration method can be used in case of weak acid vs. weak base and
also in case of very dilute solutions.
iii) Near the end point, no special case is necessary as it is determined graphically.
Precautions:
i) Electrical connection should be made carefully.
ii) Temperature during the experiment should be kept constant as conductance depends on
temperature.
iii) Stirring should be done after each addition of titrant.
iv) To avoid the dilution effect, the concentration of the titrant should be 5-10 times more
than that of the solution to be titrated.

CH 151 Engineering Chemistry Laboratory
17
Experiment No.: 5. Conductometric determination of CMC of a surfactant (Sodium
lauryl sulphate)
Theory: Surfactants are organic substances, which significantly decrease the surface tension
of water at relatively low concentrations and are, at least partially, water soluble. Because
surfactants are adsorbed mainly on the surface of the solution, creating a thin monolayer, they
are called surface active substances. Surfactants form numerous group of various natural and
synthetic compounds, in common practice their mixtures are used as soaps and detergents.
When dissolving them, after they reach a certain value of concentration, molecules or ions of
surfactants begin to associate and to organize themselves into more complex units, called
micelles. The characteristic concentration value, where the association process begins, is
called the critical micelle concentration and it is labelled with symbol c or abbreviation
CMC. The molecular structure of surfactant is amphiphilic, i.e., it consists of both non polar
(hydrophobic) and polar (hydrophilic) parts.
The hydrophilic part of the structure may be represented by non-ionic polar groups or ionic
groups and in this sense we distinguish between non-ionic surfactantsand ionic surfactants.
Further, the ionic surfactants are divided into the following classes:
• anionic surfactants - e.g. sodium lauyrl sulphate(SLS)
• cationic surfactants - e.g. quaternary ammonium salts
• ampholytic surfactants – e.g. long-alkyl amino acids
SLS, synonymously sodium dodeul sulphate (SDS) is dissociatedinto the surface active anion
[CH3(CH2)11OSO3-] and sodium cation [Na
+] (counter ion) in the aqueous solution. The
surface active amphiphilic anions are adsorbed on the water surface where they create a
characteristic monolayer. The lipophilic dodecyl alkyls -CH3(CH2)11 are oriented outside
from the water surface, while the hydrophilic -OSO3-
head groups are directed into the
aqueous environment (Figure 2b). When the concentration of SLS reaches its corresponding
CMC value, the dodecyl sulfate anions start to aggregate into the negatively charged globular
micelles(Figure 2c). The lipophilic core of the micelles is built up from the non-polar
hydrocarbon alkyl chains, while the anionic groups are localized on the micelle surface
oriented to the polar aqueous environment. Negatively charged micelles bind by electrostatic
forces certain fraction of the Na+counterions or other cations which may be present in the
solution.

CH 151 Engineering Chemistry Laboratory
18
Figure 2Association of surfactants
Principles of determination of CMC
The determination of CMC is generally based on the localization of the position of a breaking
point in the concentration dependencies of selected physical or chemical properties of
surfactant solutions. The conductometric method is based on the finding of a breaking point
on the curves, which describe the concentration dependence of conductivity. It is well-
known, that the conductivity of any solution is directly proportional to the concentration of its
ions. The point, where the micelle formation starts, is indicated on the concentration
dependence of specific conductivity (κ) as a breaking point. It is easy to find the breaking
point, because it marks a significant change the slope of the linear dependence:
κ =f(c)
Figure 1 The specific conductivity (a) and molar conductivity (b) as a function of
concentration
The solution of surfactant behaves as the strong univalent type of electrolyte in the
concentration range below the CMC and the linear function of dependence of the molar
conductivity on the second root of concentration has a small negative slope. This
concentration dependence of the molar conductivity is thus described by the
Onsager equation: Ʌ = Ʌo - a. √c[S m2 mol
-1 ]
where, Ʌo is the corresponding molar conductivity at the infinities dilution and c is the
concentration of the studied surfactant.
a b

CH 151 Engineering Chemistry Laboratory
19
Values of the molar conductivity are calculated from the experimental values of specific
conductivity (𝜿) and the molar concentration of solution. The basic unit of this quantity is S
m2 mol
-1.
Apparatus:Conductometer, conductivity cell, beaker, pipette, burette, conical flask.
Chemicals: Sodium lauryl sulphate (C12H25NaSO4), Sodium chloride (NaCl).
Procedure:
1. Use redistilled water for all measurements.
2. Prepare 25 ml of 0.04 M aqueous stock solution of SLS.
3. Pipette 25 ml of water into the conductance cell. Add 0.5 ml SLS stock solution using a
pipette. Stir the solution slowly for a minute or two (without creating too many bubbles) and
then read the conductance.
4. Add additional 0.5 ml stock solution and measure the conductance. Continue the process of
adding stock solution and measuring conductance until 40-45 aliquots have been added.
5. In order to study the effect of electrolyte, prepare 100 ml of ~0.02 M NaCl solution. Use
this as solvent for making up 25 ml of ~0.04 M aqueous stock solution of SDS. Pipette 25 ml
of salt solution into the conductance cell and measure the conductance. Add 0.5 ml of the
SLS stock solution and record the conductance. Repeat the same for about 30-40 additions.
6. Prepare appropriate Table to record the conductance and [SLS] data.
7. Find out the cell constant of the conductivity cell using standard KCl solution and convert
the conductance values into specific conductance (κ) and molar conductance (Λm). Then plot
𝜿 vs [SLS] and Λm vs [SLS] and determine CMC.
8. Compare the estimated CMC of SLS with the literature value.
Observation and Calculation:
Table 1 Measured and calculated values for the determination of CMC of the SLS
t = .................°C
c c √c V
𝜿 𝜿 Ʌ
(mol dm-3
)
(mol m-3
)
(moldm-
3)1/2
(ml)
(µS cm-1
)
(S m-1
)
(S m2mol
-
1)
CMC = .......................mol dm-3

CH 151 Engineering Chemistry Laboratory
20
Discussions:
(i) In this experiment, the CMC of SLS, is measured by following the variation of specific
or/and molar conductivity of the solution as a function of the concentration of SLS.
(ii) Below the CMC, addition of SLS to an aqueous solution increases the number of change
carriers and hence, the conductivity.
(iii)Above CMC, addition of surfactants increases the micelle concentration maintaining the
monomer concentration approximately same. As micelles are much larger than the monomers
and diffuse more slowly, the conductivity increases much slowly beyond the CMC.
(iv)Thus, CMC can be determined from the break point in the plot of specific/molar
conductivity versus [SLS].

CH 151 Engineering Chemistry Laboratory
21
Experiment No.: 6
pH metric titration of an unknown acid solution using a standard strong base solution.
Theory: Most of the chemical and biochemical processes are profoundly affected by the
acidity or alkalinity of the medium in which the reaction takes place. All acid dissociate in
aqueous solution to yield H+ ions. Some acids like HCl, H2SO4, HNO3 etc. are completely
ionized in aqueous medium where as CH3COOH, HCOOH etc. ionize to a small extent only.
The former is known as strong and the later as weak acid. pH of any solution is defined as (–
log H+) and has values between 0–14. pH< 7 indicate acidic solution, pH > 7 indicate basic
solution and pH = 7 means neutral solution.
The pH of a solution can be measured accurately with the help of a pH meter. Measurement
of pH is employed to monitor the cause of acid-base titration. The pH values of the solution
at different stage of acid–base neutralization are determined and plotted against the volume of
alkali added on adding a base to an acid, the pH rises slowly in the initial stages as the
concentration of H+ ion decreases gradually. But, at the equivalence point, it increases
rapidly as at the equivalent point H+ ion concentration is very small. Then it flattens out after
the end point. The end point of the titration can be detected where the pH value changes most
rapidly. However, the shape of the curve depends upon the ionizability of the acid and the
base used and also on the acidity of base and basicity of the acid.
Apparatus: pH meter, electrode, beaker, pipette, burette.
Chemicals: Hydrochloric acid (HCl), sodium hydroxide (NaOH), buffer of pH = 4 and 9.2.

CH 151 Engineering Chemistry Laboratory
22
Procedure:
1. 0.1(N) NaOH solution is provided.
2. HCl solution of unknown strength is provided.
3. Switch on the instrument and wait for 10–15 minutes so that machine gets warmed up.
Prepare the buffer solution by adding buffer tablets of pH = 4 and pH = 9.2 in 100 mL of
water separately. Wash the electrode with distilled water. Then, dip the electrode in the buffer
solution (pH = 4) taken in a beaker, so that the electrode immersed to the solution properly.
Measure the temperature of the solution and set the temperature compensate control
accordingly. Set the pointer to pH = 7 exactly means of set = 0 control. Put the selector
switch to proper pH range 0–7 (as the buffer pH = 4). So the pointers to the known pH value
of the buffer by burning the set buffer control. Put back the selector at zero position. Wash
the electrode with distilled water and standardize the pH meter using basic buffer solution pH
= 9.2. Same procedure to be followed except the selector switch is put to range of 7–14.
4. pH-metric Titration: Clean the electrode with distilled water and wipe them with tissue
paper or filter paper. Take 20 mL of HCl solution in a 100 mL beaker or conical and immerse
the electrode in it. Set the burette with NaOH solution. Put the selector at the expected range
(0–7). The reading shown on the scale of pH meter is pH value of the HCl solution. Add
NaOH solution drop wise from the burette (maximum 0.5 mL at a time), shake the solution
well and note the corresponding pH values. Near the end point, volume of NaOH added
should be as small as possible because the acid is neutralized and there will a sharp increase
in pH values. Further addition of even 0.01 mL of NaOH, increase the pH value to about 9–
10. Put back the selector to zero position after pH measurement, and always keep the selector
at zero position when it is not in use.

CH 151 Engineering Chemistry Laboratory
23
Conclusion: The strength of the unknown HCl is ________.(N)
Precautions:
i) Electrodes must be immersed in the solution properly and sufficient time to be allowed for
the electrodes to obtain the temperature of the solution.
ii) pH meter should be calibrated before the experiment.
iii) Magnetic stirrer may be used or the solution be stirred mechanically from time to time
during pH metric titration.
iv) Leave the selector in zero position where it is not in use.

CH 151 Engineering Chemistry Laboratory
24
Experiment No.: 7
Complexometric determination of hardness of water.
Theory: The property of water which restricts or checks the lather formation with soapis
called hardness. In other words, the presence of multivalent cations, mostly calciumand
magnesium ions, in water is referred to as hardness of water. Hardness is of twotypes:
Temporary or carbonate hardness which can be removed by boiling and Permanentor
Noncarbonate hardness which cannot be removed by boiling.
The hardness is usuallyexpressed in parts of CaCO3 equivalent or calcium and magnesium
salts per million partsof water i.e in ppm.The hardness of water can be determined by
complexometric titration using Ethylenediammine tetra acetic acid (EDTA). EDTA in the
form of its di-sodium salt formscomplex with Ca2+
and Mg2+
ions of water sample. When
Eriochrome Black T (EBT)indicator is added to the hard water at pH around 9–10, it gives
wine red colored unstablecomplex with Ca2+
and Mg2+
ions of water sample. When this wine
red colored complexis titrated against EDTA solution of known strength the Ca2+
and Mg2+
ions forms stablemetal complex with EDTA and color changes from wine red to blue (color
of EBT indicator) at the end point.
So titration at pH about 9–10 using EBT indicator gives the total amount of Ca
2+ andMg
2+
ions in the water sample.Titration against EDTA at pH around 12.5 gives the hardness due to
Ca2+
only. A pH ofabout 12.5 required for this titration can be obtained by adding diethyl
amine base with 3-4 drops of calcon indicator or NaOH base with murexide indicator. At this
high pH, theMg2+
ion is quantitatively precipitated as Mg(OH)2 and Ca2+
ion alone can be
estimatedby complexometric method using EDTA. At the end point color changes from pink
topure blue.

CH 151 Engineering Chemistry Laboratory
25
Apparatus: Conical flask, burette, pipette, and measuring cylinder.
Chemicals: EDTA, Zn(OAc)2, NH4Cl, NH4OH, Eriochrome Black T (EBT), Calcon,NaOH
and ethyl alcohol.
Procedure:
1. Primary standard Zn(OAc)2 solution was provided.
2. Secondary standard EDTA solution and NH4Cl–NH4OH buffer solution wereprovided.
3. Standardization of EDTA solution: Pipette out 10 mL of Zn(OAc)2 solution in 100mL
conical flask, add 5 mL of NH4OH solution (to neutralize the residual acid in thesolution), 5
mL of buffer solution and 4–5 drops of EBT indicator. The solutionbecomes wine red color.
Titrate with EDTA solution from the burette till the colourchanges to clear blue. Repeat three
times and find out the strength of EDTA fromknown strength of Zn(OAc)2 solution.
4. Estimation of Ca2+
and Mg2+
in water: Pipette out 20 mL of hard water sample in a100
mL conical flask, add 5 mL of NH4OH solution (to neutralize the residual acid inthe
solution), 5 mL of buffer solution and 4–5 drops of EBT indicator. Titrate withstandard
EDTA solution till wine red color changes to clear blue. Repeat three times.
5. Estimation of Ca2+
in presence of Mg2+
in water: Pipette out 20 mL of watersample in a
100 mL conical flask, add 3 mL of diethyl amine/NaOH solution. Shakethe solution
thoroughly to precipitate all Mg2+
ions as Mg(OH)2. Add 4-5drops ofcalcon indicator and
titrate with standard EDTA solution till the pink colour of thesolution changes to clear blue.
Repeat three times.

CH 151 Engineering Chemistry Laboratory
26

CH 151 Engineering Chemistry Laboratory
27
Discussion:
To determine the temporary and permanent hardness separately in the water sample,same
EDTA method can be used first to determine the total hardness (H1). Then boil thesample
water gently for about one hour, cool it and filter it. Take this sample of water andestimate
the permanent hardness (H2) by the same EDTA method. As it is known that,temporary
hardness can be removed just by boiling. The difference (H1−H2) is thetemporary hardness
in the given water sample.
Precautions:
i) All the glass apparatus should be washed thoroughly with distilled water before use.
ii) The burette and pipette should be rinsed with solution to be taken in it.
iii) There should not be any leakage in the burette.
iv) All the solution should be freshly prepared.
v) Same amount of indicator should be added each time.
vi) pH of the solution should be maintained during titration.
vii) Shaking should be proper during titration.
viii) The titration flask should be placed on white paper or board to identify properly
thecolour change at the end point.

CH 151 Engineering Chemistry Laboratory
28
Experiment No.: 8
Determination of polymer molecular weight via viscosity measurements.
Objectives:
Determine the absolute viscosity of Polymer solutions of different concentrations
Determine the viscosity average molecular weight of a polymer.
Theory:
Viscosity is an internal property of a fluid that offers resistance to flow. It is due to the
internal friction of molecules and mainly depends on the nature & temperature of the liquid.
The Ostwald method is a simple method for the measurement of viscosity, in which viscosity
of liquid is measured by comparing the viscosity of an unknown liquid with that of liquid
whose viscosity is known. In this method viscosity of liquid is measured by comparing the
flow times of two liquids of equal volumes using same viscometer.
Consider two liquids are passing through a capillary of same viscometer. Then the coefficient
of viscosity of liquid (η2) is given by equation
Here t1 and t2 are the time of flow of the liquids and ρ1 and ρ2 are the respective densities and
η1 is the coefficient of viscosity of water.For a given liquid η has a specific value at the same
temperature.Various mixtures of two non-interacting liquids viscosities will lie among the
viscosities of those pure components.The time of flow of liquid depends on the viscosity and
composition. In this method the flow times are measured for different known compositions
and a graph is plot for time of flow and compositions. The unknown composition can be
determined by plotting a graph for the time of flow and compositions.The molecular weight
of the polymer is measured by using viscometer and the molecular weight obtained by this
technique is called viscosity average molecular weight. The molecular weight of the polymer
solution is very high so the viscosity of polymer solution is very high compared to that of
pure solvent. From the Mark-Houwink equation the relationship among the molecular weight
and viscosity are given below
Where [η]is the intrinsic viscosity,M is Molecular weight,K and α are constants for a
particular polymer solvent system.If we know theK and α values for a given polymer
solution the intrinsic viscosity and molecular weight can be calculate using the above
equation.
Polymer-solvent system K x 103mL/g
PMMA-Acetone 7.70 0.70
PMMA-Benzene 5.20 0.76
PMMA-Toluene 7.0 0.71
Poly vinyl acetate-Acetone 10.2 0.72
Poly vinyl acetate-Benzene 56.3 0.62
Poly vinyl acetate-Acetonitrile 41.5 0.62

CH 151 Engineering Chemistry Laboratory
29
Polymer-solvent system K x 103mL/g
Poly vinyl alcohol-Water 45.3 0.64
Poly styrene-Benzene 10.6 0.735
Poly styrene-Toluene 11.0 0.725
Terms Related to Viscosity Measurements:-
Relative Viscosity =
Specific Viscosity =
Reduced Viscosity =
Inherent Viscosity =
Intrinsic Viscosity =
For measuring intrinsic viscosity of polymer sample, solutions of known concentrations are
prepared, the flow times of solvent (t0) and the solutions (t) are measured using viscometer.
Double extrapolation plots of reduced viscosity against concentration and inherent viscosity
against concentration is plotted by calculating the corresponding reduced viscosity and
inherent viscosity. The intrinsic viscosity is given by the common ordinate intercept of these
graphs.
Materials Required:
1. Ostwald Viscometer
2. Stop Watch
3. Sucker
4. Pipette

CH 151 Engineering Chemistry Laboratory
30
Reagents:
Solvents:Acetonitrile, Acetone, Water, Toluene, Benzene
Polymer: Polyvinyl acetate, PMMA, Polymer Alcohol, Polystyrene
Procedure:
Determining the Intrinsic Viscosity of the Polymer- solvent system:
1. Select the Polymer and solvent.
2. Determine the Time of flow of the solvent (t0).
3. Determine the time of flow of polymer-solvent system at different concentrations.
4. From the concentration and time of flow, the inherent viscosity and reduced viscosity
are calculated using the equations:
Inherent Viscosity =
Reduced Viscosity =
5. A graph is drawn by plotting reduced viscosity against concentration and inherent
viscosity against concentration.
6. Intrinsic viscosity can be obtained by extrapolating the graph to zero concentration.
7. From the value of intrinsic viscosity, the viscosity average molecular weight of the
polymer can be calculated by using the equation.
Observations and Calculations:
Conc:
(g/dl)
Flow Time of
Polymer-
Solvent system
(t) sec
Flow Time
of Solvent
(t0) sec
Reduced
Viscosity,
Inherent
Viscosity,
0.02
0.04
0.06
0.08
0.1

CH 151 Engineering Chemistry Laboratory
31
Result:
The viscosity average molecular weight of the Polymer, M is =.....................................
Points to Remember while Performing the Experiment in a Real Laboratory:
1 Always wear lab coat and gloves when you are in the lab. When you enter the lab,
switch on the exhaust fan and make sure that all the chemicals and reagents required
for the experiment are available. If they are not available, prepare the reagents using
the components for reagent preparation.
2. Make sure to clean all your working apparatus with chromic acid and distilled water
and ensure that all the apparatus are free from water droplets while performing the
experiment.
3. Make sure to calibrate the electronic weigh balance before taking the measurements.
4. Ensure that the stop watch and hot air gun are working properly.
5. Clean all glassware with soap and distilled water. Once the experiment is completed
recap the reagent bottles. Switch off the light, and exhaust fan before leaving the lab.
6. Discard the used gloves in a waste bin.

CH 151 Engineering Chemistry Laboratory
32
Experiment No.: 9
Kinetic study of ester hydrolysis catalyzed by acid or base.
Theory:
Chemical kinetics is the part of physical chemistry that studies reaction rates. The
reactionrate or rate of reaction for a reactant or product in a particular reaction is intuitively
definedas how fast a reaction takes place.
For a generic reaction:aA + bB→ C, the simple rate equation is of the form:
The concentration is usually in mol dm
-3 and k is the reaction rate coefficient or rate
constant.Although it is not really a constant, because it includes everything that affects
reaction rateoutside concentration: mainly temperature, ionic strength, surface area of the
adsorbent orlight irradiation.The exponents a andb are called reaction orders and depend on
the reaction mechanism. Thestoichiometric coefficients (a, b) and reaction orders are very
often equal, but only in one stepreactions, molecularity (number of molecules or atoms
actually colliding), stoichiometry andreaction order must be the same.The Arrhenius
equation is a simple, but remarkably accurate formula for the temperaturedependence of the
rate constant, and therefore rate of a chemical reaction. TheArrhenius equation gives:
"the dependence of the rate constant (k) of chemical reactions on the temperature (T)
(inKelvin) and activation energy (Ea) ", as shown below:
where: A – is the pre-exponential factor or simply the prefactor
R – is the molar gas constant.
The units of the pre-exponential factor are identical to those of the rate constant and will
varydepending on the order of the reaction. It can be seen, that either increasing the
temperature ordecreasing the activation energy (for example through the use of catalysts) will
result in anincrease in rate of reaction.The activation energy can be interpreted as the
minimal energy of the molecules to undergoreaction.
The Second Order Reactiondepends on the concentrations of one second-order
reactant ortwo first-order reactants:
2A → Products
A + B → Products
For a second order reaction, its reaction rate is given by:
We will deal with the bimolecular reaction, supposing the same initial concentrationofA and
B reactants:

CH 151 Engineering Chemistry Laboratory
33
The differential rate law for the second-order reaction is then:
Solving the differential equation, one can obtain:
where: c – is the concentration of reactant at time t →
k – is the second-order constant, which has dimension concentration-1
time-1
(eg.dm3 mol
-1s
-1)
In this case, a characteristic plot which will produce a linear function is:
with theslope = k
Figure 1 Plots c = f(t) and 1/c = f(t) for a second-order reaction
The half-life of reactiondescribes the time needed for half of the reactant to be depleted.
Thehalf-life of a second-order reaction, which depends on one second-order reactant, is:
Task:
Determine the rate constant of the alkaline hydrolysis of ethyl acetate using sodium
hydroxide.This experiment illustrates a bimolecular reaction (reacting species are ethyl
acetate andsodium hydroxide):
CH3COOCH2CH3 + NaOH→ CH3COONa + CH3CH2OH

CH 151 Engineering Chemistry Laboratory
34
Equipments and chemicals:
Thermostat, pipettes, burette, volumetric flasks,titrimetric flasks, stop-clock, solution of ethyl
acetate (c = 0.04 mol dm-3), solution of sodium hydroxide (c = 0,04 mol.dm-3), solution of
hydrochloric acid (c = 0.04 mol.dm-3), phenolphthalein.
Procedure:
1.Transfer 50 ml of the solution of ethyl acetate (c = 0.04 mol dm-3
) into a volumetric flask
(V=50 ml) and 50 ml of the solution of sodium hydroxide (c = 0.04 mol dm-3
) into another
volumetric flask (V=200 ml).Both flasks cork down and put them in the thermostated bath (t
= 20 °C).
2.Fill the burette with the solution of sodium hydroxide (c = 0.04 mol dm-3
).
3.Pipette VHCl= 5 ml solution of hydrochloric acid (c = 0.04mol dm-3
) into a clean and dry
titrimetric flask.
4.After 10 minutes, take out the flasks with the solutions from the thermostated bath and pour
the solution of ethyl acetate to the solution of sodium hydroxide, put the mixture to
thethermostated bath.Start the stop-clock.
5.5 minutes after mixing, pipette 10 ml of reaction mixture (leave the flask in the bath!) to
the titrimetric flask (with 5 ml of HCl - VHCl).
Remark: HCl stops the reaction.
6.Titrate with the solution of sodium hydroxide adding 1 drop of phenolphthalein as
indicator.When the endpoint of titration has been reached, read the used volume of NaOH
from theburette (VNaOH). Write it down to the Table 1.
7.Repeat the step 5 and 6 every 5 minutes six times more (in the 10th, 15th, 20th, 25th,
30th
and 35th minutes from the moment of mixing).
8.Write down to the Table 1 the temperature of the bath.
9.Repeat the same experiment at 30 °C. Because the reaction is faster, the times for titrations
will be in the 5th, 10th, 15th, 20th, and 25th min. from the mixing.
Write down to the Table1 the used volume of NaOH for each titration.
Table 1 Measured and calculated values
Data treatment
1.Calculate the concentration (c) in the Table 1 according to:

CH 151 Engineering Chemistry Laboratory
35
where: cHCl- is concentration of HCl (cHCl= 0.04 mol dm-3
)
VHCl- is the volume of HCl (5 ml)
cNaOH - is concentration of NaOH (cNaOH= 0.04 mol dm-3
)
VNaOH- is the volume of NaOH from Table 1 (ml)
V - is the volume of the reaction mixture used in titration (10 ml)
2.Calculate the 1/c values.
3.Use MS Excell to create the dependence 1/c = f(t) at given temperature.
Fit the experimental points with a linear function. The slope represents the value of the rate
constant (k) at given temperature.If the time is in minutes, the unit of the rate constants is
dm3 mol
-1 min
-1.
Report
The report must include: Theoretical principles, Equipments and chemicals, Experimental
procedure and measurements, Table of results, calculations, diagrams 1/c = f(t) at two
temperatures.
CH 151 Engineering Chemistry Laboratory
36
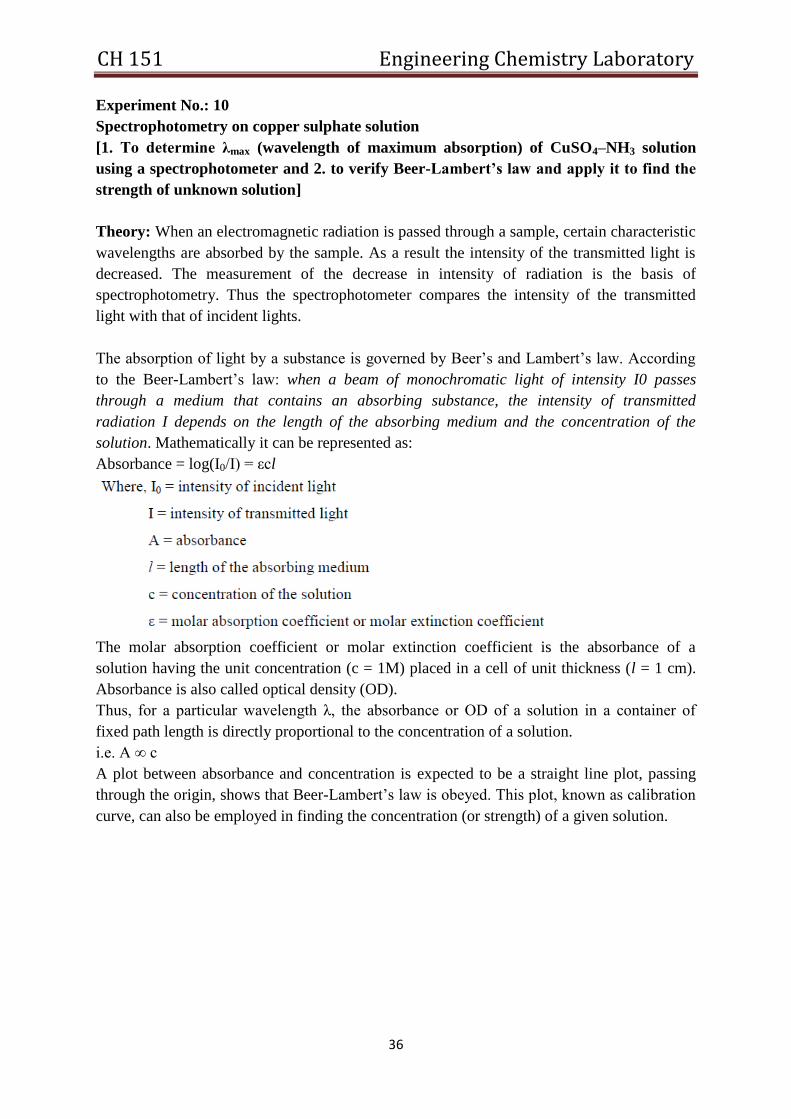
Experiment No.: 10
Spectrophotometry on copper sulphate solution
[1. To determine λmax (wavelength of maximum absorption) of CuSO4–NH3 solution
using a spectrophotometer and 2. to verify Beer-Lambert’s law and apply it to find the
strength of unknown solution]
Theory: When an electromagnetic radiation is passed through a sample, certain characteristic
wavelengths are absorbed by the sample. As a result the intensity of the transmitted light is
decreased. The measurement of the decrease in intensity of radiation is the basis of
spectrophotometry. Thus the spectrophotometer compares the intensity of the transmitted
light with that of incident lights.
The absorption of light by a substance is governed by Beer’s and Lambert’s law. According
to the Beer-Lambert’s law: when a beam of monochromatic light of intensity I0 passes
through a medium that contains an absorbing substance, the intensity of transmitted
radiation I depends on the length of the absorbing medium and the concentration of the
solution. Mathematically it can be represented as:
Absorbance = log(I0/I) = εcl
The molar absorption coefficient or molar extinction coefficient is the absorbance of a
solution having the unit concentration (c = 1M) placed in a cell of unit thickness (l = 1 cm).
Absorbance is also called optical density (OD).
Thus, for a particular wavelength λ, the absorbance or OD of a solution in a container of
fixed path length is directly proportional to the concentration of a solution.
i.e. A ∞ c
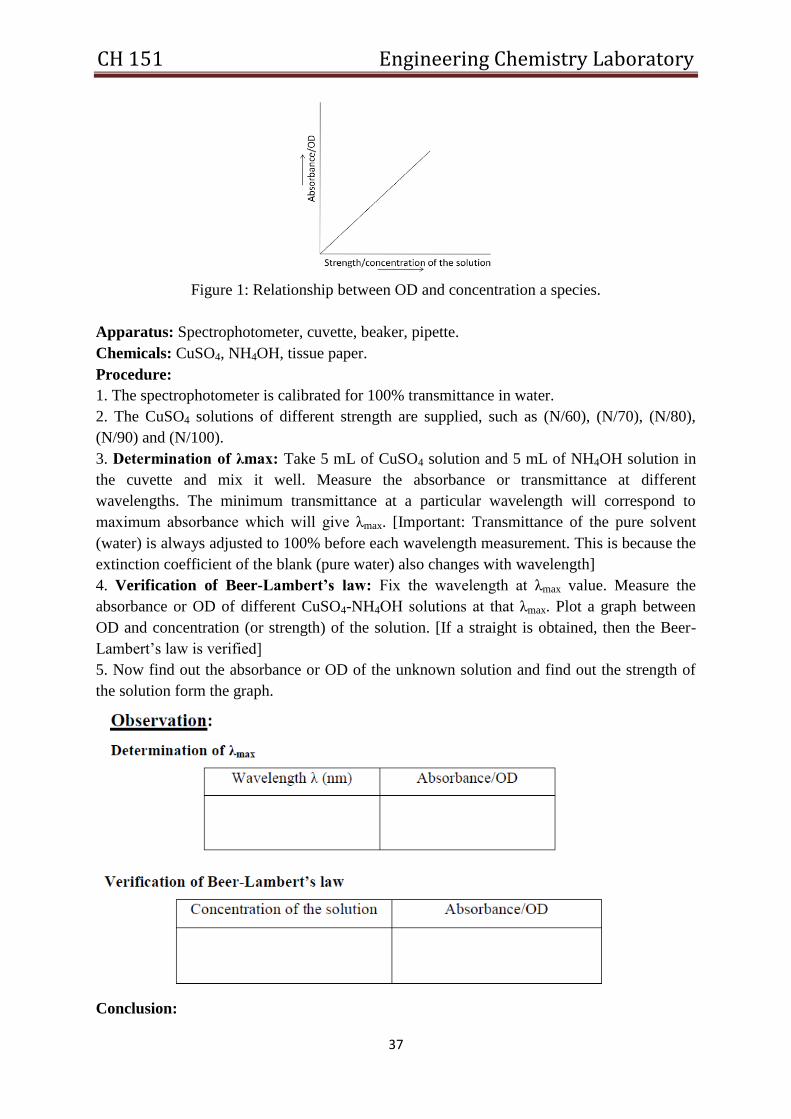
A plot between absorbance and concentration is expected to be a straight line plot, passing
through the origin, shows that Beer-Lambert’s law is obeyed. This plot, known as calibration
curve, can also be employed in finding the concentration (or strength) of a given solution.
CH 151 Engineering Chemistry Laboratory
37
Figure 1: Relationship between OD and concentration a species.
Apparatus: Spectrophotometer, cuvette, beaker, pipette.
Chemicals: CuSO4, NH4OH, tissue paper.
Procedure:
1. The spectrophotometer is calibrated for 100% transmittance in water.
2. The CuSO4 solutions of different strength are supplied, such as (N/60), (N/70), (N/80),
(N/90) and (N/100).
3. Determination of λmax: Take 5 mL of CuSO4 solution and 5 mL of NH4OH solution in
the cuvette and mix it well. Measure the absorbance or transmittance at different
wavelengths. The minimum transmittance at a particular wavelength will correspond to
maximum absorbance which will give λmax. [Important: Transmittance of the pure solvent
(water) is always adjusted to 100% before each wavelength measurement. This is because the
extinction coefficient of the blank (pure water) also changes with wavelength]
4. Verification of Beer-Lambert’s law: Fix the wavelength at λmax value. Measure the
absorbance or OD of different CuSO4-NH4OH solutions at that λmax. Plot a graph between
OD and concentration (or strength) of the solution. [If a straight is obtained, then the Beer-
Lambert’s law is verified]
5. Now find out the absorbance or OD of the unknown solution and find out the strength of
the solution form the graph.
Conclusion:

CH 151 Engineering Chemistry Laboratory
38
i) λmax for CuSO4–NH4OH solution is ______ nm
ii) CuSO4–NH4OH solution obeys Beer-Lambert’s law
iii) Concentration of the unknown solution =
Precautions:
1. Always use dilute solutions for getting calibration curve
2. Cuvette should be cleaned properly and must be wiped with tissue paper.
3. Do not leave any finger marks on the cuvette.
....................................................................End of the Labmanual........................................................................