Embed Size (px)
DESCRIPTION
Ch. 10 Correlation and Regression. 10-3 Notes Inferences for Correlation and Regression. Focus Points - Test the ______________________________. Use sample data to compute the _____________ ________________________________________ . - PowerPoint PPT Presentation
Citation preview
Ch. 10 Correlation and Regression
10-3 NotesInferences for Correlation and
Regression
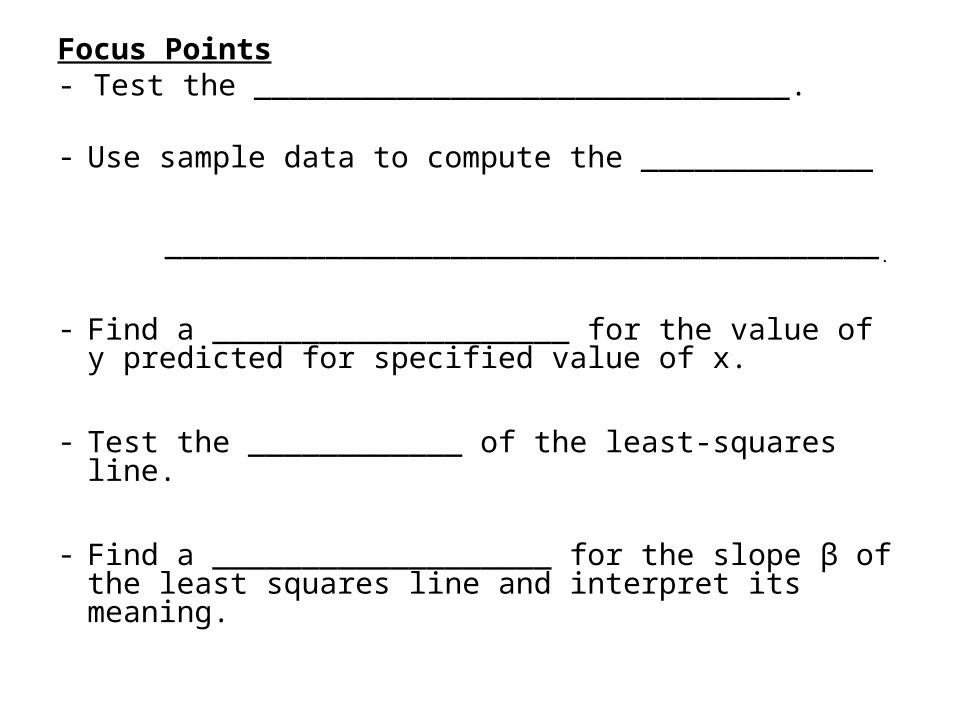
Focus Points- Test the ______________________________.
- Use sample data to compute the _____________
________________________________________.
- Find a ____________________ for the value of y predicted for specified value of x.
- Test the ____________ of the least-squares line.
- Find a ___________________ for the slope β of the least squares line and interpret its meaning.
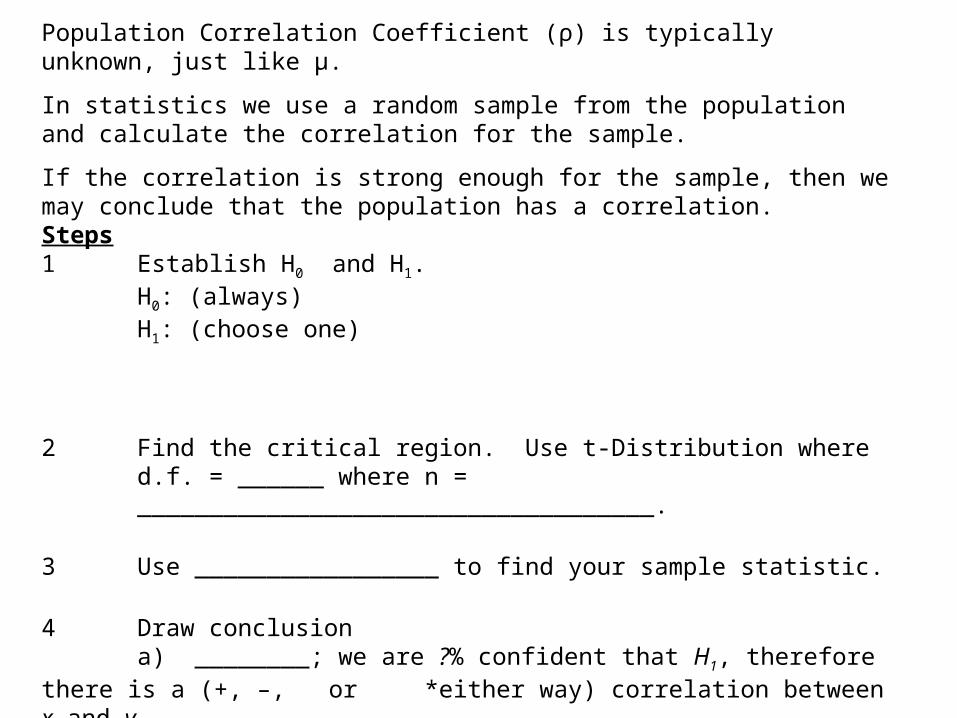
Population Correlation Coefficient (ρ) is typically unknown, just like μ.
In statistics we use a random sample from the population and calculate the correlation for the sample.
If the correlation is strong enough for the sample, then we may conclude that the population has a correlation. Steps1 Establish H0 and H1.
H0: (always) H1: (choose one)
2 Find the critical region. Use t-Distribution where d.f. = ______ where n = ____________________________________.
3 Use _________________ to find your sample statistic.
4 Draw conclusiona) ________; we are ?% confident that H1, therefore there is a (+, –, or *either way) correlation between x and y.b________________; at α = ?% the evidence is not strong enough to imply H1, therefore there is no significant (+, –, or *either way) correlation between x and y.
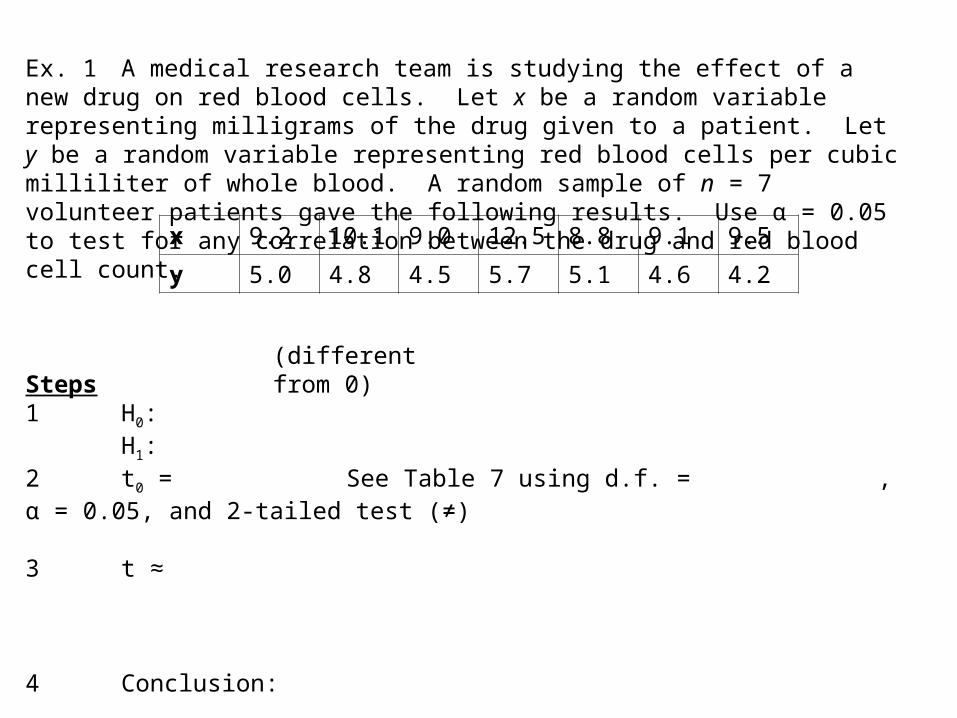
Ex. 1 A medical research team is studying the effect of a new drug on red blood cells. Let x be a random variable representing milligrams of the drug given to a patient. Let y be a random variable representing red blood cells per cubic milliliter of whole blood. A random sample of n = 7 volunteer patients gave the following results. Use α = 0.05 to test for any correlation between the drug and red blood cell count.
Steps1 H0:
H1: 2 t0 = See Table 7 using d.f. = , α = 0.05, and 2-tailed test (≠)
3 t ≈
4 Conclusion:
(different from 0)
x 9.2 10.1 9.0 12.5 8.8 9.1 9.5
y 5.0 4.8 4.5 5.7 5.1 4.6 4.2
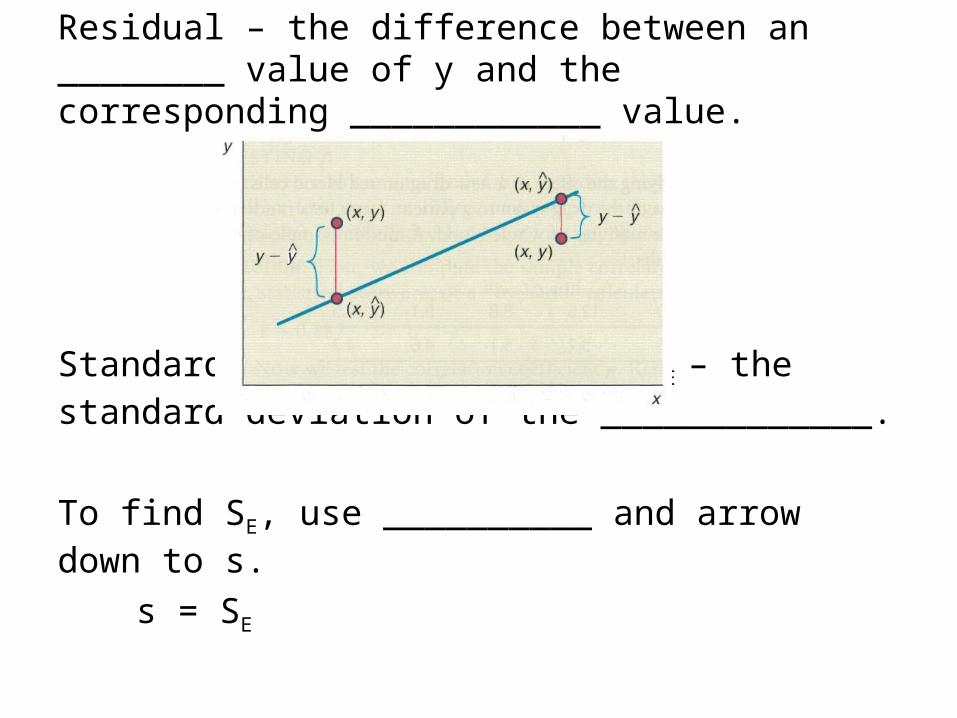
Residual – the difference between an ________ value of y and the corresponding ____________ value.
Standard error of estimate SE – the standard deviation of the _____________.
To find SE, use __________ and arrow down to s.
s = SE
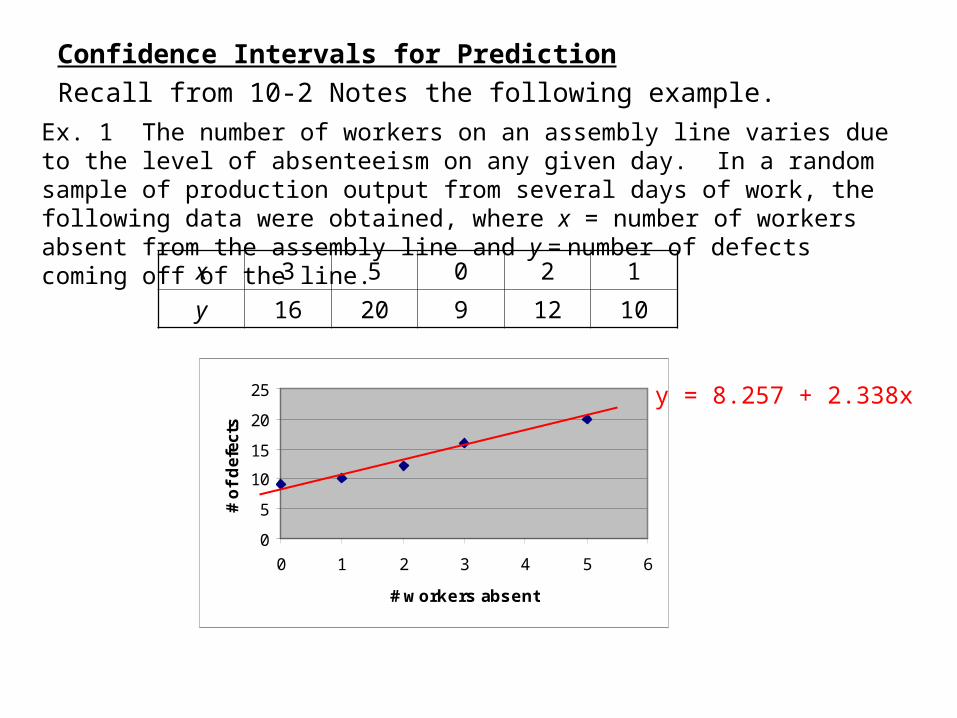
Confidence Intervals for PredictionRecall from 10-2 Notes the following example.
Ex. 1 The number of workers on an assembly line varies due to the level of absenteeism on any given day. In a random sample of production output from several days of work, the following data were obtained, where x = number of workers absent from the assembly line and y = number of defects coming off of the line.
x 3 5 0 2 1
y 16 20 9 12 10
0
5
10
15
20
25
0 1 2 3 4 5 6
# workers absent
# o
f d
efec
ts
y = 8.257 + 2.338x
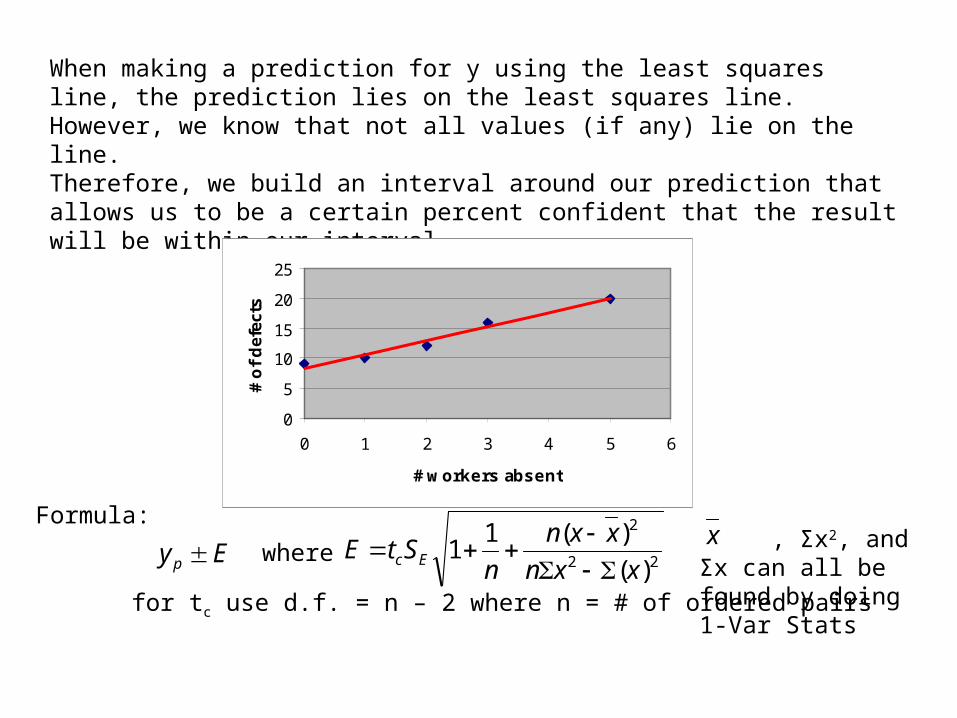
When making a prediction for y using the least squares line, the prediction lies on the least squares line. However, we know that not all values (if any) lie on the line. Therefore, we build an interval around our prediction that allows us to be a certain percent confident that the result will be within our interval.
Formula:
for tc use d.f. = n – 2 where n = # of ordered pairs
0
5
10
15
20
25
0 1 2 3 4 5 6
# workers absent
# o
f d
efec
ts
Ey p 22
2
)(
)(11
xxn
xxn
nStE Ec
where
, Σx2, and Σx can all be found by doing 1-Var Stats
x
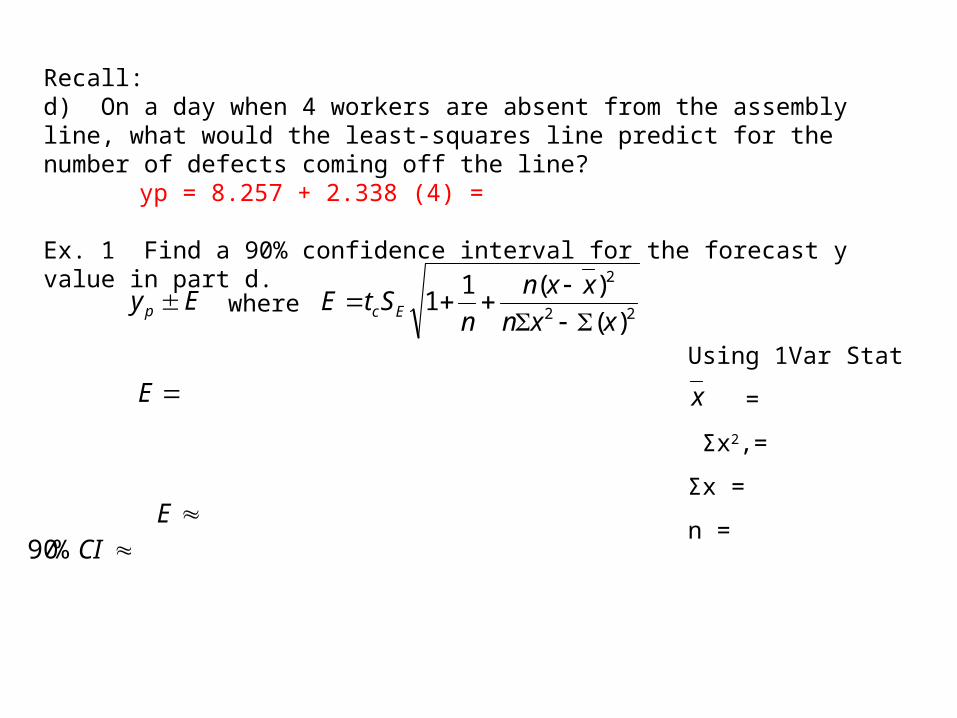
Recall:d) On a day when 4 workers are absent from the assembly line, what would the least-squares line predict for the number of defects coming off the line?
yp = 8.257 + 2.338 (4) =
Ex. 1 Find a 90% confidence interval for the forecast y value in part d.
Ey p where
E
ECI%90
22
2
)(
)(11
xxn
xxn
nStE Ec
Using 1Var Stat
=
Σx2,=
Σx =
n =
x
Assignment Day 1p. 543 #1, 7, 9, 10 For 7, 9, 10 do parts a-e. For e, also explain its
meaning in context.

Testing the slope β of the least squares line is the same as for correlation coefficient ρ except:For Ho and for H1 we use ___ instead of ___.
Ex. 3 How fast do puppies grow? That depends on the puppy. How about male wolf pups in the Helsinki Zoo (Finland)? Let x = age in weeks and y = weight in kilograms for a random sample of male wolf pups. The following data are based on the article Studies of the Wolf in Finland Canis lupus L by E. Pulliainen, University of Helsinki.
x 8 10 14 20 28 40 45
y 7 13 17 23 30 34 35
a) Use α = 1% to test the claim that β ≠ 0, and interpret the results in the context of this application.
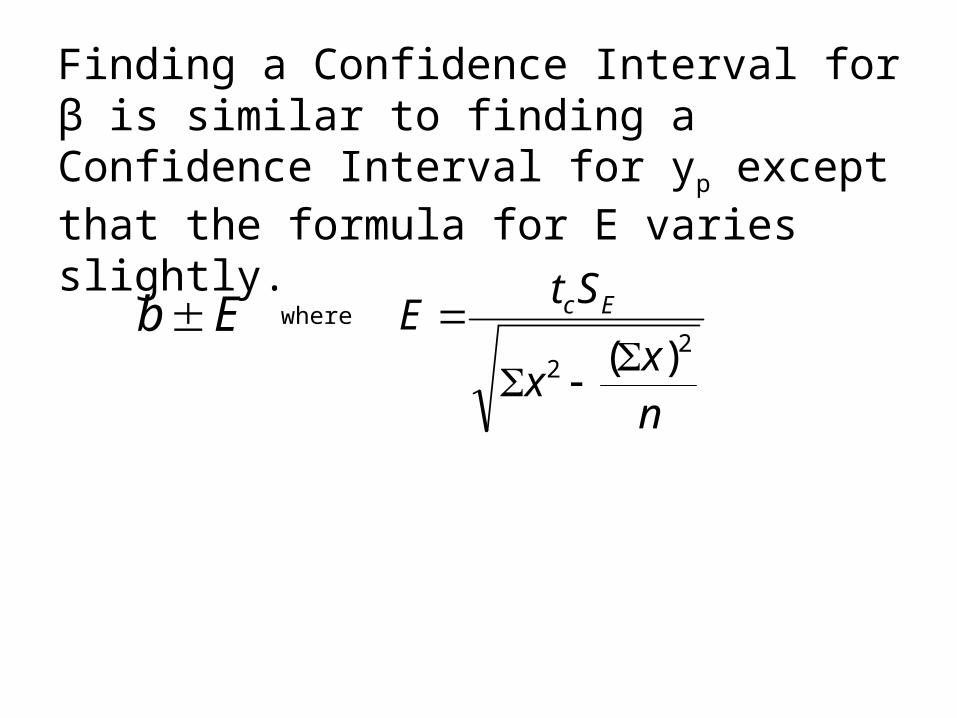
Finding a Confidence Interval for β is similar to finding a Confidence Interval for yp except that the formula for E varies slightly.
Eb where
nx
x
StE Ec
22 )(
b) Still using the data from ex. 3, compute an 80% Confidence Interval for β and interpret the results in the context of this application.
Assignment Day 1p. 544 #7, 9, 10 f & g; also do #11 all


