Embed Size (px)
Citation preview

PDH-Pro.com
396 Washington Street, Suite 159, Wellesley, MA 02481 Telephone – (508) 298-4787 www.PDH-Pro.com
This document is the course text. You may review this material at your leisure before or after you purchase the course. In order to obtain credit for this course, complete the following steps: 1) Log in to My Account and purchase the course. If you don’t have an account, go to New User to create an account. 2) After the course has been purchased, complete the quiz at your convenience. 3) A Certificate of Completion is available once you pass the exam (70% or greater). If a passing grade is not obtained, you may take the quiz as many times as necessary until a passing grade is obtained (up to one year from the purchase date). If you have any questions or technical difficulties, please call (508) 298-4787 or email us at [email protected].
Fuel Cell Performance and Technology Overview
Course Number: CH-02-903
PDH: 5
Approved for: AK, AL, AR, GA, IA, IL, IN, KS, KY, MD, ME, MI, MN, MO, MS, MT, NC, ND, NE, NH, NJ, NM, NV, OH, OK, OR, PA, SC, SD, TN, TX, UT, VA, WI, WV, and WY
New Jersey Professional Competency Approval #24GP00025600 North Carolina Approved Sponsor #S-0695

Fuel Cell Handbook
(Seventh Edition)
By EG&G Technical Services, Inc.
Under Contract No. DE-AM26-99FT40575
U.S. Department of Energy Office of Fossil Energy
National Energy Technology Laboratory P.O. Box 880
Morgantown, West Virginia 26507-0880
November 2004

DISCLAIMER This report was prepared as an account of work sponsored by an agency of the United States Government. Neither the United States Government nor any agency thereof, nor any of their employees, makes any warranty, express or implied, or assumes any legal liability or respon-sibility for the accuracy, completeness, or usefulness of any information, apparatus, product, or process disclosed, or represents that its use would not infringe privately owned rights. Reference herein to any specific commercial product, process, or service by trade name, trademark, manu-facturer, or otherwise does not necessarily constitute or imply its endorsement, recommendation, or favoring by the United States Government or any agency thereof. The views and opinions of authors expressed herein do not necessarily state or reflect those of the United States Govern-ment or any agency thereof. Available to DOE and DOE contractors from the Office of Scientific and Technical Information, P.O. Box 62, 175 Oak Ridge Turnpike, Oak Ridge, TN 37831; prices available at (423) 576-8401, fax: (423) 576-5725, E-mail: [email protected] Available to the public from the National Technical Information Service, U.S. Department of Commerce, 5285 Port Royal Road, Springfield, VA 22161; phone orders accepted at (703) 487-4650.
iii
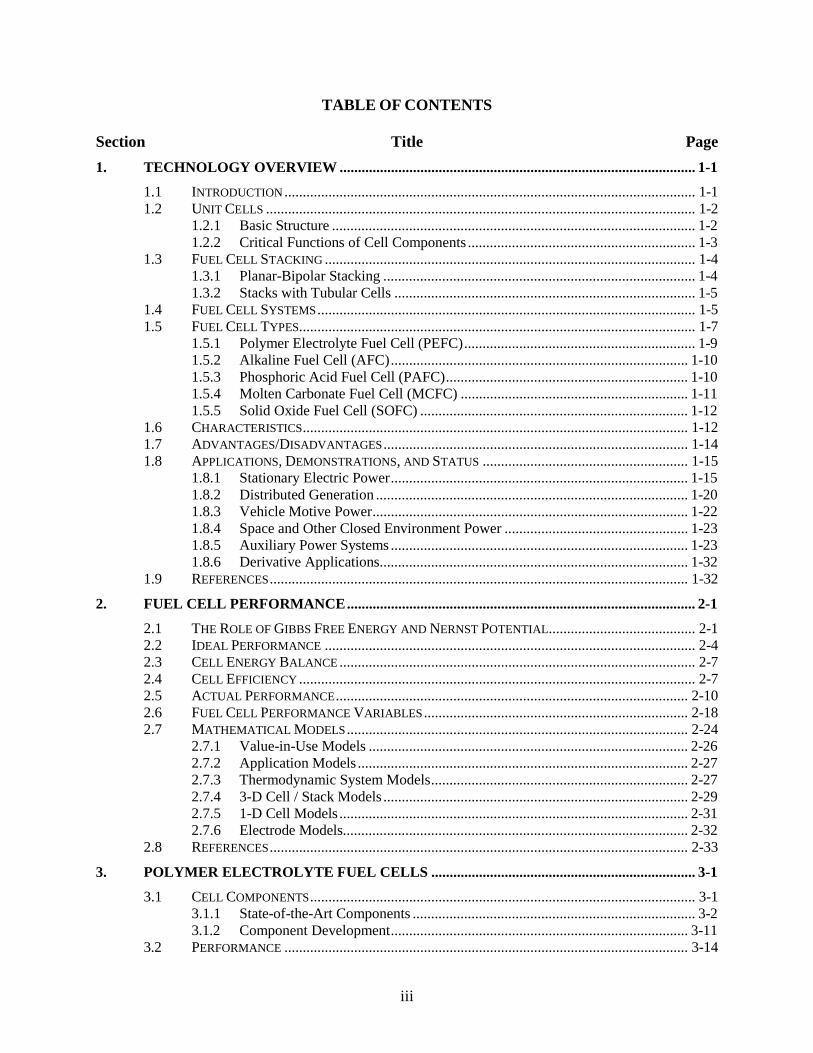
TABLE OF CONTENTS
Section Title Page 1. TECHNOLOGY OVERVIEW ................................................................................................. 1-1
1.1 INTRODUCTION................................................................................................................ 1-1 1.2 UNIT CELLS ..................................................................................................................... 1-2
1.2.1 Basic Structure ................................................................................................... 1-2 1.2.2 Critical Functions of Cell Components .............................................................. 1-3
1.3 FUEL CELL STACKING ..................................................................................................... 1-4 1.3.1 Planar-Bipolar Stacking ..................................................................................... 1-4 1.3.2 Stacks with Tubular Cells .................................................................................. 1-5
1.4 FUEL CELL SYSTEMS....................................................................................................... 1-5 1.5 FUEL CELL TYPES............................................................................................................ 1-7
1.5.1 Polymer Electrolyte Fuel Cell (PEFC)............................................................... 1-9 1.5.2 Alkaline Fuel Cell (AFC)................................................................................. 1-10 1.5.3 Phosphoric Acid Fuel Cell (PAFC).................................................................. 1-10 1.5.4 Molten Carbonate Fuel Cell (MCFC) .............................................................. 1-11 1.5.5 Solid Oxide Fuel Cell (SOFC) ......................................................................... 1-12
1.6 CHARACTERISTICS......................................................................................................... 1-12 1.7 ADVANTAGES/DISADVANTAGES................................................................................... 1-14 1.8 APPLICATIONS, DEMONSTRATIONS, AND STATUS ........................................................ 1-15
1.8.1 Stationary Electric Power................................................................................. 1-15 1.8.2 Distributed Generation ..................................................................................... 1-20 1.8.3 Vehicle Motive Power...................................................................................... 1-22 1.8.4 Space and Other Closed Environment Power .................................................. 1-23 1.8.5 Auxiliary Power Systems ................................................................................. 1-23 1.8.6 Derivative Applications.................................................................................... 1-32
1.9 REFERENCES.................................................................................................................. 1-32
2. FUEL CELL PERFORMANCE............................................................................................... 2-1
2.1 THE ROLE OF GIBBS FREE ENERGY AND NERNST POTENTIAL........................................ 2-1 2.2 IDEAL PERFORMANCE ..................................................................................................... 2-4 2.3 CELL ENERGY BALANCE ................................................................................................. 2-7 2.4 CELL EFFICIENCY ............................................................................................................ 2-7 2.5 ACTUAL PERFORMANCE................................................................................................ 2-10 2.6 FUEL CELL PERFORMANCE VARIABLES........................................................................ 2-18 2.7 MATHEMATICAL MODELS............................................................................................. 2-24
2.7.1 Value-in-Use Models ....................................................................................... 2-26 2.7.2 Application Models .......................................................................................... 2-27 2.7.3 Thermodynamic System Models...................................................................... 2-27 2.7.4 3-D Cell / Stack Models ................................................................................... 2-29 2.7.5 1-D Cell Models ............................................................................................... 2-31 2.7.6 Electrode Models.............................................................................................. 2-32
2.8 REFERENCES.................................................................................................................. 2-33
3. POLYMER ELECTROLYTE FUEL CELLS ........................................................................ 3-1
3.1 CELL COMPONENTS......................................................................................................... 3-1 3.1.1 State-of-the-Art Components ............................................................................. 3-2 3.1.2 Component Development................................................................................. 3-11
3.2 PERFORMANCE .............................................................................................................. 3-14
iv
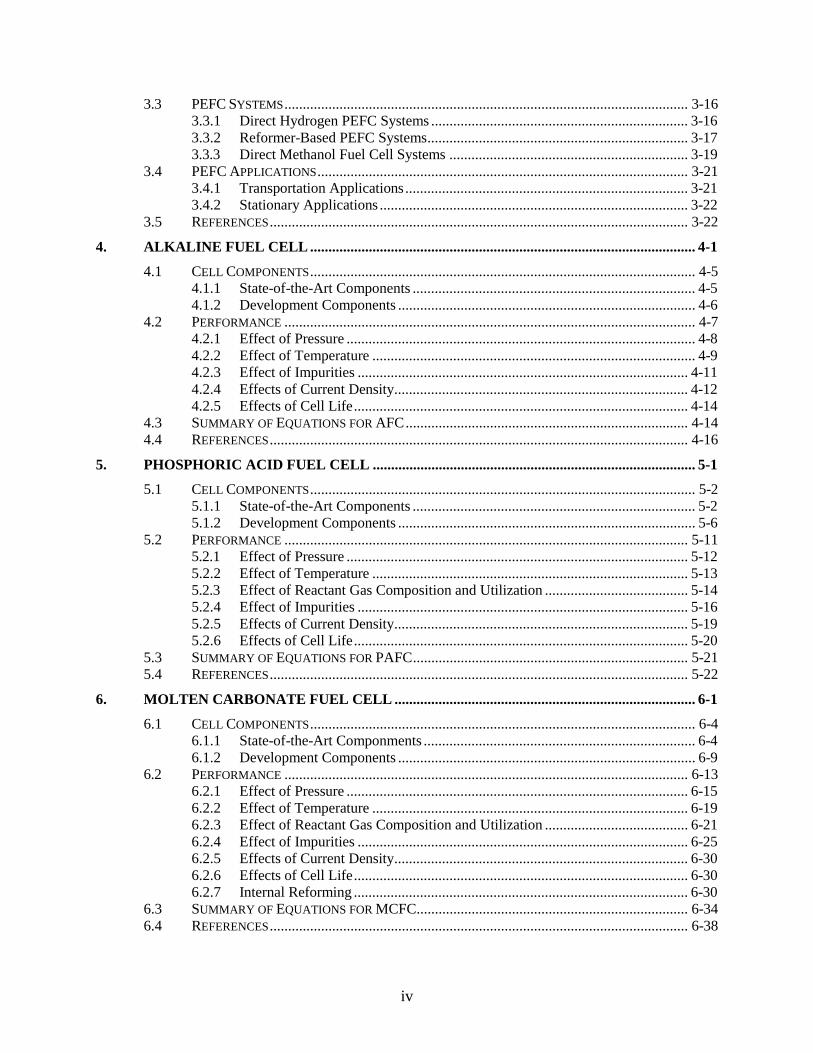
3.3 PEFC SYSTEMS.............................................................................................................. 3-16 3.3.1 Direct Hydrogen PEFC Systems ...................................................................... 3-16 3.3.2 Reformer-Based PEFC Systems....................................................................... 3-17 3.3.3 Direct Methanol Fuel Cell Systems ................................................................. 3-19
3.4 PEFC APPLICATIONS..................................................................................................... 3-21 3.4.1 Transportation Applications............................................................................. 3-21 3.4.2 Stationary Applications .................................................................................... 3-22
3.5 REFERENCES.................................................................................................................. 3-22
4. ALKALINE FUEL CELL ......................................................................................................... 4-1
4.1 CELL COMPONENTS......................................................................................................... 4-5 4.1.1 State-of-the-Art Components ............................................................................. 4-5 4.1.2 Development Components ................................................................................. 4-6
4.2 PERFORMANCE ................................................................................................................ 4-7 4.2.1 Effect of Pressure ............................................................................................... 4-8 4.2.2 Effect of Temperature ........................................................................................ 4-9 4.2.3 Effect of Impurities .......................................................................................... 4-11 4.2.4 Effects of Current Density................................................................................ 4-12 4.2.5 Effects of Cell Life........................................................................................... 4-14
4.3 SUMMARY OF EQUATIONS FOR AFC............................................................................. 4-14 4.4 REFERENCES.................................................................................................................. 4-16
5. PHOSPHORIC ACID FUEL CELL ........................................................................................ 5-1
5.1 CELL COMPONENTS......................................................................................................... 5-2 5.1.1 State-of-the-Art Components ............................................................................. 5-2 5.1.2 Development Components ................................................................................. 5-6
5.2 PERFORMANCE .............................................................................................................. 5-11 5.2.1 Effect of Pressure ............................................................................................. 5-12 5.2.2 Effect of Temperature ...................................................................................... 5-13 5.2.3 Effect of Reactant Gas Composition and Utilization ....................................... 5-14 5.2.4 Effect of Impurities .......................................................................................... 5-16 5.2.5 Effects of Current Density................................................................................ 5-19 5.2.6 Effects of Cell Life........................................................................................... 5-20
5.3 SUMMARY OF EQUATIONS FOR PAFC........................................................................... 5-21 5.4 REFERENCES.................................................................................................................. 5-22
6. MOLTEN CARBONATE FUEL CELL .................................................................................. 6-1
6.1 CELL COMPONENTS......................................................................................................... 6-4 6.1.1 State-of-the-Art Componments .......................................................................... 6-4 6.1.2 Development Components ................................................................................. 6-9
6.2 PERFORMANCE .............................................................................................................. 6-13 6.2.1 Effect of Pressure ............................................................................................. 6-15 6.2.2 Effect of Temperature ...................................................................................... 6-19 6.2.3 Effect of Reactant Gas Composition and Utilization ....................................... 6-21 6.2.4 Effect of Impurities .......................................................................................... 6-25 6.2.5 Effects of Current Density................................................................................ 6-30 6.2.6 Effects of Cell Life........................................................................................... 6-30 6.2.7 Internal Reforming ........................................................................................... 6-30
6.3 SUMMARY OF EQUATIONS FOR MCFC.......................................................................... 6-34 6.4 REFERENCES.................................................................................................................. 6-38

v
7. SOLID OXIDE FUEL CELLS.................................................................................................. 7-1
7.1 CELL COMPONENTS......................................................................................................... 7-2 7.1.1 Electrolyte Materials .......................................................................................... 7-2 7.1.2 Anode Materials ................................................................................................. 7-3 7.1.3 Cathode Materials .............................................................................................. 7-5 7.1.4 Interconnect Materials........................................................................................ 7-6 7.1.5 Seal Materials..................................................................................................... 7-9
7.2 CELL AND STACK DESIGNS ........................................................................................... 7-13 7.2.1 Tubular SOFC .................................................................................................. 7-13
7.2.1.1 Performance ........................................................................................ 7-20 7.2.2 Planar SOFC..................................................................................................... 7-31
7.2.2.1 Single Cell Performance...................................................................... 7-35 7.2.2.2 Stack Performance............................................................................... 7-39
7.2.3 Stack Scale-Up ................................................................................................. 7-41 7.3 SYSTEM CONSIDERATIONS ............................................................................................ 7-45 7.4 REFERENCES.................................................................................................................. 7-45
8. FUEL CELL SYSTEMS............................................................................................................ 8-1
8.1 SYSTEM PROCESSES ........................................................................................................ 8-2 8.1.1 Fuel Processing .................................................................................................. 8-2
8.2 POWER CONDITIONING.................................................................................................. 8-27 8.2.1 Introduction to Fuel Cell Power Conditioning Systems................................... 8-28 8.2.2 Fuel Cell Power Conversion for Supplying a Dedicated Load [2,3,4]............. 8-29 8.2.3 Fuel Cell Power Conversion for Supplying Backup Power to a Load Connected to a Local Utility ............................................................................ 8-34 8.2.4 Fuel Cell Power Conversion for Supplying a Load Operating in Parallel With the Local Utility (Utility Interactive) ...................................................... 8-37 8.2.5 Fuel Cell Power Conversion for Connecting Directly to the Local Utility...... 8-37 8.2.6 Power Conditioners for Automotive Fuel Cells ............................................... 8-39 8.2.7 Power Conversion Architecture for a Fuel Cell Turbine Hybrid Interfaced With a Local Utility.......................................................................................... 8-41 8.2.8 Fuel Cell Ripple Current .................................................................................. 8-43 8.2.9 System Issues: Power Conversion Cost and Size............................................. 8-44
8.2.10 REFERENCES (Sections 8.1 and 8.2) ................................................................. 8-45 8.3 SYSTEM OPTIMIZATION................................................................................................. 8-46
8.3.1 Pressure ............................................................................................................ 8-46 8.3.2 Temperature ..................................................................................................... 8-48 8.3.3 Utilization......................................................................................................... 8-49 8.3.4 Heat Recovery.................................................................................................. 8-50 8.3.5 Miscellaneous................................................................................................... 8-51 8.3.6 Concluding Remarks on System Optimization ................................................ 8-51
8.4 FUEL CELL SYSTEM DESIGNS........................................................................................ 8-52 8.4.1 Natural Gas Fueled PEFC System ................................................................... 8-52 8.4.2 Natural Gas Fueled PAFC System................................................................... 8-53 8.4.3 Natural Gas Fueled Internally Reformed MCFC System................................. 8-56 8.4.4 Natural Gas Fueled Pressurized SOFC System................................................ 8-58 8.4.5 Natural Gas Fueled Multi-Stage Solid State Power Plant System ................... 8-62 8.4.6 Coal Fueled SOFC System............................................................................... 8-66 8.4.7 Power Generation by Combined Fuel Cell and Gas Turbine System .............. 8-70 8.4.8 Heat and Fuel Recovery Cycles ....................................................................... 8-70

vi
8.5 FUEL CELL NETWORKS ................................................................................................. 8-82 8.5.1 Molten Carbonate Fuel Cell Networks: Principles, Analysis and Performance ..................................................................................................... 8-82 8.5.2 MCFC Network................................................................................................ 8-86 8.5.3 Recycle Scheme ............................................................................................... 8-86 8.5.4 Reactant Conditioning Between Stacks in Series............................................. 8-86 8.5.5 Higher Total Reactant Utilization .................................................................... 8-87 8.5.6 Disadvantages of MCFC Networks.................................................................. 8-88 8.5.7 Comparison of Performance............................................................................. 8-88 8.5.8 Conclusions ...................................................................................................... 8-89
8.6 HYBRIDS ........................................................................................................................ 8-89 8.6.1 Technology....................................................................................................... 8-89 8.6.2 Projects............................................................................................................. 8-92 8.6.3 World’s First Hybrid Project............................................................................ 8-93 8.6.4 Hybrid Electric Vehicles (HEV) ...................................................................... 8-93
8.7 FUEL CELL AUXILIARY POWER SYSTEMS..................................................................... 8-96 8.7.1 System Performance Requirements.................................................................. 8-97 8.7.2 Technology Status ............................................................................................ 8-98 8.7.3 System Configuration and Technology Issues ................................................. 8-99 8.7.4 System Cost Considerations........................................................................... 8-102 8.7.5 SOFC System Cost Structure ......................................................................... 8-103 8.7.6 Outlook and Conclusions ............................................................................... 8-104
8.8 REFERENCES................................................................................................................ 8-104
9. SAMPLE CALCULATIONS .................................................................................................... 9-1
9.1 UNIT OPERATIONS........................................................................................................... 9-1 9.1.1 Fuel Cell Calculations ........................................................................................ 9-1 9.1.2 Fuel Processing Calculations ........................................................................... 9-13 9.1.3 Power Conditioners .......................................................................................... 9-16 9.1.4 Others ............................................................................................................... 9-16
9.2 SYSTEM ISSUES.............................................................................................................. 9-16 9.2.1 Efficiency Calculations .................................................................................... 9-17 9.2.2 Thermodynamic Considerations....................................................................... 9-19
9.3 SUPPORTING CALCULATIONS ........................................................................................ 9-22 9.4 COST CALCULATIONS.................................................................................................... 9-25
9.4.1 Cost of Electricity............................................................................................. 9-25 9.4.2 Capital Cost Development ............................................................................... 9-26
9.5 COMMON CONVERSION FACTORS ................................................................................. 9-27 9.6 AUTOMOTIVE DESIGN CALCULATIONS ......................................................................... 9-28 9.7 REFERENCES.................................................................................................................. 9-29
10. APPENDIX ............................................................................................................................... 10-1
10.1 EQUILIBRIUM CONSTANTS ............................................................................................ 10-1 10.2 CONTAMINANTS FROM COAL GASIFICATION................................................................ 10-2 10.3 SELECTED MAJOR FUEL CELL REFERENCES, 1993 TO PRESENT................................... 10-4 10.4 LIST OF SYMBOLS........................................................................................................ 10-10 10.5 FUEL CELL RELATED CODES AND STANDARDS .......................................................... 10-14
10.5.1 Introduction .................................................................................................... 10-14 10.5.2 Organizations ................................................................................................. 10-15 10.5.3 Codes & Standards......................................................................................... 10-16 10.5.4 Codes and Standards for Fuel Cell Manufacturers......................................... 10-17

vii
10.5.5 Codes and Standards for the Installation of Fuel Cells .................................. 10-19 10.5.6 Codes and Standards for Fuel Cell Vehicles .................................................. 10-19 10.5.7 Application Permits........................................................................................ 10-19 10.5.8 References ...................................................................................................... 10-21
10.6 FUEL CELL FIELD SITE DATA...................................................................................... 10-21 10.6.1 Worldwide Sites ............................................................................................. 10-21 10.6.2 DoD Field Sites .............................................................................................. 10-24 10.6.3 IFC Field Units............................................................................................... 10-24 10.6.4 FuelCell Energy.............................................................................................. 10-24 10.6.5 Siemens Westinghouse................................................................................... 10-24
10.7 HYDROGEN .................................................................................................................. 10-31 10.7.1 Introduction .................................................................................................... 10-31 10.7.2 Hydrogen Production ..................................................................................... 10-32 10.7.3 DOE’s Hydrogen Research ............................................................................ 10-34 10.7.4 Hydrogen Storage........................................................................................... 10-35 10.7.5 Barriers........................................................................................................... 10-36
10.8 THE OFFICE OF ENERGY EFFICIENCY AND RENEWABLE ENERGY WORK IN FUEL CELLS .......................................................................................................................... 10-36 10.9 RARE EARTH MINERALS ............................................................................................. 10-38
10.9.1 Introduction .................................................................................................... 10-38 10.9.2 Outlook........................................................................................................... 10-40
10.10 REFERENCES................................................................................................................ 10-41
11. INDEX....................................................................................................................................... 11-1

viii
LIST OF FIGURES
Figure Title Page Figure 1-1 Schematic of an Individual Fuel Cell................................................................... 1-2 Figure 1-2 Expanded View of a Basic Fuel Cell Unit in a Fuel Cell Stack (1)..................... 1-4 Figure 1-3 Fuel Cell Power Plant Major Processes ................................................................ 1-7 Figure 1-4 Relative Emissions of PAFC Fuel Cell Power Plants Compared to Stringent Los Angeles Basin Requirements ...................................................................... 1-13 Figure 1-5 PC-25 Fuel Cell.................................................................................................. 1-16 Figure 1-6 Combining the SOFC with a Gas Turbine Engine to Improve Efficiency ........ 1-19 Figure 1-7 Overview of Fuel Cell Activities Aimed at APU Applications......................... 1-24 Figure 1-8 Overview of APU Applications ......................................................................... 1-24 Figure 1-9 Overview of typical system requirements.......................................................... 1-25 Figure 1-10 Stage of development for fuel cells for APU applications ................................ 1-26 Figure 1-11 Overview of subsystems and components for SOFC and PEFC systems ......... 1-28 Figure 1-12 Simplified process flow diagram of pre-reformer/SOFC system ...................... 1-29 Figure 1-13 Multilevel system modeling approach ............................................................... 1-30 Figure 1-14 Projected Cost Structure of a 5kWnet APU SOFC System. ............................. 1-32 Figure 2-1 H2/O2 Fuel Cell Ideal Potential as a Function of Temperature............................ 2-5 Figure 2-2 Effect of fuel utilization on voltage efficiency and overall cell efficiency for typical SOFC operating conditions (800 °C, 50% initial hydrogen concentration). ................................................................................................... 2-10 Figure 2-3 Ideal and Actual Fuel Cell Voltage/Current Characteristic ............................... 2-11 Figure 2-4 Example of a Tafel Plot ..................................................................................... 2-13 Figure 2-5 Example of impedance spectrum of anode-supported SOFC operated at 850 °C. ............................................................................................................... 2-14 Figure 2-6 Contribution to Polarization of Anode and Cathode.......................................... 2-17 Figure 2-7 Voltage/Power Relationship .............................................................................. 2-19 Figure 2-8 The Variation in the Reversible Cell Voltage as a Function of Reactant Utilization .......................................................................................................... 2-23 Figure 2-9 Overview of Levels of Fuel Cell Models........................................................... 2-26 Figure 2-10 Conours of Current Density on Electrolyte ....................................................... 2-31 Figure 2-11 Typical Phenomena Considered in a 1-D Model (17) ....................................... 2-32 Figure 2-12 Overview of types of electrode models (9)........................................................ 2-33 Figure 3-1 (a) Schematic of Representative PEFC (b) Single Cell Structure of Representative PEFC ........................................................................................... 3-2 Figure 3-2 PEFC Schematic (4, 5)......................................................................................... 3-3 Figure 3-3 Polarization Curves for 3M 7 Layer MEA (12)................................................... 3-7 Figure 3-4 Endurance Test Results for Gore Primea 56 MEA at Three Current Densities............................................................................................................. 3-10 Figure 3-5 Multi-Cell Stack Performance on Dow Membrane (9)...................................... 3-12 Figure 3-6 Effect on PEFC Performance of Bleeding Oxygen into the Anode Compartment (1)................................................................................................ 3-13 Figure 3-7 Evolutionary Changes in PEFCs Performance [(a) H2/O2, (b) H2/Air, (c) Reformate Fuel/Air, (d) H2/unkown)] [24, 10, 12, , ] .................................. 3-14

ix
Figure 3-8 Influence of O2 Pressure on PEFC Performance (93°C, Electrode Loadings of 2 mg/cm2 Pt, H2 Fuel at 3 Atmospheres) [(56) Figure 29, p. 49]................... 3-15 Figure 3-9 Cell Performance with Carbon Monoxide in Reformed Fuel (56) .................... 3-16 Figure 3-10 Typical Process Flow Diagram Showing Major Components of Direct Hydrogen PEFC System .................................................................................... 3-17 Figure 3-11 Schematic of Major Unit Operations Typical of Reformer-Based PEFC Systems. ............................................................................................................. 3-18 Figure 3-12 Comparison of State-of-the-Art Single Cell Direct Methanol Fuel Cell Data (58) ............................................................................................................ 3-21 Figure 4-1 Principles of Operation of H2/O2 Alkaline Fuel Cell, Immobilized Electrolyte (8) ...................................................................................................... 4-4 Figure 4-2 Principles of Operation of H2/Air Alkaline Fuel Cell, Circulating Electrolyte (9) ...................................................................................................... 4-4 Figure 4-3 Evolutionary Changes in the Performance of AFCs (8, 12, & 16) ...................... 4-8 Figure 4-4 Reversible Voltage of the Hydrogen-Oxygen Cell (14) ...................................... 4-9 Figure 4-5 Influence of Temperature on O2, (air) Reduction in 12 N KOH. ...................... 4-10 Figure 4-6 Influence of Temperature on the AFC Cell Voltage.......................................... 4-11 Figure 4-7 Degradation in AFC Electrode Potential with CO2 Containing and CO2 Free Air .............................................................................................................. 4-12 Figure 4-8 iR-Free Electrode Performance with O2 and Air in 9 N KOH at 55 to 60°C. Catalyzed (0.5 mg Pt/cm2 Cathode, 0.5 mg Pt-Rh/cm2 Anode) Carbon-based Porous Electrodes (22)....................................................................................... 4-13 Figure 4-9 iR Free Electrode Performance with O2 and Air in 12N KOH at 65 °C............ 4-14 Figure 4-10 Reference for Alkaline Cell Performance.......................................................... 4-15 Figure 5-1 Principles of Operation of Phosphoric Acid Fuel Cell (Courtesy of UTC Fuel Cells)............................................................................................................ 5-2 Figure 5-2 Improvement in the Performance of H2-Rich Fuel/Air PAFCs ........................... 5-6 Figure 5-3 Advanced Water-Cooled PAFC Performance (16).............................................. 5-8 Figure 5-4 Effect of Temperature: Ultra-High Surface Area Pt Catalyst. Fuel: H2, H2 + 200 ppm H2S and Simulated Coal Gas (37) .............................................. 5-14 Figure 5-5 Polarization at Cathode (0.52 mg Pt/cm2) as a Function of O2 Utilization, which is Increased by Decreasing the Flow Rate of the Oxidant at Atmospheric Pressure 100 percent H3PO4, 191°C, 300 mA/cm2, 1 atm. (38)... 5-15 Figure 5-6 Influence of CO and Fuel Gas Composition on the Performance of Pt Anodes in 100 percent H3PO4 at 180°C. 10 percent Pt Supported on Vulcan XC-72, 0.5 mg Pt/cm2. Dew Point, 57°. Curve 1, 100 percent H2; Curves 2-6, 70 percent H2 and CO2/CO Contents (mol percent) Specified (21) ........... 5-18 Figure 5-7 Effect of H2S Concentration: Ultra-High Surface Area Pt Catalyst (37).......... 5-19 Figure 5-8 Reference Performances at 8.2 atm and Ambient Pressure. Cells from Full Size Power Plant (16)......................................................................................... 5-22 Figure 6-1 Principles of Operation of Molten Carbonate Fuel Cells (FuelCell Energy)....... 6-2 Figure 6-2 Dynamic Equilibrium in Porous MCFC Cell Elements (Porous electrodes are depicted with pores covered by a thin film of electrolyte) ............................ 6-4 Figure 6-3 Progress in the Generic Performance of MCFCs on Reformate Gas and Air (12, 13).......................................................................................................... 6-6

x
Figure 6-4 Effect of Oxidant Gas Composition on MCFC Cathode Performance at 650°C, (Curve 1, 12.6 percent O2/18.4 percent CO2/69.0 percent N2; Curve 2, 33 percent O2/67 percent CO2) (49, Figure 3, Pg. 2711) .................... 6-14 Figure 6-5 Voltage and Power Output of a 1.0/m2 19 cell MCFC Stack after 960 Hours at 965 °C and 1 atm, Fuel Utilization, 75 percent (50) ...................................... 6-15 Figure 6-6 Influence of Cell Pressure on the Performance of a 70.5 cm2 MCFC at 650 °C (anode gas, not specified; cathode gases, 23.2 percent O2/3.2 percent CO2/66.3 percent N2/7.3 percent H2O and 9.2 percent O2/18.2 percent CO2/65.3 percent N2/7.3 percent H2O; 50 percent CO2, utilization at 215 mA/cm2) (53, Figure 4, Pg. 395) ................................................................. 6-18 Figure 6-7 Influence of Pressure on Voltage Gain (55) ...................................................... 6-19 Figure 6-8 Effect of CO2/O2 Ratio on Cathode Performance in an MCFC, Oxygen Pressure is 0.15 atm (22, Figure 5-10, Pgs. 5-20)............................................... 6-22 Figure 6-9 Influence of Reactant Gas Utilization on the Average Cell Voltage of an MCFC Stack (67, Figure 4-21, Pgs. 4-24) ......................................................... 6-23 Figure 6-10 Dependence of Cell Voltage on Fuel Utilization (69) ....................................... 6-25 Figure 6-11 Influence of 5 ppm H2S on the Performance of a Bench Scale MCFC (10 cm x 10 cm) at 650 °C, Fuel Gas (10 percent H2/5 percent CO2/ 10 percent H2O/75 percent He) at 25 percent H2 Utilization (78, Figure 4, Pg. 443) .............................................................................................................. 6-29 Figure 6-12 IIR/DIR Operating Concept, Molten Carbonate Fuel Cell Design (29) ............ 6-31 Figure 6-13 CH4 Conversion as a Function of Fuel Utilization in a DIR Fuel Cell (MCFC at 650 ºC and 1 atm, steam/carbon ratio = 2.0, >99 percent methane conversion achieved with fuel utilization > 65 percent (93).............................. 6-33 Figure 6-14 Voltage Current Characteristics of a 3kW, Five Cell DIR Stack with 5,016 cm2 Cells Operating on 80/20 percent H2/CO2 and Methane (85)........... 6-33 Figure 6-15 Performance Data of a 0.37m2 2 kW Internally Reformed MCFC Stack at 650 °C and 1 atm (13)........................................................................................ 6-34 Figure 6-16 Average Cell Voltage of a 0.37m2 2 kW Internally Reformed MCFC Stack at 650 °C and 1 atm. Fuel, 100 percent CH4, Oxidant, 12 percent CO2/9 percent O2/77 percent N2 .................................................................................. 6-35 Figure 6-17 Model Predicted and Constant Flow Polarization Data Comparison (98)......... 6-37 Figure 7-1 Electrolyte Conductivity as a Function of Temperature (4, 5, 6) ........................ 7-3 Figure 7-2 (a) Sulfur Tolerance of Ni-YSZ Anodes (16, 17) and (b) Relationship between Fuel Sulfur and Anode Sulfur Concentration. ....................................... 7-5 Figure 7-3 Impact of Chromia Poisoning on the Performance of Cells with Different Electrolytes (From (21)) ...................................................................................... 7-6 Figure 7-4 Stability of Metal Oxides in Stainless Steels (26,27) .......................................... 7-8 Figure 7-5 Impact of LSCM Contact Layer on Contact Resistance in Cell with Metal Interconnect (from (28)). ..................................................................................... 7-8 Figure 7-6 Possible Seal Types in a Planar SOFC (from (29)) ........................................... 7-10 Figure 7-7 Expansion of Typical Cell Components in a 10 cm x 10 cm Planar SOFC with Ni-YSZ anode, YSZ Electrolyte, LSM Cathode, and Ferritic Steel Interconnect........................................................................................................ 7-11 Figure 7-8 Structure of Mica and Mica-Glass Hybrid Seals and Performance of Hybrid Seals (29) ............................................................................................... 7-13

xi
Figure 7-9 Three Types of Tubular SOFC: (a) Conduction around the Tube (e.g. Siemens Westinghouse and Toto (31)); (b) Conduction along the Tube (e.g. Acumentrics (32)); (c) Segmented in Series (e.g. Mitsubishi Heavy Industries, Rolls Royce (33,34)). ....................................................................... 7-14 Figure 7-10 Cell Performance and Dimensions of Accumentrics Technology (32). ............ 7-15 Figure 7-11 Schematic cross-section of cylindrical Siemens Westinghouse SOFC Tube. ... 7-16 Figure 7-12 Gas Manifold Design for a Tubular SOFC and Cell-to-Cell Connections in a Tubular SOFC (41) ......................................................................................... 7-19 Figure 7-13 Performance Advantage of Sealless Planar (HPD5) over Conventional Siemens Westinghouse Technology (42.).......................................................... 7-21 Figure 7-14 Effect of Pressure on AES Cell Performance at 1,000 °C (2.2 cm diameter, 150 cm active length)......................................................................................... 7-22 Figure 7-15 Two-Cell Stack Performance with 67 percent H2 + 22 percent CO + 11 percent H2O/Air ................................................................................................. 7-23 Figure 7-16 Two Cell Stack Performance with 97% H2 and 3% H2O/Air (43) .................... 7-25 Figure 7-17 Cell Performance at 1,000 °C with Pure Oxygen (o) and Air (∆) Both at 25 percent Utilization (Fuel (67 percent H2/22 percent CO/11 percent H2O) Utilization is 85 percent).................................................................................... 7-26 Figure 7-18 Influence of Gas Composition of the Theoretical Open-Circuit Potential of SOFC at 1,000 °C .......................................................................................... 7-27 Figure 7-19 Variation in Cell Voltage as a Function of Fuel Utilization and Temperature (Oxidant (o - Pure O2; ∆ - Air) Utilization is 25 percent. Current Density is 160 mA/cm2 at 800, 900 and 1,000 °C and 79 mA/cm2 at 700 °C)................... 7-28 Figure 7-20 SOFC Performance at 1,000 °C and 350 mA/cm2, 85 percent Fuel Utilization and 25 percent Air Utilization (Fuel = Simulated Air-Blown Coal Gas Containing 5,000 ppm NH3, 1 ppm HCl and 1 ppm H2S) ................. 7-29 Figure 7-21 Voltage-Current Characteristics of an AES Cell (1.56 cm Diameter, 50 cm Active Length) ........................................................................................ 7-30 Figure 7-22 Overview of Types of Planar SOFC: (a) Planar Anode-Supported SOFC with Metal Interconnects(68); (b) Electrolyte-Supported Planar SOFC Technology with Metal Interconnect (57,58,68); (c) Electrolyte-Supported Design with “egg-crate” electrolyte shape and ceramic interconnect (62,63,64,65). ..................................................................................................... 7-33 Figure 7-23 Representative State-of-the-Art Button Cell Performance of Anode- Supported SOFC (1) ......................................................................................... 7-37 Figure 7-24 Single Cell Performance of LSGM Electrolyte (50 µm thick) .......................... 7-38 Figure 7-25 Effect of Oxidant Composition on a High Performance Anode-Supported Cell..................................................................................................................... 7-39 Figure 7-26 Examples of State-of-the-Art Planar Anode-Supported SOFC Stacks and Their Performance Characteristics (69,79,78) ................................................... 7-40 Figure 7-27 Trend in Cell and Single-Cell-Stack Performance in Planar SOFC (69)........... 7-41 Figure 7-28 Siemens Westinghouse 250 kW Tubular SOFC Installation (31) ..................... 7-42 Figure 7-29 Example of Window-Pane-Style Stack Scale-Up of Planar Anode-Supported SOFC to 250 kW................................................................................................ 7-43 Figure 8-1 A Rudimentary Fuel Cell Power System Schematic............................................. 8-1 Figure 8-2 Representative Fuel Processing Steps & Temperatures....................................... 8-3

xii
Figure 8-3 “Well-To-Wheel” Efficiency for Various Vehicle Scenarios (9) ........................ 8-9 Figure 8-4 Carbon Deposition Mapping of Methane (CH4)................................................ 8-24 Figure 8-5 Carbon Deposition Mapping of Octane (C8H18)................................................ 8-24 Figure 8-6 Block diagram of a fuel cell power system........................................................ 8-27 Figure 8-7a Typical fuel cell voltage / current characteristics .............................................. 8-28 Figure 8-7b Fuel cell power vs. current curve....................................................................... 8-28 Figure 8-8 Block diagram of a typical fuel cell powered unit for supplying a load (120V/240V) ...................................................................................................... 8-30 Figure 8-9a Block diagram of the power conditioning unit with line frequency transformer......................................................................................................... 8-31 Figure 8-9b Circuit topology of the power conditioning unit with line frequency transformer......................................................................................................... 8-31 Figure 8-10a Block diagram of the power conditioning unit with high frequency isolation transformer within the DC-DC converter stage ................................................. 8-32 Figure 8-10b Circuit topology of the power conditioning unit with high frequency isolation transformer within the DC-DC converter stage .................................. 8-32 Figure 8-11a Block diagram of the power conditioning unit with fewer power conversion stages in series path of the power flow .............................................................. 8-33 Figure 8-11b Circuit topology of the power conditioning unit with fewer power
conversion stages in series path of the power flow............................................ 8-33 Figure 8-12 Fuel cell power conditioner control system for powering dedicated loads ....... 8-33 Figure 8-13 Diagram of a modular fuel cell power conversion unit for supplying backup power to a load connected to a local utility [10,11]........................................... 8-34 Figure 8-14 Modular power conditioning circuit topology employing two fuel cells to supply a load via a line frequency isolation transformer [10,11] ...................... 8-36 Figure 8-15 Modular power conditioning circuit topology employing two fuel cells using a higher voltage (400V) dc-link [10,11]................................................... 8-36 Figure 8-16 Fuel cell supplying a load in parallel with the utility......................................... 8-37 Figure 8-17 Fuel cell power conditioner control system for supplying power to the utility (utility interface)...................................................................................... 8-38 Figure 8-18 A typical fuel cell vehicle system [16] .............................................................. 8-39 Figure 8-19 Power conditioning unit for fuel cell hybrid vehicle ......................................... 8-40 Figure 8-20 Fuel cell power conditioner control system [16] ............................................... 8-40 Figure 8-21 Power conditioning unit for the 250kW fuel cell turbine hybrid system........... 8-41 Figure 8-22 Alternative power conditioning unit for the fuel cell turbine hybrid system with shared dc-link [19] ..................................................................................... 8-42 Figure 8-23 Possible medium voltage power conditioning topology for megawatt range hybrid fuel cell systems [19].............................................................................. 8-43 Figure 8-24 Representative cost of power conditioning as a function of power and dc-link voltage ................................................................................................... 8-44 Figure 8-25 Optimization Flexibility in a Fuel Cell Power System ...................................... 8-47 Figure 8-26 Natural Gas Fueled PEFC Power Plant ............................................................. 8-52 Figure 8-27 Natural Gas fueled PAFC Power System .......................................................... 8-54 Figure 8-28 Natural Gas Fueled MCFC Power System ........................................................ 8-56 Figure 8-29 Schematic for a 4.5 MW Pressurized SOFC...................................................... 8-58 Figure 8-30 Schematic for a 4 MW Solid State Fuel Cell System ....................................... 8-63

xiii
Figure 8-31 Schematic for a 500 MW Class Coal Fueled Pressurized SOFC....................... 8-66 Figure 8-32 Regenerative Brayton Cycle Fuel Cell Power System ...................................... 8-71 Figure 8-33 Combined Brayton-Rankine Cycle Fuel Cell Power Generation System ......... 8-74 Figure 8-34 Combined Brayton-Rankine Cycle Thermodynamics ....................................... 8-75 Figure 8-35 T-Q Plot for Heat Recovery Steam Generator (Brayton-Rankine).................... 8-76 Figure 8-36 Fuel Cell Rankine Cycle Arrangement .............................................................. 8-77 Figure 8-37 T-Q Plot of Heat Recovery from Hot Exhaust Gas ........................................... 8-78 Figure 8-38 MCFC System Designs...................................................................................... 8-83 Figure 8-39 Stacks in Series Approach Reversibility............................................................ 8-84 Figure 8-40 MCFC Network ................................................................................................. 8-87 Figure 8-41 Estimated performance of Power Generation Systems...................................... 8-91Figure 8-42 Diagram of a Proposed Siemens-Westinghouse Hybrid System....................... 8-91 Figure 8-43 Overview of Fuel Cell Activities Aimed at APU Applications......................... 8-96 Figure 8-44 Overview of APU Applications ......................................................................... 8-96 Figure 8-45 Overview of typical system requirements.......................................................... 8-97 Figure 8-46 Stage of development for fuel cells for APU applications ................................ 8-98 Figure 8-47 Overview of subsystems and components for SOFC and PEFC systems ....... 8-100 Figure 8-48 Simplified System process flow diagram of pre-reformer/SOFC system ....... 8-101 Figure 8-49 Multilevel system modeling approach. ............................................................ 8-102 Figure 8-50 Projected cost structure of a 5kWnet APU SOFC system. Gasoline fueled POX reformer, Fuel cell operating at 300mW/cm2, 0.7 V, 90 percent fuel utilization, 500,000 units per year production volume. ................................... 8-104 Figure 10-1 Equilibrium Constants (Partial Pressures in MPa) for (a) Water Gas Shift, (b) Methane Formation, (c) Carbon Deposition (Boudouard Reaction), and (d) Methane Decomposition (J.R. Rostrup-Nielsen, in Catalysis Science and Technology, Edited by J.R. Anderson and M. Boudart, Springer-Verlag, Berlin GDR, p.1, 1984.)...................................................................................... 10-2

xiv
LIST OF TABLES AND EXAMPLES Table Title Page Table 1-1 Summary of Major Differences of the Fuel Cell Types ...................................... 1-8 Table 1-2 Summary of Major Fuel Constituents Impact on PEFC, AFC, PAFC, MCFC, and SOFC.............................................................................................. 1-14 Table 1-3 Attributes of Selected Distributed Generation Systems..................................... 1-20 Table 2-1 Electrochemical Reactions in Fuel Cells ............................................................. 2-4 Table 2-2 Fuel Cell Reactions and the Corresponding Nernst Equations............................ 2-5 Table 2-3 Ideal Voltage as a Function of Cell Temperature ................................................ 2-6 Table 2-4 Outlet Gas Composition as a Function of Utilization in MCFC at 650°C ........ 2-24 Table 5-1 Evolution of Cell Component Technology for Phosphoric Acid Fuel Cells ....... 5-4 Table 5-2 Advanced PAFC Performance............................................................................. 5-8 Table 5-3 Dependence of k(T) on Temperature .................................................................. 5-17 Table 6-1 Evolution of Cell Component Technology for Molten Carbonate Fuel Cells ..... 6-5 Table 6-2 Amount in Mol percent of Additives to Provide Optimum Performance (39) .. 6-11 Table 6-3 Qualitative Tolerance Levels for Individual Contaminants in Isothermal Bench-Scale Carbonate Fuel Cells (46, 47, and 48) .......................................... 6-13 Table 6-4 Equilibrium Composition of Fuel Gas and Reversible Cell Potential as a Function of Temperature.................................................................................... 6-20 Table 6-5 Influence of Fuel Gas Composition on Reversible Anode Potential at 650 °C (68, Table 1, Pg. 385) ......................................................................................... 6-24 Table 6-6 Contaminants from Coal-Derived Fuel Gas and Their Potential Effect on MCFCs (70, Table 1, Pg. 299) ........................................................................... 6-26 Table 6-7 Gas Composition and Contaminants from Air-Blown Coal Gasifier After Hot Gas Cleanup, and Tolerance Limit of MCFCs to Contaminants ................ 6-27 Table 7-1 Evolution of Cell Component Technology for Tubular Solid Oxide Fuel Cells ................................................................................................................... 7-17 Table 7-2 K Values for ∆VT............................................................................................... 7-24 Table 7-3 SECA Program Goals for SOFC Stacks (71) .................................................... 7-34 Table 7-4 Recent Technology Advances on Planar Cells and Potential Benefits.............. 7-36 Table 7-5 SOFC Manufacturers and Status of Their Technology...................................... 7-44 Table 8-1 Calculated Thermoneutral Oxygen-to-Fuel Molar Ratios (xo) and Maximum Theoretical Efficiencies (at xo) for Common Fuels (23).................................... 8-16 Table 8-2 Typical Steam Reformed Natural Gas Reformate ............................................. 8-17 Table 8-3 Typical Partial Oxidation Reformed Fuel Oil Reformate (24) .......................... 8-19 Table 8-4 Typical Coal Gas Compositions for Selected Oxygen-Blown Gasifiers ........... 8-21 Table 8-5 Specifications of a typical fuel cell power conditioning unit for stand-alone domestic (U.S.) loads......................................................................................... 8-29 Table 8-6 Example specifications for the 1kW fuel cell powered backup power (UPS) unit [10,11].............................................................................................. 8-35 Table 8-7 Specifications of 500W PEFC fuel cell stack (available from Avista Labs [1])............................................................................................................. 8-36 Table 8-8 Stream Properties for the Natural Gas Fueled Pressurized PAFC..................... 8-54 Table 8-9 Operating/Design Parameters for the NG fueled PAFC.................................... 8-55 Table 8-10 Performance Summary for the NG fueled PAFC .............................................. 8-55
xv
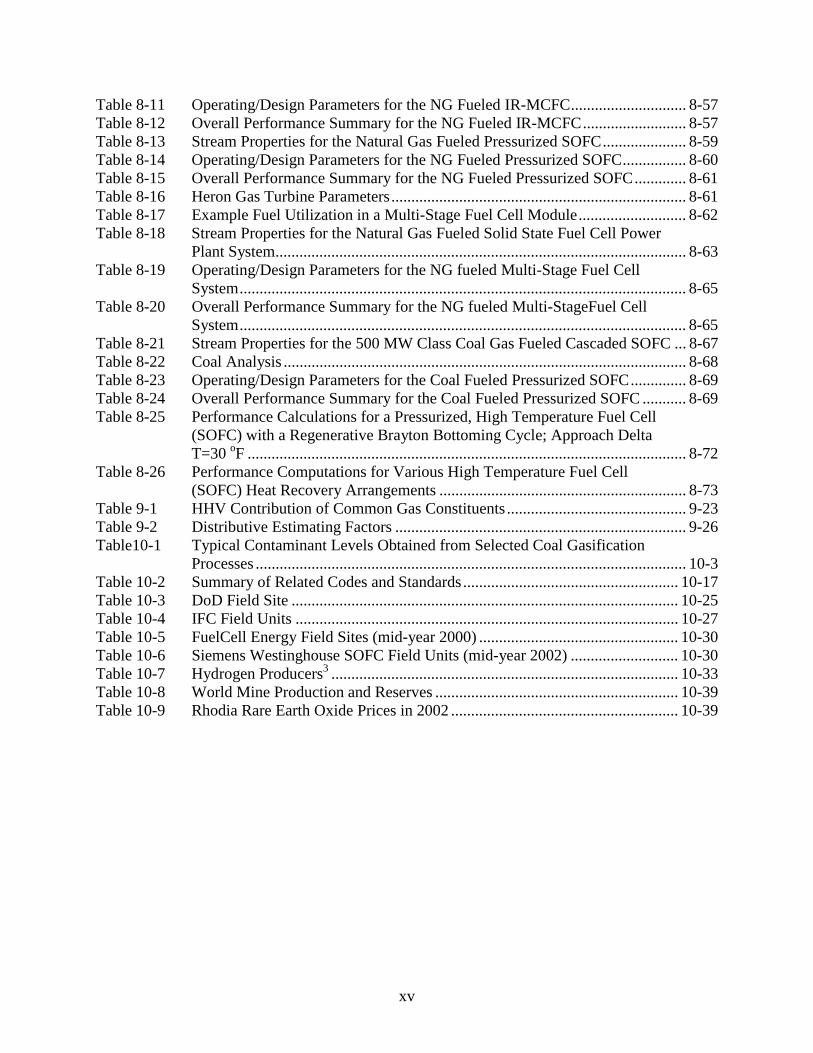
Table 8-11 Operating/Design Parameters for the NG Fueled IR-MCFC............................. 8-57 Table 8-12 Overall Performance Summary for the NG Fueled IR-MCFC.......................... 8-57 Table 8-13 Stream Properties for the Natural Gas Fueled Pressurized SOFC..................... 8-59 Table 8-14 Operating/Design Parameters for the NG Fueled Pressurized SOFC................ 8-60 Table 8-15 Overall Performance Summary for the NG Fueled Pressurized SOFC............. 8-61 Table 8-16 Heron Gas Turbine Parameters.......................................................................... 8-61 Table 8-17 Example Fuel Utilization in a Multi-Stage Fuel Cell Module........................... 8-62 Table 8-18 Stream Properties for the Natural Gas Fueled Solid State Fuel Cell Power Plant System....................................................................................................... 8-63 Table 8-19 Operating/Design Parameters for the NG fueled Multi-Stage Fuel Cell System................................................................................................................ 8-65 Table 8-20 Overall Performance Summary for the NG fueled Multi-StageFuel Cell System................................................................................................................ 8-65 Table 8-21 Stream Properties for the 500 MW Class Coal Gas Fueled Cascaded SOFC ... 8-67 Table 8-22 Coal Analysis ..................................................................................................... 8-68 Table 8-23 Operating/Design Parameters for the Coal Fueled Pressurized SOFC.............. 8-69 Table 8-24 Overall Performance Summary for the Coal Fueled Pressurized SOFC ........... 8-69 Table 8-25 Performance Calculations for a Pressurized, High Temperature Fuel Cell (SOFC) with a Regenerative Brayton Bottoming Cycle; Approach Delta T=30 oF .............................................................................................................. 8-72 Table 8-26 Performance Computations for Various High Temperature Fuel Cell (SOFC) Heat Recovery Arrangements .............................................................. 8-73 Table 9-1 HHV Contribution of Common Gas Constituents ............................................. 9-23 Table 9-2 Distributive Estimating Factors ......................................................................... 9-26 Table10-1 Typical Contaminant Levels Obtained from Selected Coal Gasification Processes ............................................................................................................ 10-3 Table 10-2 Summary of Related Codes and Standards ...................................................... 10-17 Table 10-3 DoD Field Site ................................................................................................. 10-25 Table 10-4 IFC Field Units ................................................................................................ 10-27 Table 10-5 FuelCell Energy Field Sites (mid-year 2000) .................................................. 10-30 Table 10-6 Siemens Westinghouse SOFC Field Units (mid-year 2002) ........................... 10-30 Table 10-7 Hydrogen Producers3 ....................................................................................... 10-33 Table 10-8 World Mine Production and Reserves ............................................................. 10-39 Table 10-9 Rhodia Rare Earth Oxide Prices in 2002 ......................................................... 10-39

xvi
FORWARD
Fuel cells are one of the cleanest and most efficient technologies for generating electricity. Since there is no combustion, there are none of the pollutants commonly produced by boilers and furnaces. For systems designed to consume hydrogen directly, the only products are electricity, water and heat. Fuel cells are an important technology for a potentially wide variety of applications including on-site electric power for households and commercial buildings; supplemental or auxiliary power to support car, truck and aircraft systems; power for personal, mass and commercial transportation; and the modular addition by utilities of new power generation closely tailored to meet growth in power consumption. These applications will be in a large number of industries worldwide. In this Seventh Edition of the Fuel Cell Handbook, we have discussed the Solid State Energy Conversion Alliance Program (SECA) activities. In addition, individual fuel cell technologies and other supporting materials have been updated. Finally, an updated index assists the reader in locating specific information quickly. It is an important task that NETL undertakes to provide you with this handbook. We realize it is an important educational and informational tool for a wide audience. We welcome suggestions to improve the handbook. Mark C. Williams Strategic Center for Natural Gas National Energy Technology Laboratory

xvii
PREFACE
The last edition of the Fuel Cell Handbook was published in November, 2002. Since that time, the Solid State Energy Conversion Alliance (SECA-www.seca.doe.gov) has funded activities to bring about dramatic reductions in fuel cell costs, and rates as the most important event to report on since the 2000 edition. SECA industry teams’ have continued to evaluate and test fuel cell designs, candidate materials, manufacturing methods, and balance-of-plant subsystems. SECA’s goal is to cut costs to as low as $400 per kilowatt by the end of this decade, which would make fuel cells competitive for virtually every type of power application. The initiative signifies the Department's objective of developing a modular, all-solid-state fuel cell that could be mass-produced for different uses much the way electronic components are manufactured and sold today.
SECA has six industry teams working on competing designs for the distributed generation and auxiliary power applications. These teams are headed by: FuelCell Energy, Delphi Battelle, General Electric Company, Siemens Westinghouse, Acumentrics, and Cummins Power Generation and SOFCo. The SECA industry teams receive core technology support from leading researchers at small businesses, universities and national laboratories. Over 30 SECA R&D projects are generating new scientific and engineering knowledge, creating technology breakthroughs by addressing technical risks and barriers that currently limit achieving SECA performance and cost goals. U.S. Department of Energy’s (DOE’s) SECA program, have considerably advanced the knowledge and development of thin-electrolyte planar SOFC. As a consequence of the performance improvements, SOFC are now considered for a wide range of applications, including stationary power generation, mobile power, auxiliary power for vehicles, and specialty applications. A new generation of intermediate temperature (650-800 oC) SOFCs is being developed under the U.S. DOE’s SECA program. Fuel processing by an autothermal, steam, or partial oxidation reformer that operates between 500-800 °C enables fuel cell operation on gasoline, diesel fuel, and other hydrocarbon fuels. This Handbook provides a foundation in fuel cells for persons wanting a better understanding of the technology, its benefits, and the systems issues that influence its application. Trends in technology are discussed, including next-generation concepts that promise ultra-high efficiency and low cost, while providing exceptionally clean power plant systems. Section 1 summarizes fuel cell progress since the last edition, and includes existing power plant nameplate data. Section 2 addresses the thermodynamics of fuel cells to provide an understanding of fuel cell operation. Sections 3 through 7 describe the five major fuel cell types and their performance.

xviii
Polymer electrolyte, alkaline, phosphoric acid, molten carbonate, and solid oxide fuel cell technology descriptions have been updated from the previous edition. Manufacturers are focusing on reducing fuel cell life cycle costs. In this edition, we have included over 5,000 fuel cell patent abstracts and their claims. In addition, the handbook features a new fuel cell power conditioning section, and overviews on the hydrogen industry and rare earth minerals market.

xix
ACKNOWLEDGEMENTS
The authors of this edition of the Fuel Cell Handbook acknowledge the cooperation of the fuel cell community for their contributions to this Handbook. Many colleagues provided data, information, references, valuable suggestions, and constructive comments that were incorporated into the Handbook. In particular, we would like to acknowledge the contributions J. Thijssen. The authors wish to thank M. Williams, and H. Quedenfeld of the U.S. Department of Energy, National Energy Technology Laboratory, for their support and encouragement, and for providing the opportunity to enhance the quality of this Handbook. This work was supported by the U.S. Department of Energy, National Energy Technology Laboratory, under Contract DE-AM21-94MC31166.

1-1
1. TECHNOLOGY OVERVIEW
This chapter provides an overview of fuel cell technology. First it discusses the basic workings of fuel cells and basic fuel cell system components. Then, an overview of the main fuel cell types, their characteristics, and their development status is provided. Finally, this chapter reviews potential fuel cell applications. 1.1 Introduction Fuel cells are electrochemical devices that convert chemical energy in fuels into electrical energy directly, promising power generation with high efficiency and low environmental impact. Because the intermediate steps of producing heat and mechanical work typical of most conventional power generation methods are avoided, fuel cells are not limited by thermodynamic limitations of heat engines such as the Carnot efficiency. In addition, because combustion is avoided, fuel cells produce power with minimal pollutant. However, unlike batteries the reductant and oxidant in fuel cells must be continuously replenished to allow continuous operation. Fuel cells bear significant resemblance to electrolyzers. In fact, some fuel cells operate in reverse as electrolyzers, yielding a reversible fuel cell that can be used for energy storage. Though fuel cells could, in principle, process a wide variety of fuels and oxidants, of most interest today are those fuel cells that use common fuels (or their derivatives) or hydrogen as a reductant, and ambient air as the oxidant. Most fuel cell power systems comprise a number of components: • Unit cells, in which the electrochemical reactions take place • Stacks, in which individual cells are modularly combined by electrically connecting the cells
to form units with the desired output capacity • Balance of plant which comprises components that provide feedstream conditioning
(including a fuel processor if needed), thermal management, and electric power conditioning among other ancillary and interface functions
In the following, an overview of fuel cell technology is given according to each of these categories, followed by a brief review of key potential applications of fuel cells.

1-2
1.2 Unit Cells 1.2.1 Basic Structure Unit cells form the core of a fuel cell. These devices convert the chemical energy contained in a fuel electrochemically into electrical energy. The basic physical structure, or building block, of a fuel cell consists of an electrolyte layer in contact with an anode and a cathode on either side. A schematic representation of a unit cell with the reactant/product gases and the ion conduction flow directions through the cell is shown in Figure 1-1.
Load2e -
Fuel In Oxidant In
Posit ive Ion or
Negative Ion
Depleted Oxidant andProduct Gases Out
Depleted Fuel and Product Gases Out
Anode Cathode Electrolyte
(Ion Conductor)
H 2
H 2 O
H 2 O
½O 2
Figure 1-1 Schematic of an Individual Fuel Cell In a typical fuel cell, fuel is fed continuously to the anode (negative electrode) and an oxidant (often oxygen from air) is fed continuously to the cathode (positive electrode). The electrochemical reactions take place at the electrodes to produce an electric current through the electrolyte, while driving a complementary electric current that performs work on the load. Although a fuel cell is similar to a typical battery in many ways, it differs in several respects. The battery is an energy storage device in which all the energy available is stored within the battery itself (at least the reductant). The battery will cease to produce electrical energy when the chemical reactants are consumed (i.e., discharged). A fuel cell, on the other hand, is an energy conversion device to which fuel and oxidant are supplied continuously. In principle, the fuel cell produces power for as long as fuel is supplied. Fuel cells are classified according to the choice of electrolyte and fuel, which in turn determine the electrode reactions and the type of ions that carry the current across the electrolyte. Appleby and Foulkes (1) have noted that, in theory, any substance capable of chemical oxidation that can be supplied continuously (as a fluid) can be burned galvanically as fuel at the anode of a fuel cell. Similarly, the oxidant can be any fluid that can be reduced at a sufficient rate. Though the direct use of conventional fuels in fuel cells would be desirable, most fuel cells under development today use gaseous hydrogen, or a synthesis gas rich in hydrogen, as a fuel. Hydrogen has a high reactivity for anode reactions, and can be produced chemically from a wide range of fossil and renewable fuels, as well as via electrolysis. For similar practical reasons, the most common oxidant is gaseous oxygen, which is readily available from air. For space

1-3
applications, both hydrogen and oxygen can be stored compactly in cryogenic form, while the reaction product is only water. 1.2.2 Critical Functions of Cell Components A critical portion of most unit cells is often referred to as the three-phase interface. These mostly microscopic regions, in which the actual electrochemical reactions take place, are found where either electrode meets the electrolyte. For a site or area to be active, it must be exposed to the reactant, be in electrical contact with the electrode, be in ionic contact with the electrolyte, and contain sufficient electro-catalyst for the reaction to proceed at the desired rate. The density of these regions and the nature of these interfaces play a critical role in the electrochemical performance of both liquid and solid electrolyte fuel cells: • In liquid electrolyte fuel cells, the reactant gases diffuse through a thin electrolyte film that
wets portions of the porous electrode and react electrochemically on their respective electrode surface. If the porous electrode contains an excessive amount of electrolyte, the electrode may "flood" and restrict the transport of gaseous species in the electrolyte phase to the reaction sites. The consequence is a reduction in electrochemical performance of the porous electrode. Thus, a delicate balance must be maintained among the electrode, electrolyte, and gaseous phases in the porous electrode structure.
• In solid electrolyte fuel cells, the challenge is to engineer a large number of catalyst sites into the interface that are electrically and ionically connected to the electrode and the electrolyte, respectively, and that is efficiently exposed to the reactant gases. In most successful solid electrolyte fuel cells, a high-performance interface requires the use of an electrode which, in the zone near the catalyst, has mixed conductivity (i.e. it conducts both electrons and ions).
Over the past twenty years, the unit cell performance of at least some of the fuel cell technologies has been dramatically improved. These developments resulted from improvements in the three-phase boundary, reducing the thickness of the electrolyte, and developing improved electrode and electrolyte materials which broaden the temperature range over which the cells can be operated. In addition to facilitating electrochemical reactions, each of the unit cell components have other critical functions. The electrolyte not only transports dissolved reactants to the electrode, but also conducts ionic charge between the electrodes, and thereby completes the cell electric circuit as illustrated in Figure 1-1. It also provides a physical barrier to prevent the fuel and oxidant gas streams from directly mixing. The functions of porous electrodes in fuel cells, in addition to providing a surface for electrochemical reactions to take place, are to:
1) conduct electrons away from or into the three-phase interface once they are formed (so an electrode must be made of materials that have good electrical conductance) and provide current collection and connection with either other cells or the load
2) ensure that reactant gases are equally distributed over the cell 3) ensure that reaction products are efficiently led away to the bulk gas phase

1-4
As a consequence, the electrodes are typically porous and made of an electrically conductive material. At low temperatures, only a few relatively rare and expensive materials provide sufficient electro-catalytic activity, and so such catalysts are deposited in small quantities at the interface where they are needed. In high-temperature fuel cells, the electro-catalytic activity of the bulk electrode material is often sufficient. Though a wide range of fuel cell geometries has been considered, most fuel cells under development now are either planar (rectangular or circular) or tubular (either single- or double-ended and cylindrical or flattened). 1.3 Fuel Cell Stacking For most practical fuel cell applications, unit cells must be combined in a modular fashion into a cell stack to achieve the voltage and power output level required for the application. Generally, the stacking involves connecting multiple unit cells in series via electrically conductive interconnects. Different stacking arrangements have been developed, which are described below. 1.3.1 Planar-Bipolar Stacking The most common fuel cell stack design is the so-called planar-bipolar arrangement (Figure 1-2 depicts a PAFC). Individual unit cells are electrically connected with interconnects. Because of the configuration of a flat plate cell, the interconnect becomes a separator plate with two functions:
1) to provide an electrical series connection between adjacent cells, specifically for flat plate cells, and
2) to provide a gas barrier that separates the fuel and oxidant of adjacent cells. In many planar-bipolar designs, the interconnect also includes channels that distribute the gas flow over the cells. The planar-bipolar design is electrically simple and leads to short electronic current paths (which helps to minimize cell resistance).
Figure 1-2 Expanded View of a Basic Fuel Cell Unit in a Fuel Cell Stack (1)

1-5
Planar-bipolar stacks can be further characterized according to arrangement of the gas flow:
• Cross-flow. Air and fuel flow perpendicular to each other • Co-flow. Air and fuel flow parallel and in the same direction. In the case of circular
cells, this means the gases flow radially outward • Counter-flow. Air and fuel flow parallel but in opposite directions. Again, in the case
of circular cells this means radial flow • Serpentine flow. Air or fuel follow a zig-zag path • Spiral flow. Applies to circular cells
The choice of gas-flow arrangement depends on the type of fuel cell, the application, and other considerations. Finally, the manifolding of gas streams to the cells in bipolar stacks can be achieved in various ways: • Internal: the manifolds run through the unit cells • Integrated: the manifolds do not penetrate the unit cells but are integrated in the
interconnects • External: the manifold is completely external to the cell, much like a wind-box 1.3.2 Stacks with Tubular Cells Especially for high-temperature fuel cells, stacks with tubular cells have been developed. Tubular cells have significant advantages in sealing and in the structural integrity of the cells. However, they represent a special geometric challenge to the stack designer when it comes to achieving high power density and short current paths. In one of the earliest tubular designs the current is conducted tangentially around the tube. Interconnects between the tubes are used to form rectangular arrays of tubes. Alternatively, the current can be conducted along the axis of the tube, in which case interconnection is done at the end of the tubes. To minimize the length of electronic conduction paths for individual cells, sequential series connected cells are being developed. The cell arrays can be connected in series or in parallel. For a more detailed description of the different stack types and pictorial descriptions, the reader is referred to Chapter 7 on SOFC (SOFC is the fuel cell type for which the widest range of cell and stack geometries is pursued). To avoid the packing density limitations associated with cylindrical cells, some tubular stack designs use flattened tubes. 1.4 Fuel Cell Systems In addition to the stack, practical fuel cell systems require several other sub-systems and components; the so-called balance of plant (BoP). Together with the stack, the BoP forms the fuel cell system. The precise arrangement of the BoP depends heavily on the fuel cell type, the fuel choice, and the application. In addition, specific operating conditions and requirements of individual cell and stack designs determine the characteristics of the BoP. Still, most fuel cell systems contain:

1-6
• Fuel preparation. Except when pure fuels (such as pure hydrogen) are used, some fuel preparation is required, usually involving the removal of impurities and thermal conditioning. In addition, many fuel cells that use fuels other than pure hydrogen require some fuel processing, such as reforming, in which the fuel is reacted with some oxidant (usually steam or air) to form a hydrogen-rich anode feed mixture.
• Air supply. In most practical fuel cell systems, this includes air compressors or blowers as well as air filters.
• Thermal management. All fuel cell systems require careful management of the fuel cell stack temperature.
• Water management. Water is needed in some parts of the fuel cell, while overall water is a reaction product. To avoid having to feed water in addition to fuel, and to ensure smooth operation, water management systems are required in most fuel cell systems.
• Electric power conditioning equipment. Since fuel cell stacks provide a variable DC voltage output that is typically not directly usable for the load, electric power conditioning is typically required.
While perhaps not the focus of most development effort, the BoP represents a significant fraction of the weight, volume, and cost of most fuel cell systems. Figure 1-3 shows a simple rendition of a fuel cell power plant. Beginning with fuel processing, a conventional fuel (natural gas, other gaseous hydrocarbons, methanol, naphtha, or coal) is cleaned, then converted into a gas containing hydrogen. Energy conversion occurs when dc electricity is generated by means of individual fuel cells combined in stacks or bundles. A varying number of cells or stacks can be matched to a particular power application. Finally, power conditioning converts the electric power from dc into regulated dc or ac for consumer use. Section 8.1 describes the processes of a fuel cell power plant system.

1-7
CleanExhaust
FuelProcessor
PowerSection
PowerConditioner
Air
ACPower
H2-RichGas
DCPower
UsableHeat
NaturalGas
Steam
CleanExhaust
Figure 1-3 Fuel Cell Power Plant Major Processes 1.5 Fuel Cell Types A variety of fuel cells are in different stages of development. The most common classification of fuel cells is by the type of electrolyte used in the cells and includes 1) polymer electrolyte fuel cell (PEFC), 2) alkaline fuel cell (AFC), 3) phosphoric acid fuel cell (PAFC), 4) molten carbonate fuel cell (MCFC), and 5) solid oxide fuel cell (SOFC). Broadly, the choice of electrolyte dictates the operating temperature range of the fuel cell. The operating temperature and useful life of a fuel cell dictate the physicochemical and thermomechanical properties of materials used in the cell components (i.e., electrodes, electrolyte, interconnect, current collector, etc.). Aqueous electrolytes are limited to temperatures of about 200 °C or lower because of their high vapor pressure and rapid degradation at higher temperatures. The operating temperature also plays an important role in dictating the degree of fuel processing required. In low-temperature fuel cells, all the fuel must be converted to hydrogen prior to entering the fuel cell. In addition, the anode catalyst in low-temperature fuel cells (mainly platinum) is strongly poisoned by CO. In high-temperature fuel cells, CO and even CH4 can be internally converted to hydrogen or even directly oxidized electrochemically. Table 1-1 provides an overview of the key characteristics of the main fuel cell types.

1-8
Table 1-1 Summary of Major Differences of the Fuel Cell Types
PEFC AFC PAFC MCFC SOFC Electrolyte
Hydrated Polymeric Ion
Exchange Membranes
Mobilized or Immobilized
Potassium Hydroxide in
asbestos matrix
Immobilized Liquid
Phosphoric Acid in SiC
Immobilized Liquid Molten
Carbonate in LiAlO2
Perovskites (Ceramics)
Electrodes
Carbon Transition
metals Carbon
Nickel and Nickel Oxide
Perovskite and
perovskite / metal cermet
Catalyst Platinum Platinum Platinum Electrode material
Electrode material
Interconnect Carbon or metal
Metal Graphite Stainless steel
or Nickel
Nickel, ceramic, or
steel
Operating Temperature
40 – 80 °C 65°C – 220 °C 205 °C 650 °C 600-1000 °C
Charge Carrier
H+ OH- H+ CO3= O=
External Reformer for hydrocarbon fuels
Yes Yes Yes No, for some
fuels
No, for some fuels and
cell designs
External shift conversion of CO to hydrogen
Yes, plus purification to remove trace
CO
Yes, plus purification to
remove CO and CO2
Yes No No
Prime Cell Components
Carbon-based Carbon-based Graphite-based Stainless-
based Ceramic
Product Water Management
Evaporative Evaporative Evaporative Gaseous Product
Gaseous Product
Product Heat Management
Process Gas + Liquid
Cooling Medium
Process Gas + Electrolyte Circulation
Process Gas + Liquid cooling
medium or steam
generation
Internal Reforming + Process Gas
Internal Reforming + Process Gas
In parallel with the classification by electrolyte, some fuel cells are classified by the type of fuel used: • Direct Alcohol Fuel Cells (DAFC). DAFC (or, more commonly, direct methanol fuel cells or
DMFC) use alcohol without reforming. Mostly, this refers to a PEFC-type fuel cell in which methanol or another alcohol is used directly, mainly for portable applications. A more detailed description of the DMFC or DAFC is provided in Chapter 3;

1-9
• Direct Carbon Fuel Cells (DCFC). In direct carbon fuel cells, solid carbon (presumably a fuel derived from coal, pet-coke or biomass) is used directly in the anode, without an intermediate gasification step. Concepts with solid oxide, molten carbonate, and alkaline electrolytes are all under development. The thermodynamics of the reactions in a DCFC allow very high efficiency conversion. Therefore, if the technology can be developed into practical systems, it could ultimately have a significant impact on coal-based power generation.
A brief description of various electrolyte cells of interest follows. Detailed descriptions of these fuel cells may be found in References (1) and (2). 1.5.1 Polymer Electrolyte Fuel Cell (PEFC) The electrolyte in this fuel cell is an ion exchange membrane (fluorinated sulfonic acid polymer or other similar polymer) that is an excellent proton conductor. The only liquid in this fuel cell is water; thus, corrosion problems are minimal. Typically, carbon electrodes with platinum electro-catalyst are used for both anode and cathode, and with either carbon or metal interconnects. Water management in the membrane is critical for efficient performance; the fuel cell must operate under conditions where the by-product water does not evaporate faster than it is produced because the membrane must be hydrated. Because of the limitation on the operating temperature imposed by the polymer, usually less than 100 °C, but more typically around 60 to 80 °C. , and because of problems with water balance, a H2-rich gas with minimal or no CO (a poison at low temperature) is used. Higher catalyst loading (Pt in most cases) than that used in PAFCs is required for both the anode and cathode. Extensive fuel processing is required with other fuels, as the anode is easily poisoned by even trace levels of CO, sulfur species, and halogens. PEFCs are being pursued for a wide variety of applications, especially for prime power for fuel cell vehicles (FCVs). As a consequence of the high interest in FCVs and hydrogen, the investment in PEFC over the past decade easily surpasses all other types of fuel cells combined. Although significant development of PEFC for stationary applications has taken place, many developers now focus on automotive and portable applications. Advantages: The PEFC has a solid electrolyte which provides excellent resistance to gas crossover. The PEFC’s low operating temperature allows rapid start-up and, with the absence of corrosive cell constituents, the use of the exotic materials required in other fuel cell types, both in stack construction and in the BoP is not required. Test results have demonstrated that PEFCs are capable of high current densities of over 2 kW/l and 2 W/cm2. The PEFC lends itself particularly to situations where pure hydrogen can be used as a fuel. Disadvantages: The low and narrow operating temperature range makes thermal management difficult, especially at very high current densities, and makes it difficult to use the rejected heat for cogeneration or in bottoming cycles. Water management is another significant challenge in PEFC design, as engineers must balance ensuring sufficient hydration of the electrolyte against flooding the electrolyte. In addition, PEFCs are quite sensitive to poisoning by trace levels of contaminants including CO, sulfur species, and ammonia. To some extent, some of these disadvantages can be counteracted by lowering operating current density and increasing

1-10
electrode catalyst loading, but both increase cost of the system. If hydrocarbon fuels are used, the extensive fuel processing required negatively impacts system size, complexity, efficiency (typically in the mid thirties), and system cost. Finally, for hydrogen PEFC the need for a hydrogen infrastructure to be developed poses a barrier to commercialization. 1.5.2 Alkaline Fuel Cell (AFC) The electrolyte in this fuel cell is concentrated (85 wt percent) KOH in fuel cells operated at high temperature (~250 °C), or less concentrated (35 to 50 wt percent) KOH for lower temperature (<120 °C) operation. The electrolyte is retained in a matrix (usually asbestos), and a wide range of electro-catalysts can be used (e.g., Ni, Ag, metal oxides, spinels, and noble metals). The fuel supply is limited to non-reactive constituents except for hydrogen. CO is a poison, and CO2 will react with the KOH to form K2CO3, thus altering the electrolyte. Even the small amount of CO2 in air must be considered a potential poison for the alkaline cell. Generally, hydrogen is considered as the preferred fuel for AFC, although some direct carbon fuel cells use (different) alkaline electrolytes. The AFC was one of the first modern fuel cells to be developed, beginning in 1960. The application at that time was to provide on-board electric power for the Apollo space vehicle. The AFC has enjoyed considerable success in space applications, but its terrestrial application has been challenged by its sensitivity to CO2. Still, some developers in the U.S. and Europe pursue AFC for mobile and closed-system (reversible fuel cell) applications. Advantages: Desirable attributes of the AFC include its excellent performance on hydrogen (H2) and oxygen (O2) compared to other candidate fuel cells due to its active O2 electrode kinetics and its flexibility to use a wide range of electro-catalysts. Disadvantages: The sensitivity of the electrolyte to CO2 requires the use of highly pure H2 as a fuel. As a consequence, the use of a reformer would require a highly effective CO and CO2 removal system. In addition, if ambient air is used as the oxidant, the CO2 in the air must be removed. While this is technically not challenging, it has a significant impact on the size and cost of the system. 1.5.3 Phosphoric Acid Fuel Cell (PAFC) Phosphoric acid, concentrated to 100 percent, is used as the electrolyte in this fuel cell, which typically operates at 150 to 220 °C. At lower temperatures, phosphoric acid is a poor ionic conductor, and CO poisoning of the Pt electro-catalyst in the anode becomes severe. The relative stability of concentrated phosphoric acid is high compared to other common acids; consequently the PAFC is capable of operating at the high end of the acid temperature range (100 to 220 °C). In addition, the use of concentrated acid (100 percent) minimizes the water vapor pressure so water management in the cell is not difficult. The matrix most commonly used to retain the acid is silicon carbide (1), and the electro-catalyst in both the anode and cathode is Pt. PAFCs are mostly developed for stationary applications. Both in the U.S. and Japan, hundreds of PAFC systems were produced, sold, and used in field tests and demonstrations. It is still one of the few fuel cell systems that are available for purchase. Development of PAFC had slowed
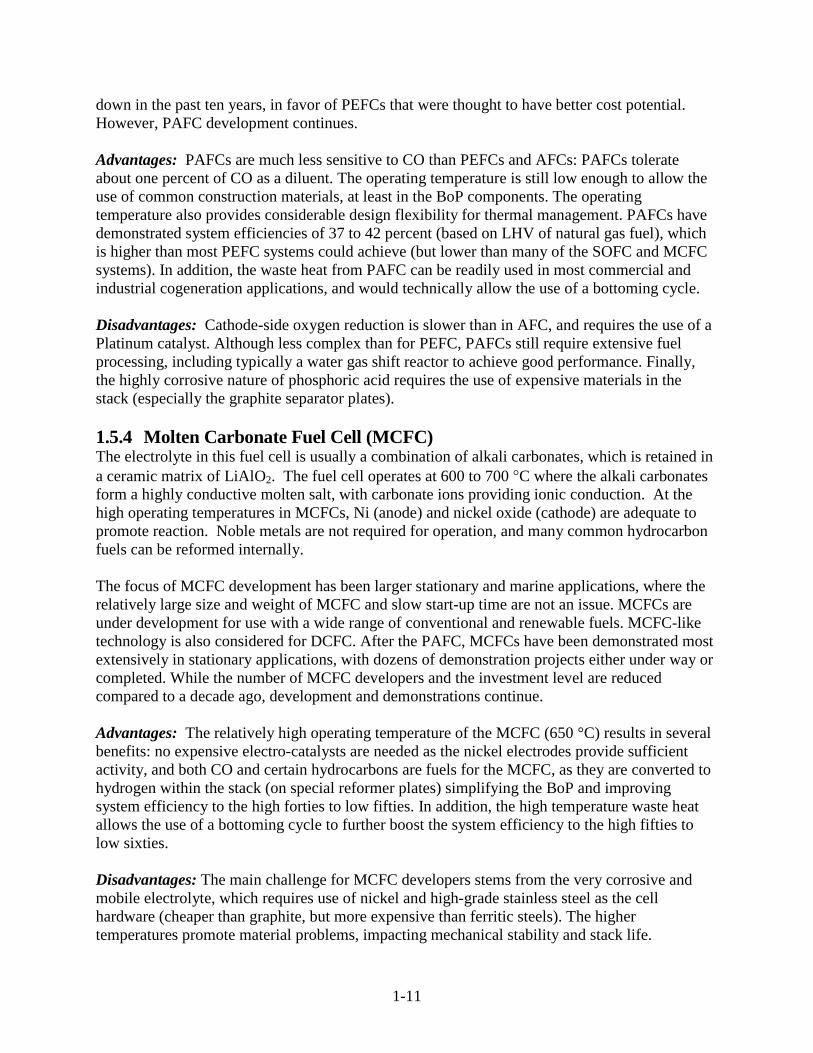
1-11
down in the past ten years, in favor of PEFCs that were thought to have better cost potential. However, PAFC development continues. Advantages: PAFCs are much less sensitive to CO than PEFCs and AFCs: PAFCs tolerate about one percent of CO as a diluent. The operating temperature is still low enough to allow the use of common construction materials, at least in the BoP components. The operating temperature also provides considerable design flexibility for thermal management. PAFCs have demonstrated system efficiencies of 37 to 42 percent (based on LHV of natural gas fuel), which is higher than most PEFC systems could achieve (but lower than many of the SOFC and MCFC systems). In addition, the waste heat from PAFC can be readily used in most commercial and industrial cogeneration applications, and would technically allow the use of a bottoming cycle. Disadvantages: Cathode-side oxygen reduction is slower than in AFC, and requires the use of a Platinum catalyst. Although less complex than for PEFC, PAFCs still require extensive fuel processing, including typically a water gas shift reactor to achieve good performance. Finally, the highly corrosive nature of phosphoric acid requires the use of expensive materials in the stack (especially the graphite separator plates). 1.5.4 Molten Carbonate Fuel Cell (MCFC) The electrolyte in this fuel cell is usually a combination of alkali carbonates, which is retained in a ceramic matrix of LiAlO2. The fuel cell operates at 600 to 700 °C where the alkali carbonates form a highly conductive molten salt, with carbonate ions providing ionic conduction. At the high operating temperatures in MCFCs, Ni (anode) and nickel oxide (cathode) are adequate to promote reaction. Noble metals are not required for operation, and many common hydrocarbon fuels can be reformed internally. The focus of MCFC development has been larger stationary and marine applications, where the relatively large size and weight of MCFC and slow start-up time are not an issue. MCFCs are under development for use with a wide range of conventional and renewable fuels. MCFC-like technology is also considered for DCFC. After the PAFC, MCFCs have been demonstrated most extensively in stationary applications, with dozens of demonstration projects either under way or completed. While the number of MCFC developers and the investment level are reduced compared to a decade ago, development and demonstrations continue. Advantages: The relatively high operating temperature of the MCFC (650 °C) results in several benefits: no expensive electro-catalysts are needed as the nickel electrodes provide sufficient activity, and both CO and certain hydrocarbons are fuels for the MCFC, as they are converted to hydrogen within the stack (on special reformer plates) simplifying the BoP and improving system efficiency to the high forties to low fifties. In addition, the high temperature waste heat allows the use of a bottoming cycle to further boost the system efficiency to the high fifties to low sixties. Disadvantages: The main challenge for MCFC developers stems from the very corrosive and mobile electrolyte, which requires use of nickel and high-grade stainless steel as the cell hardware (cheaper than graphite, but more expensive than ferritic steels). The higher temperatures promote material problems, impacting mechanical stability and stack life.

1-12
Also, a source of CO2 is required at the cathode (usually recycled from anode exhaust) to form the carbonate ion, representing additional BoP components. High contact resistances and cathode resistance limit power densities to around 100 – 200 mW/cm2 at practical operating voltages. 1.5.5 Solid Oxide Fuel Cell (SOFC) The electrolyte in this fuel cell is a solid, nonporous metal oxide, usually Y2O3-stabilized ZrO2. The cell operates at 600-1000 °C where ionic conduction by oxygen ions takes place. Typically, the anode is Co-ZrO2 or Ni-ZrO2 cermet, and the cathode is Sr-doped LaMnO3. Early on, the limited conductivity of solid electrolytes required cell operation at around 1000 °C, but more recently thin-electrolyte cells with improved cathodes have allowed a reduction in operating temperature to 650 – 850 °C. Some developers are attempting to push SOFC operating temperatures even lower. Over the past decade, this has allowed the development of compact and high-performance SOFC which utilized relatively low-cost construction materials. Concerted stack development efforts, especially through the U.S. DOE’s SECA program, have considerably advanced the knowledge and development of thin-electrolyte planar SOFC. As a consequence of the performance improvements, SOFCs are now considered for a wide range of applications, including stationary power generation, mobile power, auxiliary power for vehicles, and specialty applications. Advantages: The SOFC is the fuel cell with the longest continuous development period, starting in the late 1950s, several years before the AFC. Because the electrolyte is solid, the cell can be cast into various shapes, such as tubular, planar, or monolithic. The solid ceramic construction of the unit cell alleviates any corrosion problems in the cell. The solid electrolyte also allows precise engineering of the three-phase boundary and avoids electrolyte movement or flooding in the electrodes. The kinetics of the cell are relatively fast, and CO is a directly useable fuel as it is in the MCFC. There is no requirement for CO2 at the cathode as with the MCFC. The materials used in SOFC are modest in cost. Thin-electrolyte planar SOFC unit cells have been demonstrated to be cable of power densities close to those achieved with PEFC. As with the MCFC, the high operating temperature allows use of most of the waste heat for cogeneration or in bottoming cycles. Efficiencies ranging from around 40 percent (simple cycle small systems) to over 50 percent (hybrid systems) have been demonstrated, and the potential for 60 percent+ efficiency exists as it does for MCFC. Disadvantages: The high temperature of the SOFC has its drawbacks. There are thermal expansion mismatches among materials, and sealing between cells is difficult in the flat plate configurations. The high operating temperature places severe constraints on materials selection and results in difficult fabrication processes. Corrosion of metal stack components (such as the interconnects in some designs) is a challenge. These factors limit stack-level power density (though significantly higher than in PAFC and MCFC), and thermal cycling and stack life (though the latter is better than for MCFC and PEFC). 1.6 Characteristics The interest in terrestrial applications of fuel cells is driven primarily by their potential for high efficiency and very low environmental impact (virtually no acid gas or solid emissions).

1-13
Efficiencies of present fuel cell plants are in the range of 30 to 55 percent based on the lower heating value (LHV) of the fuel. Hybrid fuel cell/reheat gas turbine cycles that offer efficiencies greater than 70 percent LHV, using demonstrated cell performance, have been proposed. Figure 1-4 illustrates demonstrated low emissions of installed PAFC units compared to the Los Angeles Basin (South Coast Air Quality Management District) requirements, the strictest requirements in the U.S. Measured emissions from the PAFC unit are < 1 ppm of NOX, 4 ppm of CO, and <1 ppm of reactive organic gases (non-methane) (5). In addition, fuel cells operate at a constant temperature, and the heat from the electrochemical reaction is available for cogeneration applications. Table summarizes the impact of the major constituents within fuel gases on the various fuel cells. The reader is referred to Sections 3 through 7 for detail on trace contaminants. Another key feature of fuel cells is that their performance and cost are less dependent on scale than other power technologies. Small fuel cell plants operate nearly as efficiently as large ones, with equally low emissions, and comparable cost.1 This opens up applications for fuel cells where conventional power technologies are not practical. In addition, fuel cell systems can be relatively quiet generators. To date, the major impediments to fuel cell commercialization have been insufficient longevity and reliability, unacceptably high cost, and lack of familiarity of markets with fuel cells. For fuel cells that require special fuels (such as hydrogen) the lack of a fuel infrastructure also limits commercialization.
NOx CO
L.A. BasinStand
FuelCellPowerPlant
Reactive Organic Gases
Figure 1-4 Relative Emissions of PAFC Fuel Cell Power Plants Compared to Stringent Los Angeles Basin Requirements
1. The fuel processor efficiency is size dependent; therefore, small fuel cell power plants using externally
reformed hydrocarbon fuels would have a lower overall system efficiency.

1-14
Other characteristics that fuel cells and fuel cell plants offer are:
• Direct energy conversion (no combustion) • No moving parts in the energy converter • Quiet • Demonstrated high availability of lower temperature units • Siting ability • Fuel flexibility • Demonstrated endurance/reliability of lower temperature units • Good performance at off-design load operation • Modular installations to match load and increase reliability • Remote/unattended operation • Size flexibility • Rapid load following capability
General negative features of fuel cells include
• Market entry cost high; Nth cost goals not demonstrated. • Endurance/reliability of higher temperature units not demonstrated. • Unfamiliar technology to the power industry. • No infrastructure.
Table 1-2 Summary of Major Fuel Constituents Impact on PEFC, AFC, PAFC, MCFC, and SOFC
Gas Species PEFC AFC PAFC MCFC SOFC
H2 Fuel Fuel Fuel Fuel Fuel
CO
Poison (reversible) (50 ppm per
stack)
Poison Poison
(<0.5%) Fuela Fuel
CH4 Diluent Poison Diluent Diluentb Fuela
CO2 & H2O Diluent Poison Diluent Diluent Diluent
S as (H2S & COS)
No Studies to date (11)
Poison Poison
(<50 ppm) Poison
(<0.5 ppm) Poison
(<1.0 ppm)
a In reality, CO, with H2O, shifts to H2 and CO2, and CH4, with H2O, reforms to H2 and CO faster than reacting as
a fuel at the electrode. b A fuel in the internal reforming MCFC. 1.7 Advantages/Disadvantages The fuel cell types addressed in this handbook have significantly different operating regimes. As a result, their materials of construction, fabrication techniques, and system requirements differ. These distinctions result in individual advantages and disadvantages that govern the potential of

1-15
the various cells to be used for different applications. Developers use the advantages of fuel cells to identify early applications and address research and development issues to expand applications (see Sections 3 through 7). 1.8 Applications, Demonstrations, and Status The characteristics, advantages, and disadvantages summarized in the previous section form the basis for selection of the candidate fuel cell types to respond to a variety of application needs. The major applications for fuel cells are as stationary electric power plants, including cogen-eration units; as motive power for vehicles, and as on-board electric power for space vehicles or other closed environments. Derivative applications will be summarized. 1.8.1 Stationary Electric Power One characteristic of fuel cell systems is that their efficiency is nearly unaffected by size. This means that small, relatively high efficient power plants can be developed, thus avoiding the higher cost exposure associated with large plant development. As a result, initial stationary plant development has been focused on several hundred kW to low MW capacity plants. Smaller plants (several hundred kW to 1 to 2 MW) can be sited at the user’s facility and are suited for cogeneration operation, that is, the plants produce electricity and thermal energy. Larger, dis-persed plants (1 to 10 MW) are likely to be used for distributed generation. The plants are fueled primarily with natural gas. Once these plants are commercialized and price improvements mate-rialize, fuel cells will be considered for large base-load plants because of their high efficiency. The base-load plants could be fueled by natural gas or coal. The fuel product from a coal gasi-fier, once cleaned, is compatible for use with fuel cells. Systems integration studies show that high temperature fuel cells closely match coal gasifier operation. Operation of complete, self-contained, stationary plants continues to be demonstrated using PEFC, AFC, PAFC, MCFC, and SOFC technology. Demonstrations of these technologies that occurred before 2000 were addressed in previous editions of the Fuel Cell Handbook and in the literature of the period. U.S. manufacturer experience with these various fuel cell technologies has produced timely information. A case in point is the 200 kW PAFC on-site plant, the PC-25, that was the first to enter the commercial market (see Figure 1-5).

1-16
Figure 1-5 PC-25 Fuel Cell
The plant was developed by UTC Fuel Cells, a division of United Technologies Corporation (UTC). The plants are built by UTC Fuel Cells. The Toshiba Corporation of Japan and Ansaldo SpA of Italy are partners with UTC Fuel Cells. The on-site plant is proving to be an economic and beneficial addition to the operating systems of commercial buildings and industrial facilities because it is superior to conventional technologies in reliability, efficiency, environmental impact, and ease of siting. Because the PC-25 is the first available commercial unit, it serves as a model for fuel cell application. Because of its attributes, the PC-25 is being installed in various applications, such as hospitals, hotels, large office buildings, manufacturing sites, wastewater treatment plants, and institutions to meet the following requirements: • On-site energy • Continuous power – backup • Uninterrupted power supply • Premium power quality • Independent power source Characteristics of the plant are as follows: • Power Capacity 0 to 200 kW with natural gas fuel (-30 to 45 °C, up to 1500 m) • Voltage and Phasing 480/277 volts at 60 Hz ; 400/230 volts at 50 Hz

1-17
• Thermal Energy 740,000 kJ/hour at 60°C (700,000 Btu/hour heat at 140 °F); (Cogeneration) module provides 369,000 kJ/hour at 120°C (350,000Btu/hour at 250 °F) and 369,000 kJ/hour at 60 °C
• Electric Connection Grid-connected for on-line service and grid-independent for on-site premium service
• Power Factor Adjustable between 0.85 to 1.0 • Transient Overload None • Grid Voltage Unbalance 1 percent • Grid Frequency Range +/-3 percent • Voltage Harmonic Limits <3 percent • Plant Dimensions 3 m (10 ft) wide by 3 m (10 ft) high by 5.5 m (18 ft) long, not
including a small fan cooling module (5) • Plant Weight 17,230 kg (38,000 lb)
UTC Fuel Cells: Results from the operating units as of August, 2002 are as follows: total fleet operation stands at more than 5.3 million hours. The plants achieve 40 percent LHV electric efficiency, and overall use of the fuel energy approaches 80 percent for cogeneration applications (6). Operations confirm that rejected heat from the initial PAFC plants can be used for heating water, space heating, and low pressure steam. One plant has completed over 50,000 hours of operation, and a number of plants have operated over 40,000 hours (6). Fourteen additional plants have operated over 35,000 hours. The longest continuous run stands at 9,500 hours for a unit purchased by Tokyo Gas for use in a Japanese office building (9). This plant ended its duration record because it had to be shut down because of mandated maintenance. It is estimated at this time that cell stacks can achieve a life of 5 to 7 years. The fleet has attained an average of over 95 percent availability. The latest model, the PC-25C, is expected to achieve over 96 percent. The plants have operated on natural gas, propane, butane, landfill gas (10,11), hydrogen (12), and gas from anaerobic digestors (13). Emissions are so low (see Figure 1-4) that the plant is exempt from air permitting in the South Coast and Bay Area (California) Air Quality Management Districts, which have the most stringent limits in the U.S. The sound pressure level is 62 dBA at 9 meters (30 feet) from the unit. The PC-25 has been subjected to ambient conditions varying from -32 °C to +49 °C and altitudes from sea level to 1600 meters (~1 mile). Impressive ramp rates result from the solid state electronics. The PC-25 can be ramped at 10 kW/sec up or down in the grid connected mode. The ramp rate for the grid independent mode is idle to full power in ~one cycle or essentially one-step instantaneous from idle to 200 kW. Following the initial ramp to full power, the unit can adjust at an 80 kW/sec ramp up or down in one cycle. The fuel cell stacks are made and assembled into units at an 80,000 ft2 facility located in South Windsor, Connecticut, U.S. Low cost/high volume production depends on directly insertable sub-assemblies as complete units and highly automatic processes such as robotic component handling and assembly. The stack assembly is grouped in a modified spoke arrangement to allow for individual manufacturing requirements of each of the cell components while bringing them in a continuous flow to a central stacking elevator (14).

1-18
Ballard Generation Systems: Ballard Generation Systems, a subsidiary of Ballard Power Systems, produces a PEFC stationary on-site plant. It has these characteristics: • Power Capacity 250 kW with natural gas fuel • Electric Efficiency 40% LHV • Thermal Energy 854,600 kJ/hour at 74 °C (810,000 Btu/hour at 165 °F) • Plant Dimensions 2.4 m (8 ft) wide by 2.4 m (8 ft) high by 5.7 m (18.5 ft) long • Plant Weight 12,100 kg (26,700 lb)
Ballard completed 10- and 60-kW engineering prototype stationary fuel cell power generators in 2001. Ballard, Shell Hydrogen, and Westcoast Energy established a private capital joint venture to help build early stage fuel cell systems. Ballard launched the NexaTM, a portable 1.2 kW power module, in September 2001. Ballard is also selling carbon fiber products for gas diffusion layers for proton exchange membrane fuel cells. Highlights of Ballard’s fuel cell sales are shown below. FuelCell Energy (FCE): FCE reached 50 MW manufacturing capacity and plans to expand its manufacturing capacity to 400 MW in 2004. The focus of the utility demonstrations and FCE’s fuel cell development program is the commercialization of 300 kilowatt, 1.5 megawatt, and 3 megawatt MCFC plants. • Power Capacity 3.0 MW net AC • Electric efficiency 57% (LHV) on natural gas • Voltage and Phasing Voltage is site dependent, 3 phase 60 Hz • Thermal energy ~4.2 million kJ/hour (~4 million Btu/hour) • Availability 95% Siemens Westinghouse Power Corporation (SWPC): The Siemens Westinghouse SOFC is planning two major product lines with a series of product designs in each line. The first product will be a 250 kW cogeneration system operating at atmospheric pressure. This will be followed by a pressurized SOFC/gas turbine hybrid of approximately 0.5 MW. After the initial production, larger systems are expected as well. Also, a system capable of separating CO2 from the exhaust is planned as an eventual option to other products. The commercialization plan is focused on an initial offering of a hybrid fuel cell/gas turbine plant. The fuel cell module replaces the combustion chamber of the gas turbine engine. Figure 1-6 shows the benefit behind this combined plant approach. Additional details are provided in Section 7. As a result of the hybrid approach, the 1 MW early commercial unit is expected to attain ~60% efficiency LHV when operating on natural gas.

1-19
100
90
80
70
60
50
40
30
20
10
0
AdvancedGas Turbine
System
HighTemperature
Fuel Cell
Gas Turbine/Fuel Cell
Combined Cycle
EF
FIC
IEN
CY
(%
)
Figure 1-6 Combining the SOFC with a Gas Turbine Engine to Improve Efficiency Siemens Westinghouse is planning a number of tests on power plants that are prototypes of future products. All systems employ the tubular SOFC concept and most are combined with gas turbines in a hybrid configuration. Capacities of these systems are 250 kilowatts atmospheric, 300 kilowatt class hybrid, and 1 megawatt class hybrid. They are to operate at various sites in the U.S., Canada, and Europe. An eventual market for fuel cells is the large (100 to 300 MW), base-loaded, stationary plants operating on coal or natural gas. Another related, early opportunity may be in re-powering older, existing plants with high-temperature fuel cells (19). MCFCs and SOFCs coupled with coal gasifiers have the best attributes to compete for the large, base load market. The rejected heat from the fuel cell system can be used to produce steam for the existing plant's turbines. Studies showing the potential of high-temperature fuel cells for plants of this size have been performed (see Section 8). These plants are expected to attain from 50 to 60% efficiency based on the HHV of the fuel. Coal gasifiers produce a fuel gas product requiring cleaning to the stringent require-ments of the fuel cells’ electrochemical environment, a costly process. The trend of environmen-tal regulations has also been towards more stringent cleanup. If this trend continues, coal-fired technologies will be subject to increased cleanup costs that may worsen process economics. This will improve the competitive position of plants based on the fuel cell approach. Fuel cell sys-tems will emit less than target emissions limits. U.S. developers have begun investigating the viability of coal gas fuel to MCFCs and SOFCs (20,21,22). An FCE 20 kW MCFC stack was tested for a total of 4,000 hours, of which 3,900 hours was conducted at the Plaquemine, LA, site on coal gas as well as pipeline gas. The test included 1,500 hours of operation using 9,142 kJ/m3 syngas from a slip stream of a 2,180 tonne/day Destec entrained gasifier. The fuel processing system incorporated cold gas cleanup for bulk removal of H2S and other contaminants, allowing the 21 kW MCFC stack to demonstrate that the FCE technology can operate on either natural gas or coal gas. A series of standards is being developed to facilitate the application of stationary fuel cell technology power plants. Standard development activities presently underway are • Fuel Cell Power Systems ANSI/CSA America FC1-2004 (published)

1-20
• Stationary Fuel Cell Power Systems -Safety IEC TC 105 Working Group #3 • Stationary Fuel Cell Power Systems
-Installation IEC TC 105 Working Group #5 • Interconnecting Distributed Resources IEEE P1547.1, P1547.2, P1547.3, P1547.4 • Test Method for the Performance of
Stationary Fuel Cell Power Plants IEC TC 105 Working Group #4 1.8.2 Distributed Generation Distributed generation involves small, modular power systems that are sited at or near their point of use. The typical system is less than 30 MW, used for generation or storage, and extremely clean. Examples of technologies used in distributed generation include gas turbines and reciprocating engines, biomass-based generators, solar power and photovoltaic systems, fuel cells, wind turbines, micro-turbines, and flywheel storage devices. See Table 1-3 for size and efficiencies of selected systems.
Table 1-3 Attributes of Selected Distributed Generation Systems
Type Size Efficiency, %
Reciprocating Engines 50 kW – 6 MW 33 – 37 Micro turbines 10 kW – 300 kW 20 – 30 Phosphoric Acid Fuel Cell (PAFC) 50 kW – 1 MW 40 Solid Oxide Fuel Cell (SOFC) 5 kW – 3 MW 45 – 65 Proton Exchange Membrane Fuel Cell (PEM)
<1 kW – 1 MW 34 – 36
Photovoltaics (PV) 1 kW – 1 MW NA Wind Turbines 150 kW – 500 kW NA Hybrid Renewable <1 kW – 1 MW 40 – 50
The market for distributed generation is aimed at customers dependent on reliable energy, such as hospitals, manufacturing plants, grocery stores, restaurants, and banking facilities. There is currently over 15 GW of distributed power generation operating in the U.S. Over the next decade, the domestic market for distributed generation, in terms of installed capacity to meet the demand, is estimated to be 5-6 GW per year. The projected global market capacity increases are estimated to be 20 GW per year (23). Several factors have played a role in the rise in demand for distributed generation. Utility restructuring is one of the factors. Energy suppliers must now take on the financial risk of capacity additions. This leads to less capital-intensive projects and shorter construction periods. Also, energy suppliers are increasing capacity factors on existing plants rather than installing new capacity, which places pressure on reserve margins. This increases the possibility of forced outages, thereby increasing the concern for reliable service. There is also a demand for capacity additions that offer high efficiency and use of renewables as the pressure for enhanced environmental performance increases (23).

1-21
There are many applications for distributed generation systems. They include: • Peak shaving - Power costs fluctuate hour by hour depending upon demand and generation,
therefore customers would select to use distributed generation during relatively high-cost, on-peak periods.
• Combined heat and power (CHP) (Cogeneration) –The thermal energy created while converting fuel to electricity would be utilized for heat in addition to electricity in remote areas, and electricity and heat for sites that have a 24 hour thermal/electric demand.
• Grid support – Strategic placement of distributed generation can provide system benefits and preclude the need for expensive upgrades and provide electricity in regions where small increments of new baseload capacity is needed.
• Standby power – Power during system outages is provided by a distributed generation system until service can be restored. This is used for customers that require reliable back-up power for health or safety reasons, companies with voltage-sensitive equipment, or where outage costs are unacceptably high.
• Remote/Standalone – The user is isolated from the grid either by choice or circumstance. The purpose is for remote applications and mobile units to supply electricity where needed.
Distributed generation systems have small footprints, are modular and mobile making them very flexible in use. The systems provide benefits at the customer level and the supplier level, as well as the national level. Benefits to the customer include high power quality, improved reliability, and flexibility to react to electricity price spikes. Supplier benefits include avoiding investments in transmission and distribution (T&D) capacity upgrades by locating power where it is most needed and opening new markets in remote areas. At the national level, the market for distrib-uted generation establishes a new industry, boosting the economy. The improved efficiencies also reduce greenhouse gas emissions. However, a number of barriers and obstacles must be overcome before distributed generation can become a mainstream service. These barriers include technical, economic, institutional, and regulatory issues. Many of the proposed technologies have not yet entered the market, and will need to meet performance and pricing targets before entry. Questions have also risen on requirements for connection to the grid. Lack of standardized procedures creates delays and discourages customer-owned projects. Siting, permitting, and environmental regulations can also delay and increase the costs of distributed generation projects. In 1998, the Department of Energy created a Distributed Power Program to focus on market barriers and other issues that have prohibited the growth of distributed generation systems. Under the leadership of the National Renewable Energy Laboratory (NREL), a collaboration of national laboratories and industry partners have been creating new standards and are identifying and removing regulatory barriers. The goals of the program include 1) strategic research, 2) system integration, and 3) mitigation of regulatory and institutional barriers (24). Fuel cells, one of the emerging technologies in distributed generation, have been hindered by high initial costs. However, costs are expected to decline as manufacturing capacity and capability increase and designs and integration improve. The fuel cell systems offer many potential benefits as a distributed generation system. They are small and modular, and capital

1-22
costs are relatively insensitive to scale. This makes them ideal candidates for diverse applications where they can be matched to meet specific load requirements. The systems are unobtrusive, with very low noise levels and negligible air emissions. These qualities enable them to be placed close to the source of power demand. Fuel cells also offer higher efficiencies than conventional plants. The efficiencies can be enhanced by using the quality waste heat derived from the fuel cell reactions for combined heat and power and combined-cycle applications. Phosphoric acid fuel cells have successfully been commercialized. Second generation fuel cells include solid oxide fuel cells and molten carbonate fuel cells. Research is ongoing in areas such as fuel options and new ceramic materials. Different manufacturing techniques are also being sought to help reduce capital costs. Proton exchange membrane fuel cells are still in the development and testing phase. 1.8.3 Vehicle Motive Power Since the late 1980s, there has been a strong push to develop fuel cells for use in light-duty and heavy-duty vehicle propulsion. A major drive for this development is the need for clean, effi-cient cars, trucks, and buses that operate on conventional fuels (gasoline, diesel), as well as renewable and alternative fuels (hydrogen, methanol, ethanol, natural gas, and other hydro-carbons). With hydrogen as the on-board fuel, these would be zero-emission vehicles. With on-board fuels other than hydrogen, the fuel cell systems would use an appropriate fuel processor to convert the fuel to hydrogen, yielding vehicle power trains with very low acid gas emissions and high efficiencies. Further, such vehicles offer the advantages of electric drive and low maintenance because of few moving parts. This development is being sponsored by various governments in North America, Europe, and Japan, as well as by major automobile manufacturers worldwide. As of May 1998, several fuel cell-powered cars, vans, and buses operating on hydrogen and methanol have been demonstrated. In the early 1970s, K. Kordesch modified a 1961 Austin A-40 two-door, four-passenger sedan to an air-hydrogen fuel cell/battery hybrid car (23). This vehicle used a 6-kW alkaline fuel cell in conjunction with lead acid batteries, and operated on hydrogen carried in compressed gas cylinders mounted on the roof. The car was operated on public roads for three years and about 21,000 km. In 1994 and 1995, H-Power (Belleville, New Jersey) headed a team that built three PAFC/battery hybrid transit buses (24,25). These 9 meter (30 foot), 25 seat (with space for two wheel chairs) buses used a 50 kW fuel cell and a 100 kW, 180 amp-hour nickel cadmium battery. The major activity in transportation fuel cell development has focused on the polymer electrolyte fuel cell (PEFC). In 1993, Ballard Power Systems (Burnaby, British Columbia, Canada) demonstrated a 10 m (32 foot) light-duty transit bus with a 120 kW fuel cell system, followed by a 200 kW, 12 meter (40 foot) heavy-duty transit bus in 1995 (26). These buses use no traction batteries. They operate on compressed hydrogen as the on-board fuel. In 1997, Ballard provided 205 kW (275 HP) PEFC units for a small fleet of hydrogen-fueled, full-size transit buses for demonstrations in Chicago, Illinois, and Vancouver, British Columbia. Working in collaboration with Ballard, Daimler-Benz built a series of PEFC-powered vehicles, ranging from passenger

1-23
cars to buses (27). The first such vehicles were hydrogen-fueled. A methanol-fueled PEFC A-class car unveiled by Daimler-Benz in 1997 had a 640 km (400 mile) range. Plans were to offer a commercial vehicle by 2004. A hydrogen-fueled (metal hydride for hydrogen storage), fuel cell/battery hybrid passenger car was built by Toyota in 1996, followed in 1997 by a methanol-fueled car built on the same (RAV4) platform (28). In February 2002, UTC Fuel Cells and Nissan signed an agreement to develop fuel cells and fuel cell components for vehicles. Renault, Nissan’s alliance partner, is also participating in the development projects. UTC Fuel Cells will provide proprietary ambient-pressure proton exchange membrane fuel cell technology. Ballard’s fuel cell engine powered DaimlerChrysler’s NECAR 5 fuel cell vehicle in a 13-day, 3,000-mile endurance test across the United States. The drive provided Ballard and DaimlerChrysler with testing experience in a variety of conditions. Toyota Motor Corp. and Honda Motor Co. announced they would advance their initial vehicle introduction plans for fuel cell vehicles to late in 2002 from 2003. Honda achieved a significant milestone for its product launch by receiving both CARB and EPA certification of its zero emission FCX-V4 automobile. This was the first vehicle to receive such certification. Ballard’s fuel cell powered this Honda vehicle. Other major automobile manufacturers, including General Motors, Volkswagen, Volvo, Chrysler, Nissan, and Ford, have also announced plans to build prototype polymer electrolyte fuel cell vehicles operating on hydrogen, methanol, or gasoline (29). IFC and Plug Power in the U.S., and Ballard Power Systems of Canada (15), are involved in separate programs to build 50 to 100 kW fuel cell systems for vehicle motive power. Other fuel cell manufacturers are involved in similar vehicle programs. Some are developing fuel cell-powered utility vehicles, golf carts, etc. (30,31). 1.8.4 Space and Other Closed Environment Power The application of fuel cells in the space program (1 kW PEFC in the Gemini program and 1.5 kW AFC in the Apollo program) was demonstrated in the 1960s. More recently, three 12 kW AFC units were used for at least 87 missions with 65,000 hours flight time in the Space Shuttle Orbiter. In these space applications, the fuel cells used pure reactant gases. IFC produced a H2/O2 30 kW unit for the Navy’s Lockheed Deep Quest vehicle. It operates at depths of 1500 meters (5000 feet). Ballard Power Systems has produced an 80 kW PEFC fuel cell unit for submarine use (methanol fueled) and for portable power systems. 1.8.5 Auxiliary Power Systems In addition to high-profile fuel cell applications such as automotive propulsion and distributed power generation, the use of fuel cells as auxiliary power units (APUs) for vehicles has received considerable attention (see Figure 1-7). APU applications may be an attractive market because they offer a true mass-market opportunity that does not require the challenging performance and low cost required for propulsion systems for vehicles. In this section, a discussion of the technical performance requirements for such fuel cell APUs, as well as the status of technology and implications for fuel cell system configuration and cost is given.

1-24
Participants Application Size range Fuel /Fuel Cell type
Nature of Activity
BMW, International Fuel Cells (a)
passenger car, BMW 7-series
5kW net Hydrogen, Atmospheric PEM
Demonstration
Ballard, Daimler-Chrysler (b)
Class 8 Freightliner heavy-duty Century Class S/T truck cab
1.4 kW net for 8000 BTU/h A/C unit
Hydrogen, PEM
Demonstration
BMW, Delphi, Global Thermoelectric (c)
passenger car 1-5kW net Gasoline, SOFC
Technology development program
(a) “Fuel Cell Auxiliary Power Unit – Innovation for the Electric Supply of Passenger Cars?” J. Tachtler et al. BMW Group, SAE 2000-01-0374, Society of Automotive Engineers, 2000. (b) “Freightliner unveils prototype fuel cell to power cab amenities”, O. B. Patten, Roadstaronline.com news, July 20, 2000. (c) Company press releases, 1999.
Figure 1-7 Overview of Fuel Cell Activities Aimed at APU Applications Auxiliary power units are devices that provide all or part of the non-propulsion power for vehicles. Such units are already in widespread use in a range of vehicle types and for a variety of applications, in which they provide a number of potential benefits (see Figure 1-8). Although each of these applications could provide attractive future markets for fuel cells, this section will focus on application to on-road vehicles (specifically trucks). Vehicles Types Loads Serviced Potential Benefits
• Heavy-duty & utility trucks
• Airplanes
• Trains
• Yachts & Ships
• Recreational vehicles
• Automobiles & light trucks (not commercial yet)
• Space conditioning
• Refrigeration
• Lighting and other cabin amenities
• Communication and information equipment
• Entertainment (TV, radio)
• Can operate when main engine unavailable
• Reduce emissions and noise while parked
• Extend life of main engine
• Improve power generation efficiency when parked
Figure 1-8 Overview of APU Applications
In 1997, the Office of Naval Research initiated an advanced development program to demonstrate a ship service fuel cell power generation module. The ship service generator supplies the electrical power requirements of the ship. This program would provide the basis for a new fuel cell-based design as an attractive option for future Navy surface ships. This program would provide the Navy with a ship service that is more efficient, and incorporates a distributed power system that would remain operating even if the ship’s engine is destroyed. Fuel cells can serve as a generator, battery charger, battery replacements and heat supply. They can adapt to most environments, even locations in Arctic and Antarctic regions. One effort, in collaboration with the Army Research Office, has demonstrated a prototype fuel cell designed to replace a popular military standard battery. The target application is the Army's BA-5590 primary (i.e., use-once-and-dispose) lithium battery. The Army purchases approximately 350,000 of these batteries every year at a cost of approximately $100 per battery, including almost $30

1-25
per battery for disposal. Fuel cells, on the other hand, are not thrown away after each use but can be re-used hundreds of times. Mission weight savings of factors of 10 or more are projected. The prototype fuel cell, which has the same size and delivers the same power as a battery, has been tested in all orientations and under simulated adverse weather conditions, and was enthusiastically received by Army senior management. System Performance Requirements A key reason for interest in fuel cell APU applications is that there may be a good fit between APU requirements and fuel cell system characteristics. Fuel cells are efficient and quiet, and APUs do not have the load following requirements and physical size and weight constraints associated with propulsion applications. However, in order to understand the system requirements for fuel cell APUs, it is critical to understand the required functionality (refer to Figure 1-8) as well as competing technologies. To provide the functionality of interest, and to be competitive with internal combustion engine (ICE) driven APUs, fuel cell APUs must meet various requirements; an overview is provided in Figure 1-9. Key Parameter Typical Requirements Expected fuel cell
performance Power output 12 – 42 V DC is acceptable for
most applications, 110 / 220 V AC may be desirable for powering power tools etc.
DC power output simplifies the power conditioning and control for fuel cells
System Capacity 1 – 5 kW for light duty vehicles and truck cabins
up to 15 kW for truck refrigeration
Fits expected range for PEFCs and probably also advanced SOFCs
System Efficiency More than 15-25% based on LHV
Efficiency target should be achievable, even in smallest capacity range
Operating life and reliability Greater than about 5,000 hours stack life, with regular service intervals less than once every 1,000 hours
Insufficient data available to assess whether this is a challenge or not
Figure 1-9 Overview of typical system requirements
Fuel cell APUs will likely have to operate on gasoline, and for trucks preferably on diesel fuel, in order to match the infrastructure available, and preferably to be able to share on-board storage tanks with the main engine. The small amount of fuel involved in fueling APUs would likely not justify the establishment of a specialized infrastructure (e.g. a hydrogen infrastructure) for APUs alone. Similarly, fuel cell APUs should be water self-sufficient, as the need to carry water for the APU would be a major inconvenience to the operator, and would require additional space and associated equipment. In addition to the requirement for stationary operation, fuel cell APUs must be able to provide power rapidly after start-up, and must be able to follow loads. While the use of batteries to

1-26
accomplish this is almost a given, a system start-up time of about ten minutes or less will likely be required to arrive at a reasonable overall package. Finally, fuel cell APUs are quiet and clean. These attributes may well be the key competitive advantages that fuel cell APUs have over conventional APUs, and hence their performance may more than match that of internal combustion engines’ APUs. Technology Status Active technology development efforts in both PEFC and planar SOFC technology, driven primarily by interest in distributed generation and automotive propulsion markets, have achieved significant progress. For distributed power applications, refined and even early commercial prototypes are being constructed. However, in the case of planar SOFC a distinction must be made between different types of SOFC technologies. Neither the tubular nor the electrolyte-supported SOFC technology is suitable for APU applications due to their very high operating temperature, large size and heavy weight. Only the electrode-supported planar SOFC technology may be applicable to APU applications. Since it has only been developed over the past decade, as opposed to several decades for PEFC and other SOFC technologies, it is not developed as far, although it appears to be catching up quickly (See Figure 1-10).
Research &Development Production Market
Entry
Demonstration
Initial SystemPrototypes
Refined Prototypes
Commercial Prototypes
Planar SOFC(Residential)
PEM(Residential)
Planar SOFC(APU)
PEM(APU)
Figure 1-10 Stage of development for fuel cells for APU applications Fuel cell APU applications could benefit significantly from the development of distributed generation systems, especially from residential-scale systems, because of the similarity in size and duty cycle. However, distributed generation systems are designed mostly for operation on natural gas, and do not face as stringent weight and volume requirements as APU applications. As a result, fuel cell APUs are in the early system prototype stage. Several developers, including Nuvera, Honeywell, and Plug Power are actively developing residential PEFC power systems. Most of the PEFC system technology can be adapted for APU application, except that a fuel processor capable of handling transportation fuels is required. However, most of the players in the residential PEFC field are also engaged in developing PEFC
1-27
systems for automotive propulsion applications, and are targeting the ability to use transportation fuels for PEFC systems. Relatively few developers of SOFC technology have paid attention to non-stationary markets. All are focused on small-to medium-sized distributed generation and on-site generation markets. Only Global Thermoelectric (Calgary, Canada) has been active in the application of its technology to APUs. A detailed conceptual design and cost estimate of a 5-kW SOFC-based truck APU concluded that, provided continued improvement in several technology areas, planar SOFCs could ultimately become a realistic option for this mass-market application. System Configuration and Technology Issues Based on system requirements discussed above, fuel cell APUs will consist of a fuel processor, a stack system and the balance of plant. Figure 1-11 lists the components required in SOFC and PEFC systems. The components needed in a PEFC system for APU applications are similar to those needed in residential power. The main issue for components of PEFC systems is to minimize or eliminate the use of external supplied water. For both PEFC and SOFC systems, start-up batteries (either existing or dedicated units) will be needed, since external electric power is not available. Detailed cost and design studies for both PEFC and SOFC systems at sizes ranging from 5kW to 1 MW point to the fundamental differences between PEFC and SOFC technology that impact the system design and, by implication, the cost structure. These differences will be discussed in the following paragraphs. The main components in a SOFC APU are the fuel cell stack, the fuel processor, and the thermal management system. In addition, there are several balance of plant components, which are listed in Figure 11. The relatively simple reformer design is possible because the SOFC stack operates at high temperatures (around 800°C) and is capable of both carbon monoxide and certain hydrocarbons as fuel. Since both the anode and cathode exhaust at temperatures of 600-850°C, high temperature recuperators are required to maintain system efficiency. A recuperator consists of expensive materials (high temperature reducing and oxidizing atmosphere), making it an expensive component in the system. However, if hydrocarbons are converted inside the stack, this leads to a less exothermic overall reaction so that the stack cooling requirements are reduced. Further system simplification would occur if a sulfur-free fuel was used or if the fuel cell were sulfur tolerant; in that case, the fuel could be provided directly from the reformer to the fuel cell. In order to minimize system volume, (and minimize the associated system weight and start-up time) integration of the system components is a key design issue. By recycling the entire anode tailgas to provide steam, a water management system can be avoided, though a hot gas recirculation system is required.

1-28
SOFC-Based SystemSOFC-Based System
FuelPreparation
Fuel pre-processing
ReformateConditioning
Sulfurremoval
Fuel CellStack
AirPreparation
Balance of Plant:• Compressor/Expander• Pumps• Controls• Insulation & Packaging• Safety system• Start-up battery
PEM-Based SystemPEM-Based System
FuelPreparation
SulfurRemoval
Water-GasShift CO clean-up Fuel Cell
Stack
SteamGeneration
AirPreparation
Balance of Plant:• Compressor/Expander• Pumps• Controls• Water management• Packaging• Safety system• Start-up battery
Reforming
Figure 1-11. Overview of subsystems and components for SOFC and PEFC systems Figure 1-12 shows a simplified layout for an SOFC-based APU. The air for reformer operation and cathode requirements is compressed and then split between the unit operations. The external water supply shown in Figure 1-12 will most likely not be needed; the anode recycle stream provides water. Unreacted anode tail gas is recuperated in a tail gas burner. Additional energy is available in a SOFC system from enthalpy recovery from tail gas effluent streams that are typically 400-600 °C. Current thinking is that reformers for transportation fuel based SOFC APUs will be of the exothermic type (i.e. partial oxidation or autothermal reforming), as no viable steam reformers are available for such fuels.

1-29
Fuel Cell
Reformer
Mixer
Gasoline or Diesel
Preheat
Air
water
Anode
Cathode
Burner
AnodeRecycle
Sulfurremoval
Q
Flow Splitter
Figure 1-12. Simplified process flow diagram of pre-reformer/SOFC system Due to the operating requirements of PEFC stack technology, shift reactors and a carbon monoxide removal step are required to produce reformate of sufficient quality. Similarly, the stack operating temperature and its humidity requirements require a water management system as well as radiators for heat rejection. Some developers use pressurized systems to benefit from higher reactant partial pressures on both anode and cathode. Fuel processing for PEFC APU systems is identical to that needed in residential power or propulsion applications. The additional issue for PEFC is the minimization of steam needed for the fuel processor system. Since an APU is a mobile and/or remote unit, the need for external sources of water should be minimized. The reformate stream is further diluted by additional steam, if that water is not removed prior to the fuel cell stack. Another design integration issue in PEFC systems is water management to hydrate the electrolyte and provide the necessary steam for reforming and water-gas shift operations. Additional steam may be required for the CO clean-up device. Some reformate-based PEFC systems are run under pressure to increase the partial pressure of reactants for the PEFC anode and cathode, increasing efficiency. Pressure operation also aids in heat integration for the internal generation of steam at pressures greater than atmospheric (i.e. steam generated at temperatures greater than 100°C). PEFC system integration involves combining a reformer (either exothermic or endothermic at ~850-1000 °C), shift reactors (exothermic, 150-500 °C), CO-cleanup (primarily exothermic, 50-200 °C), and the fuel cell stack (exothermic, 80 °C). Each reaction zone operates at a significantly different temperature, thus providing a challenge for system integration and heat rejection. To alleviate some of these drawbacks and further reduce the cost of the PEFC systems, developers are investigating the possibility of using higher temperature membranes (e.g. operating slightly above 100 °C). This would increase the carbon monoxide tolerance, potentially simplifying the fuel processor design, and simplify the heat rejection.

1-30
The load requirements for auxiliary power applications require smaller fuel cell stacks. The heat losses for a SOFC stack operating at a smaller power duty are a larger proportion of the gross rating than in a stationary power application. Insulation required for specified skin temperature requirements could conceivably result in a large fraction of the total system volume. Integration of the high temperature components is important in order to reduce the system volume and insulation requirements. SOFC APU systems will require inexpensive, high performance insulation materials to decrease both system volume and cost. Cost Considerations As for any new class of product, total cost of ownership and operation of fuel cells will be a critical factor in their commercialization, along with the offered functionality and performance. This total cost of ownership typically has several components for power systems such as fuel cells. These components include fuel cost, other operating costs such as maintenance cost, and the first cost of the equipment. This first cost has a significant impact on fuel cells’ competitiveness. The main component of a fuel cell’s first cost is the manufacturing cost, which is strongly related to the physical configuration and embodiment of the system, as well as to the manufacturing methods used. System configuration and design, in turn, are directly related to the desired system functionality and performance, while the manufacturing methods are strongly linked to the anticipated production volume. Arthur D. Little carried out cost structure studies for a variety of fuel cell technologies for a wide range of applications, including SOFC tubular, planar, and PEFC technologies. Because phenomena at many levels of abstraction have a significant impact on performance and cost, they developed a multi-level system performance and cost modeling approach (see Figure 1-13). At the most elementary level, it includes fundamental chemical reaction/reactor models for the fuel processor and fuel cell as one-dimensional systems.
Reformer model
M
O
M
O
C3H7 H
C3H8
ManufacturingCost Model
Fuel Cell Model
0.4
0.5
0.6
0.7
0.8
0.9
1
cell
po
ten
tial (
V)
0 0.2 0.4 0.6 0.8 1 1.2 1.4 current density (A/cm²)
NG2000 H2 NG3000 H2 NG2000 ref NG3000 ref
Thermodynamic System Model
ConceptualDesign and
Configuration
46"60"
53"
12
4
5
6 7
8
9
10
11
12
13
15
14
Illustra
tive
Tape Cast
AnodePowder Prep
VacuumPlasmaSpray
ElectrolyteSmall Powder
Prep
ScreenPrint
CathodeSmall Powder
Prep
Sinter in Air1400C
Sinter in Air
Formingof
Interconnect
ShearInterconnect
VacuumPlasmaSpray
SlurrySpray
ScreenPrint
Slurry Spray
Slip Cast
Finish Edges
Note: Alternative production processes appear in gray to thebottom of actual production processes assumed
BrazePaint Braze
ontoInterconnect
Blanking /Slicing
QC LeakCheck
Interconnect
Fabrication
Electrolyte CathodeAnode
Stack Assembly
$/kW Figure 1-13 Multilevel system modeling approach
Each detailed sub-model feeds into the thermodynamic system model, and provides sizing information directly to the conceptual design. The thermodynamic system model provides a

1-31
technical hub for the multi-level approach. It provides inputs on the required flow rates and heat duties in the system. Sizing information, together with information from the thermodynamic model, then flows to the conceptual design. SOFC Cost Structure The main difference in SOFC stack cost compared to PEFC cost relates to the simpler system configuration of the SOFC system. This is mainly due to the fact that SOFC stacks do not contain the high-cost precious metals that PEFCs contain. This is off-set in part by the relatively complex manufacturing process required for the SOFC electrode/electrolyte plates and by the somewhat lower power density in SOFC systems. Low-temperature operation (enabled with electrode-supported planar configuration) enables the use of low-cost metallic interconnects that can be manufactured with conventional metal forming operations. The balance of plant contains all the direct stack support systems, reformer, compressors, pumps, and recuperating heat exchangers. Its cost is low by comparison to the PEFC because of the simplicity of the reformer. However, the cost of the recuperating heat exchangers partially offsets that. To provide some perspective on the viability of SOFCs in APU applications from a cost perspective, NETL sponsored a cost estimate of a small-scale (5 kW), simple-cycle SOFC anode-supported system, operated on gasoline. The estimated manufacturing cost (see Figure 1-14) could well be close to that estimated for comparable PEFC systems, while providing somewhat higher system efficiency. While the stack, insulation, and stack balance in this simple-cycle system is a key component; the balance of plant is also an important factor. The stack cost mainly depends on the achievable power density. Small systems like these will likely not be operated under high pressure. While this simplifies the design and reduces cost for compressors and expanders (which are not readily available at low cost for this size range in any case), it might also negatively affect the power density achievable. A key challenge with small-scale SOFC systems is to overcome heat loss. The higher the heat loss the more recuperation is required to maintain the fuel cell within an acceptable temperature range, and hence to ensure good performance. The large fraction of cost related to balance of plant issues is mainly due to the very small scale of this system, which results in a significant reverse economy of scale. While design work is still ongoing, it is anticipated that the cost structure of this system will reduce the cost of balance of plant further, and further improve the competitiveness of these systems.

1-32
Controls/
Piping/
Batte ry
Indirect,
Labor,
De pr.
Ba lance of
Plant
Stack,
insula tion
and stack
ba la nce
SOFC System Cost Structure:
Manufacturing Costs: $350-550/kW
Figure 1-14. Projected cost structure of a 5kWnet APU SOFC system. Gasoline fueled POX reformer, Fuel cell operating at 300mW/cm2, 0.7 V, 90 % fuel utilization, 500,000
units per year production volume. Outlook and Conclusions In conclusion, both PEFC and SOFC have the potential to meet allowable cost targets, provided successful demonstrations prove the technology. It is critical however, that for these technologies to be commercially successful, especially in small-capacity markets, high production volumes will have to be reached. APU applications might provide such markets. It is similarly critical that the technologies be demonstrated to perform and achieve the projected performance targets and demonstrate long life. These are the challenges ahead for the fuel cell industry in the APU market segment. 1.8.6 Derivative Applications Because of the modular nature of fuel cells, they are attractive for use in small portable units, ranging in size from 5 W or smaller to 100 W power levels. Examples of uses include the Ballard fuel cell, demonstrating 20 hour operation of a portable power unit (32), and an IFC military backpack. There has also been technology transfer from fuel cell system components. The best example is a joint IFC and Praxair, Inc., venture to develop a unit that converts natural gas to 99.999% pure hydrogen based on using fuel cell reformer technology and pressure swing adsorption process. 1.9 References 1. A.J. Appleby, F.R. Foulkes, Fuel Cell Handbook, Van Nostrand Reinhold, New York, NY,
1989.
1-33
2. Report of the DOE Advanced Fuel-Cell Commercialization Working Group, Edited by S.S. Penner, DOE/ER/0643, prepared by the DOE Advanced Fuel Cell Working Group (AFC2WG) or the United States Department of Energy under Contract No. DEFG03-93ER30213, March 1995.
3. K. Kordesch, J. Gsellmann, S. Jahangir, M. Schautz, in Proceedings of the Symposium on Porous Electrodes: Theory and Practice, Edited by H.C. Maru, T. Katan, M.G. Klein, The Electrochemical Society, Inc., Pennington, NJ, p. 163, 1984.
4. A. Pigeaud, H.C. Maru, L. Paetsch, J. Doyon, R. Bernard, in Proceedings of the Symposium on Porous Electrodes: Theory and Practice, Edited by H.C. Maru, T. Katan, M.G. Klein, The Electrochemical Society, Inc., Pennington, NJ, p. 234, 1984.
5. J.M. King, N. Ishikawa, "Phosphoric Acid Fuel Cell Power Plant Improvements and Commercial Fleet Experience," Nov. 96 Fuel Cell Seminar.
6. www.utcfuelcells.com. 7. Communications with IFC, August 24, 2000. 8. K. Yokota, et al., "GOI 11 MW FC Plant Operation Interim Report," in Fuel Cell Program
and Abstracts, 1992 Fuel Cell Seminar, Tucson, AZ, November 29-December 2, 1992. 9. ONSI Press Release, "Fuel Cell Sets World Record; Runs 9,500 Hours Nonstop," May 20,
1997. 10. Northeast Utilities System Press Release, "Converting Landfill Gas into Electricity is an
Environmental Plus," June 24, 1996. 11. "Groton’s Tidy Machine," Public Power, March-April 1997. 12. ONSI Press Release, "World’s First Hydrogen Fueled Fuel Cell Begins Operation in
Hamburg, Germany," November 7, 1997. 13. "Anaerobic Gas Fuel Cell Shows Promise," Modern Power Systems, June 1997. 14. E.W. Hall, W.C. Riley, G.J. Sandelli, "PC25™ Product and Manufacturing Experience,"
IFC, Fuel Cell Seminar, November 1996. 15. www.ballard.com, 1998. 16. www.fuelcellenergy.com. 17. Information supplied by ERC for the Fuel Cell Handbook. 18. M.M. Piwetz, J.S. Larsen, T.S. Christensen, "Hydrodesulfurization and Pre-reforming of
Logistic Fuels for Use in Fuel Cell Applications," Fuel Cell Seminar Program and Abstracts, Courtesy Associates, Inc., November 1996.
19. Westinghouse Electric Corporation, Bechtel Group, Inc., "Solid Oxide Fuel Cell Repowering of Highgrove Station Unit 1, Final Report," prepared for Southern California Edison Research Center, March 1992.
20. ERC, "Effects of Coal-Derived Trace Species on the Performance of Molten Carbonate Fuel Cells," topical report prepared for U.S. DOE/METC, DOE/MC/25009-T26, October 1991.
21. N. Maskalick, "Contaminant Effects in Solid Oxide Fuel Cells," in Agenda and Abstracts, Joint Contractors Meeting, Fuel Cells and Coal-Fired Heat Engines Conference, U.S. DOE/METC, August 3-5, 1993.
22. D.M. Rastler, C. Keeler, C.V. Chang, "Demonstration of a Carbonate on Coal Derived Gas," Report 15, in An EPRI/GRI Fuel Cell Workshop on Technology Research and Development. Stonehart Associates, Madison, CT, 1993.
23. Distributed Generation, Securing America’s Future with Reliable, Flexible Power,” U.S. Department of Energy, Office of Fossil Energy, National Energy Technology Center, October 1999.

1-34
24. U. S. Department of Energy’s Office of Energy Efficiency and Renewable Energy webpage, http://www.eren.doe.gov/distributedpower Giovando, CarolAnn, “Distributed resources carve out a niche in competitive markets,” Power, July/August 2000, pp. 46 – 57.
25. K.V. Kordesch, "City Car with H2-Air Fuel Cell and Lead Battery," 6th Intersociety Energy Conversion Engineering Conference, SAE Paper No. 719015, 1971.
26. A. Kaufman, "Phosphoric Acid Fuel Cell Bus Development," Proceedings of the Annual Automotive Technology Development Contractors' Coordination Meeting, Dearborn, MI, October 24-27, 1994, SAE Proceedings Volume P-289, pp. 289-293, 1995.
27. R.R. Wimmer, "Fuel Cell Transit Bus Testing & Development at Georgetown University," Proceedings of the Thirty Second Intersociety Energy Conversion Engineering Conference, July 27-August 1, 1997, Honolulu, HI, pp. 825-830, 1997.
28. N.C. Otto, P.F. Howard, "Transportation Engine Commercialization at Ballard Power Systems," Program and Abstracts 1996 Fuel Cell Seminar, November 17-20, 1996, Orlando, FL, pp. 559-562.
29. F. Panik, "Fuel Cells for Vehicle Application in Cars - Bringing the Future Closer," J. Power Sources, 71, 36-38, 1998.
30. S. Kawatsu, "Advanced PEFC Development for Fuel Cell Powered Vehicles," J. Power Sources, 71, 150-155, 1998.
31. Fuel-Cell Technology: Powering the Future, Electric Line, November/December 1996. 32. M. Graham, F. Barbir, F. Marken, M. Nadal, "Fuel Cell Power System for Utility Vehicle,"
Program and Abstracts 1996 Fuel Cell Seminar, November 17-20, 1996, Orlando, FL, pp. 571-574.
33. P.A. Lehman, C.E. Chamberlin, "Design and Performance of a Prototype Fuel Cell Powered Vehicle," Program and Abstracts 1996 Fuel Cell Seminar, November 17-20, 1996, Orlando, FL, pp. 567-570.
34. J. Leslie, "Dawn of the Hydrogen Age," Wired (magazine), October 1997.

2-1
2. FUEL CELL PERFORMANCE
The purpose of this section is to describe the chemical and thermodynamic relations governing fuel cells and how operating conditions affect their performance. Understanding the impacts of variables such as temperature, pressure, and gas constituents on performance allows fuel cell developers to optimize their design of the modular units and it allows process engineers to maximize the performance of systems applications. A logical first step in understanding the operation of a fuel cell is to define its ideal performance. Once the ideal performance is determined, losses arising from non-ideal behavior can be calculated and then deducted from the ideal performance to describe the actual operation. 2.1 The Role of Gibbs Free Energy and Nernst Potential The maximum electrical work (Wel) obtainable in a fuel cell operating at constant temperature and pressure is given by the change in Gibbs free energy (∆G) of the electrochemical reaction:
el = G = n EW ∆ − F (2-1)
where n is the number of electrons participating in the reaction, F is Faraday's constant (96,487 coulombs/g-mole electron), and E is the ideal potential of the cell. The Gibbs free energy change is also given by the following state function:
G H T S∆ = ∆ − ∆ (2-2)
where ∆H is the enthalpy change and ∆S is the entropy change. The total thermal energy available is ∆H. The available free energy is equal to the enthalpy change less the quantity T S∆ which represents the unavailable energy resulting from the entropy change within the system. The amount of heat that is produced by a fuel cell operating reversibly is T∆S. Reactions in fuel cells that have negative entropy change generate heat (such as hydrogen oxidation), while those with positive entropy change (such as direct solid carbon oxidation) may extract heat from their

2-2
surroundings if the irreversible generation of heat is smaller than the reversible absorption of heat. For the general cell reaction,
A B C Dcα β δ+ → + (2-3)
the standard state Gibbs free energy change of reaction is given by:
C D A BG = G G G Gc δ° ° ° °∆ ° + − α − β (2-4)
where iG° is the partial molar Gibbs free energy for species i at temperature T. This potential can be computed from the heat capacities (Cp) of the species involved as a function of T and from values of both ∆S° and ∆H° at a reference temperature, usually 298K. Empirically, the heat capacity of a species, as a function of T, can be expressed as
2pC = a + bT + cT (2-5)
where a, b, and c are empirical constants. The specific enthalpy for any species present during the reaction is given by
i iH H= o + T
pi
298
C dT∫ (2-6)
and, at constant pressure the specific entropy at temperature T is given by
i iS S= +oT
pi
298
CdT
T∫ (2-7)
It then follows that
∑∑ −=∆i
iioutii
i HnHnH in (2-8)

2-3
and
∑∑ −=∆i
iioutii
i SnSnS in (2-9)
The coefficients a, b, and c, as well as H° and S°, are available from standard reference tables, and may be used to calculate ∆H and ∆S. From these values it is then possible to calculate ∆G and E at temperature T. Instead of using the coefficients a, b, and c, it is modern practice to rely on tables, such as JANAF Thermochemical Tables (1) to provide Cp, ∆H, ∆S, and ∆G over a range of temperatures for all species present in the reaction. The Gibbs free energy change of reaction can be expressed by the equation:
C D
A B
f fG = G + RT ln
f f
c δ
α β∆ ∆ ° (2-10)
where G∆ ° is the Gibbs free energy change of reaction at the standard state pressure (1 atm) and at temperature T, and fi is the fugacity of species i. Substituting Equation (2-1) in Equation (2-10) gives the relation
C D
A B
f fRTE = E + ln
n f f
c δ
α β°F
(2-11)
or more generally,
RT [reactant fugacity]E = E + ln
n [product fugacity]
Π°ΠF
(2-12)
which is the general form of the Nernst equation. The reversible potential of a fuel cell at temperature T, E ° , is calculated from G∆ ° for the cell reaction at that temperature. Fuel cells generally operate at pressures low enough that the fugacity can be approximated by the partial pressure.

2-4
2.2 Ideal Performance The Nernst potential, E, gives the ideal open circuit cell potential. This potential sets the upper limit or maximum performance achievable by a fuel cell. The overall reactions for various types of fuel cells are presented in Table 2-1. The corresponding Nernst equations for those reactions are provided in Table 2-2.
Table 2-1 Electrochemical Reactions in Fuel Cells
Fuel Cell Anode Reaction Cathode Reaction
Polymer Electrolyte and Phosphoric Acid
H2 → 2H+ + 2e- ½ O2 + 2H+ + 2e- → H2O
Alkaline H2 + 2(OH)- → 2H2O + 2e- ½ O2 + H2O + 2e- → 2(OH)-
Molten Carbonate H2 + CO3
= → H2O + CO2 + 2e- CO + CO3
= → 2CO2 + 2e- ½ O2 + CO2 + 2e- → CO3
=
Solid Oxide H2 + O= → H2O + 2e- CO + O= → CO2 + 2e- CH4 + 4O= → 2H2O + CO2 + 8e-
½ O2 + 2e- → O=
CO - carbon monoxide e- - electron H2O - water CO2 - carbon dioxide H+ - hydrogen ion O2 - oxygen CO3
= - carbonate ion H2 - hydrogen OH- - hydroxyl ion The Nernst equation provides a relationship between the ideal standard potential (E°) for the cell reaction and the ideal equilibrium potential (E) at other partial pressures of reactants and products. For the overall cell reaction, the cell potential increases with an increase in the partial pressure (concentration) of reactants and a decrease in the partial pressure of products. For example, for the hydrogen reaction, the ideal cell potential at a given temperature can be increased by operating at higher reactant pressures, and improvements in fuel cell performance have, in fact, been observed at higher pressures. This will be further demonstrated in Chapters 3 through 7 for the various types of fuel cells. The reaction of H2 and O2 produces H2O. When a carbon-containing fuel is involved in the anode reaction, CO2 is also produced. For MCFCs, CO2 is required in the cathode reaction to maintain an invariant carbonate concentration in the electrolyte. Because CO2 is produced at the anode and consumed at the cathode in MCFCs, and because the concentrations in the anode and cathode feed streams are not necessarily equal, the CO2 partial pressures for both electrode reactions are present in the second Nernst equation shown in Table 2-2.

2-5
Table 2-2 Fuel Cell Reactions and the Corresponding Nernst Equations
Cell Reactions* Nernst Equation
2 2 2H + O H O½ → E = E + (RT/ 2 ) ln [P / P ] + (RT/ 2 ) ln [P ]2 2 2H H O O° F F ½
2 2 2 (c)
2 2 (a)
H + O + CO
H O + CO
½ →
E = E + (RT/ 2 ) ln [P / P (P ) ] +
(RT/ 2 ) ln [P (P ) ]
2 2 2
2 2
H H O CO (a)
O CO ( )
° F
F ½c
CO + O CO2 2½ → E = E + (RT/ 2 ) ln [P / P ] + (RT/ 2 ) ln [P ]CO CO O2 2° F F ½
4 2 2
2
CH + 2O 2 H O +
CO
→
E = E + (RT/ 8 ) ln [P / P P ] + (RT/ 8 ) ln [P ]
4 2 2 2CH H O2
CO O2° F F
(a) - anode P - gas pressure (c) - cathode R - universal gas constant E - equilibrium potential T - temperature (absolute) F - Faraday's constant * The cell reactions are obtained from the anode and cathode reactions listed in Table 2-1. The ideal standard potential (Eo) at 298K for a fuel cell in which H2 and O2 react is 1.229 volts with liquid water product, or 1.18 volts with gaseous water product. This value is shown in numerous chemistry texts (2) as the oxidation potential of H2. The potential is the change in Gibbs free energy resulting from the reaction between hydrogen and oxygen. The difference between 1.229 volts and 1.18 volts represents the Gibbs free energy change of vaporization of water at standard conditions. Figure 2-1 shows the relation of E to cell temperature. Because the figure shows the potential of higher temperature cells, the ideal potential corresponds to a reaction where the water product is in a gaseous state (i.e., Eo is 1.18 volts).
1.0
1.1
1.2
Rev
ersi
ble
pot
entia
l (V
)
300 400 500 600 700 800 900 1000 1100
Temperature (K)
H2 + 1
2 O2
H2O
(g)
Figure 2-1 H2/O2 Fuel Cell Ideal Potential as a Function of Temperature
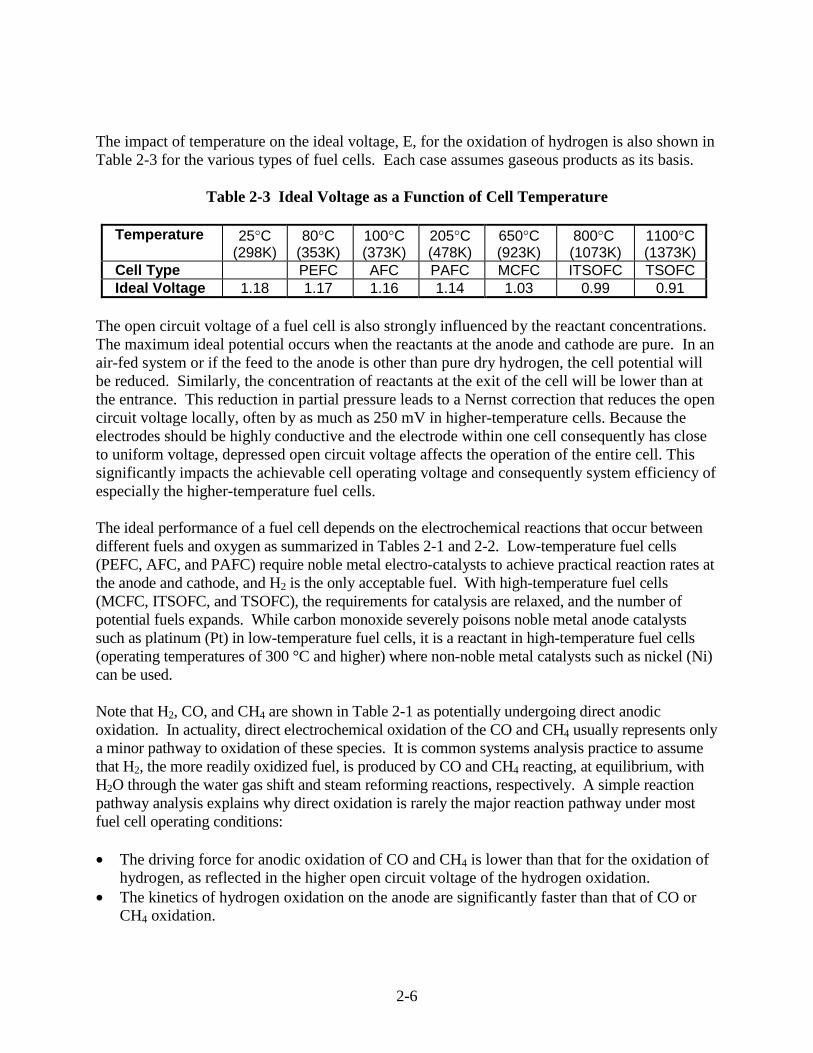
2-6
The impact of temperature on the ideal voltage, E, for the oxidation of hydrogen is also shown in Table 2-3 for the various types of fuel cells. Each case assumes gaseous products as its basis.
Table 2-3 Ideal Voltage as a Function of Cell Temperature
Temperature 25°C (298K)
80°C (353K)
100°C (373K)
205°C (478K)
650°C (923K)
800°C (1073K)
1100°C (1373K)
Cell Type PEFC AFC PAFC MCFC ITSOFC TSOFC Ideal Voltage 1.18 1.17 1.16 1.14 1.03 0.99 0.91
The open circuit voltage of a fuel cell is also strongly influenced by the reactant concentrations. The maximum ideal potential occurs when the reactants at the anode and cathode are pure. In an air-fed system or if the feed to the anode is other than pure dry hydrogen, the cell potential will be reduced. Similarly, the concentration of reactants at the exit of the cell will be lower than at the entrance. This reduction in partial pressure leads to a Nernst correction that reduces the open circuit voltage locally, often by as much as 250 mV in higher-temperature cells. Because the electrodes should be highly conductive and the electrode within one cell consequently has close to uniform voltage, depressed open circuit voltage affects the operation of the entire cell. This significantly impacts the achievable cell operating voltage and consequently system efficiency of especially the higher-temperature fuel cells. The ideal performance of a fuel cell depends on the electrochemical reactions that occur between different fuels and oxygen as summarized in Tables 2-1 and 2-2. Low-temperature fuel cells (PEFC, AFC, and PAFC) require noble metal electro-catalysts to achieve practical reaction rates at the anode and cathode, and H2 is the only acceptable fuel. With high-temperature fuel cells (MCFC, ITSOFC, and TSOFC), the requirements for catalysis are relaxed, and the number of potential fuels expands. While carbon monoxide severely poisons noble metal anode catalysts such as platinum (Pt) in low-temperature fuel cells, it is a reactant in high-temperature fuel cells (operating temperatures of 300 °C and higher) where non-noble metal catalysts such as nickel (Ni) can be used. Note that H2, CO, and CH4 are shown in Table 2-1 as potentially undergoing direct anodic oxidation. In actuality, direct electrochemical oxidation of the CO and CH4 usually represents only a minor pathway to oxidation of these species. It is common systems analysis practice to assume that H2, the more readily oxidized fuel, is produced by CO and CH4 reacting, at equilibrium, with H2O through the water gas shift and steam reforming reactions, respectively. A simple reaction pathway analysis explains why direct oxidation is rarely the major reaction pathway under most fuel cell operating conditions: • The driving force for anodic oxidation of CO and CH4 is lower than that for the oxidation of
hydrogen, as reflected in the higher open circuit voltage of the hydrogen oxidation. • The kinetics of hydrogen oxidation on the anode are significantly faster than that of CO or
CH4 oxidation.

2-7
• There is vastly more surface area available for catalytic reforming and shift reaction throughout the anode of a practical fuel cell than there is surface area in the three-phase-boundary for electrochemical oxidation.
• Mass-transfer of CO, CH4, and even more so of higher hydrocarbons, to the three-phase boundary and through the porous anode is more than ten times slower than that of hydrogen, leading to a more significant impact of concentration polarization.
Nevertheless, direct oxidation can be important under certain conditions, such as at the entrance of a cell. The degree to which an anode supports direct oxidation will then impact the degree of pre-reforming of the fuel that is required, which in turn typically impacts balance of plant complexity and cost. This is why there remains strong interest in the development of direct oxidation anodes. The H2 that can be produced from CO and CH4, along with any H2 in the fuel supply stream, is referred to as equivalent H2. The temperature and catalyst of state-of-the-art SOFCs and MCFCs provide the proper environment for the water gas shift reaction to produce H2 and CO2 from CO and H2O. If only H2 and CO are fed to the fuel cell, it is known as an external reforming (ER) cell. In an internal reforming (IR) fuel cell, the reforming reaction to produce H2 and CO2 from CH4 and H2O occurs inside the stack. In some IR fuel cells, reforming takes place on the anode (on-anode reforming) while in others a reforming catalyst is placed in proximity to the anode to promote the reaction (in-cell reforming). 2.3 Cell Energy Balance The discussion above can be used to formulate a mass and energy balance around a fuel cell to describe its electrical performance. The energy balance around the fuel cell is based on the energy absorbing/releasing processes (e.g., power produced, reactions, heat loss) that occur in the cell. As a result, the energy balance varies for the different types of cells because of the differences in reactions that occur according to cell type. In general, the cell energy balance states that the enthalpy flow of the reactants entering the cell will equal the enthalpy flow of the products leaving the cell plus the sum of three terms: (1) the net heat generated by physical and chemical processes within the cell, (2) the dc power output from the cell, and (3) the heat loss from the cell to its surroundings. Component enthalpies are readily available on a per mass basis from data tables such as JANAF (1). Product enthalpy usually includes the heat of formation in published tables. A typical energy balance determines the cell exit temperature knowing the reactant composition, the feed stream temperatures, H2 and O2 utilization, the expected power produced, and a percent heat loss. The exit constituents are calculated from the fuel cell reactions as illustrated in Example 9-3, Chapter 9. 2.4 Cell Efficiency The thermal efficiency of a fuel conversion device is defined as the amount of useful energy produced relative to the change in enthalpy, ∆H, between the product and feed streams.

2-8
η = H
Energy Useful
∆ (2-13)
Conventionally, chemical (fuel) energy is first converted to heat, which is then converted to mechanical energy, which can then be converted to electrical energy. For the thermal to mechanical conversion, a heat engine is conventionally used. Carnot showed that the maximum efficiency of such an engine is limited by the ratio of the absolute temperatures at which heat is rejected and absorbed, respectively (3). Fuel cells convert chemical energy directly into electrical energy. In the ideal case of an electrochemical converter, such as a fuel cell, the change in Gibbs free energy, ∆G, of the reaction is available as useful electric energy at the temperature of the conversion. The ideal efficiency of a fuel cell, operating reversibly, is then
η ideal = ∆∆
G
H (2-14)
The most widely used efficiency of a fuel cell is based on the change in the standard free energy for the cell reaction
H2 + ½ O2 → H2O(1) (2-15)
given by
2 2 2( )
1
2H HrG G G Gο ο∆ = − −o o ool
(2-16)
where the product water is in liquid form. At standard conditions of 25°C (298°K) and 1 atmosphere, the thermal energy ( H∆ ) in the hydrogen/oxygen reaction is 285.8 kJ/mole, and the free energy available for useful work is 237.1 kJ/mole. Thus, the thermal efficiency of an ideal fuel cell operating reversibly on pure hydrogen and oxygen at standard conditions is:
(2-17)
83.08.285
1.237 ==idealη

2-9
For other electrochemical reactions, different ideal efficiencies apply. Curiously, for direct electrochemical oxidation of carbon ∆G is larger than ∆H, and consequently the ideal efficiency is slightly greater than 100% when using this definition of ideal efficiency. For convenience, the efficiency of an actual fuel cell is often expressed in terms of the ratio of the operating cell voltage to the ideal cell voltage. As will be described in greater detail in the sections following, the actual cell voltage is less than the ideal cell voltage because of losses associated with cell polarization and ohmic losses. The thermal efficiency of a hydrogen/oxygen fuel cell can then be written in terms of the actual cell voltage:
actual actual
ideal ideal
Volts x Current (0.83)(V )Useful Energy Useful Power
H ( G 0 83) Volts x Current/0.83 E/ .η = = = =
∆ ∆ (2-18)
As mentioned previously, the ideal voltage of a cell operating reversibly on pure hydrogen and oxygen at 1 atm pressure and 25ºC is 1.229 V. Thus, the thermal efficiency of an actual fuel cell operating at a voltage of Vcell, based on the higher heating value of hydrogen, is given by
cell ideal cell cellη 0.83 x V / E 0.83 x V /1.229 0.675 x V= = = (2-19)
The foregoing has assumed that the fuel is completely converted in the fuel cell, as is common in most types of heat engines. This efficiency is also referred to as the voltage efficiency. However, in fuel cells, the fuel is typically not completely converted. To arrive at the net cell efficiency, the voltage efficiency must be multiplied by the fuel utilization. An excellent review of the impact of this phenomenon is provided by Winkler (4). Because the reactant activities in gas-fueled fuel cells drop as the utilization rises, and because the cell voltage cannot be higher than the lowest local potential in the cell, utilization considerations further limit the efficiency. Figure 2-2 shows the impact of fuel utilization on the Nernst voltage, voltage efficiency, and maximum overall cell efficiency for operating conditions typical for an SOFC (800 °C, 50% initial hydrogen concentration). Figure 2-2 shows that to achieve 90% fuel utilization, the Nernst voltage drops by over 200 mV. As a consequence, the maximum cell efficiency (on a higher heating value basis) is not 62%, as predicted based on the ideal potential, but 54%. Of course, practical cell operating effects and cell non-idealities further reduce this efficiency in real life. These effects are somewhat less profound at lower operating temperatures, such as those found in lower temperature SOFC, MCFC, or in low-temperature fuel cells.

2-10
0%
10%
20%
30%
40%
50%
60%
70%
80%
0% 20% 40% 60% 80% 100%
Fuel Utilization
Eff
icie
ncy
(b
ased
on
HH
V)
0.00
0.20
0.40
0.60
0.80
1.00
1.20
Ner
nst
Vo
ltag
e (V
)
cell efficiency 0% Voltage Efficiency / Nerst Voltage (V)
Figure 2-2 Effect of fuel utilization on voltage efficiency and overall cell efficiency for typical SOFC operating conditions (800 °C, 50% initial hydrogen concentration).
2.5 Actual Performance The actual cell potential is decreased from its ideal potential because of several types of irreversible losses, as shown in Figure 2-32. These losses are often referred to as polarization, overpotential or overvoltage, though only the ohmic losses actually behave as a resistance. Multiple phenomena contribute to irreversible losses in an actual fuel cell: • Activation-related losses. These stem from the activation energy of the electrochemical
reactions at the electrodes. These losses depend on the reactions at hand, the electro-catalyst material and microstructure, reactant activities (and hence utilization), and weakly on current density.
• Ohmic losses. Ohmic losses are caused by ionic resistance in the electrolyte and electrodes, electronic resistance in the electrodes, current collectors and interconnects, and contact resistances. Ohmic losses are proportional to the current density, depend on materials selection and stack geometry, and on temperature.
• Mass-transport-related losses. These are a result of finite mass transport limitations rates of the reactants and depend strongly on the current density, reactant activity, and electrode structure.
In the V-I diagram, especially for low-temperature fuel cells, the effects of the three loss categories are often easy to distinguish, as illustrated in Figure 2-3.
2 Activation region and concentration region are more representative of low-temperature fuel cells.

2-11
Theoretical EMF or Ideal Voltage
Region of Activation Polarization(Reaction Rate Loss)
Total Loss
Current Density (mA/cm2)
0.5
0
1.0
Cel
l Vo
ltage
Region of Ohmic Polarization(Resistance Loss)
Region ofConcentration Polarization
(Gas Transport Loss)
Operation Voltage, V, Curve
Figure 2-3 Ideal and Actual Fuel Cell Voltage/Current Characteristic In high-temperature fuel cells, the activation-related losses are often much less significant, and hence the characteristic concave portion of the V-I curve is hard to distinguish. In addition, as transport-related losses play a more important role, the convex portion of the curve often extends further to the left. Although it is tempting to characterize all losses in the cell as an equivalent resistance, only the ohmic losses actually behave that way, by definition. The ohmic loss depends only on cell geometry, the materials used, and the operating temperature. The other losses depend strongly on reactant concentrations (and hence fuel utilization) and thus they change within cells operated at finite fuel utilization. Attempts to include these types of polarization into the cell resistance more often than not lead to confusion and misinterpretation. This consideration has several ramifications for fuel cell engineers attempting to utilize single-cell data for stack or system design: • Activation and concentration polarization data presented are generally only valid for that
particular cell and operating geometry. • A mathematical model will generally be required to interpret activation and concentration
polarization data and translate it into data useful for stack engineers. • Detailed reactant concentration information (including utilization) is essential for
interpretation of activation and concentration polarization data. In practice, sound interpretation for translation to practical cell designs, sizes, and operating conditions is only possible when data is acquired with very low utilization (typically less than 5%), and for many reactant inlet partial pressures.
• Much of the single-cell data presented and published is taken at finite utilization. While useful for qualitative comparisons between cells, this data is generally not usable for further stack engineering.

2-12
Below the three types of losses are discussed in greater detail. Activation Losses: Activation losses are caused by sluggish electrode kinetics. There is a close similarity between electrochemical and chemical reactions in that both involve an activation energy that must be overcome by the reacting species. In reality, activation losses are the result of complex surface electrochemical reaction steps, each of which have their own reaction rate and activation energy. Usually, the rate parameters and activation energy of one or more rate-limiting reaction steps controls the voltage drop caused by activation losses on a particular electrode under specific conditions. However, in the case of electrochemical reactions with ηact > 50-100 mV, it is possible to approximate the voltage drop due to activation polarization by a semi-empirical equation, called the Tafel equation (5). The equation for activation polarization is shown by Equation (2-20):
acto
= RT
n ln
i
iη
α F (2-20)
where α is the electron transfer coefficient of the reaction at the electrode being addressed, and io is the exchange current density. Tafel plots, such as in Figure 2-4, provide a visual understanding of the activation polarization of a fuel cell. They are used to measure the exchange current density, given by the extrapolated intercept at ηact = 0 which is a measure of the maximum current that can be extracted at negligible polarization (3), and the transfer coefficient (from the slope). The usual form of the Tafel equation that can be easily expressed by a Tafel Plot is
ηact = a + b ln i (2-21)
where a = (-RT/αnF) ln io and b = RT/αnF. The term b is called the Tafel slope, and is obtained from the slope of a plot of ηact as a function of ln i. There exists a strong incentive to develop electro-catalysts that yield a lower Tafel slope for electrochemical reactions so that increases in current density result only in nominal increases in activation polarization.

2-13
5.0
4.0
3.0
2.0
1.0
0.00 100 200 300
(mV)
Log
i (m
A/c
m2)
η
ExchangeCurrent
Figure 2-4 Example of a Tafel Plot The simplified description presented here did not consider processes that give rise to activation polarization, except for attributing it to sluggish electrode kinetics. Processes involving absorption of reactant species, transfer of electrons across the double layer, desorption of product species, and the nature of the electrode surface all contribute to activation polarization. Ohmic Polarization: Ohmic losses occur because of resistance to the flow of ions in the electrolyte and resistance to flow of electrons through the electrode. The dominant ohmic losses through the electrolyte are reduced by decreasing the electrode separation and enhancing the ionic conductivity of the electrolyte. Because both the electrolyte and fuel cell electrodes obey Ohm's law, the ohmic losses can be expressed by the equation
ηohm = iR (2-22)
where i is the current flowing through the cell, and R is the total cell resistance, which includes electronic, ionic, and contact resistance: R = Relectronic + Rionic + Rcontact Any of these components can dominate the ohmic resistance, depending on the cell type. For example, in planar electrolyte-supported SOFC the ionic resistance usually dominates; in tubular SOFC the electronic bulk resistance usually dominates, and in planar thin-electrolyte SOFC contact resistances often dominate.
The ohmic resistance normalized by the active cell area is the Area Specific Resistance (ASR). ASR has the units Ωcm2. The ASR is a function of the cell design, material choice, manufacturing technique, and, because material properties change with temperature, operating conditions. The ASR is a key performance parameter, especially in high-temperature fuel cells, where the ohmic losses often dominate the overall polarization of the cell.

2-14
Experimentally, there are several ways to determine the ohmic cell resistance. If the V-I curve has a substantial linear portion (in the center), the slope of this curve usually closely approximates the ASR of the cell. Only in such a linear portion of the V-I curve the ohmic resistance is dominant, and hence the determination of the ASR valid. Sometimes, a more accurate way to determine the ohmic resistance is from impedance spectroscopy. In an impedance spectrum of a fuel cell, the ohmic resistance is the real value of the impedance of the point for which the imaginary impedance is zero (Figure 2-5). As can be seen in the example, the ohmic resistance is invariant with gas concentration. The part of the impedance that is related to mass transport and kinetics, however, changes markedly with anode feed composition.
Figure 2-5 Example of impedance spectrum of anode-supported SOFC operated at 850 °C (6). Rs is Ohmic resistance. Two measurements were with hydrogen/water
vapor mixtures, and the other in diluted hydrogen. Finally, the electronic portions of the ohmic resistance could also be measured directly using a four-point probe or with a through-measurement. Given a certain cell design and operating temperature, the bulk material contributions to R (and hence the ASR) can also be calculated. Based on the detailed cell geometry, the length of both the ionic and electronic current paths and cross-sectional area for current conduction can be measured. Together with the resistivities of the materials used, they yield the bulk ASR. The contact resistance cannot be calculated from fundamental data, and is usually determined by difference between the measured total resistance and the computed bulk resistance. When using literature data for ASR, it is critical to verify the definition of ASR. Some researchers have defined “ASR”s to include the activation and concentration polarization as well as the ohmic polarization. Mass Transport-Related Losses: As a reactant is consumed at the electrode by electrochemical reaction, it is often diluted by the products, when finite mass transport rates limit the supply of fresh reactant and the evacuation of products. As a consequence, a concentration gradient is

2-15
formed which drives the mass transport process. In a fuel cell with purely gas-phase reactants and products (such as an SOFC), gas diffusion processes control mass transfer. In other cells, multi-phase flow in the porous electrodes can have a significant impact (e.g. in PEFC). In hydrogen fuel cells, the evacuation of product is often more limiting than the supply of fuel, given the difference between the diffusivities of hydrogen and water (vapor). While at low current densities and high bulk reactant concentrations mass-transport losses are not significant, under practical conditions (high current densities, low fuel and air concentrations), they often contribute significantly to loss of cell potential. For gas-phase fuel cells, the rate of mass transport to an electrode surface in many cases can be described by Fick's first law of diffusion:
i = n D (C C )B SF −
δ (2-23)
where D is the diffusion coefficient of the reacting species, CB is its bulk concentration, CS is its surface concentration, and δ is the thickness of the diffusion layer. The limiting current (iL) is a measure of the maximum rate at which a reactant can be supplied to an electrode, and it occurs when CS = 0, i.e.,
LB
i = n DCF
δ (2-24)
By appropriate manipulation of Equations (2-23) and (2-24),
S
B L
C
C = 1
i
i− (2-25)
The Nernst equation for the reactant species at equilibrium conditions, or when no current is flowing, is
E = E + RT
n ln CBi 0= °
F (2-26)
When current is flowing, the surface concentration becomes less than the bulk concentration, and the Nernst equation becomes

2-16
E = E + RT
n ln CS°
F (2-27)
The potential difference (∆E) produced by a concentration change at the electrode is called the concentration polarization:
∆ E = = RT
n ln
C
Cconc
S
B
ηF
(2-28)
Upon substituting Equation (2-25) in (2-28), the concentration polarization is given by the equation
concL
= RT
n ln 1
i
iη
F−
⎛⎝⎜
⎞⎠⎟
(2-29)
In this analysis of concentration polarization, the activation polarization is assumed to be negligible. The charge transfer reaction has such a high exchange current density that the activation polarization is negligible in comparison with the concentration polarization (most appropriate for the high temperature cells). Cumulative Effect of the Losses: The combined effect of the losses for a given cell and given operating conditions can be expressed as polarizations. The total polarization at the electrodes is the sum of ηact and ηconc, or
ηanode = ηact,a + ηconc,a (2-30)
and
ηcathode = ηact,c + ηconc,c (2-31)
The effect of polarization is to shift the potential of the electrode (Eelectrode) to a new value (Velectrode):
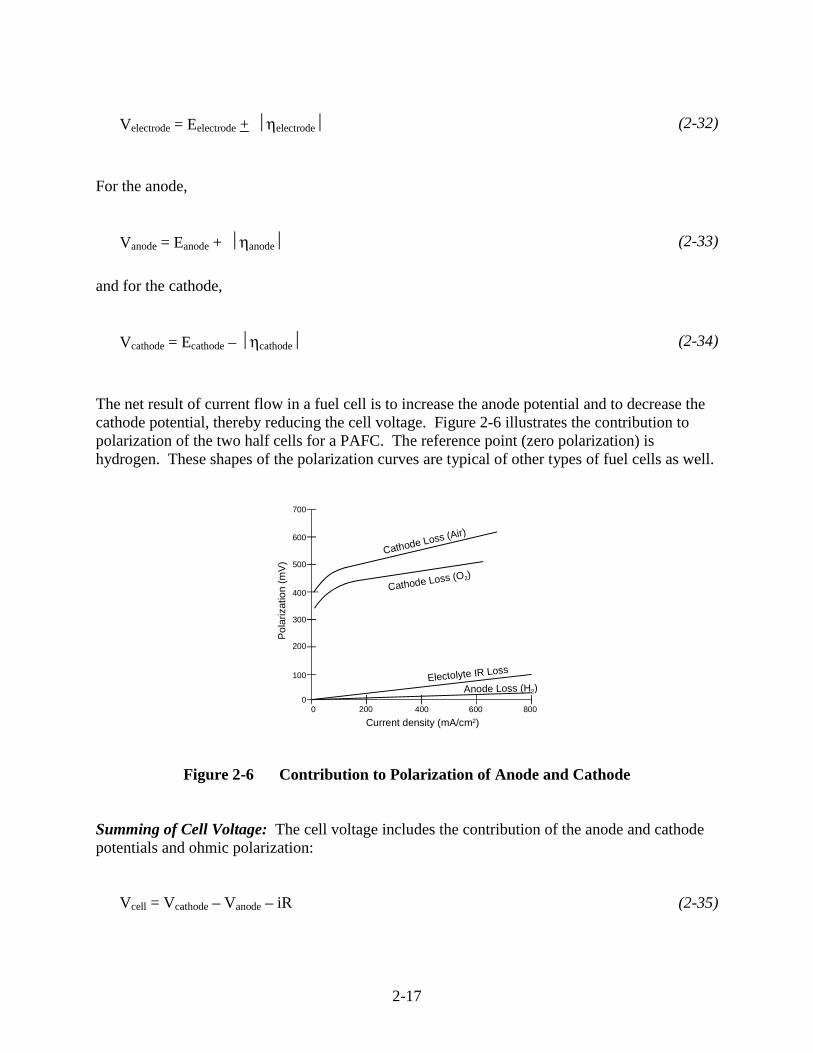
2-17
Velectrode = Eelectrode + ηelectrode (2-32)
For the anode,
Vanode = Eanode + ηanode (2-33)
and for the cathode,
Vcathode = Ecathode – ηcathode (2-34)
The net result of current flow in a fuel cell is to increase the anode potential and to decrease the cathode potential, thereby reducing the cell voltage. Figure 2-6 illustrates the contribution to polarization of the two half cells for a PAFC. The reference point (zero polarization) is hydrogen. These shapes of the polarization curves are typical of other types of fuel cells as well.
700
600
500
400
300
200
100
00 200 400 600 800
Cathode Loss (Air)
Electolyte IR Loss
Cathode Loss (O2)
Anode Loss (H2)
Po
lari
zatio
n (
mV
)
Current density (mA/cm2)
Figure 2-6 Contribution to Polarization of Anode and Cathode Summing of Cell Voltage: The cell voltage includes the contribution of the anode and cathode potentials and ohmic polarization:
Vcell = Vcathode – Vanode – iR (2-35)

2-18
When Equations (2-33) and (2-34) are substituted in Equation (2-35)
Vcell = Ecathode – ηcathode – (Eanode + ηanode) – iR (2-36)
or
Vcell = ∆Ee – ηcathode – ηanode – iR (2-37)
where ∆Ee = Ecathode – Eanode. Equation (2-37) shows that current flow in a fuel cell results in a decrease in cell voltage because of losses by electrode and ohmic polarizations. The goal of fuel cell developers is to minimize the polarization so that Vcell approaches ∆Ee. This goal is approached by modifications to fuel cell design (improvement in electrode structures, better electro-catalysts, more conductive electrolyte, thinner cell components, etc.). For a given cell design, it is possible to improve the cell performance by modifying the operating conditions (e.g., higher gas pressure, higher temperature, change in gas composition to lower the gas impurity concentration). However, for any fuel cell, compromises exist between achieving higher performance by operating at higher temperature or pressure and the problems associated with the stability/durability of cell components encountered at the more severe conditions. 2.6 Fuel Cell Performance Variables The performance of fuel cells is affected by operating variables (e.g., temperature, pressure, gas composition, reactant utilization, current density), cell design and other factors (impurities, cell life) that influence the ideal cell potential and the magnitude of the voltage losses described above. The equations describing performance variables, which will be developed in Chapters 3 through 7, address changes in cell performance as a function of major operating conditions to allow the reader to perform quantitative parametric analysis. The following discussion provides basic insight into the effects of some operating parameters. Current Density: The effects on performance of increasing current density were addressed in the previous section that described how activation, ohmic, and concentration losses occur as the current is changed. Figure 2-7 is a simplified depiction of how these losses affect the shape of the cell voltage-current characteristic. As current is initially drawn, sluggish kinetics (activation losses) cause a decrease in cell voltage. At high current densities, there is an inability to diffuse enough reactants to the reaction sites (concentration losses) so the cell experiences a sharp performance decrease through reactant starvation. There also may be an associated problem of diffusing the reaction products from the cell. Ohmic losses predominate in normal fuel cell operation. These losses can be expressed as iR losses where i is the current and R is the summation of internal resistances within the cell, Equation (2-22). As is readily evident from the equation, the ohmic loss and hence voltage change is a direct function of current (current density multiplied by cell area).

2-19
Figure 2-7 presents the most important trade-off in choice of the operating point. It would seem logical to design the cell to operate at the maximum power density that peaks at a higher current density (right of the figure). However, operation at the higher power densities will mean operation at lower cell voltages or lower cell efficiency. Setting operation near the peak power density can cause instability in control because the system will have a tendency to oscillate between higher and lower current densities around the peak. It is usual practice to operate the cell to the left side of the power density peak and at a point that yields a compromise between low operating cost (high cell efficiency that occurs at high voltage/low current density) and low capital cost (less cell area that occurs at low voltage/high current density). In reality, the precise choice of the operating point depends on complex system trade-offs, usually aided by system studies that allow the designer to take into account effects of operating voltage and current density on parasitic power consumption, sizing of balance of plant components, heat rejection requirements, and other system design considerations.
0.00
0.20
0.40
0.60
0.80
0 100 200 300 400 500 600
Current Density, mA/cm2
Ce
ll V
olt
ag
e, v
olt
s
0
100
200
300
400
Po
we
r De
ns
ity, m
W/c
m2
Figure 2-7 Voltage/Power Relationship It is interesting to observe that the resulting characteristic provides the fuel cell with a benefit that is unique among other energy conversion technologies: the fuel cell efficiency increases at part load conditions.3 Even though other components within the fuel cell system operate at lower component efficiencies as the system's load is reduced, the combination of increased fuel cell efficiency and lower supporting component efficiencies can result in a rather flat trace of total system efficiency as the load is reduced. This is in contrast with many heat engine-based energy conversion technologies that typically experience a significant drop-off in efficiency at part-load. This gives the fuel cell system a fuel cost advantage for applications where a significant amount of part-load operation is required.
3. Constraints can limit the degree of part load operation of a fuel cell. For example, a PAFC is limited to
operation below approximately 0.85 volts because of entering into a corrosion region.

2-20
Temperature and Pressure: The effect of temperature and pressure on the ideal potential (E) of a fuel cell can be analyzed on the basis of changes in the Gibbs free energy with temperature and pressure.
P
E S =
T n
∂ ∆⎛ ⎞⎜ ⎟∂⎝ ⎠ F
(2-38)
or
T
E V =
P n
∂ −∆⎛ ⎞⎜ ⎟∂⎝ ⎠ F
(2-39)
Because the entropy change for the H2/O2 reaction is negative, the reversible potential of the H2/O2 fuel cell decreases with an increase in temperature (by 0.84 mV/°C, assuming reaction product is liquid water). For the same reaction, the volume change is negative; therefore, the reversible potential increases with an increase in pressure (with the square root of the pressure, assuming pressure is equal on both electrodes). However, temperature has a strong impact on a number of other factors: • Electrode reaction rates. Typically, electrode reactions follow Arrhenius behavior. As a
consequence, these losses decline exponentially with increasing temperature, usually more than off-setting the reduction in ideal potential. The higher the activation energy (and hence usually the losses) the greater the impact of temperature. The impact of total pressure depends on the pressure dependence of rate-limiting reaction steps.
• Ohmic losses. The impact of temperature on cell resistance is different for different materials. For metals, the resistance usually increases with temperature, while for electronically and ionically conductive ceramics it decreases exponentially (Arrhenius-form). For aqueous electrolytes, the impact is limited though high temperatures can lead to dehydration of the electrolyte (e.g. PEFC) and loss of conductivity. As a rule of thumb, for high-temperature fuel cells, the net effect is a significant reduction in resistance, while for low-temperature fuel cells the impact over the operating range is limited.
Mass transport processes are not strongly affected by temperature changes within the typical operating temperature and pressure ranges of most fuel cell types. An increase in operating pressure has several beneficial effects on fuel cell performance because the reactant partial pressure, gas solubility, and mass transfer rates are higher. In addition, electrolyte loss by evaporation is reduced at higher operating pressures. Increased pressure also tends to increase system efficiencies. However, there are compromises such as thicker piping and additional expense for pressurization. Section 8.1.1 addresses system aspects of pressurization. The benefits of increased pressure must be balanced against hardware and materials problems, as well as parasitic power costs. In particular, higher pressures increase material problems in MCFCs (see Section 6.1), pressure differentials must be minimized to prevent reactant gas leakage through

2-21
the electrolyte and seals, and high pressure favors carbon deposition and methane formation in the fuel gas. Reactant Utilization and Gas Composition: Reactant utilization and gas composition have major impacts on fuel cell efficiency. It is apparent from the Nernst equations in Table 2-2 that fuel and oxidant gases containing higher partial pressures of electrochemical reactants produce a higher cell voltage. Utilization (U) refers to the fraction of the total fuel or oxidant introduced into a fuel cell that reacts electrochemically. In low-temperature fuel cells, determining the fuel utilization is relatively straightforward when H2 is the fuel, because it is the only reactant involved in the electrochemical reaction,4 i.e.
f2,in 2,out
2,in
2, consumed
2,inU =
H H
H =
H
H
− (2-40)
where H2,in and H2,out are the flow rates of H2 at the inlet and outlet of the fuel cell, respectively. However, hydrogen can be consumed by various other pathways, such as by chemical reaction (i.e., with O2 and cell components) and loss via leakage out of the cell. These pathways increase the apparent utilization of hydrogen without contributing to the electrical energy produced by the fuel cell. A similar type of calculation is used to determine the oxidant utilization. For the cathode in MCFCs, two reactant gases, O2 and CO2, are utilized in the electrochemical reaction. The oxidant utilization should be based on the limiting reactant. Frequently O2, which is readily available from make-up air, is present in excess, and CO2 is the limiting reactant. A significant advantage of high-temperature fuel cells such as MCFCs is their ability to use CO as a fuel. The anodic oxidation of CO in an operating MCFC is slow compared to the anodic oxidation of H2; thus, the direct oxidation of CO is not favored. However, the water gas shift reaction
CO + H2O º H2 + CO2 (2-41)
reaches equilibrium rapidly in MCFCs at temperatures as low as 650°C (1200°F) to produce H2.
5 As H2 is consumed, the reaction is driven to the right because both H2O and CO2 are produced in equal quantities in the anodic reaction. Because of the shift reaction, fuel utilization in MCFCs can exceed the value for H2 utilization, based on the inlet H2 concentration. For example, for an anode gas composition of 34% H2, 22% H2O, 13% CO, 18% CO2, and 12% N2, a fuel utilization of 80% (i.e., equivalent to 110% H2 utilization) can be achieved even though this would require 10% more H2 (total of 37.6%) than is available in the original fuel. The high fuel utilization is possible because the shift reaction provides the necessary additional H2 that is oxidized at the anode. In this case, the fuel utilization is defined by
4. Assumes no gas cross-over or leakage out of the cell. 5. Example 9-5 in Section 9 illustrates how to determine the amount of H2 produced by the shift reaction.

2-22
f2, consumed
2,in inU =
H
H + CO (2-42)
where the H2 consumed originates from the H2 present at the fuel cell inlet (H2,in) and any H2 produced in the cell by the water gas shift reaction (COin). Gas composition changes between the inlet and outlet of a fuel cell, caused by the electrochemical reaction, lead to reduced cell voltages. This voltage reduction arises because the cell voltage adjusts to the lowest electrode potential given by the Nernst equation for the various gas compositions at the exit of the anode and cathode chambers. Because electrodes are usually good electronic conductors and isopotential surfaces, the cell voltage can not exceed the minimum (local) value of the Nernst potential. In the case of a fuel cell with the flow of fuel and oxidant in the same direction (i.e., co-flow), the minimum Nernst potential occurs at the cell outlet. When the gas flows are counterflow or crossflow, determining the location of the minimum potential is not straightforward. The MCFC provides a good example to illustrate the influence of the extent of reactant utilization on the electrode potential. An analysis of the gas composition at the fuel cell outlet as a function of utilization at the anode and cathode is presented in Example 9-5. The Nernst equation can be expressed in terms of the mole fraction of the gases (Xi) at the fuel cell outlet:
2 2 2
2 2
½ ½,cathodeO COHo
O,anode ,anodeCOH
RT X X X PE + lnE2 X X
=F
(2-43)
where P is the cell gas pressure. The second term on the right side of Equation (2-43), the so-called Nernst term, reflects the change in the reversible potential as a function of reactant utilization, gas composition, and pressure. Figure 2-8 illustrates the change in reversible cell potential as a function of utilization using Equation (2-43).

2-23
Figure 2-8 The Variation in the Reversible Cell Voltage as a Function of Reactant Utilization
(Fuel and oxidant utilizations equal) in a MCFC at 650°C and 1 atm. Fuel gas: 80% H2/20% CO2 saturated with H2O at 25°C; oxidant gas: 60% CO2/30% O2/10% inert) The reversible potential at 650°C (1200°F) and 1 atmosphere pressure is plotted as a function of reactant utilization (fuel and oxidant utilizations are equal) for inlet gas compositions of 80% H2/20% CO2 saturated with H2O at 25°C (77°F) (fuel gas6) and 60% CO2/30% O2/10% inerts (oxidant gas); gas compositions and utilizations are listed in Table 2-4. Note that the oxidant composition is based on a gas of 2/1 CO2 to O2. The gas is not representative of the cathode inlet gas of a modern system, but is used for illustrative purposes only. The mole fractions of H2 and CO in the fuel gas decrease as the utilization increases, and the mole fractions of H2O and CO2 show the opposite trend. At the cathode, the mole fractions of O2 and CO2 decrease with an increase in utilization because they are both consumed in the electrochemical reaction. The reversible cell potential plotted in Figure 2-8 is calculated from the equilibrium compositions for the water gas shift reaction at the cell outlet. An analysis of the data in the figure indicates that a change in utilization from 20% to 80% will cause a decrease in the reversible potential of about 0.158 V. These results show that MCFCs operating at high utilization will suffer a large voltage loss because of the magnitude of the Nernst term. An analysis by Cairns and Liebhafsky (7) for a H2/air fuel cell shows that a change in the gas composition that produces a 60 mV change in the reversible cell potential near room temperature corresponds to a 300 mV change at 1200°C (2192°F). Thus, gas composition changes are more significant in high temperature fuel cells.
6. Anode inlet composition is 64.5% H2/6.4% CO2/13% CO/16.1% H2O after equilibration by water gas shift reaction.

2-24
Table 2-4 Outlet Gas Composition as a Function of Utilization in MCFC at 650°C
Gas Utilizationa (%)
0 25 50 75 90
Anodeb
X H2 0.645 0.410 0.216 0.089 0.033
XCO2 0.064 0.139 0.262 0.375 0.436
XCO 0.130 0.078 0.063 0.033 0.013
XH2O 0.161 0.378 0.458 0.502 0.519
Cathodec
X CO2 0.600 0.581 0.545 0.461 0.316
XO2 0.300 0.290 0.273 0.231 0.158
a - Same utilization for fuel and oxidant. Gas compositions are given in mole fractions. b - 80% H2/20% CO2 saturated with H2O at 25°C. Fuel gas compositions are based on
compositions for water gas shift equilibrium. c - 30% O2/60% CO2/10% inert gas. Gas is not representative of a modern system cathode inlet
gas, but used for illustrative purposes only. 2.7 Mathematical Models Mathematical models are critical for fuel cell scientists and developers as they can help elucidate the processes within the cells, allow optimization of materials, cells, stacks, and systems, and support control systems. Mathematical models are perhaps more important for fuel cell development than for many other power technologies because of the complexity of fuel cells and fuel cell systems, and because of the difficulty in experimentally characterizing the inner workings of fuel cells. Some of the most important uses of mathematical fuel cell models are: • To help understand the internal physics and chemistry of fuel cells. Because experimental
characterization is often difficult (because of physical access limitations and difficulty in controlling test parameters independently), models can help understand the critical processes in cells.
• To focus experimental development efforts. Mathematical models can be used to guide experiments and to improve interpolations and extrapolations of data. The rigor of modeling often forces the explicit position of a scientific hypothesis and provides a framework for testing the hypothesis.
• To support system design and optimization. Fuel cell systems have so many unit operations and components that system models are critical for effective system design.
• To support or form the basis of control algorithms. Because of the complexity of fuel cell systems, several developers have used fully dynamic models of fuel cell systems as the basis for their control algorithms.

2-25
• To evaluate the technical and economic suitability of fuel cells in applications. Models can be used to determine whether a fuel cell’s unique characteristics will match the requirements of a given application and evaluate its cost-effectiveness.
Each of these applications for fuel cell models has a specific requirement with respect to the level of detail and rigor in the model and its predictive capability. In many higher level applications, the predictive requirements are modest. In some cases, the operational characteristics of the fuel cell are not even a degree a freedom. In such cases, relatively simple models are satisfactory and appropriate. It is possible to encapsulate the mass and energy balances and performance equations for a fuel cell within a spreadsheet application. Such spreadsheet models are often useful for quick trade-off considerations. On the other end of the spectrum, models intended to improve understanding of complex physical and chemical phenomena or to optimize cell geometries and flow patterns are necessarily very sophisticated, and usually have intensive computational requirements. As expected, given this wide range of potential uses and the variety of fuel cell types, an equally wide variety of fuel cell models has been developed. While fundamentally the constitutive equations such as those described earlier in this chapter underlie all models, their level of detail, level of aggregation, and numerical implementation method vary widely. A useful categorization of fuel cell models is made by level of aggregation, as shown in Figure 2-9. As implied in the figure, the outputs of the more detailed fundamental models can be used in lower-order models. This flow of information is, in fact, a critical application for high fidelity models. Recently, much work has been done in the development of algorithms to integrate or embed high-fidelity models into system analysis simulation tools. Despite the availability of quite sophisticated fuel cell models with well-written code and convenient user interfaces, the fuel cell developer or engineer must be a critical user. As mentioned above, obtaining experimental data on the behavior of fuel cells (especially internally and at the micro-level) can be difficult, time-consuming, and expensive. Unfortunately this has lead to a dearth of accurate and detailed data of sufficient quality and quantity to allow thorough validation of the mathematical models. Much of the data on fuel cell performance reported in the literature is, while phenomenologically often interesting, insufficiently accurate and accompanied by far too little detail on the test conditions to be usable for model validation. In particular, with much of the cell and stack taken at modest utilization, it is almost impossible to infer kinetic data without spatially resolved data on current density, temperature and species concentrations. As a consequence, the validity of fuel cell models must be critically considered for each use. The user of the model must be thoroughly familiar with the assumptions and limitations embedded in the models.

2-26
Figure 2-9 Overview of Levels of Fuel Cell Models.
The sub-sections following describe examples of each type of model and provide some insight into their uses. Khaleel (8) and Fleig (9) provide useful overviews of the active developers in fuel cell modeling at different levels of aggregation, in particular for SOFC applications. 2.7.1 Value-in-Use Models Value-in-use models are mathematical models that allow the user to predict how the unique features of fuel cells will create value or benefits in a given application. Since such models are usually highly application-specific, two examples are provided rather than an exhaustive review. A typical model of this type would be an economic model that helps the user to predict the cost savings resulting from the installation of a fuel cell CHP system in a building. Inputs usually include building specifications and use, climate information, performance and cost characteristics of the fuel cell CHP system, and applicable utility rate structures. Generally, only a high-level description of the fuel cell system is embedded, representing the efficiency and emissions versus load curves. The models are then used, for example, to evaluate the cost-effectiveness of a fuel cell CHP system or compare it with other CHP options. DOE has
Electrode Models
1-D Cell Models
3-D Cell / Stack Models
Thermodynamic System Models
Application Models
M
O
M
O
C3H7H
C3H8
M
O
M
O
C3H7C3H7H
C3H8
0.4
0.5
0.6
0.7
0.8
0.9
1
ce
ll p
ote
nti
al
(V)
0 0.2 0.4 0.6 0.8 1 1.2 1.4 current density (A/cm²)
NG2000 H2 NG3000 H2 NG2000 ref NG3000 ref
0.4
0.5
0.6
0.7
0.8
0.9
1
ce
ll p
ote
nti
al
(V)
0 0.2 0.4 0.6 0.8 1 1.2 1.4 current density (A/cm²)
NG2000 H2 NG3000 H2 NG2000 ref NG3000 ref
Value-in-Use Models
Building Energy Cost ModelBuilding Energy Cost Model
Building characteristics
Electric
SH
WH
Hour-by-hourloads
Weather data
Building Energy Cost ModelBuilding Energy Cost Model
Building characteristics
Electric
SH
WH
Hour-by-hourloads
Weather data
46"60"
53"
12
4
5
6 7
8
9
10
11
12
13
15
14
Illustra
tive
• Continuum electrode models• Multi-particle models• Local current density
distribution models• Micro-kinetic models
• Spreadsheet 1-D models• Finite volume / difference 1-D cell
models
• CFD-based models• Structural models
• PFD models• Spreadsheet models
• Building energy models• Vehicle drive-cycle models
• Well-to-wheels / busbar models• Economic models

2-27
supported the development of a number of models of this kind (10), while national laboratories and private companies have developed their own versions of this type of software. Another well-known type of value-in-use model is the well-to-wheels analysis, in which the energy consumption, environmental impact, and sometimes cost of different transportation options are compared considering all steps from the primary resource to the vehicle. This type of model is commonly used to evaluate hydrogen PEFC vehicles. Argonne National Laboratories’ GREET model (11) is the most widely used of these models. A critical subset of value-in-use models is that used to help establish the manufacturing cost of fuel cells. Several developers have created detailed manufacturing cost models for PEFC and SOFC over the past years (12, 13, 14), the results of which are widely used both in value-in-use models and for business planning. These models typically consider the individual processing steps required to produce particular cell and stack geometries at a given production volume (usually high production volumes). Based on estimates of the material costs, capital cost, and labor requirements for each process step, an estimate of the stack cost is developed. Costs of other components and sub-systems are determined based on a combination of vendor quotes and other manufacturing sub-models. 2.7.2 Application Models Fuel cell application models are used to assess the interactions between the fuel cell power system and the application environment. The most common use is in vehicle applications where the dynamic interactions between the power system and the vehicle are too complex to analyze without the help of a mathematical model. Several commercial providers of dynamic vehicle modeling software have developed Fuel Cell modules (e.g. Gamma Technologies’ GT Power, MSC Software’s MSC.EASY5 and others). The best-published vehicle simulator of this type is ADVISOR (Advanced VehIcle SimulatOR) developed by the National Renewable Energy Laboratory and now commercialized by AVL (15). The model assesses the performance and fuel economy of conventional, electric, hybrid, and fuel cell vehicles. The user can evaluate component and vehicle specifications such as electric motors, batteries, engines, and fuel cells. ADVISOR simulates the vehicle's performance under different driving conditions. Industry partnerships contributed state-of-the-art algorithms to ensure the accuracy of the model. For example, detailed electrical analysis is made possible by co-simulation links to Avant's Saber and Ansoft's SIMPLORER. Transient air conditioning analysis is possible by co-simulation with C&R Technologies' SINDA/FLUINT. Michelin provided data for a tire rolling resistance model, and Maxwell provided data for an ultracapacitor energy storage model. 2.7.3 Thermodynamic System Models Fuel cell system models have been developed to help understand the interactions between various unit operations within a fuel cell system. Most fuel cell system models are based on thermodynamic process flow simulators used by the process industry (power industry, petroleum industry, or chemical industry) such as Aspen Plus, HYSIS, and ChemCAD. Most of these codes are commercially distributed, and over the past years they have offered specific unit operations to assist modeling fuel cell stacks (or at least a guide for putting together existing unit operations to represent a fuel cell stack) and reformers. Others (16) have developed more sophisticated 2-D

2-28
models to help with dynamic or quasi-dynamic simulations. The balance of plant components usually can be readily modeled using existing unit operations included in the packages. These types of models are used routinely by fuel cell developers, and have become an indispensable tool for system engineers. The accuracy of the basic thermodynamic models is quite good, but because the fuel cell sub-models are typically lumped parameter models or simply look-up tables, their accuracy depends heavily on model parameters that have been developed and validated for relevant situations. Aspen Plus is described below as an example, followed by a description of GCTools, an Argonne National Laboratory modeling set that offers an alternative to codes from the commercial software industry. Unit Operations Models for Process Analysis using ASPEN DOE's National Energy Technology Laboratory has been engaged in the development of systems models for fuel cells for over 15 years. The models were originally intended for use in applications of stationary power generation designs to optimize process performance and to evaluate process alternatives. Hence, the models were designed to work within DOE’s ASPEN process simulator and later ported to the commercial version of this product, ASPEN Plus. ASPEN is a sophisticated software application developed to model a wide variety of chemical processes. It contains a library of unit operations models that simulate process equipment and processing steps, and it has a chemical component data bank that contains physical property parameters that are used to compute thermodynamic properties, including phase and chemical equilibrium. The first general purpose fuel cell model was a Nernst-limited model designed to compute the maximum attainable fuel cell voltage as a function of the cell operating conditions, inlet stream compositions, and desired fuel utilization. Subsequently, customized unit operations models were developed to simulate the operation of solid oxide (internal reforming), molten carbonate (both external and internal reforming), phosphoric acid, and polymer electrolyte fuel cells (PEFC). These fuel cell models are lumped parameter models based on empirical performance equations. As operation deviates from the setpoint conditions at a "reference" state, a voltage adjustment is applied to account for perturbations. Separate voltage adjustments are applied for current density, temperature, pressure, fuel utilization, fuel composition, oxidant utilization, oxidant composition, cell lifetime, and production year. These models were developed in a collaborative effort by DOE's National Energy Technology Laboratory and the National Renewable Energy Laboratory. In recent years, participants in the SECA core program have developed a stack sub-model for ASPEN that adequately represents intermediate temperature SOFC. Stand-alone fuel cell power systems have been investigated, as well as hybrid systems using a wide variety of fuels and process configurations. Some of the systems analyses studies that have been conducted using these fuel cell models are described in Chapter 8. Argonne's GCTool Argonne National Laboratory developed the General Computational Toolkit (GCTool) specifically for designing, analyzing, and comparing fuel cell systems and other power plant

2-29
configurations, including automotive, space-based, and stationary power systems. A library of models for subcomponents and physical property tables is available, and users can add empirical models of subcomponents as needed. Four different types of fuel cell models are included: polymer electrolyte, molten carbonate, phosphoric acid, and solid oxide. Other process equipment models include heat exchangers, reactors (including reformers), and vehicle systems. The physical property models include multiphase chemical equilibrium. Mathematical utilities include a nonlinear equation solver, a constrained nonlinear optimizer, an integrator, and an ordinary differential equation solver. GCTool has been used to analyze a variety of PEFC systems using different fuels, fuel storage methods, and fuel processing techniques. Examples include compressed hydrogen, metal hydride, glass microsphere, and sponge-iron hydrogen storage systems. Fuel processing alternatives have included reformers for methanol, natural gas, and gasoline using either partial oxidation or steam reforming. Researchers have examined atmospheric and pressurized PEFC automotive systems. These analyses included the identification of key constraints and operational analysis for off-design operation, system dynamic and transient performance, and the effects of operation at extreme temperatures. 2.7.4 3-D Cell / Stack Models Fuel cell stack models are used to evaluate different cell and stack geometries and to help understand the impact of stack operating conditions on fuel cell stack performance. Given the wide range of possible stack geometries and the wide range of operating parameters that influence stack operation, optimization of stack design under specific application requirements is difficult without the help of a model that represents the key physico-chemical characteristics of stacks. A number of three-dimensional stack models has been developed for this purpose. In all of these models, the stack geometry is discretized into finite elements, or volumes, that can be assigned the properties of the various stack components and sub-components. At a minimum, the models must represent electrochemical reactions, ionic and electronic conduction, and heat and mass transfer within the cell. As with system models, most of these models rely on existing modeling platforms although in the case of stack models, an advanced 3-D modeling platform is generally required. • Computational Fluid Dynamics (CFC) – based Fuel Cell Codes. These are based on
commercial CFD codes (e.g. StarCD, Fluent, AEA Technologies’ CFX) that have been augmented to represent electrochemical reactions and electronic and ionic conduction. In many cases, refinements in the treatment of catalytic chemical reactions and flow through porous media are also incorporated to represent various electrode processes. In addition to evaluating basic fuel cell performance (current density, temperature and species concentration profiles) these models can help understand the impact of different manifolding arrangements.
• Computational Structural Analysis – based codes. These are based on publicly or commercially available 3-dimensional structural analysis codes (e.g. ANSYS, Nastran, Abacus). Typically, these must be augmented to represent ionic conduction, fluid flow, and electrochemical and chemical reactions. While these codes do not provide as much insight

2-30
into the impact of complex flows as the CFD-based codes, they are usually more efficient (run faster) than CFD-based codes and can be used to assess mechanical stresses in the stack; a key issue in some of the high-temperature fuel cell technologies.
Because many of the basic elements describing the core cell performance in all of these approaches is similar, approaches developed for one type of stack model can be ported to another. Below the approach taken by NETL and Fluent is described, which is similar to the approach taken for PEFC cells developed by Arthur D. Little (17), which also applied that approach to SOFC using a structural code (ABACUS (18, 19)). Pacific Northwest National Laboratory (PNNL) has developed several 3-D stack models based on a CFD code (StarCD) and structural codes (MARC). In Europe, Forschungs-Zentrum Julich has developed its own 3-D codes. These models have been applied to a range of cell geometries, though in recent years the focus has been on planar cells. NETL's 3-D Analysis The National Energy Technology Laboratory (NETL) developed a 3-dimensional computational fluid dynamics (CFD) model to allow stack developers to reduce time-consuming build-and-test efforts. As opposed to systems models, 3-dimensional CFD models can address critical issues such as temperature profiles and fuel utilization; important considerations in fuel cell development. CFD analysis computes local fluid velocity, pressure, and temperature throughout the region of interest for problems with complex geometries and boundary conditions. By coupling the CFD-predicted fluid flow behavior with the electrochemistry and accompanying thermodynamics, detailed predictions are possible. Improved knowledge of temperature and flow conditions at all points in the fuel cell lead to improved design and performance of the unit. In this code, a 1-dimensional electrochemical element is defined, which represents a finite volume of active unit cell. This 1-D sub-model can be validated with appropriate single-cell data and established 1-D codes. This 1-D element is then used in FLUENT, a commercially available product, to carry out 3-D similations of realistic fuel cell geometries. One configuration studied was a single tubular solid oxide fuel cell (TSOFC) including a support tube on the cathode side of the cell. Six chemical species were tracked in the simulation: H2, CO2, CO, O2, H2O, and N2. Fluid dynamics, heat transfer, electrochemistry, and the potential field in electrode and interconnect regions were all simulated. Voltage losses due to chemical kinetics, ohmic conduction, and diffusion were accounted for in the model. Because of a lack of accurate and detailed in situ characterization of the SOFC modeled, a direct validation of the model results was not possible. However, the results are consistent with input-output observations on experimental cells of this type.

2-31
Figure 2-10 Conours of Current Density on Electrolyte
Current density is shown on the electrolyte and air-flow velocity vectors are shown for the cap-end of the tubular fuel cell. Cathode and support tube layers have been removed for clarity. Results indicate that current density and fuel consumption vary significantly along the electrolyte surface as hydrogen fuel is consumed and current flows around the electrodes between interconnect regions. Peak temperature occurs about one-third of the axial distance along the tube from the cap end. NETL’s CFD research has demonstrated that CFD-based codes can provide detailed temperature and chemical species information needed to develop improved fuel cell designs. The output of the FLUENT-based fuel cell model has been ported to finite element-based stress analysis software to model thermal stresses in the porous and solid regions of the cell. In principle, this approach can be used for other types of fuel cells as well, as demonstrated by Arthur D. Little and NETL (16,18) Further enhancement of the design tool is continuing. The next steps are to validate the model with experimental data and then extend the model to stack module and stack analysis. NETL now operates SOFC test facilities to generate detailed model validation data using well-characterized SOFC test specimens. These steps should make it possible to create a model that accurately predicts the performance of cells and stacks so that critical design information, such as the distribution of cell and stack stresses, can be provided to the fuel cell design engineer. 2.7.5 1-D Cell Models 1-D cell models are critical for constructing 3-D models, but they are also highly useful in interpreting and planning button cell experiments. In 1-D models, all of the critical phenomena in a cell are considered in a 1-D fashion. Generally they incorporate the following elements:

2-32
• Transport phenomena: • Convective mass transport of reactants and products to/from the surface of the electrodes • Mass transport of reactants and products through the porous electrodes • Conduction of electronic current through the electrodes and current collectors • Conduction of ions through the electrolyte and electrodes (where applicable) • Conduction, convection, and radiation of heat throughout the cell
• Chemical reactions: • Electrochemical reactions at or near the triple phase boundary (TPB) • Internal reforming and shift reactions taking place inside the anode
Figure 2-11 shows an example for a PEFC cell.
Coolant Flow Plate
Flow PlatesGas
Diffusion Layers
ElectrolyteCatalystLayers
ElectronsHeat Mass ProtonsFlow Module 1-d Membrane Catalyst (MC) module
Figure 2-11 Typical Phenomena Considered in a 1-D Model (17) A large number of 1-D models have been developed. Some are based on numerical discretization methods (e.g. finite element or finite difference methods), while others are analytical in nature. An example of the former was given in the description of the NETL 3-D model. An example of an analytical approach is provided by Chick and Stevenson (20). 2.7.6 Electrode Models Given the importance of electrode polarization in overall cell performance, electrode sub-models are critical in the development of all other fuel cell models. As described in an excellent review by Fleig ((9), Figure 2-12), one can distinguish four levels of electrode models: • Continuum electrode approach. In this approach the electrode is represented as a
homogeneous zone for diffusion, electrochemical reaction, and ion- and electron-conduction. Because this approach ignores the specific processes occurring at the TPB and the impact of the microstructure of the electrode, this approach yields models that must be calibrated for each specific electrode design and for each set of operating conditions. With this approach it is impossible to distinguish between rate-determining steps in the electrochemically active zone, though the relative importance of mass transfer versus kinetic processes can be expressed crudely.
• Multi-particle approach. This approach recognizes that electrodes are typically made up of many particles that have different (at least two) phases with different characteristics. Issues of connectivity, percolation, and other mass-transfer-related factors can be addressed with this approach, but the details of the electrochemical reaction steps at the TPB are lumped

2-33
together. From a numerical perspective, one or more resistor networks are added to the continuum model.
• Local current density distribution approach. A refinement on the multi-particle approach, this approach considers that current-densities are not necessarily homogeneous within the particles, which can strongly impact electrode resistances. Often this approach is executed using a finite element method.
• Micro-kinetics approach. In this approach, the individual reaction steps at or near the TPB are considered. Although analytical solutions (in Buttler-Volmer form) can be found if a single rate-determining step is considered, generally a numerical solution is necessary for multi-step reactions. This approach can be embedded in the multi-particle or local-current density approaches, or directly used in a 1-D model with simpler assumptions for the transport phenomena. This is the only approach that can give insight into the rate-determining electrochemical processes that take place in the cell. When optimizing electro-catalysts or studying direct oxidation of hydrocarbons, this type of model can be very enlightening.
Figure 2-12 Overview of types of electrode models (9)
2.8 References 1 M.W. Chase, et al., “JANAF Thermochemical Tables,” Third Edition, American Chemical
Society and the American Institute of Physics for the National Bureau of Standards (now National Institute of Standards and Technology), 1985.
2 P.W. Atkins, “Physical Chemistry,” 3rd Edition, W.H. Freeman and Company, New York, NY, 1986.
3 “Fuel Cell Handbook,” J. Appleby and F. Foulkes, Texas A&M University, Van Nostrand Reinhold, New York (out of print), republished by Krieger Publishing Co., Melbourne, FL, 1989.

2-34
4 Winkler, W., Thermodynamics, in High Temperature Solid Oxide Fuel Cells: Fundamentals, Design and Applications, S.C. Singhal and K. Kendall, Editors. 2003, Elsevier Ltd.: Oxford, UK. p. 53 - 82.
5 S.N. Simons, R.B. King and P.R. Prokopius, in Symposium Proceedings Fuel Cells Technology Status and Applications, Figure 1, p. 46, Edited by E.H. Camara, Institute of Gas Technology, Chicago, IL, 45, 1982.
6 P. V. Hendriksen, S. Koch, M. Mogensen, Y. L. Liu, and P. H. Larsen, in Solid Oxide Fuel Cells VIII, eds S. C. Singhal and M. Dokiya, The Electrochemical Society Proceedings, Pennington, NJ, PV2003-07, 2003, p. 1147
7 E.J. Cairns and H.A. Liebhafsky, Energy Conversion, p. 9, 63, 1969. 8 Khaheel, M.A. Modeling and Simulation SECA Core Program. in Modeling and Simulation
Team Integration Meeting. 2003: US DOE. http://www.seca.doe.gov/events/2002/ model_simulation/pnnl_m_khaleel.pdf
9 Fleig, J., Solid Oxide Fuel Cell Cathodes: Polarization Mechanisms and Modeling of the Electrochemical Performance. Annual Review of Materials Research, 2003. 33: p. 361 - 382.
10 U.S. Department of Energy, Office of Building Technology, State and Community Programs, Tools Directory web site, current URL: http://www.eere.energy.gov/buildings/tools_directory/
11 Development and Use of GREET 1.6 Fuel-Cycle Model for Transportation Fuels and Vehicle Technologies, Center for Transportation Research, Energy Systems Division, Argonne National Laboratory, Report ANL/ESD/TM-163, June 2001.
12 Carlson, E., Assessment of Planar Solid Oxide Fuel Cell Technology. 1999, US Department of Energy: Cambridge, MA, USA.
13 Koslowske, M., A Process Based Cost Model for Multi-Layer Ceramic Manufacturing of Solid Oxide Fuel Cells, in Materials Science. 2003, Worcester Polytechnic Institute: Worcester, MA, USA. p. 42.
14 Carlson, E. and S. Mariano, Cost Analysis of Fuel Cell System for Transportation. 2000, Arthur D. Little for US DOE OTT: Cambridge, MA, USA.
15 ADVISOR: A Systems Analysis Tool for Advanced Vehicle Modeling, Markel, T., et al., Journal of Power Sources, 2002, available from the following URL: http://www.ctts.nrel.gov/ analysis/advisor.html
16 J. Pålsson, A. Selimovic, and L. Sjunnesson, J. Power Sources, 86, (2000), 442 - 448 17 Sriramulu, S. and J. Thijssen. in Fuel Cell Seminar. 2000. Portland, OR: US DOE. 18 Thijssen, J. and S. Sriramulu, Structural Limitations in the Scale-Up of Anode-Supported
SOFCs. 2002, Arthur D. Little for US DOE: Cambridge, MA, USA. 19 Fulton, C., et al. Structural Limitations in the Scale-Up of Anode-Supported SOFCs. in Fuel
Cell Seminar. 2002. Palm Springs, CA: US Department of Energy. 20 Chick, L.A., J.W. Stevenson, and R. Williford. Spreadsheet Model of SOFC Electrochemical
Performance. in SECA Training Workshop. 2003. Morgantown, WV: US DOE NETL. http://www.netl.doe.gov/publications/proceedings/03/seca-model/Chick8-29-03.pdf