Embed Size (px)
Citation preview
1
T.I. Mulcahey1, T.J. Conrad1,2, S.M. Ghiaasiaan1
1Cryo Lab, Georgia Institute of Technology Atlanta, GA 30332 2Raytheon Space and Airborne Systems El Segundo, CA 90245
ABSTRACT Modern pulse tube cryocoolers are often sensitive to gravitational orientation, leading to a
significant loss of cooling power as tilt angle increases from the traditional cold tip down configuration. A number of theories exist as to the cause of this phenomenon, but most agree that natural convection can develop in the pulse tube, leading to a short-circuit between the warm and cold heat exchangers at either end. In order to further elucidate this phenomenon we have developed 3-dimensional Computational Fluid Dynamic (CFD) models of the pulse tube section of two low temperature inertance tube pulse tube cryocoolers, and compared key results with experimental data collected during static tilt testing. Results are presented for static tilt configurations of 0-90 degrees between the pulse tube axis and the gravitational vector. Modeling indicated the presence of natural convection as well as significant loss of cooling capacity at angles above 45 degrees consistent with physical observations.
INTRODUCTION In this paper we present the results of a combined experimental and theoretical investigation
into the fundamental loss mechanisms that take place in inertance tube pulse tube cryocoolers when operating under adverse gravitational conditions. Pulse tube cryocoolers (PTC) operate most effectively when the cold ends of the components are pointed downward with respect to the gravitational field. One of the most critical components in the PTC is the pulse tube, a hollow tube that acts as a gas piston, eliminating the need for the mechanical expander used in Stirling cryocoolers. The pulse tube is additionally responsible for providing a stratified temperature gradient between the cold heat exchanger (CHX) and the warm heat exchanger (WHX), also known as the aftercooler. As a result of the pulse tube essentially being a passive hollow tube, the gas domain within is susceptible to natural convection and mixing resulting from buoyancy effects. This direct path for heat transfer from the WHX to the CHX creates a loss mechanism, which has been quantified both experimentally and through direct numerical simulation.
This study aims to identify the mechanisms responsible for gravitational cooling loss using a combined approach where low temperature Sage v8 modeling software [1] is used to develop boundary conditions at the pulse tube inlet and outlet, and 3D Computational Fluid Dynamic
CFD Modeling of Tilt Induced Cooling Lossesin Inertance Tube Pulse Tube Cryocoolers
#86
143Cryocoolers 17, edited by S.D. Miller and R.G. Ross, Jr.©¶International Cryocooler Conference, Inc., Boulder, CO, 2012

2
MODELING METHODOLOGY The physical geometry of the study coolers were initially modeled using the low temperature
cooler (LT) model of Sage version 8. Sage was used to estimate the oscillatory pressure and mass flow boundary conditions at the entrance and exit of the 2nd stage pulse tube, due to the inability to directly apply pressure and mass flow sensors at the desired locations on the developmental hardware in the scope of the current program. Oscillating gas domain properties are quantified in Sage using a basic Fourier cosine series that predicts the mean value, the fundamental, and higher harmonics of the oscillating flow characteristics, each value having a relative phase angle to allow accurate superposition. The number of higher harmonics depends on the number of time nodes simulated; in our models we typically use 7 to 9 time nodes, and therefore calculate 3 harmonics.
2-D CFD models were initially created in Fluent to efficiently determine the user-defined boundary conditions (UDF) that best match the Sage predicted pressure amplitude, mass flow rate, and the phase angle between mass flow and pressure waveforms. Oscillatory flow is imposed through moving wall boundary conditions [3] since oscillating conditions imposed through pressure, velocity or mass flow inlet boundary conditions tend to be inaccurate. Figure 1 shows the computational domain modeled in this study, consisting of the cold heat exchanger (CHX), pulse tube (PT), and warm heat exchanger (WHX) sections, all modeled in half-symmetry about the plane in which gravity is imposed. Gas domain buffer zones are added at the cold and warm ends to prevent the moving wall boundaries from intersecting with the porous heat exchanger zones. The CHX and WHX sections consist of tubes filled with packed phosphor bronze mesh screens; these are modeled using Fluent’s porous media model with viscous and inertial coefficients based on the Darcy permeability and Forchheimer inertial coefficients reported in [4, 5].
Figure 1. Representative experimental domain under investigation
Modeling (CFD) is carried out in half-symmetry using ANSYS Fluent 14.0 [2]. The results ofthese models are directly compared with experimental cooling data gathered on the coldeststages of two different multi-stage Stirling-type pulse tube cryocoolers. A design for a 4 Kcooler was also modeled in Sage and Fluent for comparison, though experimental validation isnot available at this time.
144 PULSE TUBE ANALYSIS AND EXPERIMENTAL MEASUREMENTS

3
Three separate experimental domains are represented in this study, each with a different length-to-diameter ratio. In addition, the three coolers represented operate over different temperature ranges. The length-to-diameter (L/D) ratio and temperature gradient for each modeling case are shown in Table 1. The modeled coolers are all relatively low temperature domains in the range of 4 K to 60 K and therefore real gas correlations are required for accurate property representation. The Fluent plug-in for REFPROP Helium-4 real-gas properties was used for all models, requiring significantly longer simulation time.
The mesh size used varies by case but elements are generally between 0.3 mm and 0.7 mm on edge. An initial grid independence study was performed to determine the relationship between simulation accuracy and the time required to simulate. As this is intended to be a progress report on our modeling methodology and currently available experimental tilt results, the grid used in this study is admittedly a bit coarse. This coarse grid appears to be sufficient to show that the CFD model ultimately captures the behavior observed in tilting. Future results will include finer mesh and an extended grid independence study.
Periodic steady-state (PSS) is a term used to indicate that all energy and hydrodynamic measurements do not change significantly from cycle to cycle. PSS is defined in this study as having a maximum change of 3% between successive cycles in any monitored pressure, velocity, or heat transfer quantity. Cases are initialized at the mean temperature of the system and then iteratively marched forward in time until PSS is reached, typically on the order of 12 to 24 cycles. The time step for time marching was chosen for each case such that 250 time steps are recorded for each cycle.
The Fluent density-based solver was used in 3-D double-precision transient mode. Implicit formulation was used along with least squares cell based treatment of gradients and second order upwinding to treat flow discretization. The convergence criteria were set based on previous experience with oscillatory flow modeling. Scaled residuals were set to a tolerance of 10-7 for the velocity, continuity, and momentum terms and 10-13 for the energy terms, with relative criteria set to 10-8. The models presently reported assume laminar flow; though the effects of various turbulence models are currently under investigation and will be presented in future work.
We define a tilt loss function
€
˙ Q * θ( ) in Equation 1 in order to quantify the parasitic thermal load on the CHX resulting from convective mixing of the compliance duct gas as a function of tilt angle. Since there is no actual cooling predicted by the simulations due to the absence of a regenerator, only the gas dynamics in the pulse tube are represented. The angle θ is the inclination angle defined relative to the expected cold tip down orientation, therefore an angle of θ=0° corresponds to a gravity vector oriented parallel to the pulse tube axis and pointing in the direction of the CHX.
€
˙ Q * θ( ) =1−˙ Q θ( ) − ˙ Q 0°( )
˙ Q 0°( ) (1)
The value of
€
˙ Q * θ( ) should always be on the order of 1, since it is normalized by the cooling predicted with the cold tip down, the orientation assumed to maximize cooling. In practice, the tilt loss function is intended to be scaled by either by the net cooling predicted by Sage, or by the experimentally measured cooling at 0° tilt, if available to predict the performance as a function of tilt angle. The monitored heat flows at the CHX are negative in Fluent by convention to indicate heat removal, and tilt losses manifest themselves as larger negative heat loads at the CHX. Equation 1 normalizes the difference in cooling load between the tilted and un-tilted case (the loss term), which is then subtracted this from 1. The resulting function can be thought of as a
Table 1. Experimental domain operating conditions Case
# Operating Frequency
(Hz) L/D Ratio Temperature Gradient (K/m) 1 41 8.55 767 2 26.5 8.01 564 3 22.2 5 145
145CFD MODELING OF TILT INDUCED COOLING LOSSES

4
loss coefficient indicating a percentage of the un-tilted cooling that can be achieved at a given angle. The resulting tilt loss function can be scaled by either the predicted or experimentally measured cooling at 0° in order to predict a load curve as a function of angle of inclination.
RESULTS
Three separate pulse tubes were modeled in Fluent according to the methods previously described, with boundary conditions as indicated in Table 1. Static pressure, velocity, mass flow rate, and area-integrated total surface heat flux were monitored at the cold and warm ends as a function of time. Pressure, velocity, and mass flow rates were used to ensure dynamic similarity to the values predicted using Sage. These values do not necessarily correspond to the physical values present in the experimental coolers, as these coolers could not be instrumented for direct comparison. The Fluent runs were post-processed to cycle average the integrated heat fluxes at the CHX and WHX. The integrated surface heat flux, or the total rate of heat transfer, at the CHX was then entered into Equation 1 and recorded.
Figure 2 shows the temperature profiles simulated for a particularly tilt-sensitive design. The profiles in Figure 2 correspond to Case 3 indicated in Table 1. As shown in Figure 2, asymmetry appears immediately as tilt is imposed, starting at 15° incline. The most dramatic change occurs when the pulse tube is horizontal, perpendicular to the gravitational field. The buoyancy imposed by the gravitational body forces leads to a complete breakdown of the temperature and density stratification in this case where the pulse tube aspect ratio (L/D) is only 5.
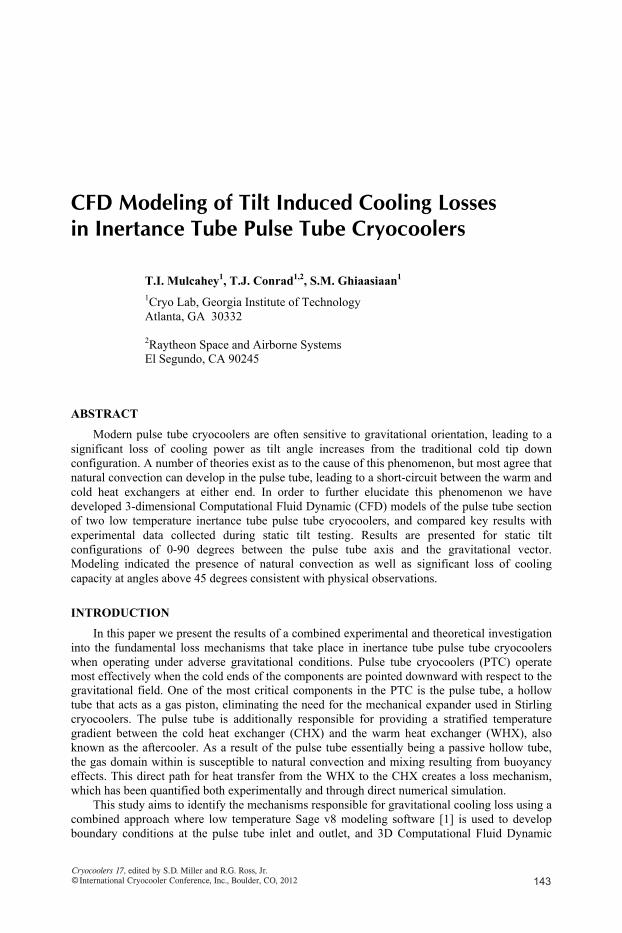
Figure 3 shows compiled results for Case 2, where the correction factor
€
˙ Q * θ( ) has been scaled by the experimentally measured heat lift at θ=0°. By design, the predicted cold tip down performance matches exactly to the measured performance. The experimental heat lift quickly degrades as the pulse tube is inclined. As shown in Figure 3, the Fluent CFD model indicates loss in agreement with the experimental data, but with smaller magnitude. We speculate that the reason for the disagreement is due to lack of modeling fidelity at this time, and anticipate better agreement with advanced meshing techniques as well as the addition of an appropriate turbulence model. We anticipate that the additional turbulence will enhance mixing in the pulse
Figure 2. Temperature profiles at various inclination angles for Case 3.
146 PULSE TUBE ANALYSIS AND EXPERIMENTAL MEASUREMENTS
5
147CFD MODELING OF TILT INDUCED COOLING LOSSES
tube, resulting in increased parasitic heat load. While the Fluent model predicts a restoration of cooling capacity at angles greater than 60°, experimental data suggests that instability above this inclination angle yield unstable results where the objective temperature cannot be maintained.
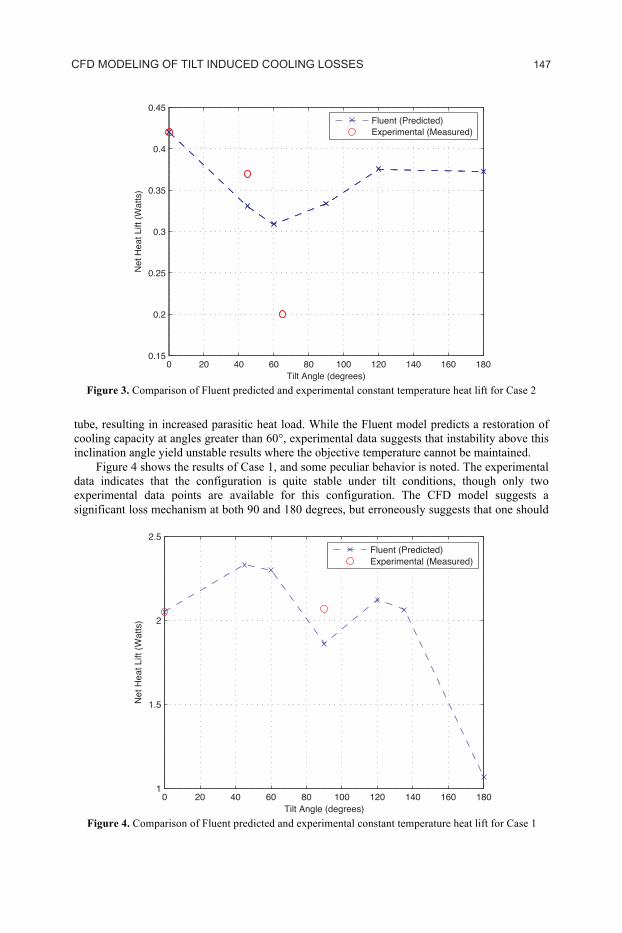
Figure 4 shows the results of Case 1, and some peculiar behavior is noted. The experimental data indicates that the configuration is quite stable under tilt conditions, though only two experimental data points are available for this configuration. The CFD model suggests a significant loss mechanism at both 90 and 180 degrees, but erroneously suggests that one should
Figure 4. Comparison of Fluent predicted and experimental constant temperature heat lift for Case 1
0 20 40 60 80 100 120 140 160 1801
1.5
2
2.5
Tilt Angle (degrees)
Net
Hea
t Lift
(Wat
ts)
Fluent (Predicted)Experimental (Measured)
Figure 3. Comparison of Fluent predicted and experimental constant temperature heat lift for Case 2
0 20 40 60 80 100 120 140 160 1800.15
0.2
0.25
0.3
0.35
0.4
0.45
Tilt Angle (degrees)
Net
Hea
t Lift
(Wat
ts)
Fluent (Predicted)Experimental (Measured)

6
expect increased cooling capacity at intermediate inclination angles. Examination of the pressure, temperature, and velocity profiles did not indicate any anomalous behavior that would lead to enhanced cooling. The variation in predicted cooling for the 45° and 60° cases may be an artifact of the modeling inaccuracy as similar grid density was used for this case despite the higher velocities present, compared to cases 2 and 3. The prediction of a loss at 90 deg is also out of agreement with experiment. Another possible factor contributing to all is the approximate nature of the pressure, mass flow and temperature boundary conditions.
Figure 5 displays the predicted tilt loss function for Case 3, the 4 K cryocooler design. No experimental data is available for this case. The results in Figure 5 have not been scaled by a predicted cooling capacity at 0°, and therefore represents the results that one would expect simply by applying Equation 1 to simulation data. The CFD model predicts only a minimal loss of cooling at the 180° point, which would be nearly impossible to achieve in practice. While it is possible to maintain a stable, stratified field in the pulse tube when perfectly inverted, any deviation from 180° or other disturbance could potentially lead to catastrophic breakdown of the stratification.
The CFD models for the 90° and 180° orientations represent something of a physical singularity condition. The models are able to stabilize at these conditions, whereas in reality these precise angles would be difficult to achieve. The overall trend in Figure 4 is most compatible with that expected in practice, where cooling is difficult to maintain past 60° incline, and almost impossible to achieve at angles around 100° as shown in the no-load temperatures reported in [6]. For this reason we suspect that the improvement in cooling predicted in Figures 4 and 6 are artifacts of the model that will be investigated in detail.
CONCLUSIONS
The results of this preliminary study indicate that CFD modeling can be effectively used to predict cooling losses resulting from orientation with respect to gravity. We defined a tilt loss function and used Fluent to predict it for three different cold-stage geometries and operating conditions. The results presented indicate that varying levels of cooling loss can result from
148 PULSE TUBE ANALYSIS AND EXPERIMENTAL MEASUREMENTS
Figure 5. Fluent predicted tilt loss function for Case 3 (4 K cooler)
0 20 40 60 80 100 120 140 160 1800.75
0.8
0.85
0.9
0.95
1
1.05
Tilt Angle (degrees)
Tilt
Loss
Fun
ctio
n Q
*()
Fluent (Predicted)

7Paper#86
operation in any orientation other than cold tip down, depending on the operating temperaturesand length-to-diameter ratio of the pulse tube component.
FUTURE WORKCurrent ongoing work involves applying more advanced meshing schemes to the compu-
tational domain in order to better represent boundary effects. Additional CFD models will bebuilt to fill in the tilt angles in much finer increments for greater fidelity. Turbulence modelsare also being evaluated as a means to achieve better agreement between the experimental dataand the tilt loss functions predicted in Fluent. Finally, the computational domain will be ex-tended in future work to better represent the inertance tube and surge volume contributions, asthe physical configuration of these flow transitions can greatly affect the flow predictions.
The work presented here is part of a much larger planned body of work that will encom-pass a significantly wider range of aspect ratios, operating temperatures, frequencies, and os-cillation amplitudes. The overall goal of this investigation will be to characterize the tilt lossmechanism and to provide predictive methods for determining cooler sensitivity to tilt lossduring the design phase. Additionally, the physical mechanisms responsible for the tilt lossanomaly will be investigated with the end goal of eliminating the issue altogether.
ACKNOWLEDGMENTThis work was partially funded through the U.S. Office of Naval Research (ONR) as part
of SBIR Contract #N00014-11-C-0466
REFERENCES1. Gedeon, D., Low Temperature Cooler - Sage version 8, www.sageofathens.com, Gedeon Associates,
Athens, Ohio, 2011.
2. ANSYS(R) Fluent, Release 13.0, help system, Fluent Theory Guide, 2011, ANSYS, Inc. .
3. Conrad, T.J., S.M. Ghiaasiaan, and C.S. Kirkconnell, “Simulation of Boundary Layer Effects in thePulse Tube of a Miniature Cryocooler,” Cryocoolers 16, ICC Press, Boulder, CO, 2011, pp. 267-273.
4. Cha, J.S., Hydrodynamic Parameters of Microporous Media for Steady and Oscillatory Flow: Appli-cation to Cryocooler Regenerator, PhD Thesis, G.W. Woodruff School of Mechanical Engineering,Georgia Institute of Technology, 2007.
5. Cha, J.S., S.M. Ghiaasiaan, and C.S. Kirkconnell, “Oscillatory flow in microporous media applied inpulse-tube and Stirling-cycle cryocooler regenerators,” Experimental Thermal and Fluid Science, 2008.32(6): pp. 1264-1278.
6. Ross, R.G., Jr., Johnson, D.S. and Rodriguez, “Effect of Gravity Orientation on the Thermal Perfor-mance of Stirling-type Pulse Tube Cryocoolers,” Cryogenics, Vol. 44, Issue: 6-8, June - August, 2004,pp. 403-408.
149CFD MODELING OF TILT INDUCED COOLING LOSSES