Embed Size (px)
Citation preview

PROJECT REPORT
COLOUR AND TDS REMOVAL FROM ECF BLEACH PLANT
EFFLUENT
1. Broad Area of Technology Effluent Treatment
2. Project Duration 12 months
3. Organisation Tamil Nadu Newsprint and Papers Ltd., Kagithapuram, Karur, Tamil Nadu Pin - 639136
4. Other Investigating Agency Central Leather Research Institute, Chennai,(Council of Scientific and Industrial Research, Govt. of India)
5. Actual Location where the Project is being carried out
Tamil Nadu Newsprint and Papers Ltd., Kagithapuram, Karur, Tamil Nadu Pin - 639136
6. Principal Investigator Dr. S.V. Subrahmanyam. TNPL, Kagithapuram, TN - 639 136
7. Co- Investigator Dr. S. Chinnaraj, Sr. Manager (R & D), TNPL, Kagithapuram, TN - 639 136
8. Other Investigators
Mr. S. Subramaniam, AGM (LAB), Mr. N. Baskaran, Manager (LAB), Mr. K. S. Rajesh, Manager (LAB), Mr. P. Karunanidhi, Officer (LAB), TNPL, Kagithapuram, TN - 639 136
Funded by Development Council (Paper), DoIPP,
Govt. of India
Supported by Indian Paper Manufactures Association
Tamil Nadu Newsprint and Papers Ltd., Kagithapuram, Karur, Tamil Nadu - 639136

Colour and TDS Removal from ECF Bleach Plant Effluent By TNPL
Development Council (Paper), DoIPP, Govt. of India & IPMA - 1 -
Title : Colour and TDS removal from ECF bleach plant effluent
Project area : Effluent treatment
Sponsoring agency : Development Council (Paper), DoIPP, Govt. of India.
Executing agency : Tamil Nadu Newsprint and Papers Limited
Participating agency : Central Leather Research Institute, Chennai (Council of
Scientific and Industrial Research, Govt. of India)
Total budget : RS 47.66 lakhs
SUMMARY
The biological treatment of HW EOP filtrate in the FAACO reactor has resulted in a
reduction of 50 to 60 % in COD and Colour and this was enhanced slightly by Fenton
dosage. However, COD & Colour was still high and it is not suitable to treat in
membrane process for TDS reduction. Treatment of DHT filtrate in FACCO reactor, with
Fenton and ammonium persulphate has brought about 50 to 60% reductions in COD &
Colour, but the cost of treatment has increased considerably. High COD at FACCO outlet
caused fouling in the RO membrane thereby reducing the recovery efficiency. The cost of
hardness/TDS removal by lime-soda treatment and membrane filtration works out to Rs
80 /m3. Pretreatment methods to remove silica, heavy metals and hardness, such as, lime
treatment, followed by anaerobic and aerobic process for improved biological treatment
need to be explored to make the process more economical. Ion exchange techniques and
Resin filtration for Colour/COD/TDS removal have to be experimented further to find a
viable method for tertiary treatment to remove TDS and other non-process elements
especially for ECF bleach plant effluent.
The results of present studies will be very useful input to design a Zero Liquid Discharge
system which is technically more advanced and economically viable. Based on results

Colour and TDS Removal from ECF Bleach Plant Effluent By TNPL
Development Council (Paper), DoIPP, Govt. of India & IPMA - 2 -
obtained from the present study TNPL has already initiated a ZERO LIQUID
DISCHARGE program and proposed to setup 5 m3/hr pilot plant to find out feasibility of
treating bleach plant effluent combining both biological and membrane process.
INTRODUCTION
The pulp and paper mill operation consumes large volume of water when compared to other
manufacturing industries. Water is used as medium where all the pulp and paper making
process are carried out and it is also used as vehicle to transport the pulp in the mills from
one unit operations to another and gets contaminated during various processes. This
contaminated water (effluent) is treated and discharged later as wastewater. In the 80’s water
consumption per ton of paper produced was as high as 250 m³/MT, and at present it ranges
from 100 to 150 m3/ MT. In the past one decade considerable efforts were made in both
national and international level to develop and operate closed loop configuration in the pulp
and paper mills to minimize environmental impact on the surrounding ecosystem. The
concept is being accelerated in the recent years due to increasing awareness about
environmental among the public and consumers (Johnson et al, 1996). The concept is slowly
accepted within the industry that close looping is essential for long term sustainable
production. Nonetheless, when water circuit is closed, concentration build-up of
contaminants especially chlorides and other non-process elements cause problem in process
operation by way of erosion, corrosion and scaling, forcing to purge or develop new systems
to treat contaminants in the wastewater.
RELEVANT SCIENTIFIC CONCEPTUAL INFORMATION
Pulping of the fibrous raw materials involves combination of chemicals and the physical
process conditions (temperature and pressure) that dissolve lignin present in raw material to
liberate cellulosic fibre. The fibres retain its length and strength and sent for further
processing. The dissolved lignin and other organic and inorganic components are washed
counter currently from the pulp, concentrated by evaporation and subsequently burned in the
recovery boiler to generate energy and recover spent chemicals. Up to this stage it is possible

Colour and TDS Removal from ECF Bleach Plant Effluent By TNPL
Development Council (Paper), DoIPP, Govt. of India & IPMA - 3 -
to close loop the process without discharging any wastewater using modern pulping and
washing technology.
Cooked unbleached pulp has a brown, colour, due to presence of residual liginin and other
oxidisable materials and it cannot be used as such for bleached products like printing and
writing paper. Further treatment is necessary to increase the pulp brightness to a white
colour. Residual lignin and other oxidisable material are removed by oxygen delignification
and bleaching with moderate pressures and temperatures. The amount of bleaching chemical
added in the first bleaching stage is directly proportional to the Kappa number of the
unbleached pulp i.e. a low kappa number prior to bleaching results in chemical savings and
reduced organic and inorganic discharge through wastewater from the bleach plant.
However, reduction in pulp yield and pulp strength limits Kappa number to below certain
level (McDonough 1998, Gellerstedt 2009).
Chlorine, Calcium hypochlorite and Sodium hypochlorite are the inexpensive and highly
effective bleaching agent used widely until the 1990s and this technology was phased out due
to high amount of chlorinated organic compounds generated in bleaching collectively
measured as AOX. Chlorine and hypochlorite were also stopped in the pulp bleaching to
avoid chloroform generation and to preserve pulp strength (McKenzie 1994, Pryke and
Reeve 1996, Amec 2008, Gellerstedt 2009)
The modern bleaching sequence commonly known as Elemental Chlorine Free bleaching
(ECF) mainly consists of chlorine dioxide (ClO2), oxygen (O2) and hydrogen peroxide
(H2O2) (Amec, 2008, Gellerstedt 2009) and in some mills Ozone (O3) is also used rarely
(Sonnenberg 1998, Monta and Van Tran 2008). In addition to the above, ECF sequence also
includes alkali stages (E) reinforced with either oxygen (O), or hydrogen peroxide (P), or
both called (EO), (EP) and (EOP) stages (Gellerstedt 2009). Acid (usually sulfuric acid
(H2SO4) is charged to some acidic stages for pH control. The Chlorine dioxide bleaching is
also conducted at higher temperature of around 85 to 90 oC reduces the chemical
consumption and AOX discharge (Ragnar 2005). Chlorine dioxide is the most selective
bleaching agent used in ECF bleaching and to produce pulp with 90% ISO brightness, high

Colour and TDS Removal from ECF Bleach Plant Effluent By TNPL
Development Council (Paper), DoIPP, Govt. of India & IPMA - 4 -
strength, cleanliness, and brightness stability. The content of AOX in the bleach plant
wastewater reduced to 0.2 to 0.4 kg /ADt pulp with a combination of modified cooking,
oxygen delignification and bleaching with ClO2 as the only chlorine-containing chemical.
The environmental effects of bleach plant effluents and whole mill effluents have been
studied by various investigations (Walsh et al., 1991, Ljunggren et al., 1998, Stinchfield and
Woods 1995, Lehtinen and Tina 1998, Deardorrf et al., 1998). The above studies indicate
AOX from that treated wastewater from well-managed pulp and paper mills using ECF
bleaching reduced to minimum level. But colour and Total dissolved solids especially the
inorganic compounds are still an issue in spite of many measures taken to reduce. For
example, Modified or Continuous cooking, oxygen delignification (Fiskari, 2004, Johnson et
al., 2008), ECF bleaching and modified ECF bleaching (Van Tran, 2006, Ragnar 2005),
Ozone bleaching (Monta and Van Tran 2008, Colodette et al., 1998), reuse or recycling of
bleach plant filtrates such as alkaline and acid filtrates (Amec, 2008). Because much of the
technology development associated with kraft mill bleach plant closure for colour and TDS
reduction in wastewater involved reduction of water consumption and reuse and recycling of
bleach plant waste water in side the plant leading to undesirable consequences, such as, scale
deposits, corrosion, loss of bleaching efficiency, increased evaporative loads, reduced
production capacity, and loss of operational flexibility. Amec 2008) these issues have caused
many companies to reconsider the role of complete process closure in minimizing effluent
impacts. In many cases, the optimal solution identified has been partial closure of bleach
plant coupled with external secondary and tertiary treatment of the remaining mill process
effluent (Amec, 2008).
Recent review indicates that combination of physical (microfiltration, Ultrafiltration,
Nanofiltration and Reverse osmosis) coupled with chemical and biological process are found
to be an alternative solution to reduce the colour and TDS in the pulp and paper mill
wastewater especially in bleach plant (Adnan et al., 2010, Dube et al., 2000, Pierre and Eric
R. Hall 2001, Ramamurthy and Wearing 1998, Milestone et al., 2004, Wingate et al., 2004,
Srivastava et al., 2005, Jain et al., 2009). The present study was carried out to have
decentralized treatment system for bleach plant effluent to reduce colour and TDS using

Colour and TDS Removal from ECF Bleach Plant Effluent By TNPL
Development Council (Paper), DoIPP, Govt. of India & IPMA - 5 -
patented process developed by a Central government research laboratory which has been
proved to be successful in removing the colour and organic TDS in effluent in combination
with membrane process to remove the inorganic TDS. The only source of high colour and
high TDS being the bleach plant effluent, treating the selected volume through the dual stage
treatment will result in substantial reduction in colour, TDS and AOX in the final effluent
and also to certain extent reusing this treated effluent in the mill result in water conservation.
BROAD OBJECTIVE OF THE PROJECT:
To develop a method to remove colour and TDS from bleach plant effluent by Patented
process by Central Govt Research agency for industrial effluents – to remove organic TDS
and colour Membrane technology to remove inorganic TDS and reuse of Sodium chemicals.
METHODOLOGY:
• Analysis of Bleach effluent from bleach plant of hardwood and bagasse pulp mill
• Preliminary colour and organic TDS removal using the patented process to determine
the extent of removal and number of passes required
• Evaluation of Membrane technology to assess the removal of inorganic TDS from
pre-treated effluent
• Concentrate handling – recovery of sodium chemicals and process for handling solid
waste.
QUANTIFIED DELIVERABLES OF THE PROJECTS:
• Colour reduction in effluent
• Reduction in AOX in effluent
• Recovery of Sodium chemicals
• Reduction in COD, BOD and TDS in final effluent
• Recycling 100% bleach plant effluent

Colour and TDS Removal from ECF Bleach Plant Effluent By TNPL
Development Council (Paper), DoIPP, Govt. of India & IPMA - 6 -
PILOT PLANT LAY OUT AND DESCRIPTION
Total Capacity of the pilot plant is 1.2 m3/ hr and it is supplied by M/s Vens Marketing,
Chennai. The plant consists of six sections/ modules viz. 1. Pretreatment section, 2. FACCO
reactor, 3. Ozonator, 4.Ultra filtration modules, 5. Reverse Osmosis modules, and 6. Nano
filtration. All the modules are interconnected and have bypass arrangements to take trials
with various combinations by eliminations of one or two sections are modules.
The pretreatment section: It is provided with.1. Raw effluent storage tank having Cap 2000
lit to store the untreated wastewater. 2. Static mixers for mixing chemicals such as Lime and
Ferric chloride with the wastewater. 3. Lime reservoir with 2300lit capacity to store milk of
lime. 4. Lime dosing pump (0 to 100 lit/hr). 5. Dosing pumps to dose FeCl3, Sodium
carbonate and ferrate/fenton (0 to 4 lph). 6. Clarifier 1000 liter capacity to settle the sludge
generated after lime addition. 7. Sludge tank with 2300 liter capacity to store the sludge
drawn from the bottom of the clarifier. 8. Screw pump to pump the sludge to filter press. 9.
Hydraulic type filter press to dewater the sludge for disposal. 10. Mini mixing tank to mix
sodium carbonate. 11. Settling chamber of 2000 liter capacity to settle the calcium carbonate
formed after soda addition. 12. Intermediate tank with 1000 liter capacity to store the
pretreated effluent.
2. FACCO reactor: It is a 25.6 m3 capacity FRP coated tank. Reactor consists of 6000 kg of
stone pebbles, 3 to 50 mm in the bottom of the reactor and 2200 kg of catalyst (a mixture of
Silica, Ferric oxide, Cerium oxide, Copper oxide and Boron oxide) impregnated activated
carbon in the top layer. Distribution arrangement for the uniform flow of wastewater at the
top and bottom of the reactor. Lateral distributors are provided inside the reactor for air
/ozone distribution at the top and bottom of the carbon bed. A strainer is also provided near
the outlet at the top to prevent carryover of carbon with the effluent
3. Ozonator: It generate around 8 gram/hr ozone from air/oxygen and a reactor with ventury
mixer to mix ozone with wastewater and a 5000 liter collection tank to collect the ozonated
wastewater.

Colour and TDS Removal from ECF Bleach Plant Effluent By TNPL
Development Council (Paper), DoIPP, Govt. of India & IPMA - 7 -
4. Ultra filtration modules: The module consists of a bag filter 7"*32" - 5 micron
polypropylene make to remove the suspended solids. Ultrafiltration feed storage tank having
1000 liter capacity. UF module can process up to1000 lit/hr consisting of a PLC system sand
filter, 100µ cartridge filter and UF 100 KD polysulphonate membrane hollow type to remove
the colloidal silica and fine suspended solids.
5. Reverse Osmosis modules: This module consists of 1000 liter RO feed tank and RO
filtration consists of activated carbon filter, 10µ cartridge filter, a high pressure pump (10
bar) and 4" dia*40"long polyamide membrane.
6. Nano filtration: This module consists Nano feed tank of 1000 liter capacity to store RO
reject and Nano filtration unit consists of a sand filter, activated carbon filter and iron filter as
a premodule. Then a 10µ cartridge filter, high pressure pump (10 bar) and 4" dia * 40" long
Nano membrane to separate the monovalent and divalent salts and a 1000 liter capacity
rejects tank.
RESULTS
PART – I : Treatment of Hard wood ECF EOP filtrate
Pretreatment with Lime and Ferric chloride: The Pilot plant was commissioned on 12.07.09
and initially bleach plant alkaline filtrate from EOP stage was taken for the study. The EOP
effluent was treated with lime and ferric chloride and mixed thoroughly with static mixer and
send to Clarifier to remove sludge containing colloidal silica, heavy metals and some
organics. The overflow was collected in a 1000 lit intermediate tank. The pH after lime
treatment was 11.0. A marginal reduction in COD and Colour was observed. The effluent
was then passed through a 5 micron Polypropylene bag filter, to remove the suspended
solids.

Colour and TDS Removal from ECF Bleach Plant Effluent By TNPL
Development Council (Paper), DoIPP, Govt. of India & IPMA - 8 -
Treatment with FACCO Reactor: Ferrate (a mixture of 75 ppm each of Ferric nitrate and
Sodium hypochlorite) was dosed as Oxidising agent online and the wastewater was send to
FACCO reactor (Fenton activated carbon catalytic oxidation) in upward flow mode @1500
lit/hr, to remove Colour and COD. FACCO process consists of two stages; first stage is to
breakdown dissolved organics and in the second stage oxidation of organics takes place at the
active sites of the carbon-silicon mesoporous catalyst using stoichiometric quantity of
oxygen abstracted from air at ambient temperature and pressure. This process does not
generate any sludge. The hydraulic retention time in the reactor was about 16 hours. The
chemical reaction in the reactor is as follows where hydroxyl radical is the active species for
catalytic oxidation
Fe(NO3)2+ HOCl → OH.+RH +OOH.→ CO2 + H2O
The COD was initially found to reduce from 1830 to 346 ppm (81 %) and Colour from 600
to 90 ppm (85.0 %). The entire process was run continuously for ten days. The out let of the
FACCO was treated in the ozonator with 16 ppm ozone charge to reduce the COD further.
The COD came down to 160 ppm (TABLE - 1). An increase in COD and Colour was
observed after the tenth day (550 to 1196) in the FACCO outlet. This is due to the presence
of refractory organics in the effluent and saturation of the carbon bed in the reactor. When
COD was above 400 ppm, the pumping of effluent to UF unit was stopped to prevent fouling
of membrane.
The study was continued with various chemical dosage and flow rates. Raw EOP pH was
ranging from 9.5 to 10.5 after lime addition pH was increased to 10.5 to 11.0. Treated
wastewater was then neutralised with acid to around 7 to 7.5 pH. The results are presented in
TABLE 1, 2, 3, 4, 5 & 6. BOD reduced from 573 to 200 ppm (60 %).The average reduction
in COD and Colour was 58 %.The settled sludge from the Clarifier was drained once in 4
hours and analysed for its composition and results are presented in TABLE 7. The sludge
after lime treatment contains more organics and calcium and it is suitable for use in Cement
plant

Colour and TDS Removal from ECF Bleach Plant Effluent By TNPL
Development Council (Paper), DoIPP, Govt. of India & IPMA - 9 -
TABLE - 1: Results of HW EOP filtrate Lime and ferric chloride pretreatment
S. No Parameter Units Raw EOP effluent
Lime-FeCl3 treated
effluent
1 pH 10.1 11.2
2 Colour mg/lit 850 670
3 COD mg/lit 1850 1640
4 Total hardness as CaCO3
mg/lit 120 60
5 Calcium as CaCO3
mg/lit 80 50
6 Magnesium as CaCO3
mg/lit 40 10
7 TDS mg/lit 4400 4950
8 Sodium as Na mg/lit 1400 1340
9 Sulphates as SO4
mg/lit 220 230
10 Chlorides as cl- mg/lit 200 210
11 Silica mg/lit 40 18

Colour and TDS Removal from ECF Bleach Plant Effluent By TNPL
Development Council (Paper), DoIPP, Govt. of India & IPMA - 10 -
TABLE – 2: Results of HW ECF EOP wastewater, after pretreatment -FACCO up-flow
treatment (1000 to 1200 lit/hr flow) with 1000 ppm Lime and Oxidizing agent (Ferric
chloride 80 ppm and: Ferric Nitrate & Sodium Hypochlorite 75 ppm), COD reduction
index:0.70 gm /gm of carbon / hr.
Date
Raw WW
Treated WW
Raw WW
Treated WW
Reduction
Raw WW
Treated WW
Reduction
Ozone Treated
WW
pH pH Colour, ppm
Colour, ppm
% CODppm
COD ppm
% COD
12.7.09 7.8 3.8 370 0 100 1240 226 81.8 168
12.7.09 8 3.5 380 0 100 1320 238 82.0 158
16.7.09 7.6 4.8 460 0 100 1780 280 84.3
17.7.09 7.5 5.1 620 40 93.5 2163 230 89.4
18.7.09 7.1 5.4 680 80 88.2 2341 270 88.5
21.7.09 7.7 5.6 750 90 88.0 2214 334 84.9
21.7.09 7.8 5.5 820 120 85.4 2170 318 85.3 142
22.7.09 7.5 5.8 820 170 79.3 2320 418 82.0
22.7.09 7.9 5.2 830 220 73.5 2208 428 80.5
22.7.09 8 6.2 820 220 59.5 2420 465 80.2 168
AVG 7.7
5.0 600 90 85.0 1830 346 81.1

Colour and TDS Removal from ECF Bleach Plant Effluent By TNPL
Development Council (Paper), DoIPP, Govt. of India & IPMA - 11 -
TABLE – 3: Results of HW ECF EOP wastewater FACCO up-flow treatment (800 to 1000
lit/hr flow) with 800 ppm Lime and Oxidizing agent(Ferric chloride 100 ppm and: Ferric
Nitrate & Sodium Hypochlorite 75 ppm), COD reduction index:0.47 gm /gm of carbon / hr.
Date
Raw WW
Treated WW
Raw WW
Treated WW
Reduction
Raw WW
Treated WW Reduction
pH pH Colour, ppm
Colour, ppm
% CODppm
COD ppm
%
3.8.09 8.5 4.9 800 560 45.0 1750 929 46.9
4.8.09 8.2 5.2 780 540 34.6 1984 1131 43.0
8.8.09 8.6 7.8 810 530 34.5 1942 928 52.2
10.8.09 8.6 7.5 850 550 35.3 1912 872 54.4
11.8.09 7.8 7.4 920 500 45.7 1835 999 45.6
12.8.09 7.9 7.2 870 420 51.7 1903 1242 34.7
13.8.09 8.2 6.9 870 420 51.7 2519 1162 53.9
14.8.09 8.1 6.9 1000 650 35.0 2195 1260 42.6
AVG 8.2 6.1 900 510 43.3 2090 1065 49.0 Average BOD of raw wastewater was 573 ppm & Treated and treated 200 ppm and the
average percentage BOD reduction was 60.3.
Colour and TDS Removal from ECF Bleach Plant Effluent By TNPL
Development Council (Paper), DoIPP, Govt. of India & IPMA - 12 -
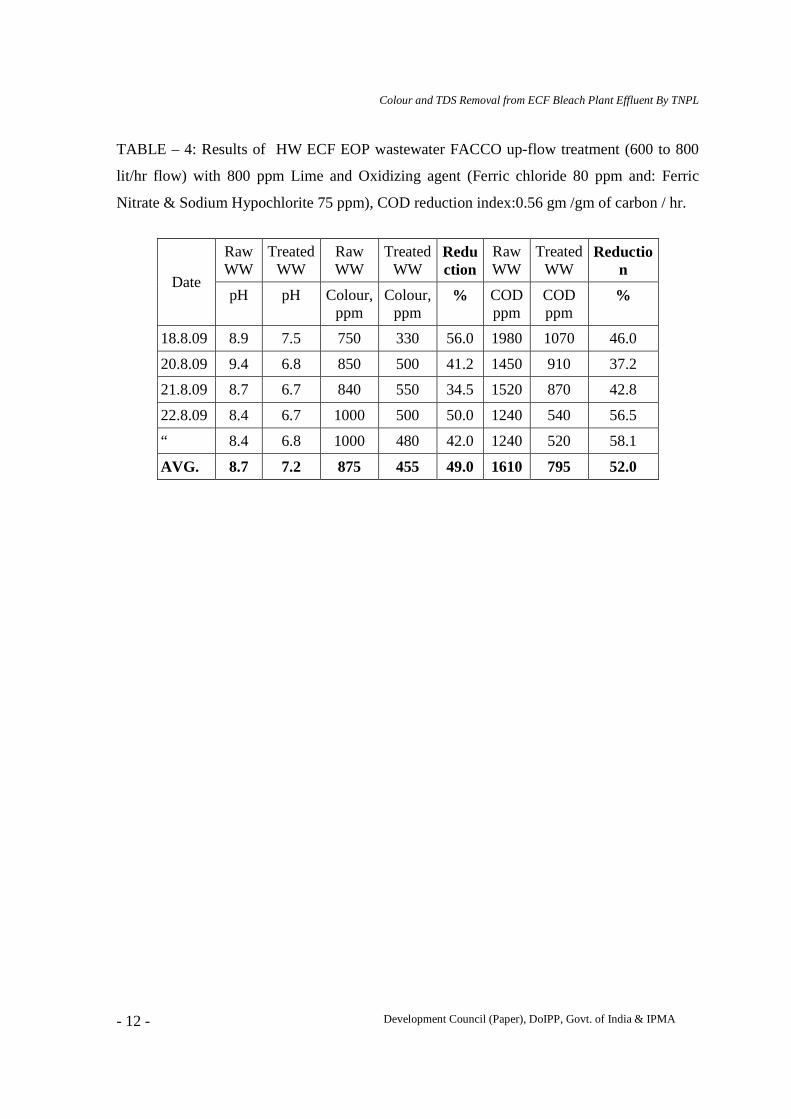
TABLE – 4: Results of HW ECF EOP wastewater FACCO up-flow treatment (600 to 800
lit/hr flow) with 800 ppm Lime and Oxidizing agent (Ferric chloride 80 ppm and: Ferric
Nitrate & Sodium Hypochlorite 75 ppm), COD reduction index:0.56 gm /gm of carbon / hr.
Date
Raw WW
Treated WW
Raw WW
Treated WW
Reduction
Raw WW
Treated WW
Reduction
pH pH Colour, ppm
Colour, ppm
% CODppm
COD ppm
%
18.8.09 8.9 7.5 750 330 56.0 1980 1070 46.0
20.8.09 9.4 6.8 850 500 41.2 1450 910 37.2
21.8.09 8.7 6.7 840 550 34.5 1520 870 42.8
22.8.09 8.4 6.7 1000 500 50.0 1240 540 56.5
“ 8.4 6.8 1000 480 42.0 1240 520 58.1
AVG. 8.7 7.2 875 455 49.0 1610 795 52.0

Colour and TDS Removal from ECF Bleach Plant Effluent By TNPL
Development Council (Paper), DoIPP, Govt. of India & IPMA - 13 -
TABLE - 5: Results of HW ECF EOP wastewater FACCO up-flow treatment (600 to 800
lit/hr flow) with 1000 ppm Lime and Oxidizing agent (Ferric chloride 100 ppm and: Ferric
Nitrate & Sodium Hypochlorite 75 ppm), COD reduction index:0.51 gm /gm of carbon / hr
Date Raw WW
Treated WW
Raw WW
Treated WW
Reduction
Raw WW
Treated WW
Reduction
pH pH Colour, ppm
Colour, ppm
% COD ppm
COD ppm
%
24.8.09 8.7 7.0 1000 520 48.0 1260 400 58.3
25.8.09 8.3 6.8 940 330 64.9 1060 504 52.5
920 420 54.3 1135 538 52.6
26.8.09 9.2 7.0 1000 250 75.0 1950 520 73.3
1050 310 70.5 1960 455 76.8
27.8.09 9.3 7.1 1120 280 75.0 1710 455 73.4
1150 240 79.1 1748 358 79.5
28.8.09 9.7 7.2 1080 260 75.9 1932 494 74.4
1160 280 75.9 1980 494 75.1
29.8.09 8.8 6.8 960 290 69.8 1653 622 62.4
920 310 66.3 1733 690 60.2
AVG. 8.7 7.0 960 320 66.7 1646 545 66.8
Colour and TDS Removal from ECF Bleach Plant Effluent By TNPL
Development Council (Paper), DoIPP, Govt. of India & IPMA - 14 -
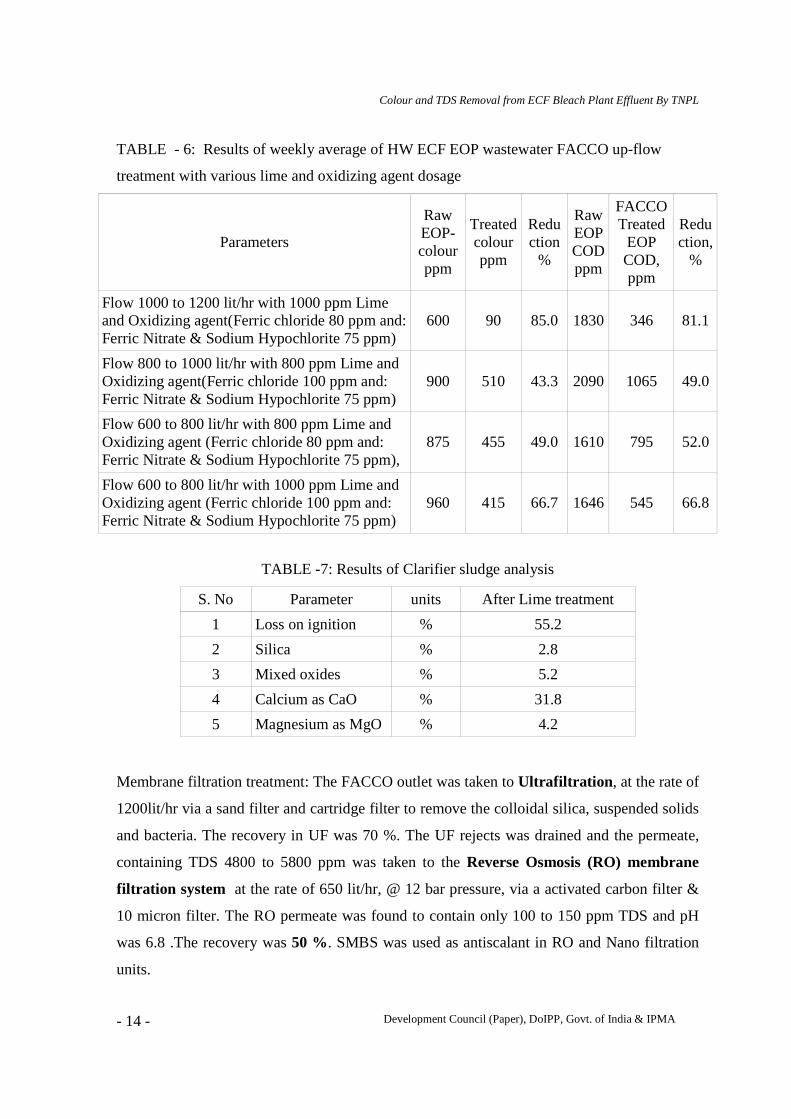
TABLE - 6: Results of weekly average of HW ECF EOP wastewater FACCO up-flow
treatment with various lime and oxidizing agent dosage
Parameters
Raw EOP-colour ppm
Treated colour ppm
Reduction
%
Raw EOP COD ppm
FACCO Treated
EOP COD, ppm
Reduction,
%
Flow 1000 to 1200 lit/hr with 1000 ppm Lime and Oxidizing agent(Ferric chloride 80 ppm and: Ferric Nitrate & Sodium Hypochlorite 75 ppm)
600 90 85.0 1830 346 81.1
Flow 800 to 1000 lit/hr with 800 ppm Lime and Oxidizing agent(Ferric chloride 100 ppm and: Ferric Nitrate & Sodium Hypochlorite 75 ppm)
900 510 43.3 2090 1065 49.0
Flow 600 to 800 lit/hr with 800 ppm Lime and Oxidizing agent (Ferric chloride 80 ppm and: Ferric Nitrate & Sodium Hypochlorite 75 ppm),
875 455 49.0 1610 795 52.0
Flow 600 to 800 lit/hr with 1000 ppm Lime and Oxidizing agent (Ferric chloride 100 ppm and: Ferric Nitrate & Sodium Hypochlorite 75 ppm)
960 415 66.7 1646 545 66.8
TABLE -7: Results of Clarifier sludge analysis
S. No Parameter units After Lime treatment
1 Loss on ignition % 55.2
2 Silica % 2.8
3 Mixed oxides % 5.2
4 Calcium as CaO % 31.8
5 Magnesium as MgO % 4.2 Membrane filtration treatment: The FACCO outlet was taken to Ultrafiltration , at the rate of
1200lit/hr via a sand filter and cartridge filter to remove the colloidal silica, suspended solids
and bacteria. The recovery in UF was 70 %. The UF rejects was drained and the permeate,
containing TDS 4800 to 5800 ppm was taken to the Reverse Osmosis (RO) membrane
filtration system at the rate of 650 lit/hr, @ 12 bar pressure, via a activated carbon filter &
10 micron filter. The RO permeate was found to contain only 100 to 150 ppm TDS and pH
was 6.8 .The recovery was 50 %. SMBS was used as antiscalant in RO and Nano filtration
units.

Colour and TDS Removal from ECF Bleach Plant Effluent By TNPL
Development Council (Paper), DoIPP, Govt. of India & IPMA - 15 -
Nano filtration
The RO rejects was passed through Sand filter, Activated carbon filter and Iron filter (filled
with MnO2 beads and green sand to remove dissolved iron) @ 650 lit/hr, passed through a 10
micron cartridge filter, pumped with a high pressure pump, at a feed pressure of 10 kg/cm2 to
the Nano membrane (MW >250 dalton) to remove the inorganic salts and COD. The Nano
membrane with a negatively charged polymer film which rejects ions with higher charge
density, such as, SO4. The permeate @ 100 lit/hr, containing water with monovalent ions was
collected in the Nano permeate tank. The rejects @ 500 lit/hr was collected in the Rejects
tank. The rejects contained more sulphates and sodium.
TABLE - 8: Results of membrane filtration treatment Reverse Osmosis (Average of three
trials)
S. No Parameter units RO feed RO permeate RO rejects
Flow lit/hr 650 320 330
1 pH 7.8 7.3 7.8
2 Colour mg/lit 80 0 150
3 COD mg/lit 168 0 280
4 Total hardness as CaCO3
mg/lit 110 0 190
5 Calcium as CaCO3
mg/lit 70 0 120
6 Magnesium as CaCO3
mg/lit 40 0 70
7 TDS mg/lit 5600 150 10840
8 Sodium as Na mg/lit 1360 50 2620
9 Sulphates as SO4 mg/lit 230 0 420
10 Chlorides as cl- mg/lit 210 0 380

Colour and TDS Removal from ECF Bleach Plant Effluent By TNPL
Development Council (Paper), DoIPP, Govt. of India & IPMA - 16 -
TABLE - 9: Results of NANO filtration treatment (Average of three trials)
S. No Parameter units Nano feed
Nano permeate
Nano rejects
Flow lit/hr 600 100 500
1 pH 7.8 7.5 7.9
2 Colour mg/lit 150 40 260
3 COD mg/lit 280 120 304
4 Total hardness as CaCO3
mg/lit 190 60 260
5 Calcium as CaCO3
mg/lit 120 40 200
6 Magnesium as CaCO3
mg/lit 70 20 60
7 TDS mg/lit 10640 5230 11680
8 Sodium as Na mg/lit 2620 8410 1460
9 Sulphates as SO4
mg/lit 420 120 480
10 Chlorides as cl- mg/lit 380 160 410
Conclusion
1. The Colour and COD reduction was achieved to the level of 80 to 85 % in the first ten
days. The rate of COD reduction was 0.70 mg of COD / gm of carbon/hr of activated
carbon in the FACCO reactor.
2. Due to the high sodium content (1400 ppm) and the refractory nature of the low
molecular lignin compounds and saturation of the catalyst, the reduction has
decreased in the subsequent trials to 40 to 50 %; COD reduction index was 0.47
mg/gm of carbon/hr. The COD reduction was slightly improved to 55% with increase
of Ferrate dosage to 100 ppm.
3. The reduction was further improved to 60% by further optimization of flow (600 to
800 lit/hr) and with Fenton.
Colour and TDS Removal from ECF Bleach Plant Effluent By TNPL
Development Council (Paper), DoIPP, Govt. of India & IPMA - 17 -
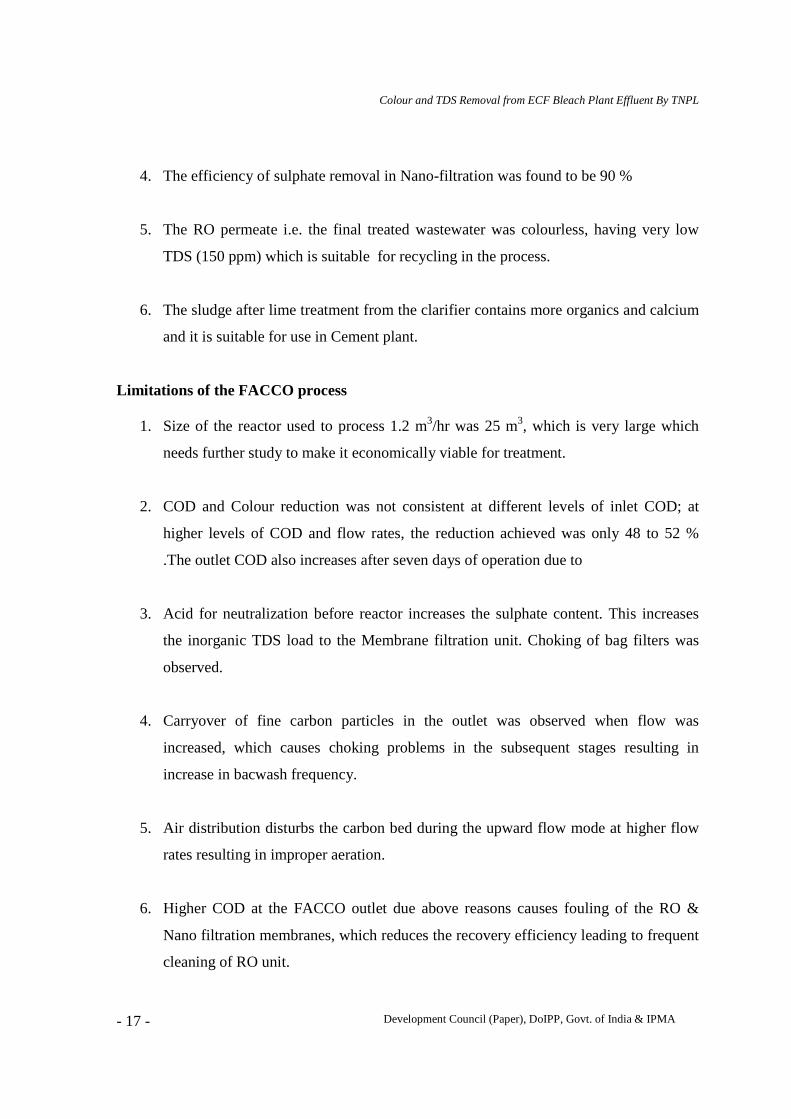
4. The efficiency of sulphate removal in Nano-filtration was found to be 90 %
5. The RO permeate i.e. the final treated wastewater was colourless, having very low
TDS (150 ppm) which is suitable for recycling in the process.
6. The sludge after lime treatment from the clarifier contains more organics and calcium
and it is suitable for use in Cement plant.
Limitations of the FACCO process
1. Size of the reactor used to process 1.2 m3/hr was 25 m3, which is very large which
needs further study to make it economically viable for treatment.
2. COD and Colour reduction was not consistent at different levels of inlet COD; at
higher levels of COD and flow rates, the reduction achieved was only 48 to 52 %
.The outlet COD also increases after seven days of operation due to
3. Acid for neutralization before reactor increases the sulphate content. This increases
the inorganic TDS load to the Membrane filtration unit. Choking of bag filters was
observed.
4. Carryover of fine carbon particles in the outlet was observed when flow was
increased, which causes choking problems in the subsequent stages resulting in
increase in bacwash frequency.
5. Air distribution disturbs the carbon bed during the upward flow mode at higher flow
rates resulting in improper aeration.
6. Higher COD at the FACCO outlet due above reasons causes fouling of the RO &
Nano filtration membranes, which reduces the recovery efficiency leading to frequent
cleaning of RO unit.

Colour and TDS Removal from ECF Bleach Plant Effluent By TNPL
Development Council (Paper), DoIPP, Govt. of India & IPMA - 18 -
HW – EOP filtrate effluent treatment
PILOT PLANT TRIAL (WITH FACCO REACTOR)
12.07.09 - 22.07.09 03.08.09 - 14.08.09 18.08.09 - 22.08.09 24.08.09 - 29.08.09`
0
200
400
600
800
1000
1200
600
900 875
960
90
510455
415
8543.3 49 66.7
Raw Effluent ColourTreated ColourColour Reduction
Trial Period
Co
lour
,ppm
12.07.09 - 22.07.09 03.08.09 - 14.08.09 18.08.09 - 22.08.09 24.08.09 - 29.08.09
0
500
1000
1500
2000
2500
1830
2090
1610
1347
346
1065
795
545
81.1 49 52 66.8
Raw Effluent CODTreated Effluent CODCOD Reduction
Trial Period
CO
D,p
pm

Colour and TDS Removal from ECF Bleach Plant Effluent By TNPL
Development Council (Paper), DoIPP, Govt. of India & IPMA - 19 -
PART – II: Treatment of Hard wood ECF DHT filtrate Lime-Soda Treatment: The DHT filtrate @ 750 lit/hr, from HW ECF plant was cooled,
treated with lime in a Clarifier to precipitate the Magnesium salts, colloidal silica and some
of the organics. The pH after treatment was ranging from 11.0 to 11.5. The sludge contains
organics and inorganic salts and found to be suitable for use in Cement plant. The overflow
goes to the second stage, where it is treated with soda (Na2CO3) and allowed to settle in a
settling tank to precipitate the Calcium salts as CaCO3. The results are shown in TABLE 10.
The settled sludge can be used in SRP lime kiln to produce lime. Results of sludge analysis
from clarifier after lime treatment and settling tank after soda treatment is presented in the
TABLE 11 and 12 and it mostly contains organics and calcium carbonate. Lime soda
treatment reduces hardness and COD to a level by 30 %, but TDS and Sodium levels are
increased. The pH is then adjusted to 3.5 to 4.0(for FACCO) using dilute Sulphuric acid,
which also reduces the alkalinity.
TABLE – 10: Results of Lime soda treatment of DHT wastewater
S. No Parameter units Raw DHT
effluent Lime-soda
treated effluent
1 pH 2.2 11.6
2 Colour mg/lit 550 270
3 COD mg/lit 2300 1740
4 Total hardness as CaCO3 mg/lit 1720 120
5 Calcium as CaCO3 mg/lit 1480 80
6 Magnesium as CaCO3 mg/lit 240 40
7 TDS mg/lit 9370 11300
8 Sodium as Na mg/lit 1800 4600
9 Sulphates as SO4 mg/lit 3170 4570
10 Chlorides as cl- mg/lit 1560 1540
The main advantage of Lime-Soda treatment is removal of colloidal silica, heavy metals,
suspended solids, portion of organics, reduction of colour to about 50%, reduction of COD
25% and removal of total hardness. The sludge generated contains mostly Calcium
carbonate, silica and Magnesium hydroxide and can be used for cement plant or SRP. The

Colour and TDS Removal from ECF Bleach Plant Effluent By TNPL
Development Council (Paper), DoIPP, Govt. of India & IPMA - 20 -
softened effluent contains only Sodium sulphates and Chlorides and it is easier to separate by
Membrane filtration.
The main Disadvantages are increase in TDS level by 2000 ppm and Sodium level by 1500
ppm. Also the addition of H2SO4 to reduce the alkalinity before FACCO increase the
Sulphate level from 1400 to 3000 ppm and high chemical cost of treatment.
TABLE -11: Results of sludge analysis from clarifier after lime treatment and settling tank
after soda treatment
S. No Parameter units After Lime treatment
After soda treatment
1 Loss on ignition % 53.3 42.5
2 Silica % 5.4 0.5
3 Mixed oxides % 2.9 0.2
4 Calcium as CaO % 31.8 *53.6
5 Magnesium as MgO % 2.6 0.2
6 Sodium as Na2O % 1.2 2.4
* 95.7 % as CaCO3
TABLE – 12: Particle size analysis sludge generated during lime soda treatment
S. No Parameter units After Lime treatment
After soda treatment
1 Settling time mts 45 30
2 Sludge volume index ml/g 136 2.11
3 Mean particle size - HORIBA particle size analyser
µm 21 38.6
4 Particle size range µm 0-45 0-66
The Lime -soda treated effluent is neutralised with diluted Sulphuric acid, (@1500 ppm) to
reduce the pH to 3.5,at which fenton works effectively, and collected in an Intermediate tank
and send to FACCO reactor, for treatment.
Colour and TDS Removal from ECF Bleach Plant Effluent By TNPL
Development Council (Paper), DoIPP, Govt. of India & IPMA - 21 -
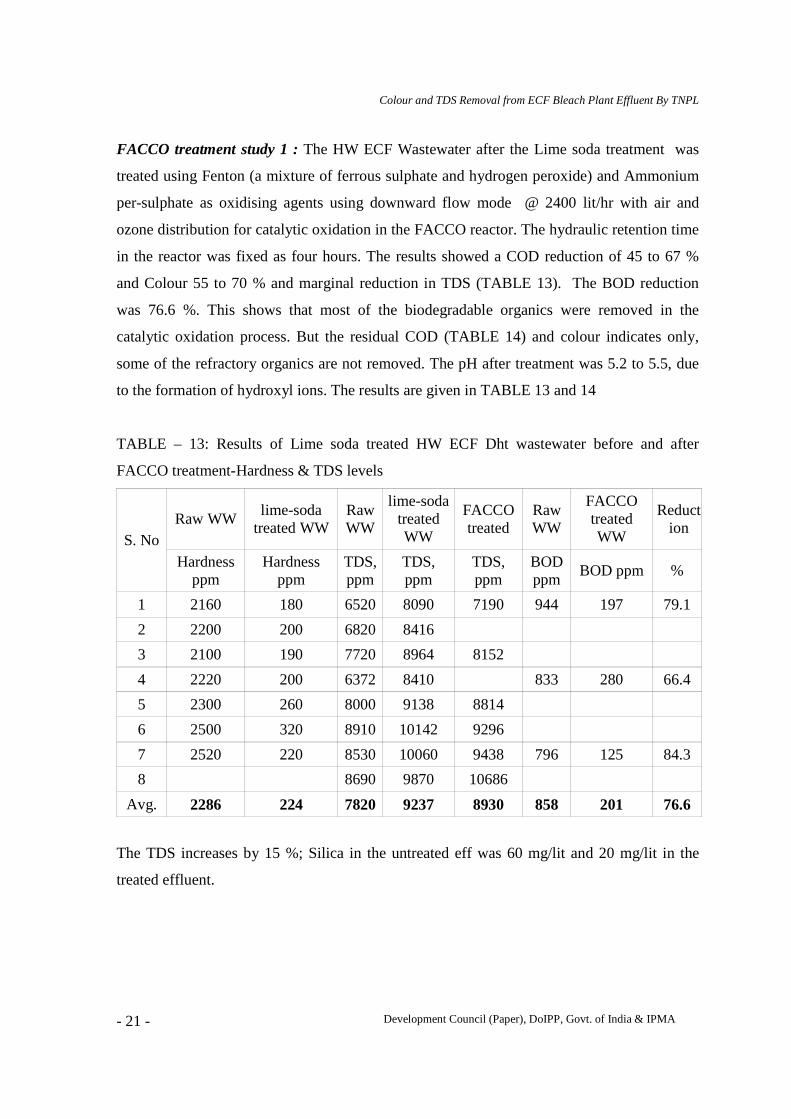
FACCO treatment study 1 : The HW ECF Wastewater after the Lime soda treatment was
treated using Fenton (a mixture of ferrous sulphate and hydrogen peroxide) and Ammonium
per-sulphate as oxidising agents using downward flow mode @ 2400 lit/hr with air and
ozone distribution for catalytic oxidation in the FACCO reactor. The hydraulic retention time
in the reactor was fixed as four hours. The results showed a COD reduction of 45 to 67 %
and Colour 55 to 70 % and marginal reduction in TDS (TABLE 13). The BOD reduction
was 76.6 %. This shows that most of the biodegradable organics were removed in the
catalytic oxidation process. But the residual COD (TABLE 14) and colour indicates only,
some of the refractory organics are not removed. The pH after treatment was 5.2 to 5.5, due
to the formation of hydroxyl ions. The results are given in TABLE 13 and 14
TABLE – 13: Results of Lime soda treated HW ECF Dht wastewater before and after
FACCO treatment-Hardness & TDS levels
S. No Raw WW
lime-soda treated WW
Raw WW
lime-soda treated WW
FACCO treated
Raw WW
FACCO treated WW
Reduction
Hardness ppm
Hardness ppm
TDS, ppm
TDS, ppm
TDS, ppm
BOD ppm
BOD ppm %
1 2160 180 6520 8090 7190 944 197 79.1
2 2200 200 6820 8416
3 2100 190 7720 8964 8152
4 2220 200 6372 8410 833 280 66.4
5 2300 260 8000 9138 8814
6 2500 320 8910 10142 9296
7 2520 220 8530 10060 9438 796 125 84.3
8 8690 9870 10686
Avg. 2286 224 7820 9237 8930 858 201 76.6
The TDS increases by 15 %; Silica in the untreated eff was 60 mg/lit and 20 mg/lit in the
treated effluent.

Colour and TDS Removal from ECF Bleach Plant Effluent By TNPL
Development Council (Paper), DoIPP, Govt. of India & IPMA - 22 -
TABLE -14: Impact of FACCO treatment on colour and COD on Lime soda treated HW
ECF wastewater.
Date Raw WW Treated WW Reduction Raw WW Treated WW Reduction
Colour, ppm Colour, ppm % COD Ppm
COD ppm %
12.9.09 460 220 52.2 1602 700 56.3
12.9.09 480 210 56.3 1684 810 51.9
13.9.09 480 180 62.5 1702 1150 32.4
14.9.09 490 160 67.3 2430 1400 42.4
18.9.09 460 180 60.9 2100 1040 50.5
19.9.09 510 300 41.1 2080 880 57.7
AVG. 480 210 56.3 1930 996 48.4
FACCO treatment study 2: The flow of effluent to FACCO reactor was kept @2400 lit/hr
and Fenton dosage (FeSO4 100 ppm and H2O2 60 ppm) and Ammonium persulphate (100
ppm) was increased to improve the reduction efficiency with air and ozone at 4 ppm
distribution at the bottom of the reactor. The reactor performance was found to improve
slightly. The COD reduction was found to be around 56 % (i.e. from 1807 to 810 ppm) and
colour by 60 % (i.e. from 535 to 213 ppm) with a marginal reduction in TDS level. The COD
reduction index across the reactor is 0.75 mg of COD /gm of carbon / hr. The Peroxy
monosulphate ion HSO5- from Ammonium persulphate, having higher oxidation potential
than OH-, is an effective oxidising agent and found to degrade the refractory organics in the
acidic effluent.The pH after treatment was 5.5 to 6.0; The results are given in TABLE 15.

Colour and TDS Removal from ECF Bleach Plant Effluent By TNPL
Development Council (Paper), DoIPP, Govt. of India & IPMA - 23 -
TABLE – 15: Results of FACCO treatment study 2 Date Raw WW Treated WW Reduction Raw WW Treated WW Reduction
Colour, ppm Colour, ppm % COD ppm COD ppm %
1.10.09 520 200 61.5 1443 586 59.4
520 220 57.7 1443 453 68.6
2.10.09 560 180 67.9 1866 853 54.3
540 200 63.0 1813 720 60.3
5.10.09 540 210 61.1 1840 906 50.3
540 220 59.3 1840 852 53.7
6.10.09 530 300 43.4 2106 1120 46.8
530 210 67.9 2106 986 53.2
Avg. 535 213 60.2 1807 810 56.0
FACCO treatment study 3: The FACCO reactor performance was reviewed after second
experiment and the chemical dosage was increased with Fenton (FeSO4 100 ppm and H2O2
75 ppm) and Ammonium persulphate (120 ppm) to improve the reduction efficiency with
same wastewater flow rate @2400lit/hr, air and ozone (4 ppm) distribution at the bottom.
FACCO reactor performance was found to improve further with COD reduced by 72 %
(From 2020 to 573 ppm ) and colour by 78 % ( from 440 to 98 ppm ) with marginal
reduction in TDS level. The COD reduction index across the reactor is 1.17 mg of COD /gm
of carbon / hr which is fairly good. The BOD reduction was 76.6 % (from 850 to 201
ppm).The pH after treatment was 5.2 to 5.6, The results are presented in TABLE 16.

Colour and TDS Removal from ECF Bleach Plant Effluent By TNPL
Development Council (Paper), DoIPP, Govt. of India & IPMA - 24 -
TABLE – 16: Results of FACCO treatment study 3
Date Raw WW Treated WW Reduction Raw WW Treated WW Reduction
Colour, ppm
Colour, ppm % COD ppm
COD Ppm
%
8.10.09 500 100 80.0 1760 453 74.3
9.10.09 450 170 62.2 1973 560 71.6
10.10.09 420 130 69.0 2053 586 71.5
12.10.09 440 70 84.1 2133 640 70.0
13.10.09 400 60 86.4 2120 613 71.1
13.10.09 85.0 2080 586 71.8
Avg 442 98 77.8 2020 573 71.7
Raw wastewater BOD 858 ppm and treated wastewater BOD 201 ppm FACCO treatment study 4: The DHT effluent without Lime-Soda treatment was treated with
Fenton (FeSO4 100 ppm and H2O2 75 ppm) and Ammonium persulphate (120 ppm) with
downward flow of @2400lit/ hr along with air and ozone distribution in FACCO reactor for
catalytic oxidation. The COD was reduced by 67 % (From 1928 to 638 ppm) and colour by
68 % (From 450 to 140 ppm) in the outlet and only a marginal reduction in TDS level. The
COD reduction index across the reactor was 1.41 mg of COD /gm of carbon / hr. The pH
increased to 6.4, due to the formation of hydroxyl ions during the process. The results are
given in TABLE 16.
TABLE – 16: Results of FACCO treatment study 4
Date Raw WW Treated WW Reduction Raw WW Treated WW Reduction
Colour, ppm
Colour, ppm % COD ppm
COD ppm %
14.10.09 360 140 61.1 2024 556 72.5
15.10.09 500 190 62.0 1739 435 75.0
19.10.09 520 110 78.5 1870 710 62.0
20.10.09 420 120 71.4 2080 850 59.1
Avg. 450 140 68.3 1928 638 67.2

Colour and TDS Removal from ECF Bleach Plant Effluent By TNPL
Development Council (Paper), DoIPP, Govt. of India & IPMA - 25 -
FACCO treatment study 5 ( recycling) : The FACCO treated effluent was collected in a
storage tank of 5000 lit cap and re-circulated through the FACCO reactor with additional
Fenton dosage to study the impact of recycling. The COD was found to reduce from 850 to
450 ppm (47 %) in the first cycle and from 450 to 320 ppm (28 %) in the second cycle and
the color reduced to 80 ppm from 120 ppm. The results are given in TABLE 17
TABLE – 17: Results of FACCO treatment study 5
Date Raw WW Treated WW Reduction Raw WW Treated WW Reduction
Colour, ppm
Colour, ppm % COD ppm
COD ppm
%
21.10.09 120 120 0 850 573 32.6
22.10.09 120 90 25.0 850 514 39.5
22.10.09 120 85 29.2 850 455 46.5
23.10.09 120 80 33.3 455 320 28.8
FACCO treatment study 6 (without Ammonium persulphate) : The progress was reviewed
along with CLRI personnel. The overall reduction of COD & Colour was 84 % with
recycling and decided to increase the dosage levels of Fenton, without the use of Ammonium
persulphate. Further studies are also underway to study the effect of flow rate, Ozone dosage
levels and chemical dosage. Fenton dosage was increased (FeSO4 150 ppm and H2O2 150
ppm) without Ammonium persulphate to improve the reduction efficiency. Wastewater flow
rate, after lime-soda treatment was fixed @2400lit/hr to FACCO inlet with air and ozone (4
ppm) distribution at the bottom of the reactor. FACCO reactor performance was studied for
about a week. COD was reduced by 57 % (from 1971 to 854 and Colour by 53 % (from 460
to 223) with only a marginal reduction in TDS level. The COD reduction index across the
reactor is 0.73 mg of COD / gm of carbon / hr, which is comparatively lesser than with
Ammonium persulphate treatment. The pH increased to 6.2, due to the formation of hydroxyl
ions during the process. The results are tabulated in TABLE 18
Colour and TDS Removal from ECF Bleach Plant Effluent By TNPL
Development Council (Paper), DoIPP, Govt. of India & IPMA - 26 -
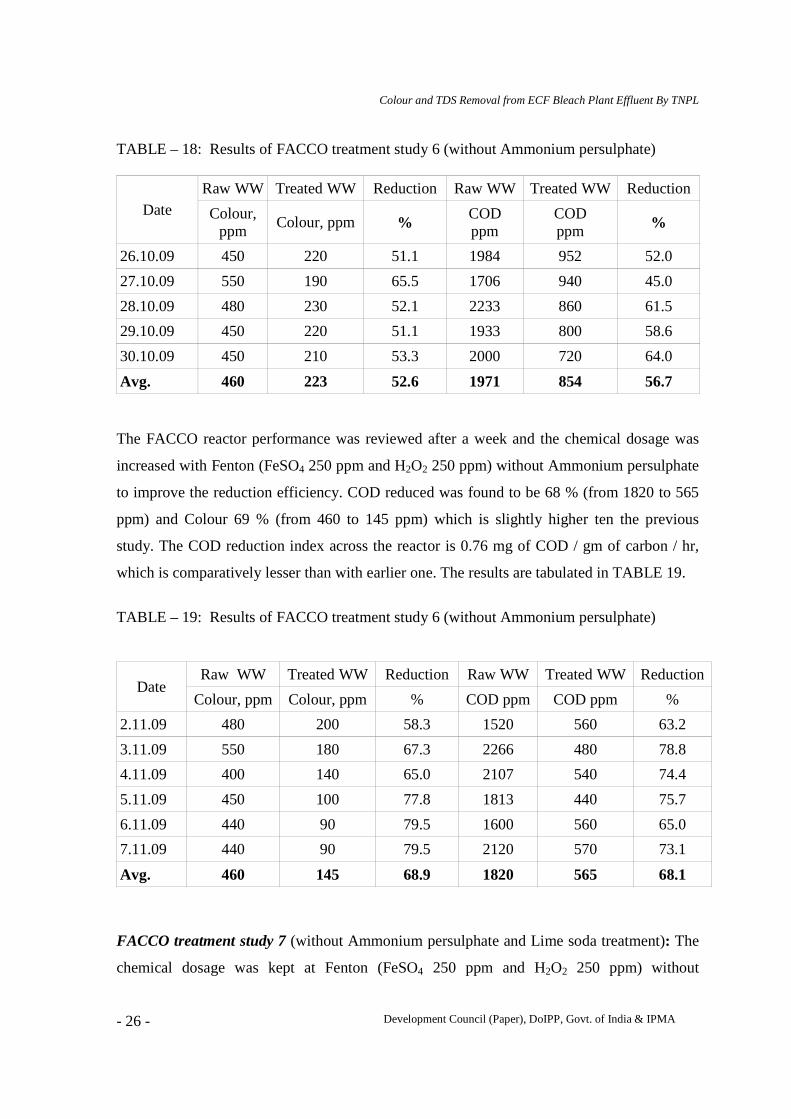
TABLE – 18: Results of FACCO treatment study 6 (without Ammonium persulphate)
Date Raw WW Treated WW Reduction Raw WW Treated WW Reduction
Colour, ppm
Colour, ppm % COD ppm
COD ppm %
26.10.09 450 220 51.1 1984 952 52.0
27.10.09 550 190 65.5 1706 940 45.0
28.10.09 480 230 52.1 2233 860 61.5
29.10.09 450 220 51.1 1933 800 58.6
30.10.09 450 210 53.3 2000 720 64.0
Avg. 460 223 52.6 1971 854 56.7 The FACCO reactor performance was reviewed after a week and the chemical dosage was
increased with Fenton (FeSO4 250 ppm and H2O2 250 ppm) without Ammonium persulphate
to improve the reduction efficiency. COD reduced was found to be 68 % (from 1820 to 565
ppm) and Colour 69 % (from 460 to 145 ppm) which is slightly higher ten the previous
study. The COD reduction index across the reactor is 0.76 mg of COD / gm of carbon / hr,
which is comparatively lesser than with earlier one. The results are tabulated in TABLE 19.
TABLE – 19: Results of FACCO treatment study 6 (without Ammonium persulphate)
Date Raw WW Treated WW Reduction Raw WW Treated WW Reduction
Colour, ppm Colour, ppm % COD ppm COD ppm %
2.11.09 480 200 58.3 1520 560 63.2
3.11.09 550 180 67.3 2266 480 78.8
4.11.09 400 140 65.0 2107 540 74.4
5.11.09 450 100 77.8 1813 440 75.7
6.11.09 440 90 79.5 1600 560 65.0
7.11.09 440 90 79.5 2120 570 73.1
Avg. 460 145 68.9 1820 565 68.1
FACCO treatment study 7 (without Ammonium persulphate and Lime soda treatment): The
chemical dosage was kept at Fenton (FeSO4 250 ppm and H2O2 250 ppm) without

Colour and TDS Removal from ECF Bleach Plant Effluent By TNPL
Development Council (Paper), DoIPP, Govt. of India & IPMA - 27 -
Ammonium persulphate to improve the reduction efficiency. The wastewater flow rate to
FACCO reactor was reduced 1500lit/hr with air and ozone (4 ppm) distribution at the bottom
of the reactor. The COD reduced was found to only 34 % (from 2040 to 1350 ppm) and
Colour 10 % (from 340 to 300) in the outlet, due to the presence hardness in the wastewater.
The COD reduction index across the reactor is 0. 48 mg of COD / gm of carbon / hr, which is
comparatively lesser than the lime-soda treated effluent TABLE 20.
TABLE – 20: Results of FACCO treatment study 7 (without Ammonium persulphate and
lime soda treatment)
Date Raw WW Treated WW Reduction Raw WW Treated WW Reduction
Colour, ppm
Colour, ppm % COD ppm COD ppm %
10.11.09 430 340 20.9 2150 1330 38.1
11.11.09 320 290 9.4 1970 1400 28.9
12.11.09 310 300 3.2 2080 1440 30.8
13.11.09 300 280 6.7 1960 1230 37.2
Avg. 340 300 10.0 2040 1350 33.8 The results of TDS and BOD reduction across FACCO reactor was found to 10.5 % and 61%
respectively (TABLE 21)

Colour and TDS Removal from ECF Bleach Plant Effluent By TNPL
Development Council (Paper), DoIPP, Govt. of India & IPMA - 28 -
TABLE – 21: Results of FACCO treatment study 7 (without Ammonium persulphate and
lime soda treatment)
Date Raw WW FACCO treated Raw WW
FACCO treated
Reduction
TDS ppm TDS ppm BOD ppm BOD ppm %
10.11.09 8750 7710 954 418
11.11.09 8599 8326 1220 385
12.11.09 8422 8156 1254 361
13.11.09 8083 7515 1071 598
16.11.09 8203 6183 1008 371
17.11.09 8244 7130 - -
Avg. 8383 7503 1101 427 61.2
FACCO treatment study 8 (with Ammonium persulphate and without Lime soda treatment) :
The chemical dosage was kept at Fenton (FeSO4 250 ppm and H2O2 250 ppm) with
Ammonium persulphate 120 ppm and wastewater flow rate to FACCO @1500lit/hr with air
and ozone (4 ppm) distribution at the bottom of the reactor. The COD reduction was only 55
% (from1830 to 780 ppm ) and Colour 58.5 % (from 380 to 160 ppm) in the FACCO outlet.
The COD reduction index across the reactor is 0. 72 mg of COD / gm of carbon / hr. The
results are presented in TABLE 22.
TABLE – 22: Results of FACCO treatment study 8 (with Ammonium persulphate and
without lime soda treatment)
Date Raw WW Treated WW Reduction Raw WW
Treated WW
Reduction
Colour, ppm Colour, ppm % COD ppm
COD ppm %
16.11.09 332 129 61.1 1840 790 57.1
17.11.09 430 190 55.8 2080 986 52.6
Avg. 380 160 58.5 1960 888 54.9

Colour and TDS Removal from ECF Bleach Plant Effluent By TNPL
Development Council (Paper), DoIPP, Govt. of India & IPMA - 29 -
FACCO treatment study 9 (with Ammonium persulphate and Lime soda treatment): After
discussions with CLRI personnel, the lime soda treated wastewater was taken to FACCO at
the rate of 2000 lit/hr (higher taken the previous study). with 120 ppm Fenton and 120 ppm
and ammonium persulphate along with air and 4 ppm Ozone dosage (4 ppm) the bottom. The
COD was reduced by 51.7 % and color by 16.6 % and COD reduction index was 0. 62 mg of
COD / gm of carbon / hr. The results are presented in TABLE 23
TABLE – 23: Results of FACCO treatment study 9 (with Ammonium persulphate and lime
soda treatment)
Date Raw WW Treated WW Reduction Raw WW Treated WW Reduction
Colour, ppm Colour, ppm % COD ppm COD ppm %
20.11.09 290 230 20.7 1200 560 53.3
21.11.09 400 350 12.5 1440 720 50.0
Avg. 345 290 16.6 1320 640 51.7
FACCO inlet pH 3.3 and outlet increased to pH 5.0 with Sulphuric acid. This increased the Sulphates to 4150 ppm and after FACCO sulphates were only 340 ppm
FACCO treatment study 10 (Two stage treatment with Ammonium persulphate and without
lime soda treatment)
The lime soda treated effluent having pH 11.5 was collected in the intermediate tank and
adjusted the pH to 3.5 with dilute sulphuric acid. It is then dosed with Fenton 120 ppm and
ammonium persulphate 120 ppm. The wastewater was dosed downward in the FACCO
reactor @ 2000 lph with air was distributed in the bottom. The COD was reduced by 41.7 %
and color by 23.3 %. The colour removal was percentage was improved further with reduced
flow. However there is no improvement in COD reduction. The COD reduction index was 0.
55 mg of COD / gm of carbon / hr. Reduction in COD and colour was only marginal in the
second stage. The TDS and sulphates in the raw wastewater and treated wastewater was also
tested. The treated effluent was ozonated in the ozonator with 16 ppm ozone and no
improvement was observed (TABLE 24)

Colour and TDS Removal from ECF Bleach Plant Effluent By TNPL
Development Council (Paper), DoIPP, Govt. of India & IPMA - 30 -
TABLE – 24: Results of FACCO treatment study 10 (two stage with Ammonium
persulphate and lime soda treatment)
Date Raw WW Treated WW Reduction Raw WW Treated WW Reduction
Colour, ppm
Colour, ppm % COD ppm COD ppm %
24.11.09 420 322 23.3 1440 840 41.7
3.12.09 450 190 57.7 1330 960 27.8
6.12.09 190 190 57.7 960 880 33.8
TABLE - 25: Overall results of DHT wastewater treatment in FACCO reactor
S .No Chemical dosage
ppm
Raw WW
colour ppm
Treated WW
colour
Reduction
%
Raw WW COD ppm
FACCO Treated
WW COD
Reduction
%
COD reduction
index
1 Fenton 80 480 210 56.3 1930 996 48.4 0.61
2 Fenton + APS 100 535 213 60.2 1502 810 46.1 0.75
3 Fenton + APS 120 442 100 77.8 1648 573 65.2 1.17
4 Fenton + APS 120 450 140 68.3 1928 638 67.0 1.17
5 Fenton 150 460 220 52.6 1497 854 43.0 0.73
6 Fenton 250 460 145 68.9 1324 565 68.1 0.76
7 Fenton 250 + APS 120 w/o lime soda
380 150 58.0 1830 780 57.4 0.72
8 Fenton 250 + APS 250,w/o lime soda
430 190 55.8 2080 986 52.6 .72
9 Fenton 250+ APS 120,w/o lime soda
420 230 45.2 1200 560 53.3 0.62
Note : Fenton -Ferrous sulphate & Hydrogen peroxide ; APS -Ammonium persulphate
The COD reduction index expressed in mg of COD / gm of carbon / hr in the reactor
varies from 0.6 to 1.2. The effect of flow without lime soda and increase in chemical dosage
in the reactor. Ammonium persulphate was found to be effective oxidising agent, but even a
120 ppm dosage increases the cost of treatment by Rs16/m3. The partial reduction in COD in

Colour and TDS Removal from ECF Bleach Plant Effluent By TNPL
Development Council (Paper), DoIPP, Govt. of India & IPMA - 31 -
FACCO reactor necessitates further biological treatment. The dissolved oxygen at the outlet
of the reactor was 2-3 ppm.
HW – DHT filtrate effluent treatment
PILOT PLANT TRIAL (WITH FACCO REACTOR) COD Reduction %
COLOUR Reduction %
Studies were conducted using membrane filtration studies, to remove TDS and COD, with
FACCO treatment for about three week and the results are presented below.
12.9.09 1.10.09 8.10.09 14.10.09 26.10.09 2.11.09 16.11.09
0
500
1000
1500
2000
2500
1930
15021648
1928
1497
1324
1830
996
810
573638
854
565
780
48.4 46.1 65.2 67 43 68.1 57.4
rawtreated
reduction,%
PERIOD
CO
D,p
pm
12.9.09 1.10.09 8.10.09 14.10.09 26.10.09 2.11.09 16.11.09
0
100
200
300
400
500
600
480
535
442 450 460 460
380
210 213
100
140
220
145 150
56.3 60.277.8 68.3
52.568.9 58
rawtreated
reduction,%
PERIOD
CO
LOU
R,p
pm

Colour and TDS Removal from ECF Bleach Plant Effluent By TNPL
Development Council (Paper), DoIPP, Govt. of India & IPMA - 32 -
Ultrafiltration: The FACCO treated effluent from the final tank was pumped to the UF feed
tank. It is then sent to a sand filter @ 1700 lit/hr and at 1kg/cm2 pressure through 100 micron
cartridge prefilter and then to the UF Polysulphonate membrane (hollow type) to retain
particles (colloidal silica, bacteria and fine suspended solids) of about 0.005µ or larger (MW
>100 dalton). The permeate @ 1200 lit/hr, containing low molecular substances was sent to
the RO feed tank. The rejects @ 500 lit/hr was drained. The recovery efficiency was 70.6 %
with COD reduction of around 200 ppm. There was no reduction in TDS and colour. The
results are presented in the TABLE 26.
TABLE – 26: Results of HW ECF DHT ultrafilteration with FACCO treatment
S. No Parameter units UF feed UF permeate UF rejects
1 pH 7.6 7.5 7.8
2 Colour mg/lit 270 260 290
3 COD mg/lit 1740 1520 1880
4 Total hardness as CaCO3
mg/lit 120 110 160
5 Calcium as CaCO3 mg/lit 80 90 120
6 Magnesium as CaCO3
mg/lit 40 20 40
7 TDS mg/lit 11300 11200 11050
8 Sodium as Na mg/lit 4600 4500 4800
9 Sulphates as SO4 mg/lit 4570 4460 4760
10 Chlorides as cl- mg/lit 1540 1520 1600
RO Membrane filtration: The UF permeate was filtered through activated carbon filter @
650 lit/hr and passed through 10 micron cartridge filter. It is then pumped with a high
pressure pump to the RO membrane (Hydraunatics make-spiral wound type) at 10 kg/cm2
feed pressure. Dissolved salts and organic substances >50 dalton were removed here and
allows only relatively pure water collected in RO permeate tank @ 320 lit/hr. The permeate
was found to be colorless with less dissolved salts and COD TABLE 27 & 28. The rejects @
330 lit/hr (the volume was reduced to 50 %) was collected in the Nano feed tank.

Colour and TDS Removal from ECF Bleach Plant Effluent By TNPL
Development Council (Paper), DoIPP, Govt. of India & IPMA - 33 -
TABLE – 27: Results of HW ECF DHT RO membrane filtration after FACCO treatment
(average of three trials) and ultrafilteration
S. No Parameter units RO feed RO permeate RO rejects
1 Flow lit/hr 650 320 330
2 pH 7.8 7.3 7.8
3 Colour mg/lit 290 0 296
4 COD mg/lit 720 40 1030
5 Total hardness as CaCO3
mg/lit 160 0 310
6 Calcium as CaCO3
mg/lit 120 0 220
7 Magnesium as CaCO3
mg/lit 40 0 72
8 TDS mg/lit 11050 612 21168
9 Sodium as Na mg/lit 4800 150 9316
10 Sulphates as SO4 mg/lit 4260 0 8510
11 Chlorides as cl- mg/lit 1600 220 2930
TABLE – 28: Results of HW ECF DHT RO membrane filtration after FACCO treatment
(average of three trials) and ultrafilteration-Mass balance (flow*mg/lit).The rate of recovery
was 50 %
S. No Parameter units RO feed RO permeate RO rejects Removal, %
Flow lit/hr 650 320 330 --
1 COD kgs/hr 468 12.8 340 97.2
2 Total hardness kgs/hr 104 0 104 100
3 Calcium kgs/hr 78 0 78 100
4 Magnesium kgs/hr 26 0 26 100
5 TDS kgs/hr 7182 196 6986 97.3
6 Sodium kgs/hr 3120 48 3072 98.5
7 Sulphates kgs/hr 2769 0 2769 100
8 Chlorides kgs/hr 1040 70.4 969.6 93.2

Colour and TDS Removal from ECF Bleach Plant Effluent By TNPL
Development Council (Paper), DoIPP, Govt. of India & IPMA - 34 -
RO membrane filtration - DHT Effluent
NANO Membrane filtration: The RO reject was passed through Sand filter, Activated
Carbon Filter and Iron filter (filled with MnO2 beads to remove dissolved iron) @ 650 lit/hr
and then through 10 micron cartridge filter the reject was pumped with a high pressure pump
10 kg/cm2 pressure to the Nano membrane (MW >250 dalton) to remove the inorganic salts
and COD. The Nano membrane with a negatively charged polymer film rejects ions with
higher charge density, such as SO4. The permeate @ 100 lit/hr containing water and
monovalent ions was collected in the Nano permeate tank. The reject @ 550 lit/hr was
collected in the reject tank. The reject contained more sulphates and sodium (TABLE 29 &
30).
Sulphates Chlorides Colour COD T.Hardness TDS Sodium
0
2000
4000
6000
8000
10000
12000
4260
1600
290720
160
11050
4800
220 40612
150
RO Feed
RO Permeate
Parameters
ppm

Colour and TDS Removal from ECF Bleach Plant Effluent By TNPL
Development Council (Paper), DoIPP, Govt. of India & IPMA - 35 -
TABLE – 29: Results of HW ECF DHT NANO membrane filtration after RO filtration
(average of three trials)
S. No Parameter units Nano feed Nano permeate Nano reject
1 Flow lit/hr 600 100 500
2 pH 7.8 7.6 7.9
3 Colour mg/lit 296 57 96
4 COD mg/lit 1030 258 1184
5 Total hardness mg/lit 310 60 100
6 Calcium mg/lit 220 20 60
7 Magnesium mg/lit 72 40 40
8 TDS mg/lit 21168 7620 23886
9 Sodium mg/lit 9316 6460 9874
10 Sulphates mg/lit 8510 410 9420
11 Chlorides mg/lit 2930 1804 4772
TABLE – 30: Results of HW ECF DHT NANO membrane filtration after RO filtration
(average of three trials)-Mass balance
S. No Parameter units Nano feed Nano permeate Nano rejects Removal %
Flow lit/hr 600 100 500
1 COD kgs/hr 618 26 592 95.8
2 TDS kgs/hr 12700 762 1938 94.0
3 Sodium kgs/hr 5590 648 4942 88.4
4 Sulphates kgs/hr 5106 41 5065 99.2
5 Chlorides kgs/hr 1758 181 1577 89.7
The chloride content in Nano reject may be reduced by better selection of the membrane and
reject may be further concentrated either by using Mechanical Vapor Compression
technology or in an evaporator. The recovered Sodium sulphate can be concentrated to 80 gpl

Colour and TDS Removal from ECF Bleach Plant Effluent By TNPL
Development Council (Paper), DoIPP, Govt. of India & IPMA - 36 -
and mixed with WBL and use in SRP as make-up chemical. The sodium chloride in the
permeate may be further concentrated and disposed to industrial users like Dyeing industry.
The cost of lime-soda pretreatment was found to be high with HW DHT effluent due to high
hardness level (1400 ppm). The improvement in the quality of raw materials, such as,
debarked Casuarina and matured wood will lower the concentration of non-process elements
entering in the HW pulp line and would reduce treatment economically viable and this needs
further study. Moreover, the volume of effluent reject handled would also come down due to
the aforesaid measures. Reduced TDS level in the effluent in subsequent cycles, if the RO
generated water is used in the HW bleaching process, resulting in reduction of the overall
pollution load and water consumption
S. No Parameters Cost in Rs
1 Cost of equipment & installation charges 45 lakhs
O & M Cost of treatment HW DHT effluent treatment cost in pilot plant/ m3
2 Chemicals for pretreatment - lime, soda, sulphuric acid 62
3 Power - 8.36 kwh @ Rs 2.06 17
4 Cost of evaporating the Nano rejects (from 8 gpl to 80 gpl) @150kg of steam/t of water
47
5 Biological treatment (FACCO process) 18
6 Total 134
Savings expected upon treatment of Dht effluent /m3
7 Quantity of water that can be recycled thro' DM water(.5*12) 6
8 Savings expected in ETP2.4 12
9 Sodium (in terms of caustic lye) 2.5 kgs 39
10 Lime sludge 3.0 kgs & Calcium carbonate, 3.0 kgs
11 Sodium sulphate ,2.8 kgs 25.2
12 Total 84.4
Net cost / m3 50.4

Colour and TDS Removal from ECF Bleach Plant Effluent By TNPL
Development Council (Paper), DoIPP, Govt. of India & IPMA - 37 -
Limitations of the CLRI FACCO process
• Size of the reactor used to process 1.2 m3/hr was 25 m3, which is very large and is not
economically viable for treatment.
• COD and Colour reduction was not consistent at different levels of inlet COD. The
reduction efficiency comes down with increasing level COD and colour.
• Use of sulphuric acid for neutralisation increases the sulphate content and inorganic
load to the Membrane filtration unit.
• High cost of Ammonium persulphate (Rs 140/kg) increases the cost of treatment.
• Two stage FACCO treatment is not technically feasible due to high volume of
reactor, chemical dosage and residence time.
Other issues for consideration
• The membranes used were of 4” dia, which may not be sufficient for simulating plant
scale process to achieve the desired flux levels. The operating pressure at the
membrane was only 10 to 12 bar, unlike the requirement in the plant scale, which is
in the order of 60 bar and above.
• TDS levels and separation of monovalent and divalent salts in the Nano filtration
permeate was not satisfactory. The concentration of reject was lower which produces
high volume wastewater for further processing in an evaporator.
• The recovery rate in the RO and the Nano filtration system was very low, in the range
of 35 to 40%.
• High COD and Colour levels in the FACCO treated effluent caused frequent fouling
and reduced the efficiency of the Membrane systems.
CONCLUSION
The biological treatment of HW EOP filtrate in the FAACO reactor has resulted in a
reduction of 50 to 60 % in COD and Colour and this was enhanced slightly by Fenton
dosage. However, COD & Colour was still high and it is not suitable to treat in
membrane process for TDS reduction. Treatment of DHT filtrate in FACCO reactor, with
Colour and TDS Removal from ECF Bleach Plant Effluent By TNPL
Development Council (Paper), DoIPP, Govt. of India & IPMA - 38 -
Fenton and ammonium persulphate has brought about 50 to 60% reductions in COD &
Colour, but the cost of treatment has increased considerably. High COD at FACCO outlet
caused fouling in the RO membrane thereby reducing the recovery efficiency. The cost of
hardness/TDS removal by lime-soda treatment and membrane filtration works out to Rs
80 /m3. Pretreatment methods to remove silica, heavy metals and hardness, such as, lime
treatment, followed by anaerobic and aerobic process for improved biological treatment
need to be explored to make the process more economical. Ion exchange techniques and
Resin filtration for Colour/COD/TDS removal have to be experimented further to find a
viable method for tertiary treatment to remove TDS and other non-process elements
especially for ECF bleach plant effluent.
The results of present studies will be very useful input to design a Zero Liquid Discharge
system which is technically more advanced and economically viable. Based on results
obtained from the present study TNPL has initiated a ZERO LIQUID DISCHARGE
program and proposed to setup 5 m3/hr pilot plant to find out feasibility of treating
bleach plant effluent combining both biological and membrane process.
ACKNOWLEDGEMENTS The authors are thankful to Development Council (Paper), DoIPP, Govt. of India and
TNPL management for funding and support to complete the project. Thanks to IPMA for
the continued support and encouragement, Central Leather Research Institute for
licensing of technology and special thanks to Dr. G. Sekaran, Scientist, CLRI for his
coordination, advice for successful completion of this work and others those who are
directly and directly supported for completing this work.
REFERENCES: Amec (2008). Study report for Independent advice on the development of environmental
guidelines for any new bleached eucalypt kraft pulp mill in Tasmania. Prepared for Resource
Planning and Development Commission TASMANIA Ref. no. 570334.X.

Colour and TDS Removal from ECF Bleach Plant Effluent By TNPL
Development Council (Paper), DoIPP, Govt. of India & IPMA - 39 -
Adan S., Hoang M., Wang H., Bolyo B., and Zongli Xie (2010). Recent treads in research,
development and application of membrane technology in pulp and paper industry. APPITA
Vol. 63(3):235.
Gellerstedt G. (2009). Pulping chemistry and bleaching technology: Pulp and Paper
Chemistry and Technology Volume-2 (Edt. Monica et al.,). Walter E C Gruyter, GMBH &
Co, KG, 10785, Berlin, Germany.
Deardorff T. L., Renard J. J. and Phillips R.B. (1998). An environmental assessment before
and after conversion of bleached kraft mill to elemental chlorine free bleaching: Chlorine
and Chlorinated Organic Compounds in Pulp and Paper Industry (Edt. Victor Turoski). Ann
Arbor Press, USA
Dube M., R. Mclean, D. Maclatchy (2000). Reverse osmosis treatment effects on effluent
quality. Pulp and Paper Canada, 101(8): 42.
Fiskari, J. 2004. Improving the efficiency of a two-stage oxygen delignification system.
TAPPI Fall Technical Conference: Engineering and Pulping, Atlanta, GA, p 135-138
Jain C.K., Arvind Kumar and M. Hayssam Izazy (2009). Color removal from paper mill
effluent through adsorption technology. Environmental Monitoring and Assessment: Volume
149, Numbers 1-4.
Johnston P.A., R. L Stringer, D. Santillo, A. A. Stepahenson, I.P. Labounskaia, and H. M.A.
McCartney (1996). Towards zero effluent pulp and paper production: The Pivotal role of
totally chlorine free bleaching, Greenpeace International, Amsterdam, Technical Report
7/96.
Johnson, A.P., Johnson, B.I., Gleadow, P., Araneda, H., Silva, F.A., Aquilar, R.M., Hsiang,
C.J. (2008). 21st Century Fibrelines. Proceeding International Bleaching Conference,
Canadian Pulp and Paper Association Quebec City.

Colour and TDS Removal from ECF Bleach Plant Effluent By TNPL
Development Council (Paper), DoIPP, Govt. of India & IPMA - 40 -
Lehtinen K. J. and Tina J. (1998). Assessing the aquatic environmental impact of ECF and
TCF pulping operations using multi species mesocosm and fish biomarker test: Chlorine and
Chlorinated Organic Compounds in Pulp and Paper Industry (Edt. Victor Turoski). Ann
Arbor Press, USA.
Ljunggren S., Gidnert S. B. and De Sousa F. (1998) Reduced AOX and biological effect by
modification of a ClO2 stage. TAPPI Journal, 81 (1):267.
McDonough T. J., (1998). The revolution in bleached chemical pulp manufacturing
technology: Chlorine and Chlorinated Organic Compounds in Pulp and Paper Industry (Edt.
Victor Turoski). Ann Arbor Press, USA.
McKenzie D. J. (1994). The evolution of pulp bleaching practice at Harmac Pacific.
International Pulp Bleaching Conference papers, Technical section, CPPA, Montreal, pp.
163.
Michael Farlow (1996). Water management critical for mills making effort at white water
closure. Pulp and paper Canada ?
Milestone CB, Fulthorpe RR, Stuthridge TR (2004). The formation of colour during
biological treatment of pulp and paper wastewater. Water Science and Technology:50(3):87-
94.
Monta, S., Van Tran, A. 2008. Operating experience of high-consistency ozone bleaching.
Japan TAPPI Journal, 62 (1): p 61-64.
Pierre R.Berube and Eric R. Hall (2001). Cost comparison between a high- temperature
membrane bioreactor for treatment of foul evaporator condensate for reuse. TAPPI Journal,
84 (6): 62.

Colour and TDS Removal from ECF Bleach Plant Effluent By TNPL
Development Council (Paper), DoIPP, Govt. of India & IPMA - 41 -
Pryke D. C. and Reeve C. W. (1996) Chlorine di Oxide delignification practices in Cannda.
TAPPI Pulping Conference Preceding, TAPPI Press, Atlanta, pp 217.
Ragnar, M., Dahllof, H., Lundgren, S. 2004. Towards an environmentally sustainable
bleaching of kraft pulp exploring alternative ECF and TCF bleaching sequences. Proceeding
of 58th Appita Annual Conference and Exhibition; Incorporating the Pan Pacific
Conference, pp 477-485.
Ragnar, M. 2005. 2-stage bleaching of oxygen delignified HW kraft pulp to full brightness:
Practically possible by changing Do to DHT. Pulp & Paper Canada, 106 (4): 97-101.
Ramamurthy P. and Wearing J.T. (1998). System closure: A Canadian prospective.
Precedings of 84th annual meeting of Canadian pulp and paper Association PP. 215.
Srivastava Vemal Chanra, Indra Deo Mall and Indra Mani Mishra (2005). Treatment of pulp
and paper mill wastewaters with poly Aluminium chloride and bagasse fly ash Department of
Chemical Engineering, Indian Institute of Technology, Roorkee 247667, India
Sonnenberg L. B. Overview of Ozone bleaching: Chlorine and Chlorinated Organic
Compounds in Pulp and Paper Industry (Edt. Victor Turoski). Ann Arbor Press, USA
Stinchfield A. E. and Woods M. G. (1995). Reducing chlorinated organic compounds from
bleached kraft mills through first stage substitution of chlorine di oxide for chlorine. TAPPI
Journal, 78 (6): 117.
Van Tran, A. 2006. Decreasing effluent loads through bleaching modification. Water
Research, 40 (3): 487-494.
Walsh P. B., Hoyos M. and Seccombe R. C. (1991). Practical mill experience with use if
hydrogen per oxide reinforced extraction stages to reduce and elemenate the use of Elemental

Colour and TDS Removal from ECF Bleach Plant Effluent By TNPL
Development Council (Paper), DoIPP, Govt. of India & IPMA - 42 -
Chlorine in hard wood kraft pulps for AOX reduction. TAPPI Pulping Conference
Preceding, TAPPI Press, Atlanta, pp 55.
Wingate KG, Stuthridge TR, Wright LJ, Horwitz CP, Collins TJ. (2004). Application of
TAML catalysts to remove colour from pulp and paper mill effluents. Water Science and
Technology, 49(4):255-60

Colour and TDS Removal from ECF Bleach Plant Effluent By TNPL
Development Council (Paper), DoIPP, Govt. of India & IPMA - 43 -
Membrane Filtration Plot Plant Unit
Ultra filtration Module
R O Module
Nano Module
Nano Pre-filtration

Colour and TDS Removal from ECF Bleach Plant Effluent By TNPL
Development Council (Paper), DoIPP, Govt. of India & IPMA - 44 -
Membrane Filtration Results
Pretreatment and Ultra Filteration
RO and Nano Filtrations

Colour and TDS Removal from ECF Bleach Plant Effluent By TNPL
Development Council (Paper), DoIPP, Govt. of India & IPMA - 45 -
Membrane Filtration Results