Embed Size (px)
Citation preview

Cesare GridelliCesare Gridelli
Division of Medical OncologyDivision of Medical Oncology
“ “S.G. Moscati” Hospital – Avellino (Italy)S.G. Moscati” Hospital – Avellino (Italy)
[email protected]@libero.it
POST-IASLC: First-line of advanced NSCLC

Safety and Resource Use in PRONOUNCE: A randomized, phase 3, open-label study of pemetrexed plus carboplatin with
maintenance pemetrexed (PemC) compared to paclitaxel plus carboplatin plus bevacizumab with maintenance bevacizumab
(PCB) in patients with advanced non-squamous (NS) non-small-cell lung cancer (NSCLC)
Authors: 1Helen J Ross, 2, 3David R Spigel, 4Robert W Weaver, 5Ramaswamy Govindan, 6Viran R Holden, 7Naveed M Chowhan, 8Thaddeus Beck, 9David M Waterhouse,
10Manuel R Modiano, 11Vijay P Rao, 12Katherine B Winfree, 12Symantha A Melemed, 12Jingyi Liu, 12Andrew G Koustenis, 12Susan C Guba, 12Waldo I Ortuzar,
12Coleman K Obasaju, 13Ralph Zinner
Affiliations: 1Mayo Clinic, Scottsdale, AZ; 2,3Tennessee Oncology, Nashville, TN; Sarah Cannon Research Institute, Nashville, TN; 4Florida Cancer Specialists, Fort Myers, FL; 5Washington University Medical Center, St. Louis, MO; 6Mercy Clinic Cancer and Hematology, Springfield, MO; 7Floyd Memorial Cancer Center of Indiana, New Albany, IN; 8Highlands Oncology Group, Fayetteville, AR; 9Oncology Hematology Care Inc., Blue Ash, OH; 10ACRC/Arizona Clinical Research Center, Arizona Oncology, Tucson, AZ; 11Mid Dakota Clinic Hematology and Oncology, Bismarck, ND; 12Eli Lilly and Company, Indianapolis, IN; 13University of Texas MD Anderson Cancer Center, Houston, TX

PRONOUNCE: Study Design
Stratified for:
PS (0 vs 1); gender (M vs F); disease stage (M1a vs M1b)
Randomized, open-label, phase III superiority study conducted in US Pemetrexed 500 mg/m2, Carboplatin AUC 6 (Pem+Cb) Paclitaxel 200 mg/m2, Carboplatin AUC 6, Bevacizumab 15 mg/kg (Pac+Cb+Bev)
Bev-Eligible Population
Inclusion:- Chemo-naïve patients
- PS 0/1
- Stage IV, nonsquam
- Stable treated CNS mets
Exclusion:- Uncontrolled effusions
Induction Phaseq21d, 4 cycles
Maintenance Phase q21d until PD
Pemetrexed (folic acid & vitamin B12)
+ Carboplatin
Paclitaxel + Carboplatin + Bevacizumab
R1:1
Pemetrexed (folic acid & vitamin B12)
Bevacizumab
180 patients each
Zinner R et al, ASCO 2013

0 3 6 9 12 15 18 21 24 27
0
20
40
60
80
100
Months
Pro
po
rtio
n
Pem+Cb: median G4PFS = 3.9 (mo)-------- Pac+Cb+Bev: median G4PFS = 2.9 (mo)
Log-rank p-value = 0.176HR (90% CI) = 0.85 (0.70, 1.04)
Pem+Cb 182 87 44 26 14 7 5 3 1 0
Pac+Cb+Bev 179 75 33 17 9 3 0 0 0 0
Patients at Risk
Primary Endpoint: G4PFS
Zinner R et al, ASCO 2013

0 3 6 9 12 15 18 21 24 27 30 33 36 39 42
0
20
40
60
80
100
Months
Pro
po
rtio
n
Pem+Cb: median OS = 10.5 (mo)--------- Pac+Cb+Bev: median OS = 11.7 (mo)
Log-rank p-value = 0.615HR (95% CI) = 1.07 (0.83, 1.36)
Pem+CbN = 182
%
Pac+Cb+BevN = 179
%1-Year 43.7 48.8
2-Year 18.0 17.6
Secondary Endpoint: OS
Patients at RiskPem+Cb 182 156 125 102 72 48 33 20 11 11 5 5 5 5 5 Pac+Cb+Bev 179 151 121 96 73 59 38 28 10 3 1 1 0 0 0
Zinner R et al, ASCO 2013

Drug related Treatment Emergent Adverse Events (TEAEs)
P<0.001
P<0.001
P<0.033
P<0.006
P<0.001
P<0.003
P-values result from Fisher’s exact tests in numbers of patients experiencing adverse events by treatment . There was a significantly higher occurrence of anemia and thrombocytopenia in patients treated with PemC. Thrombosis, musculoskeletal pain and joint pain, hemorrhage and hypertension occur significantly more in patients treated with PCB.
P<0.105
P<0.001
P<0.07
Anemia
Thrombocytopenia
Hypotension
Thrombosis
Musculoskeletal Pain - Extremity
JointPain
HemorrhagePulm, Up Resp/Nose
Hypertension
Diarrhea
Number of Patients
A. Toxicities that differed by treatment
The number of patients experiencing adverse events is on the x-axis with the event type on the y-axis. Color indicates grade with grade 1, grade 2, grade 3, and grade 4; See table 5 below for detailed data.

Drug related Treatment Emergent Adverse Events (TEAEs)
B. Toxicities considered most important to patients
P<0.064
P<0.011
P<0.001
P<0.001
P<0.058
P<0.001
P<0.587
P-values result from Fisher’s exact tests in numbers of patients experiencing adverse events by treatment. Significantly more patients treated with PemC experience fatigue and nausea. Febrile neutropenia, alopecia, sensory neuropathy and neutropenia occur significantly more often in patients treated with PCB. **Febrile neutropenia and neutropenia not usually reported because lab tests are required.
Fatigue
Nausea
Vomiting
**FebrileNeutropenia
Alopecia
SensoryNeuropathy
Neutropenia
Number of patients
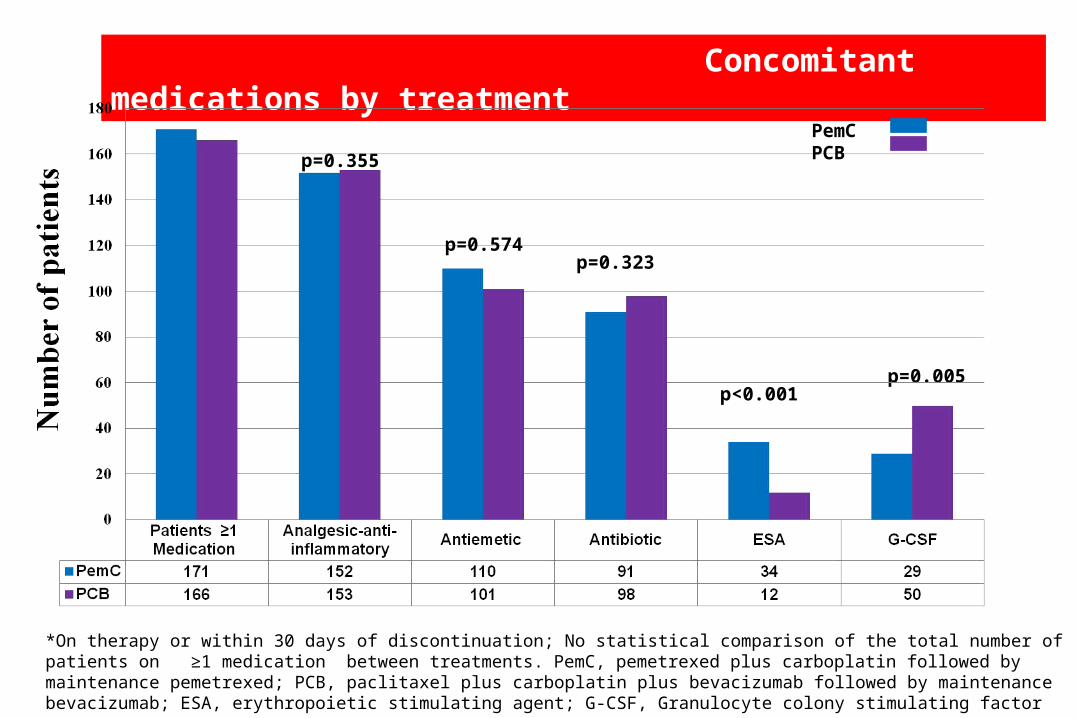
Concomitant medications by treatment
p<0.001p=0.005
p=0.323
p=0.355
p=0.574
PemC PCB
*On therapy or within 30 days of discontinuation; No statistical comparison of the total number of patients on ≥1 medication between treatments. PemC, pemetrexed plus carboplatin followed by maintenance pemetrexed; PCB, paclitaxel plus carboplatin plus bevacizumab followed by maintenance bevacizumab; ESA, erythropoietic stimulating agent; G-CSF, Granulocyte colony stimulating factor

Resource Utilization
Parameter, n (%)*
PemC PCB
N = 171 N = 166p-value
Chemotherapy infusion time per protocol 0.7 hours 4 - 5 hours N/A
Patients with transfusion
Packed red blood cells 59 (34.5) 19 (11.4) <0.001
Platelets 10 (5.8) 7 (4.2) 0.621
Any Hospitalization 59 (34.5) 53 (31.9) 0.645
Number of days, mean (StdDev) 8.2 (6.79) 8.8 (7.33) 0.682
Concomitant medications, G-CSF 29 (17.0) 50 (30.1) 0.005
Erythropoietic stimulating agents 34 (19.9) 12 (7.2) <0.001

Conclusions
■ Toxicity of PemC and PCB were consistent with previous reports.
■ Mild to moderate nausea was more common for patients treated with PemC.
■ Alopecia, infection and neuropathy were more common for patients treated with
PCB.
■ Hospitalizations did not differ between treatment arms.
■ ESA and RBC transfusions were more common for patients treated with PemC.
■ G-CSF use was more common for patients treated with PCB.

ToPPS : phase II randomized trial on advanced NSCLC patients with PS 2
PDPDBevacizumab
CARBOPLATIN + PEMETREXED
CARBOPLATIN + PEMETREXED
CBDCA + PEMETREXED + BEVACIZUMAB
15mg/kg
CBDCA + PEMETREXED + BEVACIZUMAB
15mg/kg
PEMETREXEDPEMETREXED
Previously untreated, stage
IIIb, IV non-squamous NSCLC
Previously untreated, stage
IIIb, IV non-squamous NSCLC
RANDOMI SED
RANDOMI SED
Mount Sinai, and Sarah Cannon Cancer Center
Primary endpoint: PFS
Primary endpoint: PFS
Lilenbaum R et al, WLCC 2013

Efficacy (N=163)
Best Response (All Randomized Pts)
Arm 1 (N=48)
Arm 2 (N=59)
Arm 3 (N=56)
CR 0 0 1 (1.8%)PR 7 (14.6%) 15 (25.4%) 21 (37.5%)SD 22 (45.8%) 22 (37.3%) 18 (32.1%)PD 13 (27.1%) 10 (16.9%) 7 (12.5%)UE 6 (12.5%) 10 (16.9%) 8 (14.3%)
Haven’t reached 1st restaging 0 2 (3.4%) 1 (1.8%)
Overall Response Rate (All Randomized Pts)
Arm 1 (N=48)
Arm 2 (N=59)
Arm 3 (N=56)
Proportion (P) 0.1458 0.2542 0.3929Exact Confidence Limits 95% LCL 0.0607 0.1498 0.265095%UCL 0.2776 0.3844 0.5325
Overall Response Rate (All Evaluable Pts)
Arm 1 (N=42)
Arm 2 (N=47)
Arm 3 (N=47)
Proportion (P) 0.1667 0.3191 0.4681Exact Confidence Limits 95% LCL 0.0607 0.1498 0.265095%UCL 0.2776 0.3844 0.5325

Progression Free Survival
13
Arm 1 (N=48) Arm 2 (N=59) Arm 3 (N=56)Pem Only Pem + Bev Pem + Bev+ Carbo
Median PFS (95% CI) 2.6 (1.5, 5.1) 3.5 (2.4, 5.1) 4.1 (3.0, 6.4)12-month PFS (95% CI) 0.05 (0.01, 0.16) 0.10 (0.03, 0.22) 0.16 (0.06, 0.29)

Overall Survival
14
Arm 1 (N=48) Arm 2 (N=59) Arm 3 (N=56)
Pem Only Pem + Bev Pem + Bev+ Carbo
Median OS (95% CI) 7.6 (3.0, 10.7) 8.7 (5.0, 11.3) 8.8 (5.4, 13.4)
12-month PFS (95% CI) 0.28 (0.15, 0.43) 0. 36 (0.23, 0.50) 0.44 (0.29, 0.58)

Adverse Events Arm 1 (N=48) Arm 2 (N=56) Arm 3 (N=52) Grade 1 Grade 2 Grade 3 Grade 4 Grade 1 Grade 2 Grade 3 Grade 4 Grade 1 Grade 2 Grade 3 Grade 4
Hematologic
ANEMIA 7 (14.6%) 6 (12.5%) 4 (8.3%) 1 (2.1%) 8 (14.8%) 8 (14.8%) 1 (1.9%) 3 (5.8%) 15 (28.8%) 4 (7.7%) 1 (1.9%)
LEUKOPENIA 2 (4.2%) 2 (4.2%) 3 (5.5%) 5 (9.3%) 1 (1.9%) 7 (13.5%) 2 (3.8%) 3 (5.8%) 1 (1.9%)
THROMBOCYTOPENIA 9 (18.8%) 1 (2.1%) 1 (2.1%) 7 (13.0%) 1 (1.9%) 2 (3.7%) 11 (21.2%) 2 (3.8%) 7 (13.5%) 3 (5.8%)
NEUTROPENIA 1 (2.1%) 2 (4.2%) 3 (6.3%) 1 (2.1%) 2 (3.7%) 4 (7.4%) 5 (9.3%) 3 (5.8%) 6 (11.5%) 7 (13.5%) 2 (3.8%)
Non-Hematologic
FATIGUE 6 (12.5%) 14 (29.2%) 9 (18.8%) 10 (18.5%) 15 (27.8%) 10 (18.5%) 7 (13.5%) 12 (23.1%) 12 (23.1%)
NAUSEA 8 (16.7%) 9 (18.8%) 1 (2.1%) 13 (24.1%) 5 (9.3%) 2 (3.7%) 19 (36.5%) 4 (7.7%) 2 (3.8%)
CONSTIPATION 7 (14.6%) 3 (6.3%) 2 (4.2%) 9 (16.6%) 9 (16.6%) 3 (5.5%) 12 (23.1%) 7 (13.5%)
ANOREXIA 7 (14.6%) 6 (12.5%) 1 (2.1%) 11 (20.3%) 12 (22.2%) 6 (11.5%) 7 (13.5%)
DYSPNEA 4 (8.3%) 6 (12.5%) 3 (6.3%) 6 (11.1%) 8 (14.8%) 9 (16.6%) 8 (15.4%) 5 (9.6%)
THROMBOCYTOPENIA 9 (18.8%) 1 (2.1%) 1 (2.1%) 7 (13.0%) 1 (1.9%) 2 (3.7%) 11 (21.2%) 2 (3.8%) 7 (13.5%) 3 (5.8%)
EDEMA PERIPHERAL 6 (12.5%) 4 (8.3%) 1 (2.1%) 8 (14.8%) 3 (5.5%) 1 (1.9%) 7 (13.5%) 5 (9.6%)
COUGH 4 (8.3%) 1 (2.1%) 11 (20.3%) 2 (3.7%) 1 (1.9%) 12 (23.1%) 1 (1.9%) 1 (1.9%)
DEHYDRATION 2 (4.2%) 10 (20.8%) 2 (4.2%) 2 (3.7%) 5 (9.3%) 3 (5.5%) 5 (9.6%) 4 (7.7%)
ASTHENIA 1 (2.1%) 3 (6.3%) 4 (8.3%) 2 (3.7%) 6 (11.1%) 4 (7.4%) 1 (1.9%) 7 (13.5%) 4 (7.7%)
VOMITING 6 (12.5%) 4 (8.3%) 1 (2.1%) 6 (11.1%) 3 (5.5%) 2 (3.7%) 6 (11.5%) 1 (1.9%)
DIARRHEA 5 (10.4%) 3 (6.3%) 1 (2.1%) 5 (9.3%) 1 (1.9%) 3 (5.5%) 7 (13.5%) 2 (3.8%) 1 (1.9%)
WEIGHT DECREASED 3 (6.3%) 2 (4.2%) 7 (13.0%) 2 (3.7%) 8 (15.4%) 3 (5.8%)
PNEUMONIA 3 (6.3%) 7 (14.6%) 4 (7.4%) 3 (5.5%) 2 (3.8%) 3 (5.8%)
EPISTAXIS 2 (4.2%) 4 (7.4%) 1 (1.9%) 1 (1.9%) 9 (17.3%) 4 (7.7%)
PROTEINURIA 3 (5.5%) 7 (13.0%) 4 (7.7%) 2 (3.8%)
BACK PAIN 3 (6.3%) 3 (6.3%) 1 (2.1%) 1 (1.9%) 5 (9.3%) 1 (1.9%) 1 (1.9%)
INSOMNIA 3 (6.3%) 6 (12.5%) 3 (5.5%) 2 (3.8%) 1 (1.9%)
PYREXIA 10 (20.8%) 2 (3.7%) 1 (1.9%) 2 (3.8%)
RASH 4 (8.3%) 3 (5.5%) 3 (5.5%) 4 (7.7%) 1 (1.9%)
ABDOMINAL PAIN 2 (4.2%) 1 (2.1%) 2 (4.2%) 1 (1.9%) 2 (3.7%) 2 (3.8%) 4 (7.7%)
CHEST PAIN 1 (2.1%) 3 (6.3%) 1 (2.1%) 3 (5.5%) 2 (3.7%) 2 (3.8%) 1 (1.9%) 1 (1.9%)
HEADACHE 1 (2.1%) 7 (13.0%) 1 (1.9%) 2 (3.8%) 3 (5.8%)
HYPERTENSION 2 (3.7%) 5 (9.3%) 2 (3.7%) 1 (1.9%) 2 (3.8%) 2 (3.8%)
DIZZINESS 2 (4.2%) 1 (2.1%) 5 (9.3%) 2 (3.7%) 2 (3.8%) 1 (1.9%)
HYPERGLYCEMIA 1 (2.1%) 2 (4.2%) 1 (2.1%) 1 (1.9%) 1 (1.9%) 2 (3.8%) 3 (5.8%) 2 (3.8%)
ARTHRALGIA 2 (4.2%) 1 (2.1%) 5 (9.3%) 1 (1.9%) 2 (3.8%) 1 (1.9%)
CELLULITIS 2 (4.2%) 4 (8.3%) 1 (1.9%) 1 (1.9%) 3 (5.8%) 1 (1.9%)
DYSGEUSIA 4 (8.3%) 4 (7.4%) 1 (1.9%) 3 (5.8%)
PAIN IN EXTREMITY 2 (4.2%) 2 (4.2%) 2 (3.7%) 2 (3.7%) 1 (1.9%) 1 (1.9%) 2 (3.8%)
URINARY TRACT INFECTION 1 (2.1%) 1 (2.1%) 1 (1.9%) 4 (7.4%) 2 (3.8%) 3 (5.8%)
DEPRESSION 1 (2.1%) 3 (6.3%) 1 (2.1%) 1 (1.9%) 3 (5.5%) 1 (1.9%) 1 (1.9%)
ANXIETY 5 (10.4%) 2 (3.7%) 1 (1.9%) 1 (1.9%) 1 (1.9%)
CONFUSIONAL STATE 2 (4.2%) 2 (3.7%) 2 (3.7%) 1 (1.9%) 1 (1.9%) 2 (3.8%)
DYSPHONIA 1 (1.9%) 2 (3.7%) 6 (11.5%) 1 (1.9%)
MUCOSAL INFLAMMATION 1 (2.1%) 1 (1.9%) 4 (7.7%) 3 (5.8%) 1 (1.9%)
VISUAL IMPAIRMENT 3 (6.3%) 2 (4.2%) 2 (3.7%) 3 (5.8%)
COPD 2 (4.2%) 2 (4.2%) 2 (3.7%) 1 (1.9%) 2 (3.8%)
* All Adverse Events per CTCAE version 4 occuring in >5% of the total treated patient population

Conclusions
• This is the largest prospective trial of bevacizumab in poor performance status patients with advanced NSCLC.
• All three regimens were safe and well-tolerated.
• ORRs with Pem/Bev +/- Cb were encouraging and comparable to historical outcomes in patients with better performance status.

Efficacy and Safety of Paclitaxel and Carboplatin With Bevacizumab for the
First-Line Treatment of Patients With Nonsquamous Non–Small Cell Lung Cancer:
Analyses Based on Age in the Phase 3 E4599 and PointBreak Trials
CJ Langer,1 MA Socinski,2 JD Patel,3 AB Sandler,4 JH Schiller,5 L Leon,4 SJ Hazard,4 SS Ramalingam6
1Abramson Cancer Center, University of Pennsylvania, Philadelphia, PA; 2University of Pittsburgh Medical Center, UPMC Cancer Pavilion, Pittsburgh, PA; 3Feinberg School of Medicine, Northwestern University, Chicago, IL; 4Genentech, Inc., South San Francisco, CA; 5Harold C. Simmons Cancer Center, University of Texas Southwestern, Dallas, TX; 6Winship Cancer Institute of Emory University,
Atlanta, GA


S Ramalingam et al, JCO 2008
Outcomes for Elderly A-NSCLC Pts (28%)treated with bevacizumab + carboplatin and paclitaxel Retrospective Analysis of ECOG 4599 Trial

Randomized Phase III Trial
CBDCA+ PEM+ BEV x 4
CBDCA+ PEM+ BEV x 4
CBDCA+TAX+BEV X 4CBDCA+TAX+BEV X 4
Non squam NSCLC St IIIB wet/IVECOG PS 0-1 N. Pts: 900Pr Obj: = OS
Non squam NSCLC St IIIB wet/IVECOG PS 0-1 N. Pts: 900Pr Obj: = OS
RBEV until
TOX or PD
BEV until
TOX or PD
PEM + BEV
Until TOX or PD
PEM + BEV
Until TOX or PD
The PointBreak Study

PointBreak: OS from Randomization (ITT)
Pem+Cb+Bev Pac+Cb+Bev
OS median (mo) 12.6 13.4
HR (95% CI); P value 1.00 (0.86, 1.16); P=0.949
Survival rate (%)
1-year 52.7 54.1
2-year 24.4 21.2
Censoring rate for Pem+Cb+Bev was 27.8%; for Pac+Cb+Bev was 27.2%
0 3 6 9 12 15 18 21 24 27 30 33 36 39
0.0
0.1
0.2
0.3
0.4
0.5
0.6
0.7
0.8
0.9
1.0
Time from Induction (Months)
Su
rviv
al
Pro
ba
bil
ity
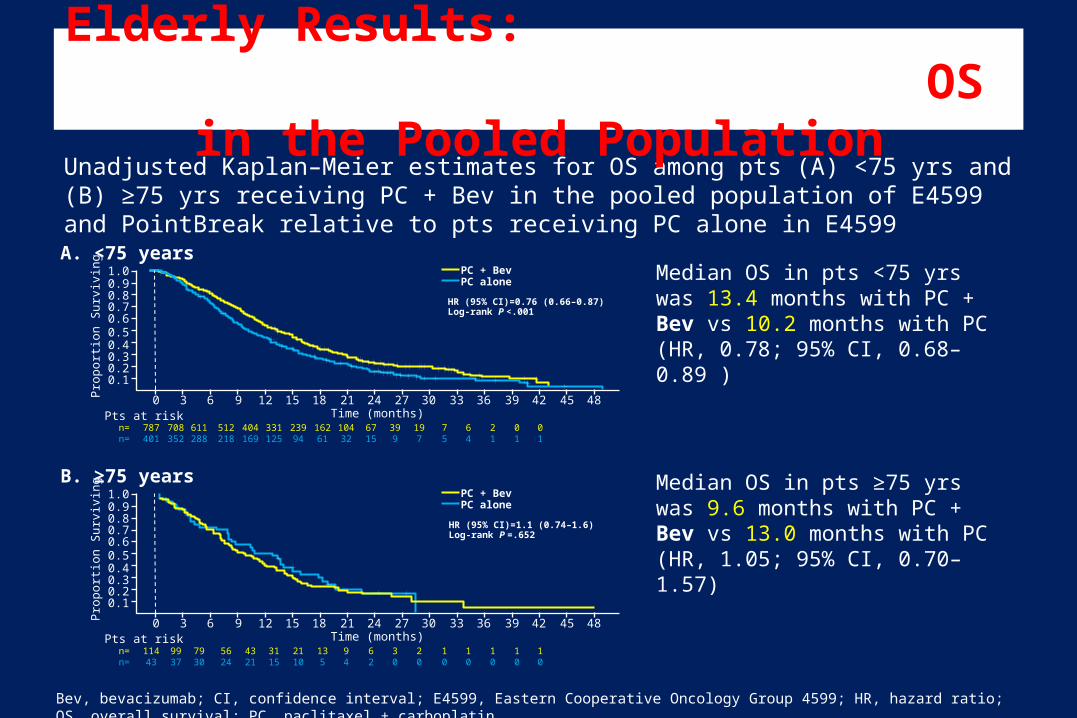
Unadjusted Kaplan–Meier estimates for OS among pts (A) <75 yrs and (B) ≥75 yrs receiving PC + Bev in the pooled population of E4599 and PointBreak relative to pts receiving PC alone in E4599
Elderly Results: OS in the Pooled Population
Bev, bevacizumab; CI, confidence interval; E4599, Eastern Cooperative Oncology Group 4599; HR, hazard ratio; OS, overall survival; PC, paclitaxel + carboplatin.
Median OS in pts <75 yrs was 13.4 months with PC + Bev vs 10.2 months with PC (HR, 0.78; 95% CI, 0.68–0.89 )
Median OS in pts ≥75 yrs was 9.6 months with PC + Bev vs 13.0 months with PC (HR, 1.05; 95% CI, 0.70–1.57)
A. <75 yearsPC + BevPC alone
HR (95% CI)=0.76 (0.66–0.87)Log-rank P <.001
484542393633302724211815129630
1.00.90.80.70.60.50.40.30.20.1P
ropo
rtio
n S
urvi
ving
Time (months)Pts at riskn= 787 708 611 512 404 331 239 162 104 67 39 19 7 6 2 0 0n= 401 352 288 218 169 125 94 61 32 15 9 7 5 4 1 1 1
B. ≥75 yearsPC + BevPC alone
HR (95% CI)=1.1 (0.74–1.6)Log-rank P =.652
484542393633302724211815129630
1.00.90.80.70.60.50.40.30.20.1P
ropo
rtio
n S
urvi
ving
Time (months)Pts at riskn= 114 99 79 56 43 31 21 13 9 6 3 2 1 1 1 1 1n= 43 37 30 24 21 15 10 5 4 2 0 0 0 0 0 0 0

Conclusions
• This exploratory, pooled analysis of pt data from the E4599and PointBreak studies demonstrated a statistically significant and clinically meaningful OS and PFS benefit with the addition of Bev to PC for all pts <75 yrs of age
• No significant PFS or OS benefit was observed for pts ≥75 yrs of age receiving PC + Bev compared with PC alone– Incidence of grade 5 events was 8% vs 2% for PC + Bev vs PC– However, the small number of pts in this subgroup (n=157) may not
allow firm conclusions to be made• Outside of a clinical trial, clinicians must use careful judgment
when administering Bev to pts ≥75 yrs with advanced NSCLC

The Spanish Lung Cancer Group (SLCG) BRCA1-RAP80 Expression Customization (BREC) randomized phase III
trial of customized chemotherapy in advanced non-small-cell lung cancer (NSCLC) patients with wild-type epidermal growth factor receptor (EGFR) (NCT00617656/GECP-
BREC)
Rafael Rosell1, Teresa Moran1, manuel A. Cobo Dols2, Manuel Domine3, Maria Sanchez-Ronco4, Isabel Bover5, Mariano Provencio6, Bartomeu Massuti7, Alain Vergnenegre8, Guillermo Lopez-Vivanco9, Gilles Robinet10, Amelia
Insa11, Margarita Majem12, Ramon De Las Peñas13, Maria Angeles Sala14, Dolores Isla15, Nathalie Baize16, Javier Garde17, Imane Chaib1, Carlos Camps18
1Catalan Institute Of Oncology, Badalona/SPAIN, 2HRU Carlos Haya, Malaga/SPAIN, 3Fundacion Jiménez-Díaz, Madrid/SPAIN, 4University of Alcala de Henares, Madrid/SPAIN, 5Hospital Son Llatzer, Palma De Mallorca/SPAIN, 6Hospital Puerta de Hierro,
Madrid/SPAIN, 7Hospital General de Alicante, Alicante/SPAIN, 8Centre Hospitalier Universitaire de LIMOGES, Limoges/FRANCE, 9Hospital de Cruces de Barakaldo, Vizcaya/SPAIN, 10Hôpital Morvan, Brest/FRANCE, 11Hospital Clínico Universitario, Valencia/SPAIN,
12Hospital de Sant Pau, Barcelona/SPAIN, 13Hospital de Castellon, Castellon/SPAIN, 14Hospital de Basurto, Bilbao/SPAIN, 15Hospital Lozano Blesa, Zaragoza/SPAIN, 16Hôpital de l'Archet, Nize/FRANCE, 17Hospital Arnau de Vilanova, Valencia/SPAIN, 18Hospital Clínico
Universitario de Valencia, Valencia/SPAIN

EXPERIMENTAL T2-T3 RAP80 (T1-T2 BRCA1)
T2-T3 RAP80 (T3 BRCA1)
Gem/Cis
Docetaxel
Docetaxel/Cis
T1 RAP80(T1-T3 BRCA1)
BREC (BRCA1 RAP80 Expression Customization)
CONTROL Docetaxel/Cis
Advanced NSCLC 1:1
25Presented by: Rafael Rosell

Experimental Group 1 (n=45): 5.4 months ( 95% CI 5.08-5.77)5.4 months ( 95% CI 5.08-5.77)
Control Arm (n=142): 5.5 months ( 95% CI 5.08-5.91)
Experimental Group 2 (n=49): 5.5 months ( 95% CI 3.83-7.16)5.5 months ( 95% CI 3.83-7.16)
Experimental Group 3 (n=43): 2.5 months ( 95% CI 1.16-3.84)
Control
Exp. Group 1Exp. Group 2
Exp. Group 35·52·5
Patients at risk
5·45·5
PFS in control arm and in the experimental groups

27
OS in control arm and in the experimental groups
Control
Exp. Group 1
Exp. Group 2
Exp. Group 3
Patients at risk
7·7 12·77·2
11·3
Experimental Group 1 (n=45): 7.7 months ( 95% CI 3.85-11.55)
Control Arm (n=142): 12.66 months ( 95% CI 10.07-15.26)
Experimental Group 2 (n=49): 11.3 months ( 95% CI 7.66-14.84)
Experimental Group 3 (n=43): 7.3 months ( 95% CI 5.36-9.11)
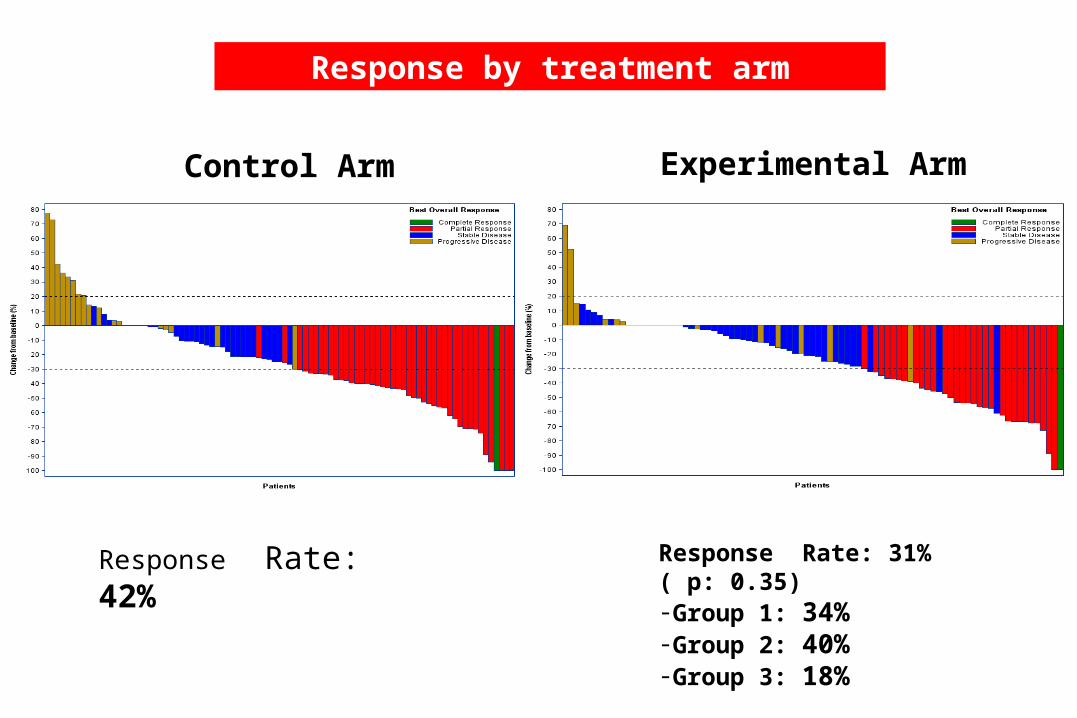
Control Arm Experimental Arm
Response by treatment arm
Response Rate: 42% Response Rate: 31% ( p: 0.35)-Group 1: 34%-Group 2: 40%-Group 3: 18%

• Prespecified interim analysis of the BREC trial showed a detrimental
effect in the experimental arm.
• BREC trial was prematurely closed
• Interaction between PS and treatment arm.
– Favorable non- significant effect for the experimental arm among patients with
ECOG PS 0
– Significant increased risk of death in the experiental ar in atients with ECOG PS1
• We are currently examining alternative biomarkers that could elucidate
DNA repair mechanisms.
Conclusions

First-line erlotinib versus cisplatin/gemcitabine (GP) in patients with advanced EGFR mutation-positive non-small-cell lung cancer
(NSCLC): phase 3, open-label, ENSURE study
Yi-long Wu,1 Chong-Kin Liam,2 Caicun Zhou,3 Gang Wu,4 Xiaoqing Liu,5 Zhaoyang Zhong,6 Shun Lu,7 Ying Cheng,8 Baohui Han,7 Lei Chen,9 Yunzhong Zhu,10 Shukui Qin,11 Cheng Huang,12 Hongming Pan,13 Houjie
Liang,14 Enxiao Li,15 Soon Hin How,16 Guoliang Jiang,17 Marie Cherry Lynn Fernando,18 Meng Chen,19
Yunxia Zuo,19 Guia Ladrera20
1Guangdong Lung Cancer Institute, Guangdong General Hospital & Guangdong Academy of Medical Sciences, Guangdong, China; 2Department of Medicine, Faculty of Medicine, University of Malaya, Kuala Lumpur, Malaysia; 3Department of Oncology, Affiliated Shanghai Pulmonary Hospital of Tongji University,
Shanghai, China; 4Cancer Centre of Union Hospital, Tongji Medical College, Huazhong University of Science and Technology, Wuhan, China; 5Internal Medicine Tumor Department, 307 Hospital of the Academy of Military Medical Sciences, Beijing, China; 6Cancer Centre, Research Institute of Surgery, Daping
Hospital, Third Military Medical University, Chongqing, China; 7Department of Lung Cancer, Shanghai Chest Hospital, Shanghai, China; 8Jilin Cancer Hospital, Changchun, China; 9Medical Oncology Department, Cancer Hospital of Shantou University Medical College, Shantou, China; 10Lung Cancer Department,
Beijing Tuberculosis and Thoracic Tumor Research Institute, Beijing, China; 11Nanjing Bayi Hospital, Nanjing, China; 12Fujian Provincial Tumor Hospital, Fujian, China; 13Department of Oncology, Sir Run Run Shaw Hospital, Hangzhou, China; 14Affiliated Xinan Hospital of Third Military Medical University,
Chongqing, China; 15First Affiliated Hospital, Medical School Xi’an Jiaotong University, Xi’an, China; 16Hospital Tengku Ampuan Afzan, Kuantan, Malaysia; 17Cancer Hospital, Fudan University, Shanghai, China; 18Manila Doctors Hospital, Manila, the Philippines; 19Roche (China) Holding Ltd; 20Lung Center of the
Philippines, Quezon City, Philippines

Kaplan–Meier curves for PFS assessed by IRC

ORR and DCR results• OS data were still immature at the latest data cut-off
• ORR and DCR for the interim and updated analyses are shown

EGFR mutation subgroup analysis
• Meaningful treatment benefit was observed in both EGFR mutation type subgroups (exon 19 deletions and exon 21 L858R mutations), and was more marked in the exon 19 deletion subgroup

AEs of special interest

Conclusions
• These analyses demonstrate that erlotinib provides statistically significant and clinically meaningful improvement in investigator-assessed PFS, which was corroborated by IRC assessment, compared with GP in Asian patients with EGFR mutation-positive NSCLC
• Primary efficacy results were also supported by secondary endpoints including ORR and DCR, with no new safety concerns compared with previous studies of erlotinib
• These results support the data from other first-line studies in Asian populations, showing that erlotinib provides a PFS benefit over chemotherapy in this patient subgroup with EGFR mutation-positive NSCLC1,2
1. Zhou C, et al. Lancet Oncol 20112. Goto K, et al. Lung Cancer 2013

Activity of afatinib in uncommon epidermal growth factor receptor (EGFR) mutations:
Findings from three prospective trials of afatinib in EGFR mutation-positive lung cancer
J. C.-H. Yang1, L.V. Sequist2, S. L. Geater3, C.-M. Tsai4, T. Mok5, M. H. Schuler6,N. Yamamoto7, D. Massey8, V. Zazulina8, Yi-Long Wu9
1National Taiwan University Hospital, Taipei, Taiwan; 2Massachusetts General Hospital, Boston, MA, USA; 3Division of Respiratory and Respiratory Critical Care Medicine, Department of Internal Medicine, Faculty of Medicine,
Prince of Songkla University, Songkhla, Thailand; 4Taipei Veterans General Hospital, Taipei, Taiwan; 5The Chinese University of Hong Kong, Hong Kong; 6West German Cancer Center, University Duisburg-Essen, Essen, Germany; 7Shizuoka Cancer
Center, Shizuoka, Japan; 8Boehringer Ingelheim Limited, Bracknell, UK; 9Guangdong Lung Cancer Institute, Guangdong General Hospital and Guangdong Academy of Medical Sciences, Guangzhou, China

EGFR mutation-positive patients in LUX-Lung trials
Patients with uncommon mutations treated with afatinib
3
Uncommonn=75

Objective response and disease control rates
De novo T790M n=14
Exon 20 insertions n=23
Other n=38
Objective response rate (CR + PR), n (%) 2 (14.3%) 2 (8.7%) 27 (71.1%)
Median duration of response, months (range)
8.2 (4.1–12.4) 7.1 (4.2–10.1) 11.1 (1.3–35.0+)
Disease control rate (CR + PR + SD), n (%) 9 (64.3%) 15 (65.2%) 32 (84.2%)
Independent review
Progression-free survival and overall survival in patients
De novo T790M n=14
Exon 20 insertions n=23
Other n=38
Median PFS, months (range)
2.9 (0.3−13.8)
2.7 (0.4-11.9)
10.7 (0.0+-35.8+)
Median OS, months(range)
14.9 (1.5-30.5)
9.4 (0.4-32.2+)
18.6 (0.0+-51.3+)
Independent review

Conclusions• Largest prospective dataset in patients with uncommon EGFR mutations
(n=75)
• High heterogeneity within the subgroup with uncommon EGFR mutations
• Low response rate in patients with exon 20 insertions and T790M tumours– Durable tumour control observed in some cases (PFS up to 13.8
months)
• Activity was observed in other exon 18 (G719X), 20 (S768I) and 21 (L861Q) mutations that are known to be less responsive to reversible EGFR TKIs– Activity was in the range of efficacy observed with afatinib in common EGFR mutations
INDIRECT COMPARISONS OF EFFICACY AND SAFETY PROFILE OF EGFR TYROSINE
KINASE INHIBITORS AS FIRST-LINE TREATMENT IN EGFR MUTATED NSCLC PATIENTS: A SYSTEMATIC REVIEW AND
META-ANALYSISEva Regina Haspinger*, Francesco Agustoni*, Francesco
Gelsomino*, Marina Chiara Garassino*, Valter Torri** and Michela Cinquini**
* Department of Medical Oncology, Fondazione IRCCS Istituto Nazionale dei Tumori, Milan, Italy**Laboratorio di Metodologia per la Ricerca Biomedica Dipartimento di Oncologia "IRCCS - Istituto di Ricerche Farmacologiche Mario Negri"

RESULTS: Relative Risks for PFS

RESULTS: Relative Risks for overall response rate
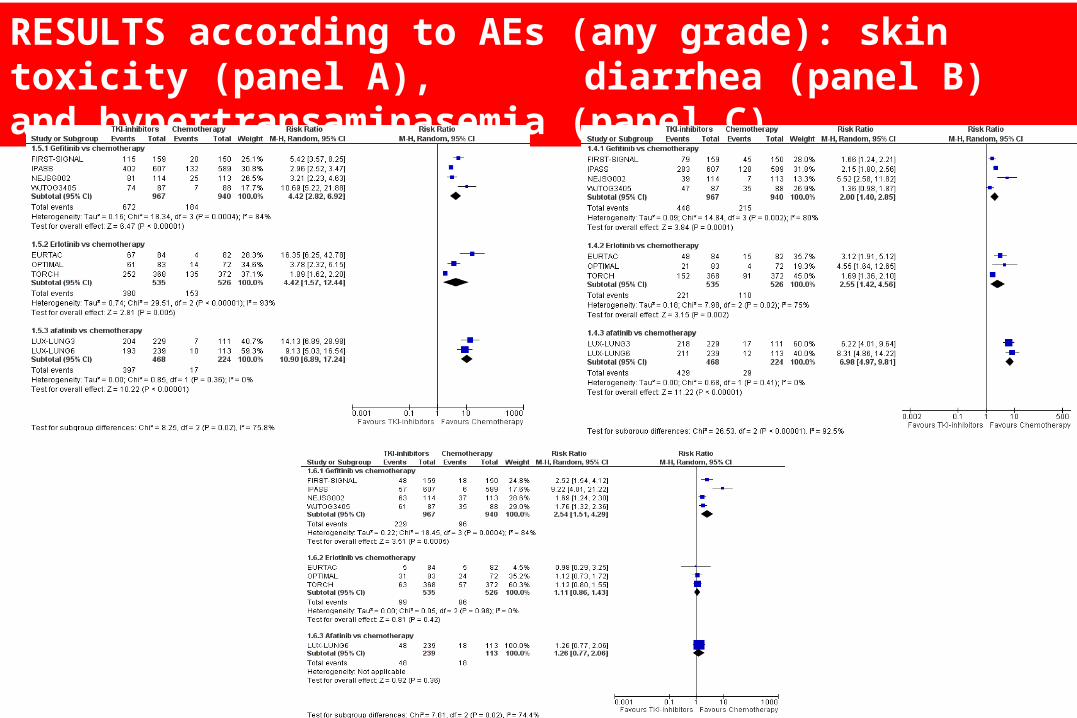
RESULTS according to AEs (any grade): skin toxicity (panel A), diarrhea (panel B) and hypertransaminasemia (panel C)

Indirect comparisons among EGFR-TKIs: Panel A (gefitinib vs erlotinib), panel B (gefitinib vs afatinib), panel C (erlotinib vs afatinib)
Panel A
Panel B
Panel C