Embed Size (px)
Citation preview
Certainty, Severity, and their Relative Deterrent Effects: Questioning the Implications of the Role of Risk in Criminal Deterrence
Policy
Abstract. In the late 60s, Gary Becker incorporated into his formal model of deterrence theory an explicit statement that the theory´s components—certainty and severity of punishment—are more or less influential than one another depending on an individual´s preference for risk. The certainty of punishment is more influential than the severity of punishment in the decision of whether or not to commit crime if an individual is risk acceptant; if a criminal is risk averse, then the severity of punishment is more important than the certainty of punishment. Many aggregate deterrence studies arrive at estimates that reveal varying effects of the certainty and severity components of deterrence theory, with the certainty of punishment carrying the greater, and many times the only, weight. Leaning on Becker´s extension of deterrence theory, empiricists assume that criminals have a preference for risk. Assertions that arrests and convictions are greater deterrent tools imply important worldly consequences because they indicate to governmental authorities where resources should be invested to insure the best deterrent payoff. In this paper, I question both the need to take risk into consideration in aggregate level deterrence studies and the empirical evidence that has been offered in support of attaching greater weight to the certainty of punishment. I show, first, that deterrence theory, from an applied policy standpoint, is encumbered through the explicit consideration of risk preferences. Next, I work through the algebra of the statistical formulations of deterrence models and demonstrate that the greater weight associated with certainty could well be an artifact of the model specification. Finally, I reanalyze data that appear to be consistent with the greater weight for certainty than severity argument and show that the evidence does not support that inference. Potential criminals mentally combine the three deterrence components—regardless of whether they are risk neutral, averse, or acceptant. I conclude by considering what it means to a worldly application of criminal deterrence theory to place equal weight on the certainty and the severity of punishment.
In the criminal deterrence literature, three elements, combined, produce an expected cost of
punishment: the probability of arrest, the probability of conviction, and the severity of punishment.
Either by raising the certainty that a criminal will be punished—through the increased probability of
arrest and/or the probability of conviction of those arrested—or by raising the severity of punishment
through extended time served in prison, a government should be able to reduce the crime rate in its
jurisdiction. So says the theory. The theoretical logic of criminal deterrence is disarmingly simple and,
perhaps for that reason, persuasive. It is supposed to reduce crime by setting the expected cost of
committing a crime high enough to dissuade potential criminals from choosing to commit illegal acts.
In theory, analysis, and practice, however, things are not so simple.
1
There is a widely-held notion in the literature that the three deterrence elements have differential
effects on the expected cost of punishment. Many existing empirical deterrence studies allow us to draw
the inference that the magnitude of the effect of the certainty of punishment, particularly the probability
of arrest, is greater than that of the effect of the severity of punishment (Eide, 1994; Witte, 1983). The
disagreement regarding the differential roles of the certainty and the severity of punishment divide
scholars into three general groups. At one extreme, there are deterrence analysts who would have us
believe that the severity of punishment is of little consequence (Eide, 1994; Decker and Kohfeld, 1990;
Witte, 1983). In the middle, there are theorists and analysts who tell us that severity is relatively less
important than the certainty of punishment (e.g., Becker, 1968; Ehrlich, 1973). At the other extreme,
there are those scholars who believe the elements should be equally important (e.g., Chambliss, 1966;
Tittle, 1969; Gibbs, 1968; Gray and Martin, 1969; Antunes and Hunt, 1973; Logan, 1972; Grasmick and
Bryjak, 1980; Mendes and McDonald, 2001). Among the authors of this last group is Gordon Tullock
(1974, p.107), who questions “whether the severity of the sentence or the likelihood that it will be
imposed is more important in deterring crime. In my opinion, this is not a very important question. Why
should it matter if a criminal faces a one-in-100 probability of being convicted for one year in prison or
a one-in-1000 probability of being imprisoned for 10 years?” In both cases, the expected cost for the
criminal is precisely the same.
There are three possible explanations in the economics, sociology, psychology, and criminology
literatures for why these authors disagree on the deterrent power of each element of deterrence theory.
One explanation lies with the magnitude differential of these elements and can be justified on the
grounds of an attitudinal, unobservable feature—risk—that Gary Becker (1968) built into deterrence
theory for reasons that go back to the beginning of criminology and has gone, for the most part, largely
unchallenged. Most empiricists, beginning with Ehrlich (1973) and Sjoquist (1973), have tacitly
accepted risk in the statistical models they employ to test deterrence theory. Another explanation might
rest with the issue of the potential incorporation of time horizons into their reasoning so that proximity
2
or longevity of punishment in time, that is, the celerity of punishment, affects whether certainty or
severity has the greater bearing on the expected cost of punishment. Individuals vary as to how they
value and discount time. Although scholars may not have been using terms such as discount factors at
the time, the celerity or swiftness of punishment goes back to Beccaria and Bentham. One final
justification for a source of variability among the deterrence elements are what are called extra-legal
consequences associated with criminal behavior. These are often referred to as informal self- and
society-imposed sanctions such as shame, embarrassment, and stigma. Individuals differ as to how they
regard being arrested, tried, convicted, and/or serving time.
While these different exponential effects may sound inconsequential, the weights issue has large
and undeniably important consequences for both the theory and application of deterrence. From a
theoretical perspective, making the theory of criminal deterrence comport with differential weights for
certainty and severity is no minor theoretical encumbrance, as Block and Heineke (1975) have shown
(see also Witte, 1983). From an applied policy perspective, the idea that arresting deters more than
convicting or upping the statutory penalty or imposed sentence makes a real difference. Differential
weights have a role in telling governments how much of a return for crime reduction they can expect by
putting their limited resources into apprehending and convicting criminals instead of punishing those
who have been convicted more severely. Because it makes a world of difference, a serious discussion
and investigation into the possibility of varying weights is past due.
In this paper, I ask whether any theoretical reason, while interesting in itself for individual level
studies, are necessary to test the theory from a policy standpoint. While I am aware of the relevance of
these questions for perceptual deterrence studies, aggregate studies need not occupy themselves with it.
My purpose is to question the role that preferences, particularly risk, play in deterrent strategies. I
believe that empirical findings supporting the differential weights may be artifactual in nature. This
paper unfolds in three parts. First, I discuss how deterrence theory, from an applied policy standpoint, is
encumbered through the explicit consideration of risk preferences. Next, I work through the algebra of
3
the statistical formulations of deterrence models and demonstrate that the greater weight associated with
certainty could well be an artifact of the model specification. Finally, I reanalyze data that appear to be
consistent with the greater weight for certainty than severity argument and show that the evidence does
not support that inference.
The Relative Importance of the Certainty and Severity of Punishment in Deterrence Theory and Application
If we simply listen to what deterrence theory says, the certainty and severity of punishment
should have equal standing as deterrent factors because they operate in conjunction with one another to
produce an expected cost of committing a crime. Yet, scholars have long insisted on the idea that
rational individuals perceive the effects of the probabilities of arrest and conviction and the severity of
punishment differently (Becker, 1968; Ehrlich, 1973; Eide, 1994; Decker and Kohfeld, 1990; Witte,
1983). There has been an unsettling two-fold doubt regarding the ambiguity of effects of the severity of
punishment in deterrence theory going back to the eighteenth century. First, many empirical studies
suggest and sometimes insist that severity does not have a deterrent effect; and, second, when severity is
found to have an effect, it is not as strong as the effect of the certainty of punishment. Leaving the
severity of punishment out of the theory, however, would “unbundle” the package (Mendes and
McDonald, 2001). It is the idea that individuals perceive the deterrent components in conjunction that is
key to comprehending deterrence theory.
The idea of the certainty and severity of punishment having different deterrent effects can be
traced back to the Classical school of criminology. Recall that Beccaria (1965), Bentham (1789), and
Montesquieu (1993) placed more emphasis on the certainty (and also on the celerity) of punishment than
on the severity of punishment. The reason for this is based on their reaction to the cruelty of the Ancient
Regime.
“Bentham and Beccaria thought that the certainty of punishment (of paying) is most
important if the punishment (the price) is to deter. This stress on certainty is sometimes
4
used to question the comparative effectiveness of severity. But Bentham and Beccaria
meant to correct a contemporary situation: in the eighteenth century penalties were still
extremely severe, but they were, perhaps for this reason, haphazardly applied and therefore
uncertain.” (van den Haag, 1975, p. 115).
At the time, inflicted punishment was excessive compared to the crime committed. With this in mind, it
is understandable that the Classicists´ call for legal reform necessarily leaned toward the utilitarian
notion of retribution or just deserts and away from any emphasis on the severity of punishment.
Since then, theorists and analysts alike have insisted on distinguishing the relative importance of
the certainty and severity of punishment. When the social scientists of the 20th century began
investigating deterrence theory, this notion of differential importance between the two elements stuck.
Sociologists and psychologists in the early to mid 20th century began stressing the force of informal
normative effects on individuals´ perception of punishment.
Preference for Risk and the Variation in the Deterrent Effects of the Certainty and Severity of
Punishment.
Gary Becker (1968) is widely recognized for his seminal contribution to the study of crime. He is
credited for having revived and updated the Utilitarian thought on crime by having elaborated the first
formal model of deterrence theory with the mathematical contemplation of the preference for risk, thus
providing economists and other social scientists with an “excuse” to find a variation in the relative
importance of the certainty and severity of punishment. Specifically, he developed a theoretical
economic approach to deterrence that Ehrlich (1973) later augmented to include both positive and
negative incentive—the market model.
According to Becker´s individual utility model: O = O (p, f, u), O, the average number of
offenses, is a function of the average probability of being convicted (p), average punishment (f), and a
vector of average socio-economic forces (u). An increase in either the certainty or the severity of
5
punishment will reduce the expected utility associated with the crime. But Becker´s formulation of
deterrence theory also states that the certainty and severity of punishment is conditional upon criminals´
attitude towards risk. According to this addendum to deterrence theory, risk-acceptant individuals are
deterred more by higher probabilities of arrest and conviction than by more severe punishment. On the
theoretical side, Becker´s objective in having come up with the formal solution to incorporate risk in
deterrence theory was to corroborate a two-century-old “judicial hunch” that the deterrent force of the
certainty and severity of punishment is conditional upon criminals´ attitude towards risk (Shawcross,
1965),
“…a common generalization by persons with judicial experience is that a change in the
probability has a greater effect on the number of offenses than a change in the punishment,
although, as far as I can tell, none of the prominent theories shed any light on this relation.”
(Becker, 1968, p.176).
To accommodate this view, Becker added an attitudinal feature to his formal deterrence model—risk.
The impact of certainty and severity on the crime rate differs depending on whether the criminal is risk
neutral, risk averse, or risk acceptant. In other words, if the criminal is risk acceptant, then the certainty
of punishment will be more influential in the decision of whether or not to commit crime than an
increase in the severity of punishment; if a criminal is risk averse, then an increase in the severity of
punishment will have a greater deterrent effect. Only if the criminal is risk neutral will certainty and
severity have equal-standing deterrent effects.
According to Becker, then, the certainty and severity components are clearly identified as two
equally relevant options available to reduce crime. Although deterrence theory in its most basic form
(Becker, 1968) does not specify which of its elements should have a greater inhibiting effect on potential
criminals, Becker was clearly concerned with the historical idea that the certainty of punishment carries
a greater weight relative to the severity of punishment. On the empirical side, this discussion on the
6
varying weights of the two components due to the role of risk has rested on this longstanding, unrefuted
notion of the greater deterrent force of the certainty of punishment.
Overburdening the Theory with Differential Weights of the Certainty and Severity of Punishment
Deterrence theory is embodied in rational choice theory, and, as such, it focuses on the
individual, meaning that the individual is the actor making the decision (von Neumann and Morgenstern,
1944; Luce and Raiffa, 1957; Lalman, Oppenheimer, and Swistak, 1993). Becker´s model, recall, is an
individual utility model. In the decisionmaking, there is an objective, factual component and a subjective
component (Bernstein, 1996). Criminal decisionmaking is no different. The subjective component is the
expected utility of committing a crime, which varies from individual to individual, utility being based on
the value each individual attributes to a given good or activity. The objective component is the expected
cost of committing a crime, which is the same for everyone. In the case of individual level deterrence
studies, there is an objective component based on formal or legal sanctions and a subjective component
based on informal or extra-legal sanctions. These legal and extra-legal sanctions combine to make up the
expected utility of committing a crime. But in the case of aggregate level deterrence studies, there is
only an objective component to decisionmaking. This is because only at the individual level can
attitudes and preferences be contemplated. The problem is that many nonindividual level empirical
studies—aggregate level studies—supposedly provide support for Becker´s risk solutions as if they test
the individual causal relationships of the utility model.
On the theoretical side, since many decision models are based on individual behavior, the
individual level of analysis is thought by many to be the most appropriate level of analysis. In analyzing
policy initiatives, this is not the case; rather, the aggregate level is best level of analysis (Morton, 1999).
There are “(…) propositions that are true in the aggregate but not in detail.” (Schelling, 1957, p.49).
When moving from the individual to the aggregate level, we lose information. This is necessarily so
7
because the aggregate level cannot accommodate the infinite variation in individuals´ preferences. This
is why economic models do not deal with individual traits, such as preferences.
Policymakers operate at the aggregate level; they do not deal with individual aspects of
deterrence, thus, for the purpose of policymaking, there is no need to incorporate individual or
attitudinal features. At the policy stage, it is the aggregate that counts and not how each actor reacts
within his/her constraints and with his/her preferences. It is one thing to test individual-level causal
theories and another to test aggregate-level relationships (Schelling, 1957; Bartels and Brady, 1993).
Models are useful in policymaking when they reflect many behaviors. Risk, operating as a preference, is
therefore not a useful concept at the aggregate level. Deterrence theory at the aggregate level does not
provide us with information on the effects of changes in tastes and preferences. These are assumed to be
constant. Once we deal with ratio figures we are far from understanding the behavior and incentives that
led to these figures. Thus, aggregate deterrence studies should be carried out without delving into
attitudinal-related variations, namely risk.
“The simple mathematics of ratios and mixtures tells us something about what
outcomes are logically possible, but tells us little about the behavior that leads to, or at least
away from, particular outcomes (…) knowledge of individual behaviors will not by itself
lead either to predictions of aggregate outcomes or to policies for affecting those outcomes.
Attention must be paid to the macrophenomena that are the object of policy.” (Shelling,
1978, pp. 142; 183).
On the empirical side, in aggregate level deterrence studies, attitudes, such as risk, are not directly
analyzable because statistical models cannot and should not incorporate the psychological element of
risk. As some authors (Chauncey, 1975; Gibbs, 1975; Tittle, 1980; Wilson and Herrnstein, 1985; von
Hirsch et al., 1999) have argued in regard to other attitudinal features, such as the timing of punishment,
these are not empirically nor statistically treated as a core component in aggregate level deterrence
studies. Their place, as with the preference for risk, should lie at the micro-level.
8
Despite the fact that risk is not directly incorporable in the statistical representation of deterrence
at the aggregate level, the bulk of empirical deterrence findings lends support for Becker´s theoretical
solutions simply because the coefficients of the variables used to measure the certainty and severity of
punishment are found to vary. Based on Becker´s theoretical risk-dependent alternatives, the sole fact
that certainty has been found to carry the greater effect has led empiricists to conclude that criminals are
generally risk preferrers, thus suggesting to policymakers that certainty has a greater deterrent payoff
than the severity of punishment.
Of course, I do not wish to imply that risk and other preferences do not play a role in deterrence
theory. Although both individual level and aggregate level deterrence studies are important for the
pursuit of knowledge on how individuals react or not to elements of deterrence, it is the expected cost of
punishment that is central to governmental intervention to reduce criminal activity. I want to know if
leaving psychological features to the side as individual level characteristics, as are tastes and preferences
in economic models, would violate the essence of the theory at the aggregate level? If not, then there
would be no theoretical reason to expect different magnitudes of the effects of certainty and severity of
punishment.
On this basis, the role of attitudinal features in aggregate deterrence studies remains to be refuted.
Does the reasoning criminal really consider getting caught, getting convicted, and the actual sentence he
or she will have to pay or serve separately or rather as a combined effect? If not, then the consistency
between the theory, including the provisions for risk, and the evidence of varying weights may simply
constitute a methodological artifact of the way the components are measured. This means the certainty
of punishment may not have a greater deterrent force after all. If so, the question then becomes: To
what extent can we believe in what we have been told about the evidence of varying weights in
deterrence theory? How can we trust the inferences that have been drawn from the findings in the
empirical literature? This is of great importance for policymakers because empirical studies serve to help
indicate where the resources of the criminal justice system should be channeled so as to arrive at the
9
best, overall deterrent payoff. If studies indicate, perhaps incorrectly, a greater deterrent impact of the
probability of arrest, then more resources will misguidedly be spent on catching criminals. If the
psychological element of risk can be put aside theoretically, as is done empirically, one would be able to
simplify an otherwise complex idea. And to do that, then one must question the variation in the
coefficients of the deterrence components.
Analysis of the Differential Effects of the Certainty and Severity Components of Punishment—Fact or Artifact? In this section, I present an algebraic and empirical analysis of the variation in the weights of the
certainty and severity components of punishment. For this I use the log-linear model specification, given
that it is the only model specification that respects the multiplicative relationship among the deterrence
components, necessary in statistical representations of deterrence theory (see Mendes and McDonald
(2001) for an exception and detailed demonstration of this argument).
The log-linear functional form explicitly allows for each of the deterrence components to have
its own, separate deterrent effect on the crime rate, while preserving the interaction among them. Thus,
the log-linear functional form can give us different impacts on the crime rate for the deterrence
components; that is, it allows for a variation in each component´s deterrent weight. Also, when
estimating a log-linear model, arrests generally tend to get the most deterrent credit for having the
greatest effect on the reduction of the crime rate. As would be expected, this has very real and serious
implications for public authorities when it comes time to allocate scarce budgetary resources. More of
these resources will likely go to hiring more police or providing them with better equipment. This
means that the emphasis is placed on arresting criminals and raising the probability of arrest. But to what
extent can we trust that the weights of the certainty and severity measures really do vary? The question
that has been slowly unfolding is what if the empirical literature has inadvertently led policymakers in
the wrong direction? Is it possible that this variation is merely an artifact of how the deterrent
components of a statistical model designed to test deterrence theory are constructed? By algebraically
10
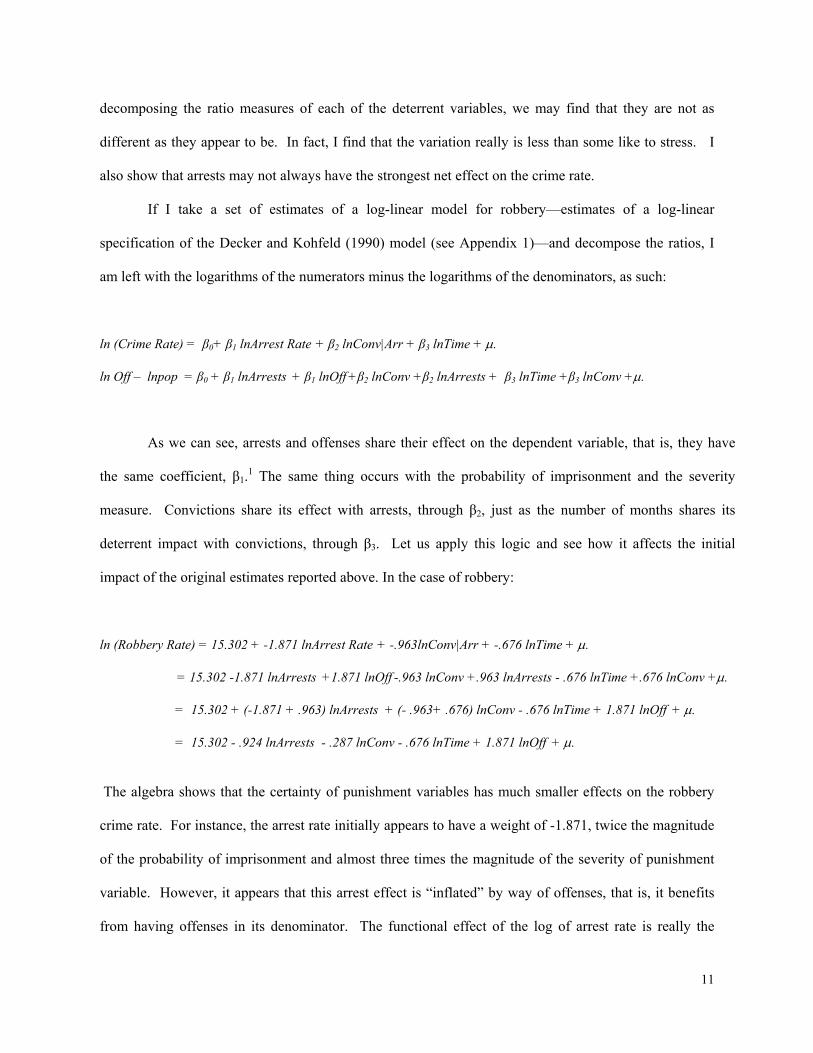
decomposing the ratio measures of each of the deterrent variables, we may find that they are not as
different as they appear to be. In fact, I find that the variation really is less than some like to stress. I
also show that arrests may not always have the strongest net effect on the crime rate.
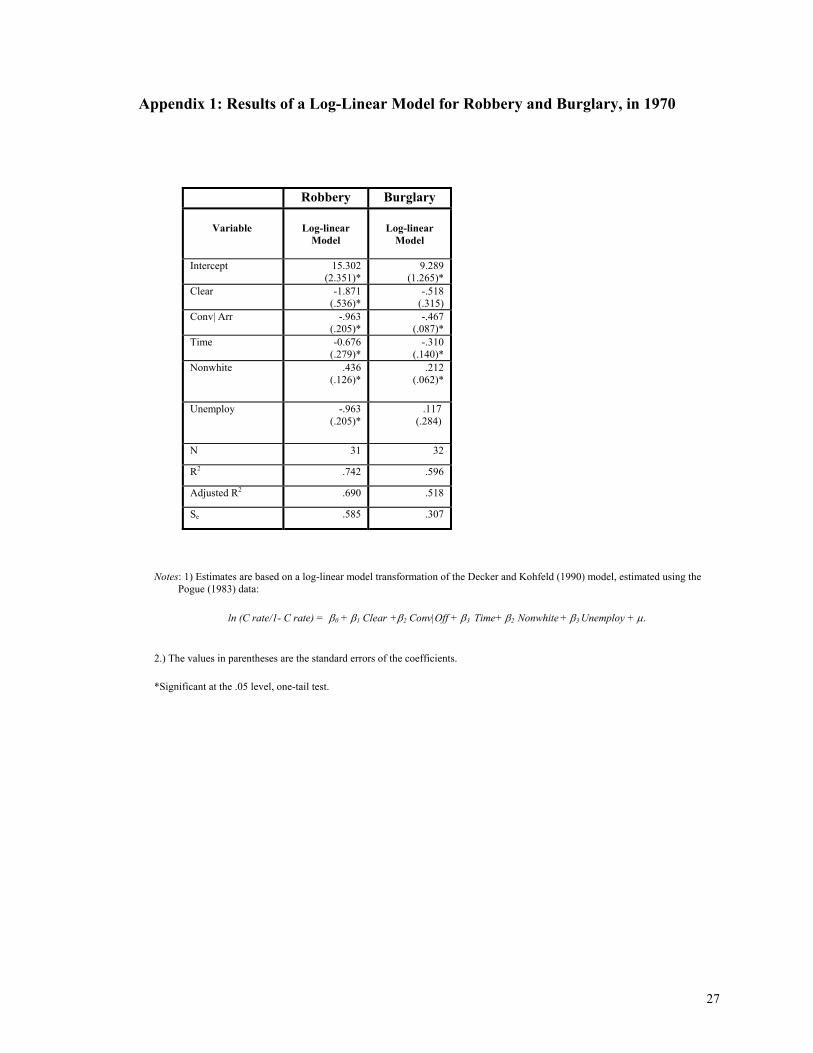
If I take a set of estimates of a log-linear model for robbery—estimates of a log-linear
specification of the Decker and Kohfeld (1990) model (see Appendix 1)—and decompose the ratios, I
am left with the logarithms of the numerators minus the logarithms of the denominators, as such:
ln (Crime Rate) = β0+ β1 lnArrest Rate + β2 lnConv|Arr + β3 lnTime + µ.
ln Off – lnpop = β0 + β1 lnArrests + β1 lnOff +β2 lnConv +β2 lnArrests + β3 lnTime +β3 lnConv +µ.
As we can see, arrests and offenses share their effect on the dependent variable, that is, they have
the same coefficient, β1.1 The same thing occurs with the probability of imprisonment and the severity
measure. Convictions share its effect with arrests, through β2, just as the number of months shares its
deterrent impact with convictions, through β3. Let us apply this logic and see how it affects the initial
impact of the original estimates reported above. In the case of robbery:
ln (Robbery Rate) = 15.302 + -1.871 lnArrest Rate + -.963lnConv|Arr + -.676 lnTime + µ.
= 15.302 -1.871 lnArrests +1.871 lnOff -.963 lnConv +.963 lnArrests - .676 lnTime +.676 lnConv +µ.
= 15.302 + (-1.871 + .963) lnArrests + (- .963+ .676) lnConv - .676 lnTime + 1.871 lnOff + µ.
= 15.302 - .924 lnArrests - .287 lnConv - .676 lnTime + 1.871 lnOff + µ.
The algebra shows that the certainty of punishment variables has much smaller effects on the robbery
crime rate. For instance, the arrest rate initially appears to have a weight of -1.871, twice the magnitude
of the probability of imprisonment and almost three times the magnitude of the severity of punishment
variable. However, it appears that this arrest effect is “inflated” by way of offenses, that is, it benefits
from having offenses in its denominator. The functional effect of the log of arrest rate is really the
11
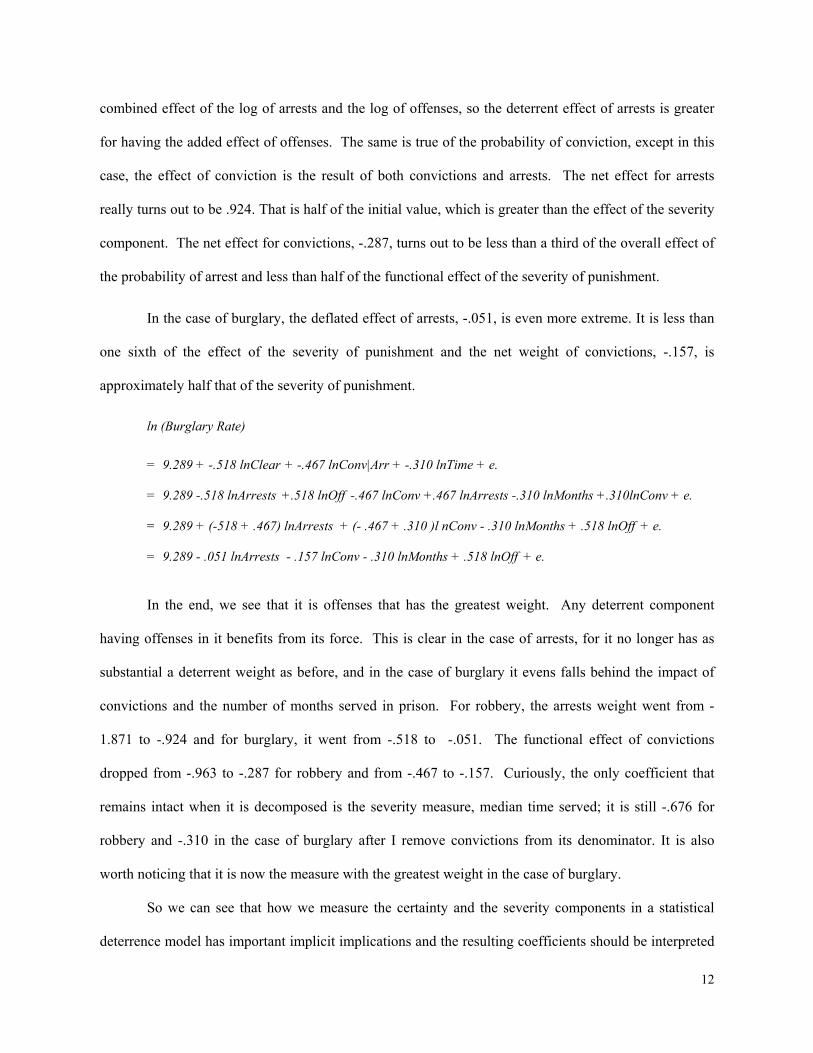
combined effect of the log of arrests and the log of offenses, so the deterrent effect of arrests is greater
for having the added effect of offenses. The same is true of the probability of conviction, except in this
case, the effect of conviction is the result of both convictions and arrests. The net effect for arrests
really turns out to be .924. That is half of the initial value, which is greater than the effect of the severity
component. The net effect for convictions, -.287, turns out to be less than a third of the overall effect of
the probability of arrest and less than half of the functional effect of the severity of punishment.
In the case of burglary, the deflated effect of arrests, -.051, is even more extreme. It is less than
one sixth of the effect of the severity of punishment and the net weight of convictions, -.157, is
approximately half that of the severity of punishment.
ln (Burglary Rate)
= 9.289 + -.518 lnClear + -.467 lnConv|Arr + -.310 lnTime + e.
= 9.289 -.518 lnArrests +.518 lnOff -.467 lnConv +.467 lnArrests -.310 lnMonths +.310lnConv + e.
= 9.289 + (-518 + .467) lnArrests + (- .467 + .310 )l nConv - .310 lnMonths + .518 lnOff + e.
= 9.289 - .051 lnArrests - .157 lnConv - .310 lnMonths + .518 lnOff + e.
In the end, we see that it is offenses that has the greatest weight. Any deterrent component
having offenses in it benefits from its force. This is clear in the case of arrests, for it no longer has as
substantial a deterrent weight as before, and in the case of burglary it evens falls behind the impact of
convictions and the number of months served in prison. For robbery, the arrests weight went from -
1.871 to -.924 and for burglary, it went from -.518 to -.051. The functional effect of convictions
dropped from -.963 to -.287 for robbery and from -.467 to -.157. Curiously, the only coefficient that
remains intact when it is decomposed is the severity measure, median time served; it is still -.676 for
robbery and -.310 in the case of burglary after I remove convictions from its denominator. It is also
worth noticing that it is now the measure with the greatest weight in the case of burglary.
So we can see that how we measure the certainty and the severity components in a statistical
deterrence model has important implicit implications and the resulting coefficients should be interpreted
12
with this in mind. Just because the log-linear estimates show arrests having a greater effect than the
conviction or the severity of punishment does not necessarily mean that it does or at least that it may not
be as great as it appears to be.
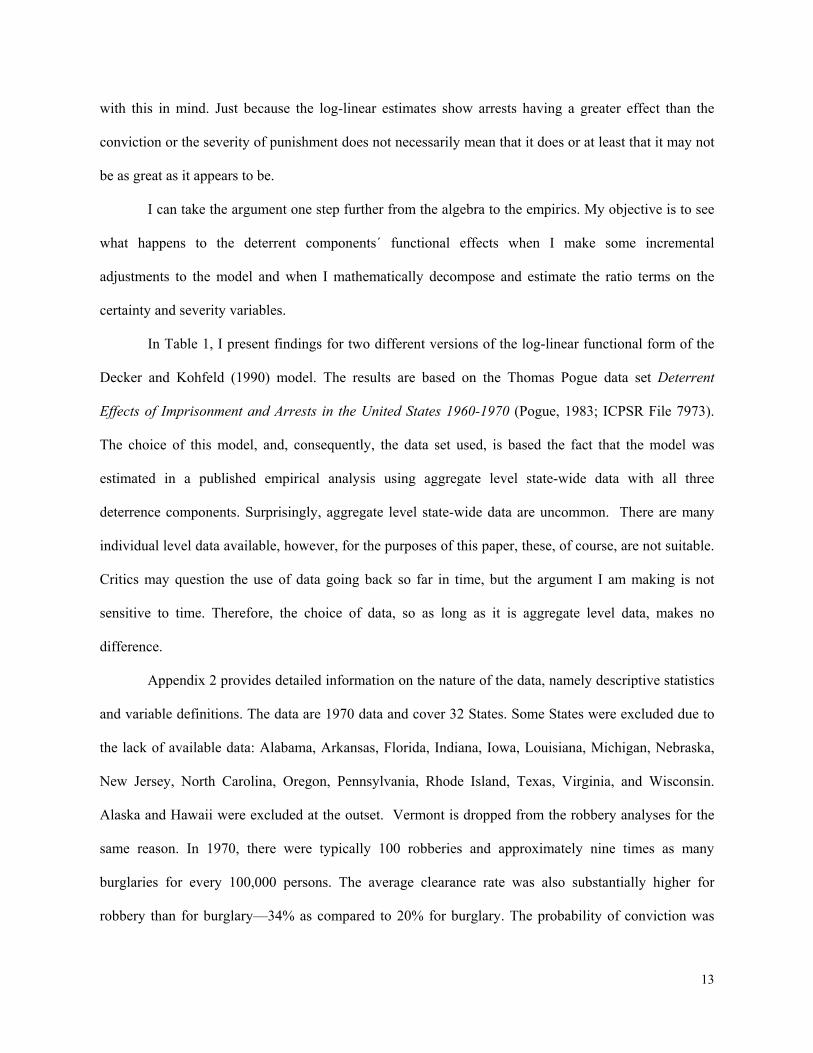
I can take the argument one step further from the algebra to the empirics. My objective is to see
what happens to the deterrent components´ functional effects when I make some incremental
adjustments to the model and when I mathematically decompose and estimate the ratio terms on the
certainty and severity variables.
In Table 1, I present findings for two different versions of the log-linear functional form of the
Decker and Kohfeld (1990) model. The results are based on the Thomas Pogue data set Deterrent
Effects of Imprisonment and Arrests in the United States 1960-1970 (Pogue, 1983; ICPSR File 7973).
The choice of this model, and, consequently, the data set used, is based the fact that the model was
estimated in a published empirical analysis using aggregate level state-wide data with all three
deterrence components. Surprisingly, aggregate level state-wide data are uncommon. There are many
individual level data available, however, for the purposes of this paper, these, of course, are not suitable.
Critics may question the use of data going back so far in time, but the argument I am making is not
sensitive to time. Therefore, the choice of data, so as long as it is aggregate level data, makes no
difference.
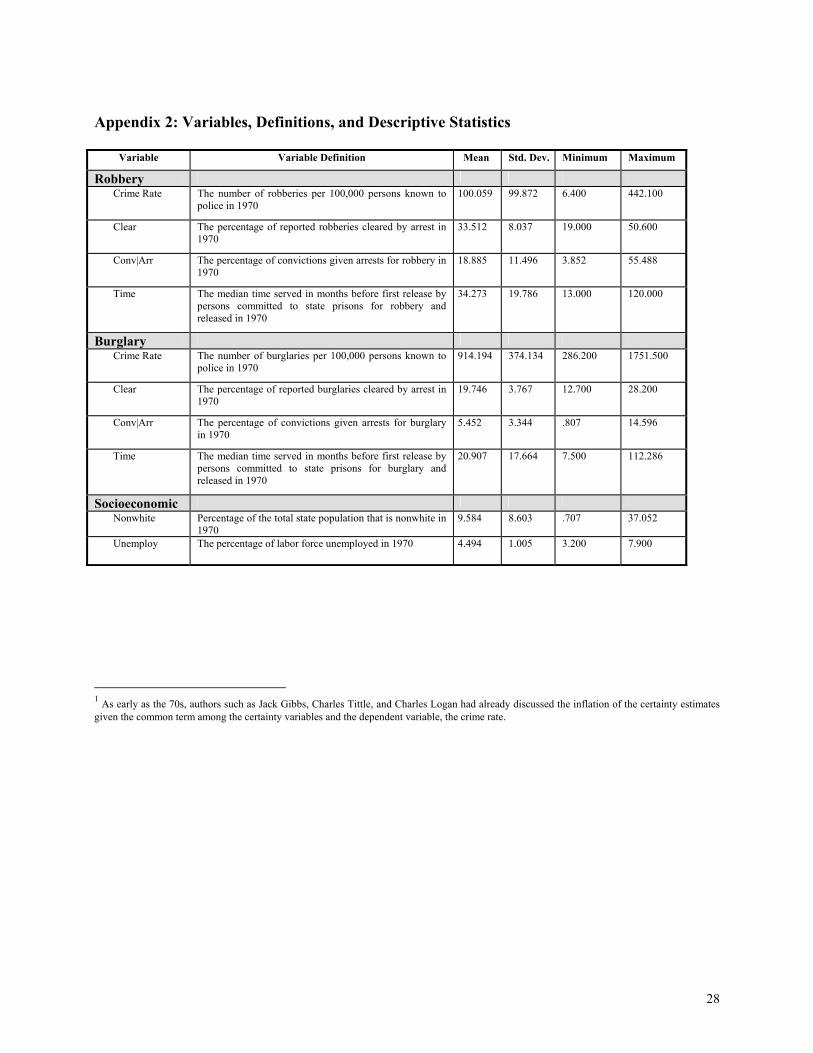
Appendix 2 provides detailed information on the nature of the data, namely descriptive statistics
and variable definitions. The data are 1970 data and cover 32 States. Some States were excluded due to
the lack of available data: Alabama, Arkansas, Florida, Indiana, Iowa, Louisiana, Michigan, Nebraska,
New Jersey, North Carolina, Oregon, Pennsylvania, Rhode Island, Texas, Virginia, and Wisconsin.
Alaska and Hawaii were excluded at the outset. Vermont is dropped from the robbery analyses for the
same reason. In 1970, there were typically 100 robberies and approximately nine times as many
burglaries for every 100,000 persons. The average clearance rate was also substantially higher for
robbery than for burglary—34% as compared to 20% for burglary. The probability of conviction was
13
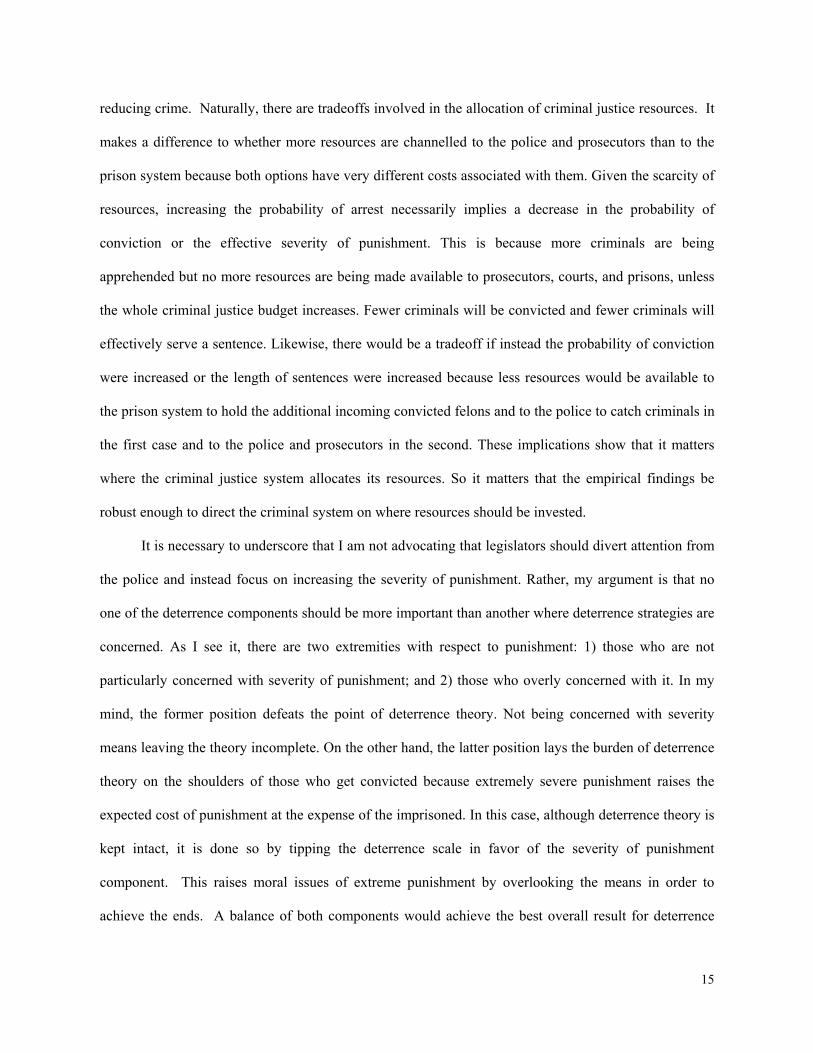
higher for robbery than for burglary. About one third of the robberies were cleared by arrests and
approximately one-fifth of those arrested for robbery were convicted. In the case of burglary, about 20%
of burglaries were cleared, and of those arrested only 5% were convicted. As for the severity variables,
we can see that those convicted of robbery were serving longer sentences than those convicted of
burglary, as the median time served was about 34 months for robbery and 20 months for burglary.
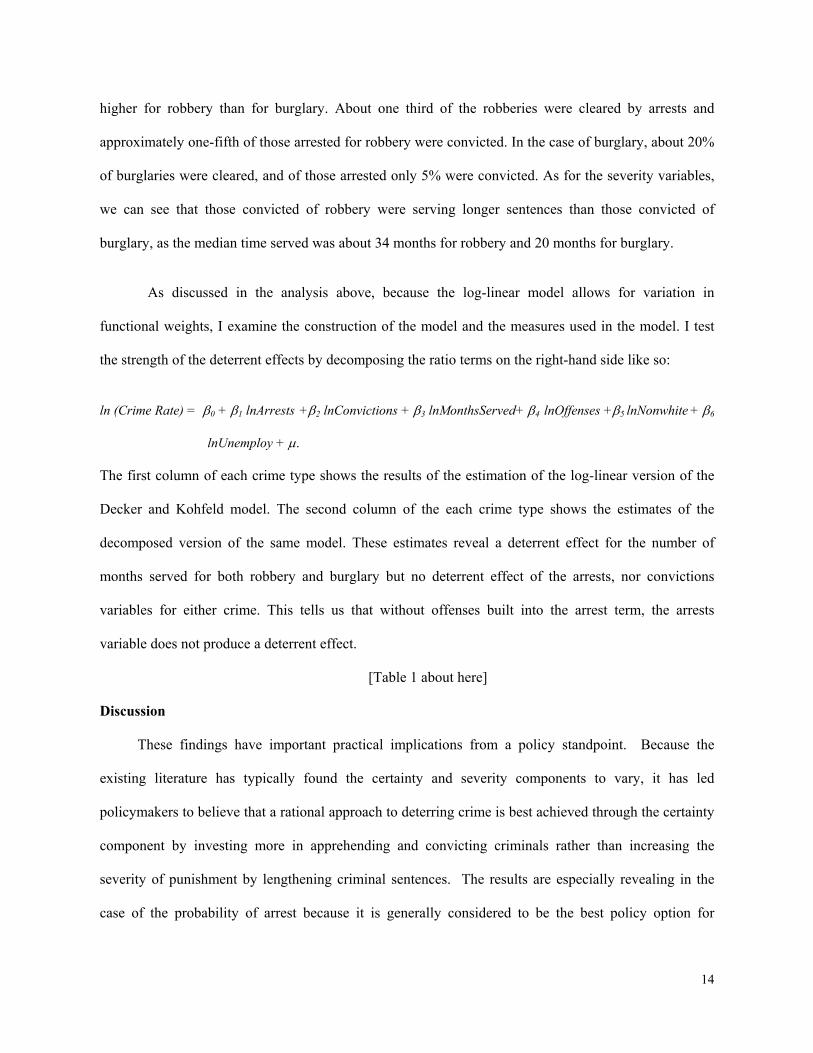
As discussed in the analysis above, because the log-linear model allows for variation in
functional weights, I examine the construction of the model and the measures used in the model. I test
the strength of the deterrent effects by decomposing the ratio terms on the right-hand side like so:
ln (Crime Rate) = β0 + β1 lnArrests +β2 lnConvictions + β3 lnMonthsServed+ β4 lnOffenses +β5 lnNonwhite + β6
lnUnemploy + µ.
The first column of each crime type shows the results of the estimation of the log-linear version of the
Decker and Kohfeld model. The second column of the each crime type shows the estimates of the
decomposed version of the same model. These estimates reveal a deterrent effect for the number of
months served for both robbery and burglary but no deterrent effect of the arrests, nor convictions
variables for either crime. This tells us that without offenses built into the arrest term, the arrests
variable does not produce a deterrent effect.
[Table 1 about here]
Discussion
These findings have important practical implications from a policy standpoint. Because the
existing literature has typically found the certainty and severity components to vary, it has led
policymakers to believe that a rational approach to deterring crime is best achieved through the certainty
component by investing more in apprehending and convicting criminals rather than increasing the
severity of punishment by lengthening criminal sentences. The results are especially revealing in the
case of the probability of arrest because it is generally considered to be the best policy option for
14
reducing crime. Naturally, there are tradeoffs involved in the allocation of criminal justice resources. It
makes a difference to whether more resources are channelled to the police and prosecutors than to the
prison system because both options have very different costs associated with them. Given the scarcity of
resources, increasing the probability of arrest necessarily implies a decrease in the probability of
conviction or the effective severity of punishment. This is because more criminals are being
apprehended but no more resources are being made available to prosecutors, courts, and prisons, unless
the whole criminal justice budget increases. Fewer criminals will be convicted and fewer criminals will
effectively serve a sentence. Likewise, there would be a tradeoff if instead the probability of conviction
were increased or the length of sentences were increased because less resources would be available to
the prison system to hold the additional incoming convicted felons and to the police to catch criminals in
the first case and to the police and prosecutors in the second. These implications show that it matters
where the criminal justice system allocates its resources. So it matters that the empirical findings be
robust enough to direct the criminal system on where resources should be invested.
It is necessary to underscore that I am not advocating that legislators should divert attention from
the police and instead focus on increasing the severity of punishment. Rather, my argument is that no
one of the deterrence components should be more important than another where deterrence strategies are
concerned. As I see it, there are two extremities with respect to punishment: 1) those who are not
particularly concerned with severity of punishment; and 2) those who overly concerned with it. In my
mind, the former position defeats the point of deterrence theory. Not being concerned with severity
means leaving the theory incomplete. On the other hand, the latter position lays the burden of deterrence
theory on the shoulders of those who get convicted because extremely severe punishment raises the
expected cost of punishment at the expense of the imprisoned. In this case, although deterrence theory is
kept intact, it is done so by tipping the deterrence scale in favor of the severity of punishment
component. This raises moral issues of extreme punishment by overlooking the means in order to
achieve the ends. A balance of both components would achieve the best overall result for deterrence
15
policy strategies. What is necessary is that criminals effectively serve their punishment. That means they
be caught, convicted, and serve their due sentence. And this only implies that a balance be struck
between resource efficiency and the moral question of punishment.
Conclusion
For over two centuries, scholars and law practitioners have insisted that the certainty of
punishment is more important than the severity of punishment when it comes to criminal deterrence. To
accommodate this traditional view, Becker extended the essence of deterrence theory by including an
attitudinal feature that accounts for a variation in the importance that potential criminals attribute to the
deterrent elements. This attitudinal feature is risk. Of course his model is an individual choice model,
thus “the key feature is the notion of utility” (Witte and Witt, forthcoming). Policymakers work at the
aggregate level, which means that they do not deal with expected utility, but rather focus solely on the
expected cost of punishment. This means that risk does not have to be considered if we are talking about
aggregate deterrence studies. The essence of deterrence theory would not change if we did not consider
these theoretical variations in deterrence theory. If so, then there is nothing in deterrence theory that
should lead us to expect different effects for each deterrent component. That is, we should not
theoretically expect the certainty of punishment to have a greater weight than the severity of
punishment.
Most of empirical deterrence findings since Becker lends support for his risk solutions, despite
the fact that they are not analyzable at the aggregate level. These findings have led us to believe that
certainty and severity of punishment have distinct weights. It is this variation in deterrent effects that
has made it possible to suggest that criminals are more risk acceptant, thus suggesting to policymakers
that certainty has a greater deterrent payoff than the severity of punishment.
In this paper, I question the need to overburden deterrence theory from a policy stance by
incorporating risk. Risk is an attitude, and attitudes are individual attributes. As such, they cannot be
tested at the aggregate level. If I am right in questioning the role of risk in the basic deterrence theory,
16
then how does one deal with the empirical studies that have found varying weights? The results of both
an algebraic manipulation and statistical analysis of the log-linear model—which respects the three-way
multiplicative relationship among the deterrence components, a necessary feature of any statistical
representation of deterrence theory— lend support for my hypothesis. After having algebraically and
empirically explored the log-linear model, I reach an important conclusion: the functional effects or
weights of the probabilities of arrest and conviction, and the severity of punishment do not really vary as
much as deterrence scholars would lead us to believe. Potential criminals mentally combine the three
deterrence components, regardless of whether they are risk neutral, averse, or acceptant. If the weights
really do not vary, then, according to Becker´s risk solutions, criminals are really risk neutral. This
being the case, it is entirely plausible to doubt if it is necessary to tax deterrence theory with the
consideration of the psychological element of risk where policymaking is concerned.
References
Antunes, George & A. Lee Hunt. (1973). The Deterrent Impact of Criminal Sanctions: Some
Implications for Criminal Justice Policy. Journal of Urban Law, 51 (2) 145-61.
Bartels, Larry M. & Henry E. Brady. (1993). The State of Quantitative Political Methodology. In
Political Science The State of the Discipline II, Ada W. Finifer, ed.. Washington,DC: APSA.
Beccaria, Cesare. (1965). Des Délits et des Peines. Genève: Libraire Droz.
Becker, Gary S. (1968). Crime and Punishment: An Economic Approach. Journal of Political Economy,
78, 169-217.
Bentham, Jeremy. (1789). Uma Introdução aos Princípios do Moral e da Legislação. S. Paulo: Abril.
Bernstein, Peter L. (1996). Against the Gods: The Remarkable Story of Risk. New York: Wiley.
Block, M. K. & J. M. Heineke. (1975). A Labor Theoretic Analysis of the Criminal Choice. American
Economic Review, 65 (3), 314-25.
17
Chambliss, William. (1966). The Deterrent Influence of Punishment. Crime and Delinquency, 12 (Jan.),
70-5.
Chauncey, Robert. (1975).Deterrence: Certainty, Severity, and Skyjacking. Criminology, 12 (4), 447-73.
Decker, Scott & Carol W. Kohfeld. (1990). Certainty, Severity, and the Probability of Crime: A Logistic
Analysis. Policy Studies Journal, 19 (1), 2-21.
Ehrlich, Isaac. (1973). Participation in Illegitimate Activities: A Theoretical and Empirical Investigation.
Journal of Political Economy, 81 (3), 521-65.
Eide, Erling. (1994). Economics of Crime: Deterrence and the Rational Offender. Amsterdam: North
Holland.
Gibbs, Jack P. (1968). Crime, Punishment, and Deterrence. Southwestern Social Science Quarterly, 48
(4), 515-30.
Gibbs, Jack P. (1975). Crime, Punishment, and Deterrence. New York, NY: Elsevier.
Grasmick, Harold G. & George J. Bryjak. (1980). The Deterrent Effect of Perceived Severity of
Punishment. Social Forces, 59 (2), 471-91.
Gray, Louis N. & J. David Martin. (1969). Punishment and Deterrence: Another Analysis of Gibbs´
Data. Social Science Quarterly, 50 (Sept.), 389-95.
Lalman, David, Joe Oppenheimer, & Piotr Swistak. (1993). Formal Rational Choice Theory: A
Cumulative Science of Politics. In Political Science The State of the Discipline II, Ada W. Finifer,
ed.. Washington,DC: APSA.
Logan, Charles H. (1972). General Deterrent Effects of Imprisonment. Social Forces, 51 (September),
64-73.
Luce, R. Duncan & Howard Rafia.(1957). Games and Decisions. New York; NY: Dover.
Mendes, Silvia M. & Michael D. McDonald. (2001). Putting Severity of Punishment Back in the
Deterrence Package. Policy Studies Journal, 29 (4), 588-610.
18
Morton, Rebecca. B. (1999). A Guide to the Empirical Analysis of Formal Models in Political Science.
Cambridge, UK: Cambridge University Press.
Montesquieu, Charles de Secondat Baron de. (1993). O Espírito das Leis¸ Livro VI. S. Paulo:
Martins Flores.
Pogue, Thomas F. (1983). The Crime Prevention Effects of Arrests and Imprisonment: Evidence From
Multiple Cross-Section Analyses, ICPSR Study # 7973. Ann Arbor, MA: National Institute of Justice.
Shawcross, Lord. (1965). Crime Does Pay Because We Do Not Back Up the Police. New York Times
Magazine (June 13).
Shelling, Thomas C. (1978). Micromotives and Macrobehavior. New York, NY: W.W.Norton.
Sjoquist, David. (1973). Property Crime and Economic Behavior: Some Empirical Results.” American
Economic Review, 63 (3), 439-46.
Tittle, Charles R. (1969). Crime Rates and Legal Sanctions. Social Problems, 16 (4), 409-23.
Tittle, Charles R. (1980). Sanctions and Social Deviance: The Question of Deterrence. New York, NY:
Praeger.
Tullock, Gordon. (1974). Does Punishment Deter Crime? The Public Interest, 36 (Summer), 103-11.
van den Haag, Ernest. (1975). Punishing Criminals: Concerning a Very Old and Painful Question. New
York, NY: Basic Books.
von Hirsch, Andrew, Anthony E. Bottoms, Elizabeth Burney, & P-O Wickstrom. (1999). Criminal
Deterrence and Sentence Severity. Oxford, UK: Hart.
von Neumann, John & Oskar Morgenstern. (1944). Theory of Games and Economic Behavior.
Princeton, NJ: Princeton University Press.
Wilson, James Q. & Richard J. Herrnstein. (1985). Crime and Human Nature. New York: Simon and
Schuster.
19
Witte, Ann Dryden. (1983). Economic Theories. In Encyclopedia of Crime and Justice Vol 1, Sanford
H. Kalish, ed., New York: Free Press.
Witte, Ann Dryden & Robert Witt. Crime Causation: Economic Theories. Forthcoming Encyclopedia of
Crime Justice. New York: Free Press.
20
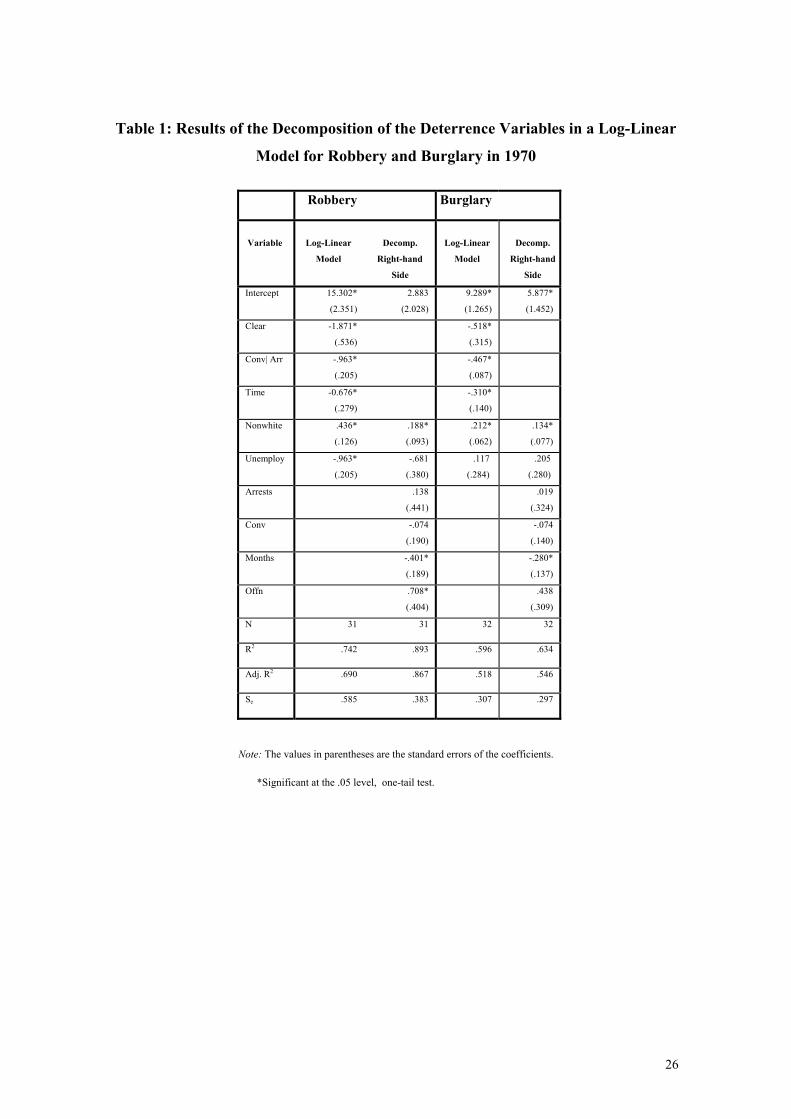
Table 1: Results of the Decomposition of the Deterrence Variables in a Log-Linear
Model for Robbery and Burglary in 1970
Robbery Burglary
Variable
Log-Linear
Model
Decomp.
Right-hand
Side
Log-Linear
Model
Decomp.
Right-hand
Side
Intercept 15.302*
(2.351)
2.883
(2.028)
9.289*
(1.265)
5.877*
(1.452)
Clear -1.871*
(.536)
-.518*
(.315)
Conv| Arr -.963*
(.205)
-.467*
(.087)
Time -0.676*
(.279)
-.310*
(.140)
Nonwhite .436*
(.126)
.188*
(.093)
.212*
(.062)
.134*
(.077)
Unemploy -.963*
(.205)
-.681
(.380)
.117
(.284)
.205
(.280)
Arrests .138
(.441)
.019
(.324)
Conv -.074
(.190)
-.074
(.140)
Months -.401*
(.189)
-.280*
(.137)
Offn .708*
(.404)
.438
(.309)
N 31 31 32 32
R2 .742 .893 .596 .634
Adj. R2 .690 .867 .518 .546
Se .585 .383 .307 .297
Note: The values in parentheses are the standard errors of the coefficients.
*Significant at the .05 level, one-tail test.
26
Appendix 1: Results of a Log-Linear Model for Robbery and Burglary, in 1970
Robbery Burglary
Variable
Log-linear Model
Log-linear
Model
Intercept 15.302 (2.351)*
9.289 (1.265)*
Clear -1.871 (.536)*
-.518 (.315)
Conv| Arr -.963 (.205)*
-.467 (.087)*
Time -0.676 (.279)*
-.310 (.140)*
Nonwhite .436 (.126)*
.212 (.062)*
Unemploy -.963 (.205)*
.117 (.284)
N 31 32
R2 .742 .596
Adjusted R2 .690 .518
Se .585 .307
Notes: 1) Estimates are based on a log-linear model transformation of the Decker and Kohfeld (1990) model, estimated using the Pogue (1983) data:
ln (C rate/1- C rate) = β0 + β1 Clear +β2 Conv|Off + β3 Time+ β2 Nonwhite + β3 Unemploy + µ.
2.) The values in parentheses are the standard errors of the coefficients.
*Significant at the .05 level, one-tail test.
27
Appendix 2: Variables, Definitions, and Descriptive Statistics
Variable Variable Definition Mean Std. Dev. Minimum Maximum
Robbery Crime Rate The number of robberies per 100,000 persons known to
police in 1970 100.059 99.872 6.400 442.100
Clear The percentage of reported robberies cleared by arrest in 1970
33.512 8.037 19.000 50.600
Conv|Arr The percentage of convictions given arrests for robbery in 1970
18.885 11.496 3.852 55.488
Time The median time served in months before first release by persons committed to state prisons for robbery and released in 1970
34.273 19.786 13.000 120.000
Burglary Crime Rate The number of burglaries per 100,000 persons known to
police in 1970 914.194 374.134 286.200 1751.500
Clear The percentage of reported burglaries cleared by arrest in 1970
19.746 3.767 12.700 28.200
Conv|Arr The percentage of convictions given arrests for burglary in 1970
5.452 3.344 .807 14.596
Time The median time served in months before first release by persons committed to state prisons for burglary and released in 1970
20.907 17.664 7.500 112.286
Socioeconomic Nonwhite Percentage of the total state population that is nonwhite in
1970 9.584 8.603 .707 37.052
Unemploy The percentage of labor force unemployed in 1970
4.494 1.005 3.200 7.900
1 As early as the 70s, authors such as Jack Gibbs, Charles Tittle, and Charles Logan had already discussed the inflation of the certainty estimates given the common term among the certainty variables and the dependent variable, the crime rate.
28