Embed Size (px)
Citation preview

Certain Orange Juice From Brazil
Investigation No. 731-TA-1089 (Final)(Remand)
Publication 3930 June 2007
Washington, DC 20436

U.S. International Trade Commission
COMMISSIONERS
Daniel R. Pearson, ChairmanShara L. Aranoff, Vice Chairman
Deanna Tanner OkunCharlotte R. Lane
Irving A. WilliamsonDean A. Pinkert
Robert A. RogowskyDirector of Operations
Staff assigned
Debra Baker, InvestigatorAlfred Dennis, Industry Analyst
James Fetzer, EconomistDavid Goldfine, Attorney
Gabriel Ellenberger, Research Assistant
Diane Mazur, Supervisory Investigator
Address all communications toSecretary to the Commission
United States International Trade CommissionWashington, DC 20436

U.S. International Trade CommissionWashington, DC 20436
www.usitc.gov
Certain Orange Juice From Brazil
Investigation No. 731-TA-1089 (Final)(Remand)
Publication 3930 June 2007


1 Chairman Stephen Koplan and Commissioners Charlotte R. Lane and Shara L. Aranoff made affirmativedeterminations; Vice Chairman Deanna Tanner Okun and Commissioners Jennifer A. Hillman and Daniel R.Pearson made negative determinations. Certain Orange Juice from Brazil, Inv. No. 731-TA-1089 (Final), USITCPublication 3838, March 2006, p. 1.
2 Chairman Daniel R. Pearson and Commissioner Deanna Tanner Okun and Irving A. Williamson dissenting.
In February 2006, the United States International Trade Commission (“Commission”) determinedthat an industry in the United States was materially injured by reason of imports of certain orange juicefrom Brazil that were found by the Department of Commerce to be sold at less than fair value (“LTFV”).1 Respondent Tropicana Products, Inc. appealed the Commission’s determination to the U.S. Court ofInternational Trade. On April 12, 2007 the CIT remanded the case to the Commission and instructed theCommission to render a determination within seventy-five (75) days.
On remand, the Commission again determines that an industry in the United States is materiallyinjured or threatened with material injury by reason of imports of certain orange juice from Brazil sold atless than fair value.2


CONTENTSPage
Views of the Commission . . . . . . . . . . . . . . . . . . . . . . . . . . . . . . . . . . . . . . . . . . . . . . . . . . . . . . . . 1
INFORMATION IN THE REMAND PROCEEDING
Background and court order . . . . . . . . . . . . . . . . . . . . . . . . . . . . . . . . . . . . . . . . . . . . . . . . . . . . . . . I-1The Commission’s compliance methodology . . . . . . . . . . . . . . . . . . . . . . . . . . . . . . . . . . . . . . . . . I-2Further analysis of grower coverage and U.S. processors’ inventory supply . . . . . . . . . . . . . . . . . I-3Data addressing the Commission’s Bratsk analysis . . . . . . . . . . . . . . . . . . . . . . . . . . . . . . . . . . . . . I-8
U.S. imports and apparent U.S. consumption . . . . . . . . . . . . . . . . . . . . . . . . . . . . . . . . . . . . . . I-8Pricing information . . . . . . . . . . . . . . . . . . . . . . . . . . . . . . . . . . . . . . . . . . . . . . . . . . . . . . . . . . I-11The global industry and market . . . . . . . . . . . . . . . . . . . . . . . . . . . . . . . . . . . . . . . . . . . . . . . . . I-16
Apparent consumption in selected countries . . . . . . . . . . . . . . . . . . . . . . . . . . . . . . . . . . . . I-20Global trade . . . . . . . . . . . . . . . . . . . . . . . . . . . . . . . . . . . . . . . . . . . . . . . . . . . . . . . . . . . . . I-23
Nonsubject production in Brazil . . . . . . . . . . . . . . . . . . . . . . . . . . . . . . . . . . . . . . . . . . . . . . . . I-26The industries in nonsubject countries . . . . . . . . . . . . . . . . . . . . . . . . . . . . . . . . . . . . . . . . . . . I-27
Appendixes
A. Federal Register notices . . . . . . . . . . . . . . . . . . . . . . . . . . . . . . . . . . . . . . . . . . . . . . . . . . . . . . A-1B. Excerpts, Tropicana Products, Inc. v. United States, Slip Op. 07-55, CIT 2007 . . . . . . . . . . . B-1C. Summary data . . . . . . . . . . . . . . . . . . . . . . . . . . . . . . . . . . . . . . . . . . . . . . . . . . . . . . . . . . . . . . C-1D. Data on U.S. imports and apparent U.S. consumption of FCOJM and NFCOJ . . . . . . . . . . . . D-1E. Data submitted by foreign producers in nonsubject countries . . . . . . . . . . . . . . . . . . . . . . . . . . E-1
Note.–Information that would reveal confidential operations of individual concerns may not bepublished and therefore has been deleted from this report. Such deletions are indicated byasterisks.


1 Tropicana Products, Inc. v. United States, Slip Op. 07-55 (Ct. Int’l Trade April 12, 2007) (“Slip Op.”). In theoriginal determination, three Commissioners reached an affirmative determination, finding present material injury(then-Chairman Koplan and Commissioners Lane and Aranoff), and three reached a negative determination (then-Vice Chairman Okun and Commissioners Hillman and Pearson). The confidential version of the Commissionmajority’s Views is referred to as “Original Views,” and the Separate and Dissenting Views of then-Vice ChairmanOkun and Commissioners Hillman and Pearson are referred to as “Dissenting Views.” The public versions of theOriginal and Dissenting Views are published in USITC Pub. 3838. 2 Commissioner Dean A. Pinkert was not a member of the Commission at the time of the original determination. He makes his determination in this remand proceeding de novo, by weighing all of the information from the originalproceeding as well as the additional information collected in this remand. 3 Chairman Pearson and Commissioner Okun do not join these views as they found, and continue to find that, adomestic industry is neither materially injured nor threatened with material injury by reason of subject imports fromBrazil. In their original determinations Chairman Pearson and Commissioner Okun found that while the volume ofand increase in subject imports was significant on an absolute basis, they also found that such volume was necessaryto complement and supplement U.S. production. Chairman Pearson and Commissioner Okun further found thatsubject imports did not depress or suppress U.S. prices to a significant degree. Chairman Pearson and CommissionerOkun therefore concluded that the domestic industry was not materially injured by reason of such imports. SeeDissenting Views of Vice Chairman Deanna Tanner Okun, Commissioner Jennifer A. Hillman, and CommissionerDaniel R. Pearson, Certain Orange Juice from Brazil, Inv. No. 731-TA-1089 (Final), USITC Pub. 3838 (March2006). 4 Commissioner Irving A. Williamson was not a member of the Commission at the time of the originaldetermination. He made his determination in this remand proceeding de novo, by weighing all the information fromthe original proceeding as well as the additional information collected in this remand. He adopts sections I and II ofthe Original Views regarding domestic like product, domestic industry, and related parties. On the issues of materialinjury and threat of injury, he adopts the original Dissenting Views of Vice Chairman Deanna Tanner Okun,Commissioner Jennifer A. Hillman, and Commissioner Daniel R. Pearson. Because he reached a negativedetermination, he does not find it necessary to address the Court’s remand instructions. 5 In these remand proceedings, three Commissioners have reached affirmative determinations (Vice ChairmanAranoff and Commissioners Lane and Pinkert), and three Commissioners have reached negative determinations(Chairman Pearson and Commissioners Okun and Williamson). If the voting Commissioners “are evenly divided asto whether the determination should be affirmative or negative, the Commission shall be deemed to have made anaffirmative determination.” 19 U.S.C. § 1677(11). 6 See Certain Orange Juice from Brazil, Inv. No. 731-TA-1089 (Final), USITC Pub. 3838 (March 2006).
VIEWS OF THE COMMISSION
On April 12, 2007, the U.S. Court of International Trade (“CIT” or “the Court”) remanded theCommission’s affirmative determination in Certain Orange Juice from Brazil, Inv. No. 731-TA-1089(Final), USITC Pub. 3838 (March 2006).1 Upon consideration of the Court’s remand instructions and theinformation in the record, as supplemented on remand, we again determine2 that an industry in the UnitedStates is materially injured by reason of imports of certain orange juice from Brazil (“certain orangejuice”) that the Department of Commerce has found are sold in the United States at less than fair value(“LTFV”).3 4 5
I. Background
On March 21, 2006, the Commission found that an industry in the United States was materiallyinjured by reason of LTFV imports of certain orange juice from Brazil.6 Respondent Tropicana Products,Inc., an importer and domestic producer, appealed the Commission’s determination. On April 12, 2007,the CIT remanded the determination to the Commission for re-examination and further explanation ofcertain issues. In particular, the Court directed the Commission to address (1) issues relating to the
7 Slip Op. at 21, 38-40, and 40-42. 8 72 Fed. Reg. 25778 (May 7, 2007). As it has in prior investigations in response to the Bratsk decision, theCommission issued questionnaires to non-subject producers of certain orange juice because it had not soughtcapacity, production and pricing data from non-subject producers in the original investigation. Subsequently,Respondents submitted a letter requesting that the Commission seek additional information from the importersconcerning the Bratsk issue. In contrast to the decision to collect data from non-subject producers, the Commissiondeclined to seek information from the importers, because the record already contained importer and purchaserresponses to the questionnaires sent during the original investigation. The Commission concluded that thesequestionnaires had asked importers to provide such information relevant to a Bratsk inquiry as was within theirdirect knowledge and there was no reason to repeat the inquiry. 9 In particular, based on our consideration of the record as a whole in light of the Court’s remand instructions, wehave revisited some of the statements in the Original Views regarding the relationship between subject imports anddemand. As discussed below, we have clarified these findings in response to the remand. 10 To the extent the dissenting Commissioners have reached different findings, we note that we have examinedthe record in its totality and given consideration to the arguments raised by the parties, but have come to differentconclusions than the dissenting Commissioners. It is well recognized that different Commissioners can reasonablymake different findings and reach different conclusions and that the possibility of drawing two inconsistentconclusions does not prevent the affirmative determination from being supported by substantial evidence. See TrentTube Division, Crucible Materials Corp. v. Avesta Sandvik Tube AB, 975 F.2d 807, 814 (Fed. Cir. 1992);Matsushita Elec. Industrial Co. v. United States, 750 F.2d 927 (Fed. Cir. 1984). 11 Slip Op. at 31.
2
shortfall in domestic production during the last year of the period of investigation; (2) opposition to thepetition by the majority of processors; and (3) the factors set forth in Bratsk Aluminium Smelter v. UnitedStates, 444 F.3d 1369 (Fed. Cir. 2006). On several other issues raised in litigation, the Court upheld theCommission’s findings “in isolation,” but noted that the Commission might wish to reexamine them whenreviewing the record as a whole. These included issues relating to ultra-low pulp orange juice (“ULPOJ”)imports, the alleged need for subject imports for blending and duty drawback, and the number of growerquestionnaire responses.7
The Commission published a Federal Register notice in May 2007 reopening the record for thelimited purpose of collecting information pertaining to its Bratsk analysis and soliciting written commentspertaining to the issues that were the subject of the CIT’s remand.8 Persons who were interested parties tothe original investigation and who were parties to the appeal were permitted to file comments, but werenot allowed to submit any new factual information. On May 31, 2007, Petitioner Florida Citrus Mutualand Respondents Tropicana, Louis Dreyfus Citrus, Inc., Fischer S/A Agroindustria, and the Coca-ColaCompany filed comments pertaining to the Commission’s remand determination.
Based on our consideration of all of the information in the record, as supplemented on remand,and of the arguments raised by the parties in the original and remand proceedings, we determine that anindustry in the United States is materially injured by reason of subject imports of certain orange juicefrom Brazil. Subject to the Views expressed herein,9 we adopt and incorporate in their entirety theCommission’s Original Views.10
II. Consideration of the Shortfall in the Supply of Domestic Round Oranges
The Court directed the Commission to examine “all the relevant issues relating to the impact ofthe shortfall in the domestic production of round oranges on the domestic industry, including, but notlimited to, the levels of residual demand, the inverse correlation between inventory levels of subjectimports and domestic production, and the need of the domestic industry to maintain high inventories.”11 In addition to the volume-related aspects of these issues, the Court directed the Commission to revisit or

12 Id. at 25. 13 As further discussed below, Louis Dreyfus defined residual demand as “the difference between the domesticconsumption and juice available” and defined “juice available” as “the sum of domestic production for that year andthe change in domestic inventory levels, whether positive or negative.” Slip Op. at 25. 14 Id. at 26. 15 Original Views at 17-18. 16 Id. at 20 (“Finally, Respondents argue that subject imports are at most a residual source of supply in the U.S.market to cover domestic production shortfalls, especially following the 2004 Florida hurricanes. The record doesshow that Brazilian subject imports tend to rise in years when Florida production falls and vice-versa. In our view,however, this simple comparison of import and production trends masks important changes in the supply/demandbalance in the U.S. market over the total period examined . . . . [I]nventories of both domestic and Brazilian bulkproduct are significant supply factors. . . . [T]he record indicates that the amount of Brazilian subject imports held inU.S. inventory increased during the period examined, thereby exceeding the volume of imports necessary to counterdomestic production shortfalls.”). 17 In this investigation, the parties do not dispute that apparent consumption is indicative of demand. See, e.g.,Petitioners’ Comments at 5-6; Louis Drefyus’s Comments at 4-5. As the Commission explained in its OriginalViews, domestic demand for certain orange juice is primarily a function of demand for downstream products usingFCOJM and NFC, predominantly retail orange juice. Original Views at 16, citing CR at II-4; PR at II-3.
3
further explain certain aspects of its determinations regarding price effects and impact that may have beenaffected by the Commission’s inventory-related findings. We address each of the issues in turn below.
A. Residual Demand and the Domestic Industry’s Maintenance of Inventories
To a large extent, the Court’s concerns revolved around the Commission’s discussion in theOriginal Views regarding “residual demand.” The Court particularly took issue with the Commission’sfinding that subject imports increasingly exceeded residual demand. As the Court pointed out, theCommission “never actually determined the level of residual demand.”12 Apparently relying on thedefinition of residual demand proffered by Respondent Louis Dreyfus,13 the Court concluded that “[w]henso defined, the record shows that subject imports did not increasingly exceed residual demand butfluctuated from year to year” and that “in the last year of the POI, the level of subject imports did notexceed the residual demand, but was actually insufficient to meet the domestic demand.”14
The Respondents’ arguments to the Court about residual demand appear to rest on confusionregarding both our definition of that concept and how it must be applied given the facts of this case,confusion that may have been fostered by our incomplete statement in the Original Views that “[t]heparties agree, and the record confirms, that imports of certain orange juice are necessary to meet domesticdemand.”15 Subsequently in the Original Views, we attempted to clarify this statement by noting that wemust take inventories into consideration when analyzing the total available supply of orange juice.16 Wefailed, however, to fully articulate the effect of domestic inventories on residual demand and, thus, thebasis for our determination that subject imports were not necessary to meet such demand.
As a general matter, we define residual demand as the difference between demand, on the onehand, and production plus available inventories, on the other. Our use of the term “available” to modify“inventories” is meant to indicate that the facts of the particular case will dictate whether all, or someportion of, the stated inventories might be brought to bear on demand within the period underconsideration. To the extent that it is not possible for stated inventories to be brought to bear on demandwithin the period, they are not incorporated into our calculation of residual demand. We note that theCommission generally uses apparent consumption as the measure of demand for a product in the U.S.market.17

18 19 U.S.C. § 1677(7)(C)(i) and (iii)(I) (emphasis supplied). 19 19 U.S.C. § 1677(7)(C)(iii). 20 Original Views at 14-17. 21 Id. at 15. 22 Id. 23 Hearing Tr. at 29. 24 Id. at 258 (“Over the POI, inventories were steadily and let me emphasize intentionally built, extending longterm trends. Industry participants acknowledged the need to create substantially greater storage capacity during thepast decade to protect American consumers from shortages.”) (Brinner). 25 The market for subject merchandise may experience substantial uncertainty regarding the existence of residualdemand in subsequent years, and imports may serve to hedge that uncertainty by providing an alternative source ofsupply. Hedging such uncertainty is not equivalent to being necessary to meet demand.
4
Our definition of residual demand is consistent with the statutory directive for analyzing subjectimport volume in 19 U.S.C. § 1677(7)(C)(i) and (iii)(I). The statute directs the Commission to considerthe volume of imports “either in absolute terms or relative to production or consumption” and to consider“market share,” among various other factors, as relevant to the impact of the subject imports on thedomestic industry.18 In addition to market share and the enumerated statutory factors (includinginventories), the statute directs the Commission to evaluate any other “relevant factors which have abearing on the state of the industry in the United States” and to do so “within the context of the . . .conditions of competition that are distinctive to the affected industry.”19 We note that we examineconditions of competition, including supply and demand, in virtually every investigation. 19 U.S.C. §1677(7)(C)(i) and (iii)(I).
In the Original Views, the Commission discussed the relevant conditions of competition,including the role of inventories, in the supply and demand chain of the domestic orange juice market.20 Between October and January, freshly harvested round oranges become available for processing intocertain orange juice. Orange juice processors face significant year-to-year fluctuations in the supply oftheir primary input, round oranges.21 Fluctuations in the orange supply result from both weatherconditions (e.g., freezes, hurricanes, and droughts) and other factors, including citrus diseases (e.g., CitrusCanker and Citrus Greening).22 Processors convert harvested oranges into FCOJM or NFCOJ and holdthe juice in temperature-controlled storage tanks until needed by customers. Even stored this way, orangejuice is perishable. The shelf life of NFCOJ is no more than 3 years, while the shelf life of FCOJM islonger.23
Supply of certain orange juice is a function of inventories as well as crop size. Due to a variety offactors, including shelf life and storage capacity, domestic processors can supply the market for certainorange juice by drawing down their total available inventory, even in years of diminished production. When harvesting of round oranges concludes for a crop year, processors use inventories to supply themarket until the next harvest begins. The record also indicates that, due to the inherent volatility in thedomestic supply of round oranges, domestic producers of certain orange juice prefer to maintain someadditional inventory as an insurance policy in order to reassure downstream customers that there will bean adequate supply of orange juice in the event of a poor orange crop harvest in the future.24
The Commission considered the difference between U.S. apparent consumption and the juiceavailable from domestic sources. In light of the high level of inventories maintained by the industry andthe purposes for which the inventories were maintained, the Commission found that the domestic supplyin any given crop year included both domestic production and inventories. If domestic supplies,including inventories, had fallen short of domestic consumption in a crop year, the Commission wouldhave treated that shortfall as residual demand.25

26 Slip Op. at 25. 27 Id. 28 Id. 29 Hearing Tr. at 217. In response to questioning, Ms. Warlick stated:
COMMISSIONER PEARSON: Well, I’m glad that you raised inventories because that was getting to mynext question. Is there such a thing as a normal level of carryover inventory for the U.S. orange juicemarket?MS. WARLICK: It depends on what time of year. COMMISSIONER PEARSON: Let’s look at the end of the crop year.MS. WARLICK: Yes, October 1st. We’ve said you really need to have 12 weeks to get you to January. They prefer a comfort level of somewhere between 16 and 20.
30 Hearing Tr. at 52:
MS. WARLICK: . . . We submit that at the beginning of the season, say October 1, U.S.processors need at least 12 weeks of supply to take them to January when the Hamlins areprocessed, and they would prefer a comfort level of between 16 and 20 weeks. However, beyond 20 weeks inventories are a costly liability.
5
As described in the Court’s opinion, Louis Dreyfus has argued that “residual demand can bedefined as the difference between the domestic consumption and juice available.”26 It defined “juiceavailable” as “the sum of domestic production for that year and the change in domestic inventory levels,whether positive or negative.”27 Most significantly, to calculate total domestic juice available, it includedin the juice available only a small portion of total available U.S. inventory, namely the amount actuallywithdrawn from or added to inventory in a given year. We find that this analysis understates by asignificant amount the volume of domestic juice that is available in any given crop year to satisfydomestic consumption. By understating the amount of inventory that is available to satisfy domesticconsumption, the analysis overstates the amount of subject imports necessary to meet the residualdemand.
Louis Dreyfus ignores, and instead labels as unavailable, the major portion of total inventoriesfrom which U.S. producers can draw in order to meet demand. There is no credible support in the recordfor this artificial restriction on the ability of domestic producers to draw down large amounts of inventorythat are readily available for sale. Thus, we reject the contention that the juice available to domesticprocessors from inventory must be restricted to the “change in domestic inventory levels, whetherpositive or negative,” between crop years.28
Louis Dreyfus apparently presumes that all stock in inventory at the end of the crop year,regardless of how large, is deliberately left untouched as a “cushion.” The record does not bear this out. In fact, the evidence indicates that, beyond a certain level, specifically twenty weeks worth of inventory,domestic producers view inventories as a liability. At the hearing, the domestic industry’s economist, Ms.Warlick, on behalf of all the Petitioners (including three processors), testified that the industry needs tohave only 12 weeks available at the start of the crop year to carry the processors from October to January,when freshly harvested Hamlin oranges become available for processing, although the industry “prefers”a comfort level of between 16 and 20 weeks.29 Beyond 20 weeks, however, the industry viewsinventories as “a costly liability.”30 In other words, while the evidence in the record suggests thatdomestic processors need 12 weeks and prefer to maintain 16 to 20 weeks of carryover stocks at the endof any given crop year, it does not follow that domestic processors need or prefer these amounts to beheld in inventory constantly throughout the year, and Ms. Warlick did not testify to that effect. Furthermore, there is nothing in the record to indicate that domestic producers cannot use all of theirinventory to meet demand. As Ms. Warlick testified at the hearing, however, due to differences in the

31 Tropicana Comments at 7. 32 Hearing Tr. at 52, 217. 33 Tropicana Comments at 6-7, citing testimony of Mssrs. Freeman, Brinner, and Zellner. We give no evidentiaryweight to argumentative statements of counsel that Tropicana has also cited and note in addition that thosestatements fail to support the contention that more than 12 weeks of inventory are ever necessary. 34 To the extent the Court questioned whether the domestic industry was importing certain orange juice fromBrazil to maintain a certain level of inventories (slip op. at 28), we note that the testimony of Respondent LouisDreyfus’ own witness belies that theory. Mr. Randall Freeman, the CEO of Louis Dreyfus, testified that “theinventory change from one year to another is entirely domestic. The delta is entirely domestic inventory change. The foreign component, as a percentage of it, is more or less constant because the blending requirements dictate thatyou have that, so the change in inventory is entirely a function of what’s going on in the domestic production land. It’s not a function of the imports.” Hearing Tr. at 366. 35 CR/PR at Table I-3A. 36 CR/PR at Table IV-6. In the original determination, the Commission observed that “[b]ased on USDA data,during the period examined, the size of the U.S. inventory of certain orange juice represented approximately one-halfof domestic production in any given crop year.” Original Determination at 15. As noted above, however, U.S.beginning stocks of certain orange juice were far lower and varied substantially in previous crop years both inabsolute terms and as a percentage of domestic production (i.e., crop years 1989/1990 through crop year 2000/2001).CR/PR at Table IV-6
6
harvest months for domestic orange varieties, the industry usually targets a minimum level of inventory ascarryover stocks for the following crop year.
We find Ms. Warlick’s testimony to be credible and indicative of the practice of the domesticproducers. None of the Respondents questions the veracity of this testimony, although the Respondents mischaracterize her statements or point to other evidence that is not relevant to this particular point. Tropicana misstates Ms. Warlick’s testimony by referring in its remand comments to “20 weeks optimumsupply claimed by petitioners.”31 As discussed above, Ms. Warlick testified that the domestic industrygenerally “need[s] at least 12 weeks of supply to take them to January” and would “prefer a comfort levelof somewhere between 16 and 20 weeks,” not that 20 weeks of supply in inventory was required or“optimum” either at the end of the crop year or any other time during the year.32 Tropicana referenceshearing testimony by several of Respondents’ witnesses, but these witnesses merely testified about theprocessors’ preference to maintain unspecified levels of inventories and that historically inventoriestended to be higher in years with bumper crops.33 This testimony does not rebut Ms. Warlick’squantitative assessment of the processors’ target levels for carryover stocks that were “needed” versus a“comfort level.”34
The inventory data reflected in the questionnaire responses indicates that beginning-of-periodinventory levels increased from 14.4 weeks in crop year 2001/02 to 17.7 weeks in 2002/03, then droppedslightly to 16.2 weeks in 2003/04 before rising to 24.9 weeks at the beginning of the last crop year(2004/05) covered by the POI. 35 These data show that the inventory levels, prior to the surge in subject imports in crop year 2004/05, corroborate Ms. Warlick’s testimony that a typical and preferredbeginning-of-crop-year inventory level would be below 20 weeks.
We note that U.S. beginning stocks of certain orange juice were lower and varied substantially inprevious crop years, which undermines Respondents’ claim regarding a “historical average” level ofinventory.36 For example, U.S. producers’ beginning stocks were 232.8 million gallons SSE in crop year1989/90 (11 weeks of domestic consumption), 225.4 million gallons SSE in crop year 1990/91 (10weeks), 157.7 million gallons SSE in crop year 1991/92 (7 weeks), 170.1 million gallons SSE in cropyear 1992/93 (7 weeks), 249.4 million gallons SSE in crop year 1993/94 (10 weeks), 360.4 milliongallons SSE in crop year 1994/95 (15 weeks), 434.5 million gallons SSE in crop year 1995/96 (16weeks), 417.0 million gallons SSE in crop year 1996/97 (16 weeks), 563.8 million gallons SSE in crop

37 CR/PR at Table IV-6 (calculated weeks of domestic consumption). 38 The end of one crop year is followed by the beginning of the next crop year. Accordingly, end-of-periodinventory in one crop year is available as carryover stocks in beginning-of-period inventory in the following cropyear. CR/PR at Table III-15. 39 For purposes of these calculations, the weekly consumption used to derive the targeted beginning inventorylevel is based on the actual domestic consumption in the indicated crop year. 40 CR/PR at Tables IV-6 & I-3A. 41 We note that U.S. producers’ exports of certain orange juice were relatively low during the period examined,falling from 181.2 million gallons SSE in crop year 2001/02 to 112.5 million gallons SSE in crop year 2004/05. CR/PR at Table IV-6. Even taking into account these exports of certain orange juice, we find that subject importswere not needed to satisfy residual demand in crop years 2001/02, 2002/03, and 2003/04 and that subject importsentered the U.S. market at a higher level than was necessary to satisfy domestic consumption in crop year 2004/05.
7
year 1997/98 (18 weeks), 678.7 million gallons SSE in crop year 1998/1999 (22 weeks), 533.8 milliongallons SSE in crop year 1999/2000 (17 weeks), and 645.5 million gallons SSE in crop years 2000/01 (22weeks).37 Thus, the USDA data do not corroborate Respondents’ assertions concerning historicinventory levels.
In determining whether there was any shortfall in domestic supply, we took into account that theindustry needs 12 weeks of supply to carry over into the beginning of any given crop year. The chartbelow is based on the assessment that 12 weeks of beginning-of-period inventory (“B-O-P inventory”)38 is the amount needed.39 Thus, any amount in excess of 12 weeks of inventory must be considered, alongwith current production levels, as available to meet domestic demand. The data demonstrate that in everyyear of the period examined the available domestic production plus inventories exceeded domesticconsumption; therefore, there was not any residual demand that needed to be filled from non-domesticsupply sources.
Crop Year DomesticProduction
B-O-PInventories
Assume 12Weeks
Inventory NotAvailable for
Sale
B-O-PInventory
Available forSale
DomesticProduction
Plus AvailableInventory
DomesticConsumption
ResidualDemand
Quantity (1,000 gallons SSE)
2001/02 1,432,162 698,464 333,683 364,781 1,796,943 1,445,959 -350,984
2002/03 1,246,761 692,163 328,260 363,903 1,610,664 1,422,460 -188,204
2003/04 1,471,334 704,509 330,651 373,858 1,845,192 1,432,822 -412,370
2004/05 1,006,642 842,139 345,642 496,497 1,503,139 1,497,781 -5,358
In crop year 2004/05, U.S. processors had 842.1 million gallons SSE in inventory at thebeginning of the year.40 As demonstrated above, the domestic industry had more than adequate inventoryto satisfy domestic consumption during the final crop year (i.e., crop year 2004/05) of the periodexamined and more than adequate carryover stocks for the following crop year (i.e., crop year 2005/06).
Because the domestic industry had adequate combined domestic production and inventory tosatisfy domestic consumption in each year of the period examined, there was no residual demand thatneeded to be met by subject imports at any time during the period.41 Although domestic supply was lessplentiful in the final crop year following the hurricanes (i.e., crop year 2004/05), the domestic industryhad more than adequate inventory in that year to make up for the production shortfall and to satisfy

42 CR/PR at Table IV-6. Although we find that no more than 12 weeks of carryover stocks were needed by theindustry, the table below shows that even using a 20-week level for beginning inventory levels there would still havebeen sufficient domestic supply to meet domestic consumption in two of the four crop years reviewed. Moreover,even in the two years in which there was a positive residual demand, the level of subject imports exceeded the amount that would have been needed to meet the residual demand. We present this chart for illustrative purposesonly, because we find it likely that, absent the influx of unfairly traded imports, domestic producers would certainlyhave drawn down inventories below a 20-week level, or even a 12-week level, in a year when domestic productionwas seriously reduced due to hurricanes.
Crop Year DomesticProduction
B-O-PInventories
Assume 20Weeks ofInventory
NotAvailable for
Sale
B-O-PInventory
Available forSale
DomesticProduction
PlusAvailableInventory
DomesticConsumptio
n
ResidualDemand
Imports fromBrazil
Quantity (1,000 gallons SSE)
2001/02 1,432,162 698,464 556,138 142,326 1,574,488 1,445,959 -128,529 109,728
2002/03 1,246,761 692,163 547,100 145,063 1,391,824 1,422,460 30,636 227,280
2003/04 1,471,334 704,509 551,085 153,424 1,624,758 1,432,822 -191,936 154,203
2004/05 1,006,642 842,139 576,070 266,069 1,272,711 1,497,781 225,070 231,711
43 Slip Op. at 27 (citing Original Views at 15). 44 Id. 45 Slip Op. at 31. 46 Louis Dreyfus Comments at 4-7. 47 To the extent there is an inverse correlation between domestic production and subject imports, we note that themagnitude of any such correlation is questionable on this record. Subject import volumes were virtually identical in
(continued...)
8
domestic consumption while still carrying forward an ending inventory of 12 weeks into the 2005/06 cropyear.42
B. Inverse Correlation Between Inventory Levels of Subject Imports and DomesticProduction
As to the relationship between subject import inventory levels and domestic production, the Courtopined that “the level of subject imports held in domestic inventory was inversely correlated to the levelof production of the domestic like product – rising when production levels fell and vice-versa.”43 TheCourt reasoned that this supposed inverse correlation between the level of subject merchandise indomestic inventory and the level of domestic production was likely explained by the need of domesticproducers to “‘maintain relatively large bulk juice inventories’ to ensure their supply of certain orangejuice during fluctuations in domestic production.”44 Accordingly, the Court directed the Commission onremand to examine all the relevant issues relating to the impact of the shortfall in the domestic productionof round oranges on the domestic industry, including “the inverse correlation between inventory levels ofsubject imports and domestic production.”45
Respondents argue that Brazilian subject imports are noninjurious because they are “pulled” intothe U.S. market in order to offset a domestic supply shortfall.46 As we recognized in the originaldetermination, subject imports generally increased when U.S. production of certain orange juice fell andvice versa.47 This simple observation, however, does not demonstrate that increases in subject imports are
47 (...continued)two crop years when domestic production levels varied substantially. In crop year 2002/03, subject imports totaled227.3 million gallons SSE, while domestic production totaled 203 million gallons SSE. By contrast, in crop year2004/05, subject imports totaled 231.7 million gallons SSE, while domestic production totaled 149.6 million gallonsSSE. CR/PR at Table C-3. 48 CR/PR at Table IV-6. 49 CR/PR at Table C-3. 50 CR/PR at Table VII-4. 51 Because the Brazilian home market is small with very little domestic demand for orange juice in Brazil,Brazilian producers of certain orange juice are export-oriented and must export even more to other markets(including the United States) in years when the Brazilian orange crop and Brazilian orange juice production are athigh levels. CR/PR at Table VII-4; CR at VII-3 to VII-4; PR at VII-4. 52 Domestic production during the 2004/05 crop year was 32 percent less than production in the previous year. Moreover, the 2004/05 production was 19 percent less than the next lowest production year of the period of reviewand 27 percent lower than the average of the three previous years’ production. CR/PR at Table IV-6.
9
solely the result of declines in domestic production. There are other factors in play. For example, theseincreases in subject imports generally coincided with especially large Brazilian orange crops and highlevels of Brazilian production of certain orange juice. Subject imports were at their highest levels of theperiod in crop years 2002/03 and 2004/05.48 Likewise, end-of-period inventories of subject FCOJM wereat their highest levels in crop years 2002/03 and 2004/05.49 Brazilian production of certain orange juicealso reached its highest levels in crop years 2002/03 and 2004/05, rising to *** pounds solids and ***pounds solids, respectively.50 We find this positive correlation between subject imports and subjectmerchandise inventory and Brazilian production of certain orange juice to be significant, because itsuggests that production levels in Brazil affected the increase in subject imports during the periodexamined; it is contrary to the Respondents’ claim that low-priced subject imports were merely “pulled”into the market to offset a domestic supply shortfall.51
Considering the positive relationship between levels of subject imports and Brazilian productionand the availability of domestic juice to satisfy domestic consumption needs, we do not find that theinverse relationship between domestic production and subject imports demonstrates that subject importsat the levels that actually occurred during the period of investigation were needed to meet domesticdemand. The central issue is whether the domestic industry could have made up for a domesticproduction shortfall by selling available inventories of certain orange juice. Even in the aftermath of the2004 Florida hurricanes, during the worst crop year of the period of investigation, when domesticproduction was well below that of any of the previous years reviewed,52 domestic processors retained theability to meet demand by drawing down total available inventory while still maintaining slightly inexcess of 12 weeks of inventory to take them into the next crop year. Indeed, beginning-of-perioddomestic inventories were at a record high at the beginning of crop year 2004/05. Nevertheless, thevolume of subject imports entering the U.S. market during that crop year (i.e., crop year 2004/05), as inevery other year of the POI, was higher than necessary to meet residual demand and limited the ability ofdomestic producers to sell in the domestic market their available supply, inclusive of inventories. Wefind that the increase in the volume of low-priced subject imports in excess of U.S. apparent consumptiongrowth, in the absence of any residual demand that needed to be met by subject imports, is significant.
III. The Relationship Between Supply/Demand Factors and Price Effects
The Court directed the Commission on remand to revisit three aspects of its determinationregarding price effects related to the Commission’s findings with respect to the increase in the level of

53 Slip Op. at 29. 54 Id. 55 Id. 56 Id. at 30 n.27. 57 Demand for certain orange juice is price inelastic. See CR/PR at II-20; PR at II-15. 58 Original Views at 23, 28 (finding that “the domestic industry’s ratio of COGS to net sales has steadilyincreased throughout the period examined” and that “the increase in net sales unit values in interim 2005 was only$0.14 per pound while COGS increased by $0.16 per pound over the same period”); CR/PR at Table VI-9(COGS/net sales increased from 90 percent in 2002 to 92.9 percent in 2003 and to 96.3 percent in 2004, andincreased from 87.7 percent in interim 2004 to 93.5 percent in interim 2005). 59 Slip Op. at 29. 60 See Original Views at 27-28. 61 CR/PR at Table C-3. 62 Id.
10
subject imports held in domestic inventory.53 First, the Court instructed the Commission “to [examine]how demand factors, such as the limited increase in domestic consumption of certain orange juice duringthe POI, may have prevented the domestic industry from raising prices.”54 Second, the Court instructedthe Commission to “also consider how the level of subject imports held in inventory, consisting of at most8.7% of the domestic inventories during the POI, and less than 5% in two of the years of the POI,contributed significantly, rather than minimally, to the suppression of domestic prices.”55 Finally, in afootnote, the Court directed the Commission to consider the “dissenting Commissioners’ conclusion thatmonthly subject import volumes fluctuated significantly in a manner that did not correlate withfluctuations in prices.”56
After considering each of the issues raised by the Court, we again find that subject importssuppressed domestic prices to a significant degree. Given the increase in U.S. apparent consumption ofcertain orange juice over the period of investigation and the low demand elasticity,57 domestic producersshould have been able to pass on higher production costs through higher prices. They were preventedfrom doing so by the significant increase in subject import volume, which was beyond any increaseexplicable by non-price factors or unmet domestic demand, and significant subject import undersellingmargins.
The Commission’s finding in the Original Views that the domestic industry experienced “aclassic cost-price squeeze” toward the end of the period of investigation as the ratio of cost of goods soldto net sales increased steadily throughout the POI is not in dispute.58 The Court, however, has directedthe Commission to consider on remand the extent to which the domestic industry’s inability to recouphigher costs through higher prices resulted from “demand factors, such as the limited increase in domesticconsumption of certain orange juice during the POI . . . .”59 As in our original determination, we find thatdemand trends did not significantly contribute to the price suppression experienced by domesticproducers for two reasons.
First, U.S. apparent consumption of certain orange juice increased toward the end of the period ofinvestigation, as the popularity of low-carbohydrate diets waned.60 U.S. apparent consumption reached itshighest level of the period examined in the final crop year of the period, increasing from 1.44 billiongallons SSE in crop year 2003/04 to 1.50 billion gallons SSE in crop year 2004/05.61 Apparent domesticconsumption for certain orange juice increased by 3.5 percent over the period of investigation, from 1.45billion gallons SSE in crop year 2001/02 to 1.50 billion gallons SSE in crop year 2004/05.62 All elsebeing equal, increasing apparent consumption toward the end of the period should have made it easier fordomestic producers to pass on higher costs to their customers through higher prices.

63 See Original Views at 23-24. 64 CR/PR at Table III-5; CR at I-4 to I-5, II-20; PR at I-4, II-20. 65 See Original Views at 24 (finding that “[b]etween 2003 and 2004, the cost-price squeeze resulted in a 7.8percentage point decline in the domestic industry’s operating margin, which was more accelerated than the 1.8percentage point drop in the domestic industry’s operating margins between 2002 and 2003, when the domesticindustry also experienced a cost-price squeeze”). 66 CR/PR at Table C-3. Subject import volume increased by 77.5 million gallons SSE, or 50.3 percent, betweencrop year 2003/2004 and crop year 2004/2005, outstripping the 64 million gallons SSE, or 4.5 percent, increase inU.S. apparent consumption over the period. Id. 67 Original Views at 22. 68 Slip Op. at 29. 69 See e.g., Negev Phosphates, Ltd. v. U.S. Dep’t of Commerce, 12 CIT 1074, 1084, 699 F.Supp. 938, 947 (1988)(when commodity product is price sensitive, underselling of even small volumes can cause price suppression). 70 Original Views at 24.
11
Second, domestic producers should have been capable of increasing their prices withoutincreasing retail orange juice prices and consequently reducing downstream orange juice demand,because the gap between wholesale prices of certain orange juice and retail orange juice prices increasedover the period of investigation.63 This widening gap should have provided retailers with the financiallatitude to maintain retail orange juice prices even as domestic producers recovered their costs throughhigher certain orange juice prices.
Additional factors that should have made it easier for the domestic industry to raise prices andbreak out of its cost-price squeeze were the domestic industry’s limited capacity, the limited number ofcompetitors, and the inelasticity of certain orange juice demand.64 The relatively high concentration ofthe domestic industry and the unresponsiveness of demand to changes in price for certain orange juiceshould have afforded the domestic industry a degree of market power.
Despite strengthening apparent consumption, the growing gap between wholesale and retailprices, and other factors that should have facilitated price hikes, the cost-price squeeze affecting thedomestic industry intensified toward the end of the period examined,65 as the volume of low-pricedsubject imports increased more than the increase in U.S. apparent consumption. Subject import volumeincreased by 122.0 million gallons SSE, or 111.2 percent, over the period of investigation, outstrippingthe 50 million gallon SSE, or 3.5 percent, increase in U.S. apparent consumption over the period.66 Moreover, underselling by subject imports was significant and pervasive, with subject importsunderselling the domestic like product in 41 of 48 quarterly comparisons at margins averaging 8.3percent.67 The increase in certain orange juice supply relative to U.S. apparent consumption, coupledwith significant subject import underselling, placed pressure on prices for certain orange juice. We findthat the increase in the volume of low-priced subject imports in excess of U.S. apparent consumptiongrowth, in the absence of any residual demand that needed to be met by subject imports, contributedsignificantly to the domestic industry’s inability to raise prices commensurate with increasing costs. The Court also instructed the Commission to “consider how the level of subject imports held ininventory, consisting of at most 8.7% of the domestic inventories during the POI, and less than 5% in twoof the years of the POI, contributed significantly, rather than minimally, to the suppression of domesticprices.”68 We note at the outset that even a relatively modest increase in the volume of subjectmerchandise would likely have significant price-suppressing effects in a commodity market like that forcertain orange juice.69 In our original determination, we found that the increase in subject import volumebeyond what was necessary to meet U.S. demand served to almost double subject import inventoriesbetween crop year 2003/2004 and crop year 2004/2005.70 Specifically, subject import end-of-periodinventories increased by 24.7 million gallons SSE, or 92.9 percent, from 26.6 million gallons SSE in

71 CR/PR at Tables C-3 and IV-5. 72 Subject import end-of-period inventories were converted from 24.7 million gallons SSE to 25.4 million poundssolids using a conversion factor of 1.029 and dividing by domestic production in crop year 2004/2005 of 965.4million pounds solids. See CR/PR at Table III-6. 73 Original Views at 30 n.27. 74 Slip. Op. at 30.
12
2003/2004 (3.2 percent of U.S. ending stocks) to 51.3 million gallons SSE in 2004/2005 (8.7 percent ofU.S. ending stocks).71 This significant inventory of low-priced subject imports accumulated over the lastyear of the period examined, which was equal to 2.6 percent of domestic production that year,72 wouldhave dampened demand for the domestic like product just as domestic industry costs were increasing. We find that the timing and magnitude of the increase in subject import inventories, coupled with theprice sensitivity of the certain orange juice market, contributed significantly to the domestic industry’sinability to recoup higher costs through higher prices. We also note that our analysis of price effects isnot limited to the effects of the carryover inventories. Rather, in finding significant price effects, we havealso taken into account that total subject imports from Brazil, whether sold or inventoried, had price-suppressing effects by inhibiting domestic producers from raising prices sufficiently to cover costs.
Finally, in a footnote, the Court directed the Commission to consider evidence, and in particular achart submitted by Petitioners, showing that “monthly subject import volumes fluctuated significantly in amanner that did not correlate with fluctuations in prices.”73 We acknowledge the absence of any inversecorrelation between trends in subject import volume and trends in prices for the domestic like product,which increased towards the end of the period of investigation even as subject import volume increased. As explained above, however, we do not find that subject imports depressed domestic prices but thatsubject imports significantly suppressed domestic prices, preventing the domestic industry fromrecouping higher costs through higher prices to a significant degree. Although domestic prices increasedtoward the end of the period of investigation, they did not increase enough to compensate for higherdomestic industry costs, and the ratio of COGS to net sales reached its highest level of the periodexamined in crop year 2004/2005. A chart merely exhibiting trends in subject import volume anddomestic prices over the period of investigation does not capture the extent to which domestic prices weresuppressed or the factors that contributed to price suppression. Therefore, we do not find the referencedchart relevant to our pricing conclusions.
IV. Subject Imports Had a Significant Adverse Impact on the Domestic Industry
Although the Court did not expressly remand our analysis of impact, the Court did highlightevidence pertaining to impact that it apparently viewed as inconsistent with the Commission’s analysis. Specifically, the Court noted that the financial performance of several domestic processors appeared tohave been influenced by the hurricanes in the last year of the period of investigation:
The performance of the different domestic processors varied depending onwhether the processor was affected by the hurricanes in central Florida in 2004. For instance, processors which were not affected by the hurricanes, such asSouthern Gardens and Sunkist, were not negatively affected in CY 2004/05,while processors hit hardest by the hurricanes were negatively affected.74
The Court also opined that the domestic industry’s market share and capacity utilization had been influenced by the orange crop:

75 Id. at 30-31. 76 Original Views at 25-28. 77 We recognize here, as we did in the Original Views, that some of the declining trends experienced by domesticprocessors and growers, including trends in production, capacity utilization, and employment, in part reflect theeffects of hurricanes and the related spread of citrus diseases. See Original Views at 28. 78 The statute defines the domestic industry as “the producers as a whole of a domestic like product, or thoseproducers whose collective output of a domestic like product constitutes a major proportion of the total domesticproduction of that product.” 19 U.S.C. § 1677(4)(A).
13
The Commission’s statement that the domestic industry’s share of thedomestic market declined over the POI does not sufficiently explain thesituation here. The Commission failed to mention that the domesticindustry’s share of the domestic market is directly correlated to domesticproduction levels of the like product, including round oranges. It is notsurprising that the domestic industry’s share of the domestic marketdeclined when there was a tremendous fall in domestic production in CY2004/05 because of orange shortages. This would have occurred even ifthe level of subject imports had remained the same. Likewise, it is notsurprising that the domestic industry experienced a decline in domesticcapacity utilization from the first year of the POI to the last year of thePOI given the dramatic decline in domestic production.75
After considering the issues raised by the Court, we again find that subject imports are having asignificant adverse impact on the domestic industry.
As explained in our Original Views and supplemental discussion above, the subject importvolume and the increase in subject import volume were significant in absolute terms and relative to U.S.apparent consumption and production, particularly given that subject imports were unnecessary to satisfyany residual demand in the U.S. market. The domestic industry was in a position throughout the periodexamined to satisfy U.S. apparent consumption using domestic production and available inventory. Evenafter the downturn in domestic production following the 2004 Florida hurricanes, domestic processorshad record (and more than adequate) inventory on hand to satisfy domestic consumption, and domesticmarket share need not have declined as a result of any orange shortfall. Nevertheless, subject importsentered the U.S. market in excessive quantities, displacing domestic shipments and capturing marketshare from the domestic industry.
As explained in our Original Views and supplemental discussion above, this significant volumeof subject imports significantly undersold the domestic like product throughout the period ofinvestigation. Subject imports also significantly suppressed domestic prices by preventing the domesticindustry from raising domestic prices sufficiently to cover increasing costs, even after the hurricanes incrop year 2004/2005.
We find that these significant volume and price effects are having a significant adverse impact onthe domestic industry. By most measures, the domestic industry’s condition and financial indicatorsworsened over the period examined,76 even accepting that the domestic industry’s capacity utilization ratein crop year 2004/2005 was depressed in part by the poor orange crop.77 Although the performance ofcertain domestic producers may correlate with the hurricanes in the last year of the period examined, wehave considered the impact of subject imports on the domestic industry “as a whole,” as statutorilyrequired,78 and have not confined our analysis to adverse effects manifested only during the final year ofthe POI.
As explained in the Original Views, we find that the hurricanes did not sever the causal nexusbetween subject imports and the material injury to the domestic industry, given significant subject import

79 Original Views at 28. 80 CR/PR at Table IV-6. 81 Slip Op. at 33-34. 82 Original Views at 28 n.197. 83 Id. 84 Slip Op. at 33-34.
14
underselling, the price-sensitivity of the certain orange juice market, and the cost-price squeeze that thedomestic industry suffered as subject imports suppressed domestic prices to a significant degree.79 Thedomestic industry’s performance was deteriorating before the hurricanes in crop year 2002/2003, whensubject import volume was 227.3 million gallons SSE, and its performance continued to decline after thehurricanes in crop year 2004/05, when subject import volume was at a similarly high level (231.7 milliongallons SSE).80
We therefore conclude that the domestic industry producing certain orange juice is materiallyinjured by reason of subject imports of certain orange juice from Brazil that are sold in the United Statesat less than fair value.
V. Consideration of the Opposition to the Petition by a Majority of Processors
The Court also remanded for further explanation of why the Commission gave little weight to thelack of support for the petition by the majority of processors, notwithstanding the Commission’s relianceon their data in addressing impact.81 In the original determination, the Commission took into accountcertain processors’ opposition to the petition, stating: “[w]e recognize that U.S. processors accounting for*** percent of U.S. production of certain orange juice in crop year 2004/05 oppose the petition in thisfinal phase investigation.”82 The Commission also explained that “[w]hile the degree of support bymembers of the domestic industry for the petition may be a factor considered by the Commission, such afactor is not dispositive.”83 While acknowledging that the opposition to the petition by the majority ofdomestic processors did not preclude an affirmative determination, the Court directed the Commission onremand to explain its rationale for reaching an affirmative determination in the face of industryopposition.84
Where, as here, the evidence shows that the domestic industry is materially injured by reason ofthe subject imports, the matter of whether particular producers or a particular subset of producers supportthe petition does not prevent the Commission from making an affirmative determination. In our view, themore important and objective consideration is whether the shipment, financial, market share, andinventory data demonstrate that the domestic industry as a whole suffered material injury by reason ofsubject imports from Brazil. The level of industry support for the petition is one factor among many, andwe find that the record as a whole demonstrates material injury by reason of subject imports from Brazil. We do not know – and will not speculate on – the motives of certain domestic processors foropposing the petition. A domestic producer’s decision whether to support the petition is frequently basedon a subjective judgment regarding legal strategy. Producer opposition to the petition, in and of itself, isnot evidence of lack of injury to a particular producer, let alone lack of injury to the domestic industry asa whole, or evidence of a lack of causation. Our review of the evidence shows that the domestic industryis materially injured. As we explained in the Original Views, the domestic industry’s financial indicatorsworsened throughout the period examined, and the industry’s condition deteriorated by most other

85 Original Views at 25-28. 86 CR/PR at Table III-5. 87 The other *** domestic producers opposing the petition do not have ties to subject Brazilian producers andaccounted for *** percent of domestic production in crop year 2004/05. CR/PR at Table III-5. 88 The related party inquiry, which concerns whether a particular firm is benefitting from importation, differsfrom the inquiry as to why a particular firm may oppose a petition. Indeed, the domestic industry’s support oropposition to the petition is a subjective factor; there are many conceivable reasons why a particular domesticproducer might support or oppose the petition regardless of whether it derives any tangible, financial benefit fromthe subject imports. 89 These *** domestic processors accounted for *** percent of the production of all processors that opposed thepetition. CR/PR at Table III-5. 90 CR/PR at Table III-1. 91 CR at III-3 to III-5; PR at III-3 to III-4. With respect to the growers, we note that the coverage rate discussedby Tropicana and noted by the Court (slip op. at 19) is actually lower than the rate if based upon production oforanges used for processing. If coverage is based specifically on processed oranges, which we find to be moremeaningful than calculating the percentage of total U.S. oranges produced (both for eating and processing), the U.S.grower financial data discussed in the Original Views accounted for 20 percent of total U.S. processed oranges and22 percent of Florida processed oranges during the 2004/05 crop year. Memorandum INV-EE-055 (May 25, 2007)at I-4 and Table I-1.
15
measures, including market share, domestic shipments, number of production workers employed byprocessors, hours worked, and wages.85
Out of the total, *** domestic processors, accounting for *** percent of domestic production inthe final crop year of the period examined, supported the petition.86 *** producers, accounting for ***percent of domestic production, opposed the petition. These *** include *** large processors, accountingfor approximately *** percent of domestic production in the final year of the period examined, that havecorporate ties to companies with financial interests in the production or importation of the Braziliansubject product.87 Notwithstanding our determination that each of these related domestic producers’interest in domestic production was sufficient to include it in the industry, we attach significance to these*** processors’ relationships with Brazilian subject producers and subject merchandise, which likelyinfluenced their position in this investigation.88 Therefore, we give less weight to their opposition to thepetition under the particular circumstances present here.89
*** of the 36 responding growers, whose financial interests are directly tied to those of domesticprocessors, supported the petition, and *** opposed it.90 Especially in light of the highly fragmentednature of the grower segment of the industry and the proportionally greater burden placed on a smallentity such as a grower in replying to the questionnaires, we do not penalize the growers for theimbalance between the percentage of growers supporting the petition and the percentage of processorssupporting the petition. This is especially so given the timing of this investigation in the aftermath of the2004 and 2005 hurricanes, which caused significant damage to the Florida groves, disrupting growers’operations and making it more burdensome for them to complete questionnaires.91
VI. Totality of the Evidence
In addition to ordering the Commission to address the four specific issues discussed above, theCourt directed the Commission to “consider the totality of the evidence anew.” Slip Op. at 43. Pursuantto these instructions, we have, as we always do in any remand, considered the entire record in light of any

92 As discussed supra, on issues relating to ULPOJ imports, the need for subject imports for blending and dutydrawback, and the level of grower questionnaire responses, the court upheld the Commission’s findings “inisolation,” but noted that the Commission may wish to reexamine them when reviewing the record as a whole. Wehave reviewed all of the evidence in the record and find that the record continues to support both our findings withrespect to these issues and our affirmative determination. 93 Slip Op. at 34-40. 94 Bratsk, 444 F.3d at 1375. 95 Id. 96 For a full discussion of our views on the applicability of Bratsk, see our Views in the Remand Determinationfor Silicon Metal from Russia, Inv. No. 731-TA-991 (Final) (Second Remand), USITC Pub. 3910 (March 2007). For a full discussion of Vice Chairman Aranoff’s views on the applicability of Bratsk, see the Views of theCommission in Carbon and Certain Alloy Steel Wire Rod from Trinidad and Tobago, Inv. No. 731-TA-961 (Final)(Remand), USITC Pub. 3903 (January 2007). For a full discussion of Chairman Pearson’s views on the applicabilityof Bratsk, see his Separate and Additional Views in Silicon Metal from Russia. For a full discussion ofCommissioner Okun’s views of the applicability of Bratsk, see her Separate and Dissenting Views in Certain LinedPaper School Supplies from China, India, and Indonesia, Inv. Nos. 701-TA-442-443, 731-TA-1095-1097 (Final),USITC Pub. 3884 (Sept. 2006). 97 See Uruguay Round Agreements Act Statement of Administrative Action (“SAA”) H.R. Rep. No. 103-316, at851-852 (1994). 98 H.R. Rep. No. 317, 96th Cong., 1st Sess. at 47 (“Any such requirement has the undesirable result of makingrelief more difficult to obtain for those industries facing difficulties from a variety of sources, precisely thoseindustries that are most vulnerable to subsidized or dumped imports.”).
16
new findings we have made. Having considered the record as a whole, we reaffirm our findings on allother issues.92
VII. Application of the Bratsk Replacement/Benefit Test
In its remand instructions, the CIT directed the Commission to conduct the examination requiredby the Federal Circuit’s decision in Bratsk.93 Bratsk requires that, having reached an affirmativedetermination by application of the statutorily mandated factors, we must apply an additional analysiswhich can, in some circumstances, negate an affirmative determination. The Federal Circuit directed theCommission to undertake an “additional causation inquiry” if certain triggering factors are met, i.e., “whenever the antidumping investigation is centered on a commodity product, and price competitive non-subject imports are a significant factor in the market.”94 The additional inquiry required by Bratsk, whichwe refer to as the Bratsk replacement/benefit test, is “whether non-subject imports would have replacedthe subject imports without any beneficial effect on domestic producers.”95
We respectfully disagree with the decision in Bratsk that the statute requires any analysis beyondthat already included in our discussion of volume, price, and impact above.96 The statutory scheme contemplates that an industry may be facing difficulties from a variety of sources, including non-subjectimports and other factors, but the existence of injury caused by other factors does not compel a negativedetermination if the subject imports themselves are making more than a minimal or tangentialcontribution to material injury.97 The legislative history further clarifies that the dumped imports need notbe the “principal” cause of material injury and that the “by reason of” standard does not contemplate thatinjury from dumped imports be weighed against injury from other factors, such as non-subject imports,which may be contributing to overall injury to an industry.98 Thus, once the Commission establishes theexistence of a causal link between subject imports and material injury, the existence of other concurrentcauses is legally irrelevant to its determination.

99 Huaiyin Foreign Trade Corp. v. United States, 322 F.3d 1369, 1380 (Fed. Cir. 2003). 100 SAA at 883-85, 889-90. 101 Wooden Bedroom Furniture from China, Inv. No. 731-TA-1058 (Final), USITC Pub. 3742 (Dec. 2004) at 27,n. 222. 102 See Silicon Metal from Russia, Inv. No. 731-TA-991 (Second Remand), USITC Pub. 3910 (Mar. 2007) at 3-8(articulating in detail the Commission’s longstanding interpretation of the “by reason of” causation standard). 103 Respondents themselves have observed in this remand investigation that the Bratsk directive to examinecapacity and production by producers in non-subject countries shows a misunderstanding of the statutory scheme,given that such producers have no incentive to provide this information to the Commission. See Respondents’request that the Commission seek additional data (May 4, 2007). 104 Chairman Pearson and Commissioner Okun discern two possible interpretations of the Bratsk opinion, whichdiffer substantially. The so-called “replacement/benefit test” is noted above. The second one is that Bratsk is anelaboration of the causation analysis prescribed by Gerald Metals. Under this interpretation, the Bratsk decisionstands to remind the Commission of its obligation under Gerald Metals that the Commission may not satisfy the “byreason of” causation requirement by showing that subject imports contributed only “minimally or tangentially to thematerial harm.” In other words, the Bratsk Court’s relatively short discussion of the underlying determination maynot have established a new and rigid replacement/benefit test. Rather, the Court may have discussed the triggeringfactors as a reminder that the Commission, before it makes an affirmative determination, must satisfy itself that it hasnot attributed material injury to factors other than subject imports. See Separate and Additional Views of ChairmanDaniel R. Pearson and Commissioner Deanna Tanner Okun Concerning Bratsk Aluminum v. United States in,Sodium Hexametaphosphate from China, Inv. No. 731-TA-1110 (Preliminary), USITC Pub. 3912 (April 2007). Thisanalysis is included in the Commission’s affirmative causation analysis. 105 Bratsk, 444 F.3d at 11.
17
Similarly, the statute does not permit the Commission to reach a negative determination based onthe likely ineffectiveness of an order. Indeed, the purpose of the statute is not to bar or eliminate subjectimports from the U.S. market or award subject import market share to U.S. producers, but instead to“level [] competitive conditions” by imposing a duty on subject imports and thus enabling the domesticindustry to compete against fairly traded imports.99 The statutory scheme in fact contemplates that subjectimports may remain in the U.S. market after an order is imposed and even that the industry afterwardsmay continue to suffer material injury.100 As the Commission has previously explained,
[N]othing in the statute or case law requires (or allows) us to consider the likelyeffectiveness of a dumping order in making our injury determination. Thepossibility that non-subject imports will increase in the future after anantidumping order is imposed is ... not relevant to our analysis of whethersubject imports are currently materially injuring the industry.101
The Commission has a well established approach to addressing causation.102 We apply the Bratskreplacement/benefit test to our analysis, however, because the CIT has directed us to do so in light ofBratsk, notwithstanding that, in our considered view, this test is not required by, or consistent with, thestatute.103 104
As noted above, the Bratsk analysis “is triggered whenever the antidumping investigation iscentered on a commodity product, and price competitive non-subject imports are a significant factor in themarket.”105 If both Bratsk triggering factors are satisfied, we apply the “replacement/benefit” test requiredunder Bratsk to determine whether non-subject imports could replace subject imports with no benefit tothe domestic industry. We find that one of the Bratsk triggers is not satisfied in this investigation, andtherefore it is unnecessary for us to take the further step of determining whether non-subject importswould have replaced subject imports with no beneficial effects for the domestic industry.

106 Views at 24 n.166. 107 CR at II-9; PR at II-6. See Original Determination at 21-22. 108 Slip Op. at 37; CR/PR at Table IV-2. 109 Slip Op. at 37. 110 See, e,g, CR/PR at Table IV-5; Memorandum INV-EE-055 at I-31 and Table I-10; Hearing Tr. at 43-44 (Mr.Behr); 50 (Ms. Warlick). 111 See, e.g., Polyester Staple Fiber from China, Inv. 731-TA-1104, USITC Pub. 3922 (June 2007) at 40-41. 112 Memorandum INV-EE-055 Views of the Commission 1Views of the Commission 1at Table I-6. 113 Original Views at 27-28; CR/PR at Table IV-5.
18
A. The First Triggering Factor: Whether Certain Orange Juice Is a CommodityProduct
We find that certain orange juice qualifies as a commodity product based upon Bratsk’s definitionof “commodity product” as “meaning that it is generally interchangeable regardless of its source.” Noparty argues otherwise. Indeed, FCOJM futures are traded on the New York Board of Trade ascommodities.106 Further, the record indicates that purchasers generally view certain orange juice asinterchangeable regardless of the source and that it is a price competitive product.107
B. The Second Triggering Factor: Whether Price Competitive Non-subject ImportsAre a Significant Factor in the Market
We find that price competitive non-subject imports are not a significant factor in the U.S. marketbased on the relatively low market share held by such imports. As the CIT noted in this case, the non-subject imports comprised 40.8 percent of total U.S. imports of certain orange juice in crop year 2001/02,20.8 percent in crop year 2002/03, 29.4 percent in crop year 2003/04, and 34.2 in crop year 2004/05.108 While, as the Court suggested, these percentages may not be so small as to render the nonsubject imports“an indisputably insignificant factor in the market,”109 the record indicates that domestic and Brazilianproduct are by far the most significant sources of certain orange juice in the United States.110 Consistentwith the approach we find most useful for assessing the significance of non-subject imports in the U.S.market,111 we have examined the market share of such imports and find they do not rise to the levelnecessary to trigger a Bratsk analysis. In particular, the share of U.S. apparent consumption comprised ofnon-subject imports was 5.2 percent in crop year 2001/02, 4.2 percent in crop year 2002/03, 4.5 percent incrop year 2003/04, and 8.0 percent in crop year 2004/05, while the share comprised of subject importswas 7.6 percent in crop year 2001/02, 15.9 percent in crop year 2002/03, 10.7 percent in crop year2003/04, and 15.4 percent in crop year 2004/05.112 Thus, even at their highest level of 8.0 percent ofapparent consumption, non-subject imports’ market share was only at the level held by subject importsbefore the subject imports’ surge late in the POI. Moreover, as discussed in the Original Views, althoughnon-subject imports’ share of the U.S. market increased overall by 2.8 percentage points during the periodexamined, subject imports gained far more market share at the expense of the domestic industry than didnonsubject imports.113
The three largest non-subject sources of certain orange juice in the United States accounted,respectively, for 15.6 percent of U.S. imports and 3.7 percent of U.S. apparent consumption in crop year

114 Memorandum INV-EE-055 at Tables, I-5, I-6, & I-13. 115 Id. at I-37 and Tables I-5 & I-6. 116 Id. at Table I-13 and Tables I-5 & I-6. 117 We note that Brazilian exports dwarfed orange juice exports from all countries, accounting for approximately90 percent of all worldwide orange juice exports throughout the POI. See Memorandum INV-EE-055 at Tables I-5& I-13. 118 Id. at Table I-14 and CR/PR at Table VII-4.
19
2004/05 (Mexico);114 8.6 percent of U.S. imports and 2.0 percent of U.S. apparent consumption in cropyear 2004/05 (Belize);115 and 8.4 percent of U.S. imports and 2.0 percent of U.S. apparent consumption incrop year 2004/05 (Costa Rica).116 Brazilian juice, in comparison, consistently made up the substantialmajority of U.S. imports.117
There were *** imports of non-subject Brazilian certain orange juice to the United States duringthe POI, and therefore there were *** imports, let alone “price competitive” non-subject Brazilianimports, that played a significant role in the U.S. market. The only non-subject Brazilian producer,Citrovita, which was subject to an earlier U.S. antidumping duty order imposed during the POI, exported*** orange juice to the United States *** during the POI. Moreover, although Citrovita projected that itwould import some certain orange juice to the United States in crop years 2005/06 and 2006/07, itsprojected U.S. exports were modest, at *** pounds solid and *** pounds solid, respectively, as comparedto the subject Brazilian producers’ projected exports to the United States of *** pounds solid for cropyear 2005/06 and *** pounds solid for crop year 2006/07.118 As such, we find that non-subject Brazilianimports do not play a significant role in the U.S. market and that application of a Bratsk analysis istherefore unwarranted with respect to Citrovita.
In light of the data reflecting the small role of nonsubject imports, we conclude that non-subjectimports are not a significant presence in the U.S. market. Accordingly, we do not find the secondtriggering factor identified in Bratsk to be present. It therefore is unnecessary for us to apply the Bratskreplacement/benefit test.
VII. Conclusion
For the above-stated reasons, we determine that the domestic industry producing certain orangejuice is materially injured by reason of subject imports of certain orange juice from Brazil that are sold inthe United States at less than fair value.


1 Certain Orange Juice from Brazil, Inv. No. 731-TA-1089 (Final), USITC Publication 3838, March 2006, p. 1. The subject product is certain orange juice for transport and/or further manufacturing, produced in two differentforms: (1) frozen orange juice in a highly concentrated form, sometimes referred to as frozen concentrated orangejuice for further manufacturing (“FCOJM”); and (2) pasteurized single-strength orange juice which has not beenconcentrated, referred to as NFC (“Not-From-Concentrate”). Commerce expressly excluded from the scopereconstituted orange juice and frozen orange juice for retail (“FCOJR”). Reconstituted orange juice is producedthrough further manufacture of FCOJM, by adding water, oils and essences to the orange juice concentrate. FCOJRis concentrated typically at 42 degrees Brix, in a frozen state, packed in retail size containers ready for sale toconsumers. FCOJR is a finished consumer product, and is produced through manufacture of FCOJM, a bulkmanufacturer's product. Ibid., p. 4. The scope of this investigation with regard to FCOJM covers only FCOJMproduced and/or exported by those companies which were excluded or revoked from the pre-existing antidumpingorder on FCOJ from Brazil as of December 27, 2004. Those companies are Cargill, Coinbra (successor-in-interest toFrutropic), Cutrale, Fisher, and Montecitrus. Ibid., pp. I-4 and I-5.
Certain orange juice was provided for in the Harmonized Tariff Schedule of the United States (“HTS”) insubheadings 2009.11.00 (frozen orange juice), 2009.12.25 and 2009.12.45 (orange juice, not frozen, of a Brix valuenot exceeding 20), and 2009.19.00 (orange juice, other). In the HTS, the volume (i.e., liter or gallon) of FCOJM, ison a single strength equivalent (“SSE”) basis. The Brix level is a measurement of the sugar content expressed inpercent by weight of solids.
The normal trade relations tariff rate for subheading 2009.12.25 is 4.5 cents/liter, while the rate for the otherthree subheadings is 7.85 cents/liter, all applicable to imports from Brazil; this rate was not reduced as a result of theUruguay Round of Trade Negotiations. No GSP preference exists. Ibid., p. I-15., n. 11. 2 Chairman Stephen Koplan and Commissioners Charlotte R. Lane and Shara L. Aranoff made affirmativedeterminations; Vice Chairman Deanna Tanner Okun and Commissioners Jennifer A. Hillman and Daniel R.Pearson made negative determinations. Certain Orange Juice from Brazil, Inv. No. 731-TA-1089 (Final), USITCPublication 3838, March 2006, p. 1. 3 Plaintiff-Intervenors included Louis Dreyfus Citrus, Inc., and Fischer S/A Agroindustria. 4 Federal Register notices cited in the tabulation are presented in app. A.
I-1
INFORMATION IN THE REMAND PROCEEDING
BACKGROUND AND COURT ORDER
On February 27, 2006, the U.S. International Trade Commission (“Commission”) determined that an industry in the United States was materially injured by reason of imports from Brazil of certainorange juice.1 2 Respondent Tropicana Products, Inc. (“Plaintiff”)3 appealed the Commission’sdetermination to the U.S. Court of International Trade (“CIT”). On April 12, 2007 the CIT remanded thecase to the Commission and instructed the Commission to render a determination within 75 days.
Summary information related to this remand proceeding is presented below.4

5 Bratsk Aluminum Smelter v. United States, 444 F.3d at 1375. 6 As noted in the Commission’s original determination and as shown in table I-5 of this memorandum, imports ofcertain orange juice from Belize, Costa Rica, and Mexico, accounted for 32 of the 34 percent of total U.S. imports ofcertain orange juice from nonsubject sources in 2004. Certain Orange Juice from Brazil, Inv. No. 731-TA-1089(Final), USITC Publication 3838, March 2006, p. 42.
I-2
Date ActionDecember 27, 2004 Petition filed with Commerce and the Commission1
March 3, 2006 Commission’s final determination published in the Federal Register (71 FR 10993)
March 9, 2006 Commerce issued antidumping duty order (71 FR 12183)
May 7, 2007 Commission issues notice and scheduling of remand proceeding (72 FR25778)2
May 25, 2007 Commission releases new information gathered in the remand proceeding tothe parties
May 31, 2007 Final comments of parties due to the Commission
June 26, 2007 Commission scheduled to transmit its second remand determination to the CIT
1 Petitioners included Florida Citrus Mutual (a voluntary cooperative organization whose membership consistsof more than 10,400 growers of citrus fruit for processing into certain orange juice and other processed citrusproducts, as well as fruit for fresh consumption); A. Duda & Sons, Inc.; Citrus World, Inc.; Peace River CitrusProducts, Inc.; and Southern Garden Citrus Processing Corp. On January 31, 2005, petitioners submitted a letterto the Commission modifying the petition to remove Peace River as a petitioner. 2 Remand instructions from the CIT opinion are presented in app. B. Tropicana Products, Inc. v. United States,Slip Op. 07-55, CIT 2007, April 12, 2007.
THE COMMISSION’S COMPLIANCE METHODOLOGY
During this remand proceeding, the Commission determined to reopen the record of the originalinvestigation in order to obtain new information concerning the certain orange juice industries in Belize,Costa Rica, and Mexico, relevant to the inquiry set out in the Court of Appeals for the Federal Circuit(“CAFC”) decision in Bratsk Aluminum Smelter v. United States (“Bratsk”).5 6 Accordingly, theCommission issued foreign producer questionnaires to two firms in Belize, five firms in Costa Rica, andfour firms in Mexico. The Commission also arranged for cables seeking foreign industry information tobe sent to the U.S. embassies in Belize, Costa Rica, and Mexico. In addition, the Commission compiledavailable secondary-source data from public sources, including (1) official import statistics of the U.S.Department of Commerce (“Commerce”), (2) Global Agricultural Information Network (“GAIN”) reportsof the U.S. Department of Agriculture (“USDA”), (3) Production, Supply, and Distribution(“PDS”) Online data of the USDA , and (4) international trade data of the Global Trade InformationServices, Inc. (“Global Trade Atlas”).
The countries and firms from which the Commission sought information are presented in thefollowing tabulation:

7 Additions and revisions to the staff report are contained in Investigations memoranda INV-DD-014, February 2,2006; INV-DD-015, February 6, 2006; and INV-DD-016, February 7, 2006. 8 The random sample of growers was supplemented to include, as necessary, large orange growers identifiedthrough searches of public sources. 9 Certain Orange Juice from Brazil, Inv. No. 731-TA-1089 (Final), USITC Publication 3838, March 2006, p. III-1. 10 Certain Orange Juice from Brazil, Inv. No. 731-TA-1089 (Final), USITC Publication 3838, March 2006, p. VI-11. 11 As noted by the Commission during the original investigation, “(t)here are two economically important types oforanges: round oranges and specialty oranges. ‘ “Round oranges” ’ include navel, Hamlin, Parson Brown,Pineapple and Valencia oranges. The bulk of round oranges are processed into certain orange juice with most of the
(continued...)
I-3
Country Firm
Belize Belize Citrus Growers AssociationCitrus Products of Belize Limited
Costa Rica TicoFruitDel Oro S.A.Dos PinosFrutca C.R., S.A.Suco Citro, S.A.
Mexico Citrofrut S.A. de C.V.Procimart S.A. de C.V.Citrotam International, S.P.R. de R.I.Fruitec
The Commission received responses to its foreign producer questionnaires from three firms: CitrofrutS.A. de C.V., Mexico, Del Oro S.A., Costa Rica and Procimart S.A. de C.V., Mexico. The Commissionalso received a response from the U.S. embassy in Costa Rica.
Information presented in this remand memorandum relates to further analysis of U.S. growercoverage and U.S. processor inventory supply, as well as new information on production, imports, andexports by foreign producers/exporters in Belize, Costa Rica, and Mexico. This information is intendedfor use in conjunction with the confidential staff report (as revised) issued during the originalinvestigation, INV-DD-010, dated January 27, 2006.7 Summary data on the U.S. market are presented inappendix C.
FURTHER ANALYSIS OF U.S. GROWER COVERAGE AND U.S. PROCESSORS’ INVENTORY SUPPLY
As indicated in the staff report during the original investigation, there were approximately 7,000farms in Florida that grew oranges in 2002. Based on a listing of such growers submitted by petitioners, arandom sample of 400 domestic growers of juice oranges were selected to receive the Commission’sgrower questionnaire during the original investigation.8 Forty-one growers, or about 10 percent of allFlorida orange growers, provided responses to the questionnaire with varying degrees of useable data.9 The Commission’s final staff report presented the financial results of *** U.S. orange growers andindicated that the responding growers represented “approximately 12 percent of U.S. production oforanges.”10 That coverage rate was estimated based on total U.S. oranges produced (i.e., oranges for both fresh consumption and processing) during the period of investigation.11 If coverage was based

11 (...continued)remainder (mainly navel oranges) sold for fresh eating.” Certain Orange Juice from Brazil, Inv. No. 731-TA-1089(Final), USITC Publication 3838, March 2006, p. 10, fn. 65.
I-4
specifically on processed oranges, U.S. grower financial data presented in table VI-15 of the original staffreport accounted for 20 percent of total U.S. processed oranges and 22 percent of Florida processedoranges during the 2004/05 crop year (table I-1).
Table I-1Oranges: U.S. growers’ net sales, total oranges, and ratio of growers’ net sales to total oranges,crop years 2002/03 to 2004/05 and average 2002/03-2004/05
Item
Crop year Total/average
2002/03 2003/04 2004/05 2002/03-2004/05
Net sales (1,000 90-pound boxes)
U.S. growers’ questionnaireresponses (*** firms) 33,607 36,883 31,162 101,652
Total oranges (1,000 90-pound boxes)
Total oranges produced:
Florida 203,000 242,000 149,600 594,600
Total U.S. 283,760 267,040 294,620 845,420
Total processed oranges:
Florida 193,287 232,107 142,217 567,611
Total U.S. 206,000 238,690 155,452 600,142
Ratio of growers’ net sales to total oranges (percent)
Total oranges produced:
Florida 16.6 15.2 20.8 17.1
Total U.S. 11.8 13.8 10.6 12.0
Total processed oranges:
Florida 17.4 15.9 21.9 17.9
Total U.S. 16.3 15.5 20.0 16.9
Source: Compiled from table III-2 and VI-15, Certain Orange Juice from Brazil, Inv. No. 731-TA-1089 (Final),USITC Publication 3838, March 2006.
The Court instructed the Commission to consider on remand whether subject imports were needed tomaintain a certain level of overall inventories to deal with shortfalls in domestic production. In its U.S.extractor/processor and U.S. importer questionnaires in the original investigation, the Commissionrequested information as to the reasons a firm imported/purchased certain orange juice. Provided in tableI-2 is information pertinent to this request derived from Commission questionnaires.

I-5
Table I-2Certain orange juice: Reasons for importing and purchasing orange juice, provided by importersand processors/extractors, by firm
Firm Comments
ImportersResponse to the following question in the importers’ questionnaire (question Part II-5 ): “If your firmalso produces certain orange juice in the United States, please indicate your reasons for importing thisproduct. If your reasons differ by source, please elaborate.”
* * * * * * *
Processors/ ExtractorsResponse to the following question in the processors’/extractors’ questionnaire (question Part II-21,n.1): “Please indicate your reasons for purchasing this product(s). If your reasons differ by productand/or source, please elaborate.”
* * * * * * *
Source: Compiled from data submitted in response to Commission questionnaires.
Data relating to U.S. processors’ U.S.-produced and import end-of-period inventories, ratios to shipments,and inventory supply, on a company-by-company basis, are presented in tables I-3 and I-4. Data relatingto U.S. processors’ U.S.-produced and import beginning inventories, ratios to shipments, and inventorysupply, on a company-by-company basis, are presented in tables I-3A and I-4A.

I-6
Table I-3Certain orange juice: U.S. extractor/processors’ inventories, shipments, ratio of inventories toshipments, and weeks of supply, by firm, crop year 2001/02-2004/05
Item
Crop year Crop year Crop year
2001/02 2002/03 2003/04 2004/05 2001/02 2002/03 2003/04 2004/05 2001/02 2002/03 2003/04 2004/05
FCOJM NFCOJ Certain OJ
End-of-period inventories (1,000 pounds solid equivalent (PSE)1)
* * * * * * *Total 289,580 293,214 377,622 266,243 134,161 146,598 162,762 148,938 423,741 439,812 540,384 415,181
Total shipments (1,000 pounds solid equivalent)
* * * * * * *Total 936,848 668,273 862,554 515,013 519,930 576,974 560,552 595,096 1,456,778 1,245,247 1,423,106 1,110,109
Ratio of end-of-period inventories to total shipments (percent)
* * * * * * *Total 30.9 43.9 43.8 51.7 25.8 25.4 29.0 25.0 29.1 35.3 38.0 37.4
End-of-period weeks of supply (number of weeks)
* * * * * * *Total 16.1 22.8 22.8 26.9 13.4 13.2 15.1 13.0 15.1 18.4 19.7 19.4
1 Pounds solid equivalent (“PSE”) is the extracted orange solids regardless of their form, i.e., FCOJM, other FCOJ, single-strengthorange juice (“SSOJ”), or other form.
Source: Compiled from data submitted in response to Commission questionnaires.
Table I-4Certain orange juice: U.S. extractor/processors’ U.S.-produced and import inventories, and ratioof import inventory to U.S.-produced inventory, by firm, crop years 2001/02-2004/05
Item
Crop year Crop year
2001/02 2002/03 2003/04 2004/05 2001/02 2002/03 2003/04 2004/05
U.S.-produced Imports from Brazil
End-of-period inventories (1,000 pounds solid equivalent)
* * * * * * *
Total 423,741 439,812 540,384 415,181 34,771 42,868 27,404 52,408
Ratio of import to U.S.-produced end-of-period inventories (percent)
U.S. processors’ end-of-period weeks ofsupply, including import and U.S.-
produced inventories (number of weeks)
* * * * * * *
Total 8.2 9.7 5.1 12.6 16.4 20.2 20.7 21.9
Source: Compiled from data submitted in response to Commission questionnaires.

I-7
Table I-3ACertain orange juice: U.S. extractor/processors’ beginning inventories, shipments, ratio of inventoriesto shipments, and weeks of supply, crop years 2001/02-2004/05
Item
Crop year Crop year Crop year
2001/02 2002/03 2003/04 2004/05 2001/02 2002/03 2003/04 2004/05 2001/02 2002/03 2003/04 2004/05
FCOJM NFCOJ Certain OJ
Beginning inventories1 (1,000 pounds solid equivalent (PSE)2
* * * * * * *Total 275,509 290,249 295,119 370,364 128,085 133,457 148,064 161,747 403,594 423,706 443,183 532,111
Total shipments (1,000 pounds solid equivalent)
* * * * * * *Total 936,848 668,273 862,554 515,013 519,930 576,974 560,552 595,096 1,456,778 1,245,247 1,423,106 1,110,109
Ratio of beginning inventories to total shipments (percent)
* * * * * * *Total 29.4 43.4 34.2 71.9 24.6 23.1 26.4 27.2 27.7 34.0 31.1 47.9
Beginning weeks of supply (number of weeks)
* * * * * * *Total 15.3 22.6 17.8 37.4 12.8 12.0 13.7 14.1 14.4 17.7 16.2 24.9
1 Total beginning inventories reported in this table do not reconcile with the end-of-inventories for the prior period as reported in table I-3. The difference is attributable to disparities in those data as reported by *** in its U.S. extractor/processor questionnaire response in theoriginal investigation. 2 Pounds solid equivalent (“PSE”) is the extracted orange solids regardless of their form, i.e., FCOJM, other FCOJ, single-strengthorange juice (“SSOJ”), or other form.
Source: Compiled from data submitted in response to Commission questionnaires.
Table I-4ACertain orange juice: U.S. extractor/processors’ U.S.-produced and import beginninginventories, and ratio of import inventory to U.S.-produced inventory, crop years 2001/02-2004/05
Item
Crop year Crop year
2001/02 2002/03 2003/04 2004/05 2001/02 2002/03 2003/04 2004/05
U.S.-produced Imports from Brazil
Beginning inventories (1,000 pounds solid equivalent)
* * * * * * *
Total 403,594 423,706 443,183 532,111 52,373 34,771 42,868 27,404
Ratio of import to U.S.-produced beginning inventories (percent)
U.S. processors’ beginning weeks ofsupply, including import and U.S.-
produced inventories (number of weeks)
* * * * * * *
Total 13.0 8.2 9.7 5.2 16.3 19.1 17.8 26.2
Source: Compiled from data submitted in response to Commission questionnaires.

12 Silicon Metal from Russia, Inv. No. 731-TA-991 (Second Remand), USITC Publication 3910, March 2007, p. 2;citing Bratsk Aluminum Smelter v. United States, 444 F.3d at 1375. 13 In the silicon metal remand, Chairman Pearson noted “consistent with his views in Lined Paper SchoolSupplies From China, India, and Indonesia, Inv. Nos. 701-TA-442-443 and 731-TA-1095-1097 (Final), USITC Pub.3884 (Sept. 2006) at 51, that while he agrees with the Commission that the Federal Circuit’s opinion suggests areplacement/benefit test, he also finds that the Federal Circuit’s opinion could be read, not as requiring a new test,but rather as a reminder that the Commission, before it makes an affirmative determination, must satisfy itself that ithas not attributed material injury to factors other than subject imports.” Silicon Metal from Russia, Inv. No. 731-TA-991 (Second Remand), USITC Publication 3910, March 2007, p. 2, fn. 17. Commissioner Okun joined in thoseseparate and dissenting views in Lined Paper. 14 Organic orange juice is classified in the same subheadings as conventional orange juice. 15 Certain Orange Juice from Brazil, Inv. No. 731-TA-1089 (Final), USITC Publication 3838, March 2006, p. 9. 16 The Commission stated in its original final views that, other than Brazilian nonsubject imports, the primarysources of nonsubject imports during the period examined included Belize, Costa Rica, Honduras, Mexico, SouthAfrica, and the Dominican Republic. Certain Orange Juice from Brazil, Inv. No. 731-TA-1089 (Final), USITCPublication 3838, March 2006, p. 16, n.120.
I-8
DATA ADDRESSING THE COMMISSION’S BRATSK ANALYSIS
As a result of the CAFC’s decision in Bratsk, the Commission is directed to:
undertake an “additional causation inquiry” whenever certain triggering factors aremet: “whenever the antidumping investigation is centered on a commodity product, andprice competitive non-subject imports are a significant factor in the market.” Theadditional inquiry required by the Court, which we refer to as the Bratskreplacement/benefit test, is “whether non-subject imports would have replaced thesubject imports without any beneficial effect on domestic producers.12 13
U.S. Imports and Apparent U.S. Consumption
Information presented in this section of the report relates to imports and apparent consumption ofcertain orange juice, by source, during the original period of investigation: crop years 2001/02 to2004/05. Separate data on frozen orange juice in a highly concentrated form for manufacturing (FCOJM)and pasteurized single-strength orange juice which has not been concentrated (NFCOJ) are presented inappendix D.14 The Commission determined in the final phase of the original investigation thatconventional FCOJM, conventional NFC, organic FCOJM, and organic NFC are a single domestic likeproduct coextensive with Commerce’s scope.15
Table I-5 presents a detailed listing of U.S. imports from nonsubject sources which supplementsthe information presented in table IV-2 of the staff report in the original investigation. Almost allnonsubject merchandise in 2004/05 was imported from Mexico, Belize, and Costa Rica.16 U.S. importsfrom these three sources accounted for 32.6 percent of total imports while imports of subject merchandisefrom Brazil accounted for 65.8 percent and imports from the remaining sources totaled 1.6 percent. Thequantity of certain orange juice imported from Mexico fluctuated from a low of 8.2 million gallons SSEin 2003/04 to a high of 54.8 million gallons SSE in 2004/05. U.S. imports from Costa Rica fluctuatedbetween 24.1 million gallons SSE in 2001/02 and 32.0 million gallons SSE in 2003/04. The quantity ofU.S. imports of certain orange juice from Belize increased steadily from 3.8 million gallons SSE in2001/02 to 30.4 million gallons SSE in 2004/05. Nonsubject shares of U.S. imports of certain
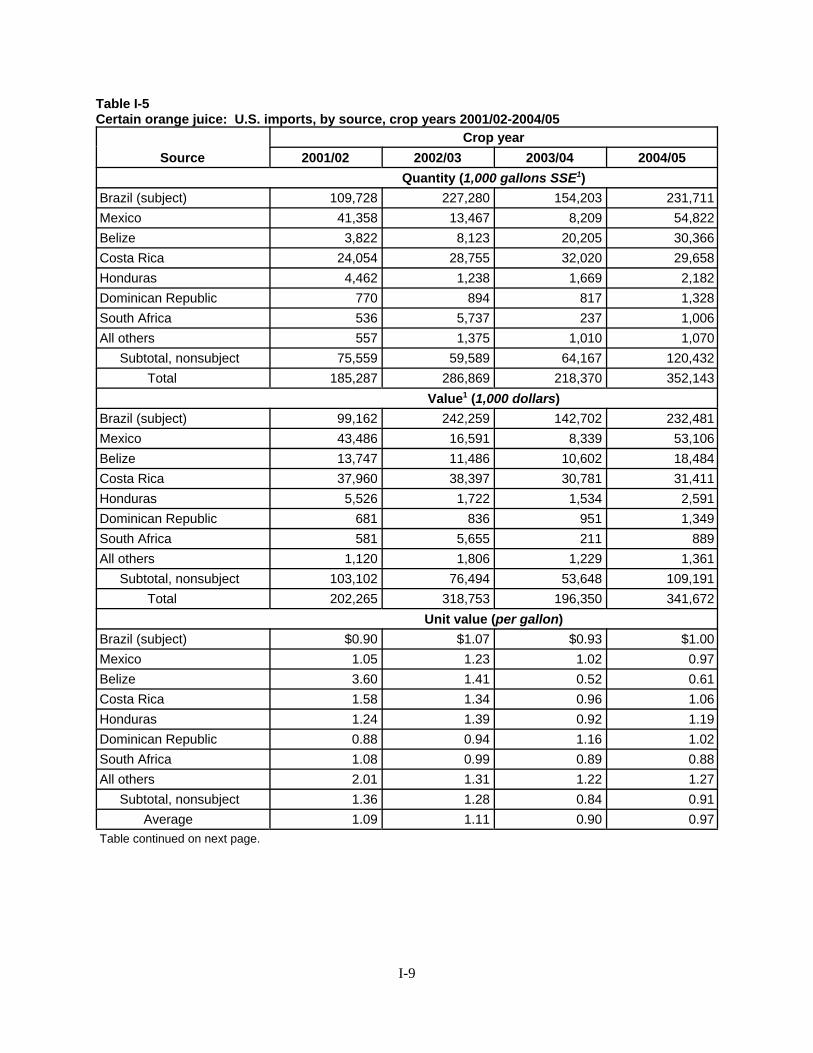
I-9
Table I-5Certain orange juice: U.S. imports, by source, crop years 2001/02-2004/05
SourceCrop year
2001/02 2002/03 2003/04 2004/05Quantity (1,000 gallons SSE1)
Brazil (subject) 109,728 227,280 154,203 231,711Mexico 41,358 13,467 8,209 54,822Belize 3,822 8,123 20,205 30,366Costa Rica 24,054 28,755 32,020 29,658Honduras 4,462 1,238 1,669 2,182Dominican Republic 770 894 817 1,328South Africa 536 5,737 237 1,006All others 557 1,375 1,010 1,070
Subtotal, nonsubject 75,559 59,589 64,167 120,432Total 185,287 286,869 218,370 352,143
Value1 (1,000 dollars)Brazil (subject) 99,162 242,259 142,702 232,481Mexico 43,486 16,591 8,339 53,106Belize 13,747 11,486 10,602 18,484Costa Rica 37,960 38,397 30,781 31,411Honduras 5,526 1,722 1,534 2,591Dominican Republic 681 836 951 1,349South Africa 581 5,655 211 889All others 1,120 1,806 1,229 1,361
Subtotal, nonsubject 103,102 76,494 53,648 109,191Total 202,265 318,753 196,350 341,672
Unit value (per gallon)Brazil (subject) $0.90 $1.07 $0.93 $1.00Mexico 1.05 1.23 1.02 0.97Belize 3.60 1.41 0.52 0.61Costa Rica 1.58 1.34 0.96 1.06Honduras 1.24 1.39 0.92 1.19Dominican Republic 0.88 0.94 1.16 1.02South Africa 1.08 0.99 0.89 0.88All others 2.01 1.31 1.22 1.27
Subtotal, nonsubject 1.36 1.28 0.84 0.91Average 1.09 1.11 0.90 0.97
Table continued on next page.
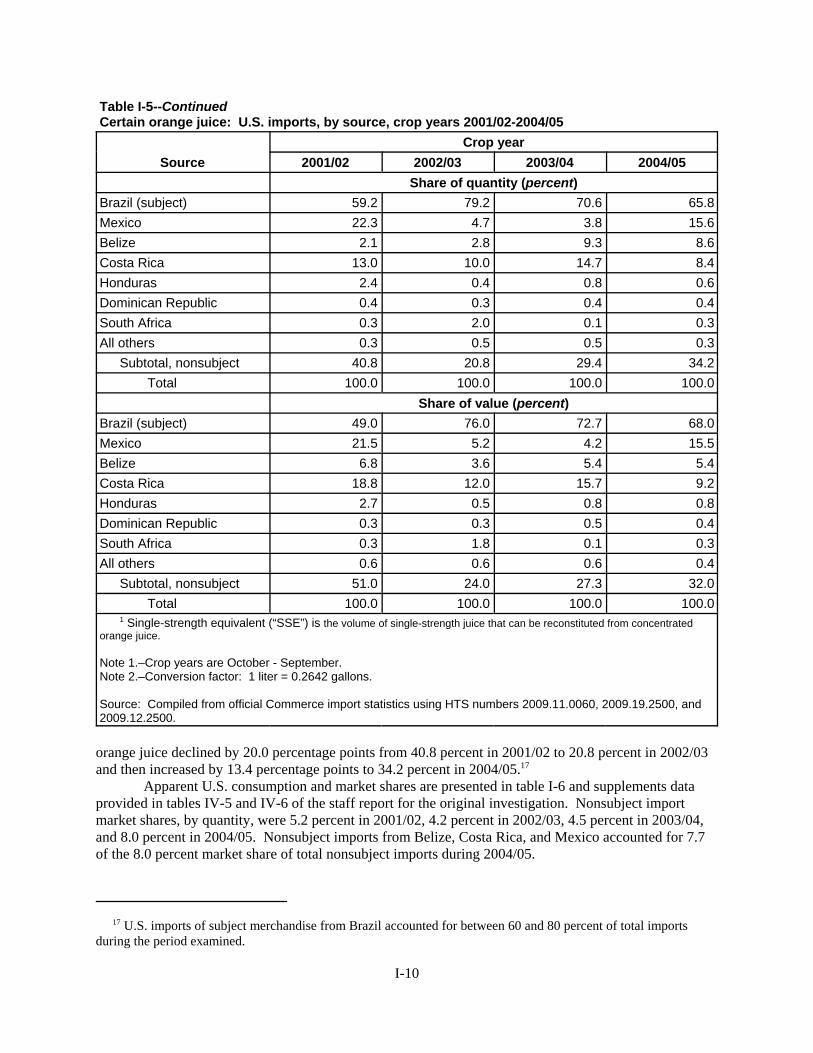
17 U.S. imports of subject merchandise from Brazil accounted for between 60 and 80 percent of total importsduring the period examined.
I-10
Table I-5--ContinuedCertain orange juice: U.S. imports, by source, crop years 2001/02-2004/05
SourceCrop year
2001/02 2002/03 2003/04 2004/05Share of quantity (percent)
Brazil (subject) 59.2 79.2 70.6 65.8Mexico 22.3 4.7 3.8 15.6Belize 2.1 2.8 9.3 8.6Costa Rica 13.0 10.0 14.7 8.4Honduras 2.4 0.4 0.8 0.6Dominican Republic 0.4 0.3 0.4 0.4South Africa 0.3 2.0 0.1 0.3All others 0.3 0.5 0.5 0.3
Subtotal, nonsubject 40.8 20.8 29.4 34.2Total 100.0 100.0 100.0 100.0
Share of value (percent)Brazil (subject) 49.0 76.0 72.7 68.0Mexico 21.5 5.2 4.2 15.5Belize 6.8 3.6 5.4 5.4Costa Rica 18.8 12.0 15.7 9.2Honduras 2.7 0.5 0.8 0.8Dominican Republic 0.3 0.3 0.5 0.4South Africa 0.3 1.8 0.1 0.3All others 0.6 0.6 0.6 0.4
Subtotal, nonsubject 51.0 24.0 27.3 32.0Total 100.0 100.0 100.0 100.0
1 Single-strength equivalent (“SSE”) is the volume of single-strength juice that can be reconstituted from concentratedorange juice.
Note 1.–Crop years are October - September.Note 2.–Conversion factor: 1 liter = 0.2642 gallons.
Source: Compiled from official Commerce import statistics using HTS numbers 2009.11.0060, 2009.19.2500, and2009.12.2500.
orange juice declined by 20.0 percentage points from 40.8 percent in 2001/02 to 20.8 percent in 2002/03and then increased by 13.4 percentage points to 34.2 percent in 2004/05.17
Apparent U.S. consumption and market shares are presented in table I-6 and supplements dataprovided in tables IV-5 and IV-6 of the staff report for the original investigation. Nonsubject importmarket shares, by quantity, were 5.2 percent in 2001/02, 4.2 percent in 2002/03, 4.5 percent in 2003/04,and 8.0 percent in 2004/05. Nonsubject imports from Belize, Costa Rica, and Mexico accounted for 7.7of the 8.0 percent market share of total nonsubject imports during 2004/05.

I-11
Table I-6Certain orange juice: Apparent U.S. consumption and market shares, crop years 2001/02-2004/05
SourceCrop year
2001/02 2002/03 2003/04 2004/05Quantity (1,000 gallons SSE)
Beginning stocks 698,464 692,163 704,509 842,139U.S. production 1,432,162 1,246,761 1,471,334 1,006,642Minus: U.S. exports 173,629 94,730 115,410 110,255
Minus: Ending stocks 692,163 704,509 842,139 590,000Total domestic shipments 1,264,833 1,139,684 1,218,294 1,148,526
Apparent consumption 1,450,121 1,426,553 1,436,664 1,500,670Share of quantity (percent)
U.S. producers’ shipments 87.2 79.9 84.8 76.5U.S. imports from--
Brazil (subject) 7.6 15.9 10.7 15.4Mexico 2.9 0.9 0.6 3.7Belize 0.3 0.6 1.4 2.0Costa Rica 1.7 2.0 2.2 2.0Honduras 0.3 0.1 0.1 0.1Dominican Republic 0.1 0.1 0.1 0.1South Africa 0.0 0.4 0.0 0.1All others 0.0 0.1 0.1 0.1
Subtotal, nonsubject 5.2 4.2 4.5 8.0Total imports 12.8 20.1 15.2 23.5
Source: Compiled from table I-5 of this memorandum and table IV-5 from Certain Orange Juice from Brazil, Inv. No.731-TA-1089 (Final), USITC Publication 3838, March 2006.
Pricing Information
Imports of pricing product 1 (FCOJM, not organic) from the original investigation are found inHTS numbers 2009.11.0020, 2009.11.0040, and 2009.11.0060. Since they are not affected by differencein product mix, comparisons of average unit values of US imports from these three HTS numbers can beused to evaluate the relative prices for FCOJM from different sources
As seen in table I-7 and figures I-1 to I-4, average unit values for U.S. imports of FCOJM fromBelize and Costa Rica fluctuated from fourth quarter 2001 to first quarter 2003. From 2003-05, averageunit values were lowest for U.S. imports from Belize (although they were not consistently in the market)and highest for U.S. imports from Costa Rica. Average unit values for U.S. imports of FCOJM fromBelize were higher than those of U.S. imports of FCOJM from Brazil until 2003, were similar in 2003,and then tended to be lower in 2004 and 2005. Average unit values for U.S. imports of FCOJM fromCosta Rica were higher than those of U.S. imports of FCOJM from Brazil until 2003, when the unitvalues were similar. As seen in table I-7 and figure I-4, average unit values of U.S. imports from Mexicowere higher than those from Brazil from 2001 to 2003; in 2004 and 2005, average unit values weresimilar.

I-12
Table I-7FCOJM: Weighted-average monthly landed duty-paid average unit values and quantities of U.S.imports, by country, October 2001-September 2005
Period
Belize Brazil Costa Rica Mexico
AUV(per PSE)
Quantity(1,000PSEs)
AUV(per PSE)
Quantity(1,000PSEs)
AUV(per PSE)
Quantity(1,000PSEs)
AUV(per PSE)
Quantity(1,000PSEs)
2001: October - 0 $0.86 15,164 $1.13 1,562 $1.03 2,119
November - 0 0.82 13,202 1.78 162 1.02 2,030
December $2.17 922 0.90 6,945 1.53 52 0.98 7,799
2002: January - 0 0.88 3,614 1.10 64 1.04 1,026
February 4.29 569 0.85 7,253 2.49 110 1.06 3,507
March 4.21 621 0.81 9,147 1.71 2,272 1.07 3,582
April - 0 0.89 7,111 1.61 3,401 1.06 4,449
May 4.21 766 0.92 4,384 2.15 3,818 1.10 4,484
June 4.29 570 0.89 6,946 5.69 673 1.12 2,874
July - 0 0.93 6,737 1.44 3,331 1.16 1,594
August 3.83 266 0.87 10,214 1.18 4,699 1.14 2,118
September - 0 1.05 11,184 1.16 3,232 1.12 2,282
October 1.04 101 1.01 15,219 1.29 1,454 1.19 2,536
November 1.04 101 1.00 13,579 7.31 18 1.19 2,136
December 0.99 101 1.01 10,940 4.98 172 1.22 3,270
2003: January 1.04 101 1.04 31,690 6.66 60 1.23 542
February 3.93 1,294 1.01 20,803 2.40 1,781 1.27 865
March 0.93 3,315 1.03 15,684 1.60 3,435 1.16 1,118
April 1.46 504 1.04 16,083 1.35 7,275 1.20 652
May 0.98 602 1.05 21,712 1.14 3,408 1.55 468
June 1.01 217 1.03 14,150 1.16 2,028 1.42 311
July 1.03 67 1.05 12,956 1.09 1,519 1.30 60
August 1.02 67 1.05 10,879 1.08 2,136 1.31 264
September 0.86 1,423 1.00 17,215 1.14 4,658 1.31 89
October 1.02 134 1.00 20,812 1.04 1,735 - 0
November 1.05 134 0.97 9,240 1.36 141 1.23 25
December - 0 0.95 14,294 - 0 1.30 586
Table continued on next page.

I-13
Table I-7–ContinuedFCOJM: Weighted-average monthly landed duty-paid average unit values and quantities of U.S.imports, by country, October 2001-September 2005
Period
Belize Brazil Costa Rica Mexico
AUV(per PSE)
Quantity(1,000PSEs)
AUV(per PSE)
Quantity(1,000PSEs)
AUV(per PSE)
Quantity(1,000PSEs)
AUV(per PSE)
Quantity(1,000PSEs)
2004: January $0.87 232 $0.93 11,893 $0.97 27 $0.77 107
February 0.52 4,887 0.91 10,527 0.93 1,225 0.81 50
March 0.65 850 0.93 14,488 0.98 4,207 0.97 557
April 0.53 5,161 0.83 10,227 0.90 5,839 0.91 705
May 0.54 4,469 0.88 8,379 0.94 5,100 0.78 644
June 0.58 604 0.87 11,611 0.94 2,991 0.68 675
July - 0 0.88 10,335 1.07 3,623 0.85 950
August 0.49 3,165 0.85 6,391 1.09 3,030 0.99 1,378
September - 0 0.93 10,592 1.09 3,200 1.04 1,216
October - 0 0.98 11,459 1.07 3,171 1.03 1,971
November - 0 1.01 22,843 1.18 1,536 1.03 1,100
December 0.59 2,868 0.88 8,335 1.04 72 1.03 1,631
2005: January 0.75 382 0.84 9,087 1.42 255 0.95 2,335
February 0.62 5,295 0.94 12,194 1.04 1,850 0.99 3,710
March 0.62 9,356 0.96 19,328 1.07 4,235 0.95 10,883
April 0.61 9,723 0.91 28,985 1.03 4,186 0.89 9,101
May 0.79 1,151 0.94 13,697 1.04 5,093 0.82 5,898
June 0.78 734 1.05 18,796 1.12 4,741 0.99 3,479
July - 0 1.02 26,327 1.16 1,482 0.97 3,481
August - 0 1.04 20,764 1.20 2,117 1.10 3,045
September - 0 1.12 12,126 1.64 86 1.12 3,871
October - 0 1.05 11,192 1.25 91 1.05 4,367
Note.–Data converted from liters to pounds solid equivalent (PSE) by a factor of .2642/1.029.
Source: Compiled from official Commerce statistics.

I-14
Figure I-1FCOJM: Weighted-average monthly landed duty-paid average unit values of U.S. imports fromBelize, Brazil, Costa Rica, and Mexico, by country, October 2001-September 2005
Source: Table I-7.
Figure I-2FCOJM: Weighted-average monthly landed duty-paid average unit values of U.S. imports fromBelize and Brazil, by country, October 2001-September 2005
Source: Table I-7.

I-15
Figure I-3FCOJM: Weighted-average monthly landed duty-paid average unit values of U.S. imports fromBrazil and Costa Rica, by country, October 2001-September 2005
Source: Table I-7.
Figure I-4FCOJM: Weighted-average monthly landed duty-paid average unit values of U.S. imports fromBrazil and Mexico, by country, October 2001-September 2005
Source: Table I-7.

18 Certain Orange Juice from Brazil, Inv. No. 731-TA-1089 (Final), USITC Publication 3838, March 2006, p. 14.
I-16
The Global Industry and Market
Information presented in this section of the report relates to production, inventories, exports, andimports of certain orange juice for nonsubject production in Brazil and for countries other than Brazilduring the original period of investigation: crop years 2001/02 to 2004/05. Where available, growers’data for oranges are also presented. Round oranges are the primary input to the subject merchandise, withorange juice processors experiencing significant year-to-year fluctuations in the supply of roundoranges.18
As indicated in tables I-8 and I-9, global trade in orange juice is influenced principally by the activities of growers and processors in Brazil and the United States. Approximately half of world orangeproduction is distributed as processed oranges, with processed oranges accounting for 68 to 83 percent oftotal orange production in Brazil and the United States during the period of investigation.
Table I-8Oranges: World supply and distribution, crop years 2001/02-2004/05
ItemCrop year
2001/02 2002/03 2003/04 2004/05Quantity (1,000 90-pound boxes)
Production 1,221,275 1,123,260 1,245,221 1,115,025Imports 13,946 18,456 18,480 18,824
Total supply 1,235,221 1,141,716 1,263,701 1,133,848Fresh, domestic consumption 496,250 494,706 492,672 494,118Oranges for processing 635,098 536,789 660,833 535,074Exports 103,873 110,221 110,196 104,657
Total distribution 1,235,221 1,141,716 1,263,701 1,133,848Shares (percent)
Shares of total distribution:Fresh, domestic consumption 40.2 43.3 39.0 43.6Oranges for processing 51.4 47.0 52.3 47.2Exports 8.4 9.7 8.7 9.2
Total 100.0 100.0 100.0 100.0Shares of imports to total supply 1.1 1.6 1.5 1.7Note.–One box = 40.824 kilograms.
Source: PSD online.

I-17
Table I-9Oranges: Global production and share of production, by countries, crop years 2001/02-2004/05
CountryCrop year
2001/02 2002/03 2003/04 2004/05Total orange production (1,000 90-pound boxes)
Brazil 450,000 377,010 467,010 406,005United States 276,716 258,015 287,598 206,348Italy 88,186 88,235 98,922 104,167Mexico 98,529 91,520 95,613 98,039Spain 69,167 72,304 74,804 65,956Greece 42,255 42,230 44,975 51,593South Africa 41,569 42,500 42,647 43,505Australia 30,637 30,637 30,637 31,863Cuba 30,956 28,137 27,279 25,441Argentina 26,373 28,064 13,480 18,725Turkey 17,647 19,608 17,279 19,926Israel 19,118 17,157 18,382 18,873China 15,515 9,975 11,103 13,407Egypt 7,966 11,765 9,755 4,902Cyprus 3,922 3,505 3,260 4,216Morocco 2,279 2,181 2,083 1,716Japan 441 417 392 343
Total 1,221,275 1,123,260 1,245,221 1,115,025Processed oranges (1,000 90-pound boxes)
Brazil 328,995 257,010 350,000 295,490United States 228,333 205,049 238,873 156,324Italy 16,740 20,343 22,475 23,284Mexico 8,333 1,961 4,902 18,137Spain 11,569 13,995 12,034 13,284Greece 7,819 8,113 5,515 6,471South Africa 7,672 5,956 5,564 3,113Australia 8,309 4,167 4,657 5,392Cuba 6,373 9,118 6,985 2,623Argentina 3,922 3,676 3,922 4,167Turkey 3,064 3,064 3,064 2,451Israel 1,569 1,324 686 1,863China 564 515 613 686Egypt 858 907 907 980Cyprus 490 466 515 662Morocco 441 1,078 123 147Japan 49 49 0 0
Total 635,098 536,789 660,833 535,074Table continued on next page.

I-18
Table I-9–ContinuedOranges: Global production and share of production, crop years 2001/02-2004/05
CountryCrop year
2001/02 2002/03 2003/04 2004/05Shares of total processed oranges (percent)
Brazil 51.8 47.9 53.0 55.2United States 36.0 38.2 36.1 29.2Italy 2.6 3.8 3.4 4.4Mexico 1.3 0.4 0.7 3.4Spain 1.8 2.6 1.8 2.5Greece 1.2 1.5 0.8 1.2South Africa 1.2 1.1 0.8 0.6Australia 1.3 0.8 0.7 1.0Cuba 1.0 1.7 1.1 0.5Argentina 0.6 0.7 0.6 0.8Turkey 0.5 0.6 0.5 0.5Israel 0.2 0.2 0.1 0.3China 0.1 0.1 0.1 0.1Egypt 0.1 0.2 0.1 0.2Cyprus 0.1 0.1 0.1 0.1Morocco 0.1 0.2 0.0 0.0Japan 0.0 0.0 0.0 0.0
Total 100.0 100.0 100.0 100.0Processed oranges as a share of
country’s distribution of oranges (percent)Brazil 73.1 68.2 74.9 72.8United States 82.5 79.5 83.1 75.8Italy 19.0 23.1 22.7 22.4Mexico 8.5 2.1 5.1 18.5Spain 16.7 19.4 16.1 20.1Greece 18.5 19.2 12.3 12.5South Africa 18.5 14.0 13.0 7.2Australia 27.1 13.6 15.2 16.9Cuba 20.6 32.4 25.6 10.3Argentina 14.9 13.1 29.1 22.3Turkey 17.4 15.6 17.7 12.3Israel 8.2 7.7 3.7 9.9China 3.6 5.2 5.5 5.1Egypt 10.8 7.7 9.3 20.0Cyprus 12.5 13.3 15.8 15.7Morocco 19.4 49.4 5.9 8.6Japan 11.1 11.8 0.0 0.0
World 51.4 47.0 52.3 47.2Note.--FCOJ and NFC metric tons were converted to SSE gallons by a conversion factor of 1,405.88.
Source: PSD online.

I-19
Data on orange juice production measured in 1,000 gallons SSE is presented in table I-10. Braziland the United States combined accounted for approximately 90 percent of world production.
Table I-10Orange juice: Global production and share of production, crop years 2001/02-2004/05
CountryCrop year
2001/02 2002/03 2003/04 2004/05Production (1,000 gallons SSE)
Brazil 1,903,562 1,618,168 2,083,514 1,806,556United States 1,434,502 1,251,296 1,466,987 975,648Spain 57,876 78,729 70,294 78,729Italy 44,315 52,018 56,938 59,047South Africa 32,377 34,542 32,237 19,997Mexico 47,800 11,247 28,258 104,176Australia 36,661 18,385 20,547 23,792Turkey 17,574 17,574 17,574 14,059Greece 22,494 27,133 16,871 19,682Korea 4,559 11,026 13,496 11,305Israel 26,712 26,712 12,653 21,088China 2,109 2,109 2,531 2,812Morocco 2,249 6,186 703 844Japan 281 281 0 0 Total 3,633,071 3,155,406 3,822,602 3,137,734
Share of production (percent)Brazil 52.4 51.3 54.5 57.6United States 39.5 39.7 38.4 31.1Spain 1.6 2.5 1.8 2.5Italy 1.2 1.6 1.5 1.9South Africa 0.9 1.1 0.8 0.6Mexico 1.3 0.4 0.7 3.3Australia 1.0 0.6 0.5 0.8Turkey 0.5 0.6 0.5 0.4Greece 0.6 0.9 0.4 0.6Korea 0.1 0.3 0.4 0.4Israel 0.7 0.8 0.3 0.7China 0.1 0.1 0.1 0.1Morocco 0.1 0.2 0.0 0.0Japan 0.0 0.0 0.0 0.0 Total 100.0 100.0 100.0 100.0Note.–FCOJ and NFC metric tons were converted to SSE gallons by a conversion factor of 1,405.88.
Source: PSD online.

I-20
Apparent Consumption in Selected Countries
Table I-11 presents available data on the apparent consumption of orange juice on a countrybasis, for countries other than Brazil and the United States.
Table I-11Orange juice: Estimated apparent consumption, import penetration, and ratio of exports toconsumption, crop years 2001/02-2004/05
ItemCrop year
2001/02 2002/03 2003/04 2004/05Australia--
Production (1,000 gallons SSE) 36,661 18,385 20,547 23,792Imports (1,000 gallons SSE) 41,653 35,362 59,796 41,473Exports (1,000 gallons SSE) 3,502 2,678 3,165 3,045Net exports (1,000 gallons SSE) (38,151) (32,684) (56,632) (38,428)Apparent consumption (1,000 gallons SSE) 68,888 64,670 68,888 68,888Import penetration (percent)1 60.5 54.7 86.8 60.2Exports to consumption (ratio)2 5.1 4.1 4.6 4.4
China--Production (1,000 gallons SSE) 2,109 2,109 2,531 2,812Imports (1,000 gallons SSE) 50,381 59,785 68,315 64,506Exports (1,000 gallons SSE) 4,004 4,294 3,706 3,927Net exports (1,000 gallons SSE) (46,377) (55,491) (64,609) (60,579)Apparent consumption (1,000 gallons SSE) 48,486 57,600 67,139 63,391Import penetration (percent)1 103.9 103.8 101.8 101.8Exports to consumption (ratio)2 8.3 7.5 5.5 6.2
Greece--Production (1,000 gallons SSE) 22,494 27,133 16,871 19,682Imports (1,000 gallons SSE) 21,088 14,059 18,276 53,632Exports (1,000 gallons SSE) 14,762 14,762 11,247 15,848Net exports (1,000 gallons SSE) (6,326) 703 (7,029) (37,783)Apparent consumption (1,000 gallons SSE) 25,789 26,571 24,743 55,357Import penetration (percent)1 81.8 52.9 73.9 96.9Exports to consumption (ratio)2 57.2 55.6 45.5 28.6
Table continued on next page.

I-21
Table I-11–ContinuedOrange juice: Estimated apparent consumption, import penetration, and ratio of exports toconsumption, crop years 2001/02-2004/05
ItemCrop year
2001/02 2002/03 2003/04 2004/05Israel
Production (1,000 gallons SSE) 26,712 26,712 12,653 21,088Imports (1,000 gallons SSE) 63,265 63,265 63,265 56,938Exports (1,000 gallons SSE) 52,018 52,018 35,850 26,712Net exports (1,000 gallons SSE) (11,247) (11,247) (27,415) (30,226)Apparent consumption (1,000 gallons SSE) 37,959 44,988 52,721 52,018Import penetration (percent)1 166.7 140.6 120.0 109.5Exports to consumption (ratio)2 137.0 115.6 68.0 51.4
Italy--Production (1,000 gallons SSE) 44,315 52,018 56,938 59,047Imports (1,000 gallons SSE) 23,048 28,057 35,147 30,929Exports (1,000 gallons SSE) 18,804 18,747 21,088 23,900Net exports (1,000 gallons SSE) (4,244) (9,310) (14,059) (7,029)Apparent consumption (1,000 gallons SSE) 55,603 60,758 62,562 64,670Import penetration (percent)1 41.5 46.2 56.2 47.8Exports to consumption (ratio)2 33.8 30.9 33.7 37.0
Japan--Production (1,000 gallons SSE) 281 281 0 0Imports (1,000 gallons SSE) 135,849 135,773 118,078 142,444Exports (1,000 gallons SSE) 0 0 0 0Net exports (1,000 gallons SSE) (135,849) (135,773) (118,078) (142,444)Apparent consumption (1,000 gallons SSE) 136,130 136,054 127,920 128,385Import penetration (percent)1 99.8 99.8 92.3 111.0Exports to consumption (ratio)2 0.0 0.0 0.0 0.0
Korea--Production (1,000 gallons SSE) 4,559 11,026 13,496 11,305Imports (1,000 gallons SSE) 65,199 68,357 54,154 53,440Exports (1,000 gallons SSE) 24 60 204 647Net exports (1,000 gallons SSE) (65,175) (68,296) (53,951) (52,794)Apparent consumption (1,000 gallons SSE) 69,559 78,777 68,068 64,295Import penetration (percent)1 93.7 86.8 79.6 83.1Exports to consumption (ratio)2 0.0 0.1 0.3 1.0
Table continued on next page.

I-22
Table I-11–ContinuedOrange juice: Estimated apparent consumption, import penetration, and ratio of exports toconsumption, crop years 2001/02-2004/05
ItemCrop year
2001/02 2002/03 2003/04 2004/05Mexico--
Production (1,000 gallons SSE) 47,800 11,247 28,258 104,176Imports (1,000 gallons SSE) 998 281 867 1,265Exports (1,000 gallons SSE) 43,175 5,624 22,543 95,881Net exports (1,000 gallons SSE) 42,176 5,342 21,676 94,616Apparent consumption (1,000 gallons SSE) 8,435 5,905 6,582 8,435Import penetration (percent)1 11.8 4.8 13.2 15.0Exports to consumption (ratio)2 511.8 95.2 342.5 1,136.7
Morocco--Production (1,000 gallons SSE) 2,249 6,186 703 844Imports (1,000 gallons SSE) 703 969 1,173 1,968Exports (1,000 gallons SSE) 3,936 2,924 1,122 7Net exports (1,000 gallons SSE) 3,234 1,956 (51) (1,961)Apparent consumption (1,000 gallons SSE) 2,249 2,390 3,374 3,508Import penetration (percent)1 31.3 40.5 34.8 56.1Exports to consumption (ratio)2 175.0 122.4 33.3 0.2
South Africa--Production (1,000 gallons SSE) 32,377 34,542 32,237 19,997Imports (1,000 gallons SSE) 89 343 384 896Exports (1,000 gallons SSE) 23,775 16,291 10,484 15,158Net exports (1,000 gallons SSE) 23,686 15,948 10,100 14,263Apparent consumption (1,000 gallons SSE) 12,794 16,871 18,276 11,247Import penetration (percent)1 0.7 2.0 2.1 8.0Exports to consumption (ratio)2 185.8 96.6 57.4 134.8
Spain--Production (1,000 gallons SSE) 57,876 78,729 70,294 78,729Imports (1,000 gallons SSE) 37,959 81,119 124,191 113,166Exports (1,000 gallons SSE) 77,323 122,593 153,580 173,650Net exports (1,000 gallons SSE) 39,365 41,473 29,389 60,484Apparent consumption (1,000 gallons SSE) 18,511 37,959 39,365 19,083Import penetration (percent)1 205.1 213.7 315.5 593.0Exports to consumption (ratio)2 417.7 323.0 390.1 910.0
Table continued on next page.

I-23
Table I-11–ContinuedOrange juice: Estimated apparent consumption, import penetration, and ratio of exports toconsumption, crop years 2001/02-2004/05
ItemCrop year
2001/02 2002/03 2003/04 2004/05Turkey--
Production (1,000 gallons SSE) 17,574 17,574 17,574 14,059Imports (1,000 gallons SSE) 3,769 3,882 5,715 7,767Exports (1,000 gallons SSE) 337 917 617 1,265Net exports (1,000 gallons SSE) (3,432) (2,965) (5,098) (6,502)Apparent consumption (1,000 gallons SSE) 20,385 20,526 22,213 22,494Import penetration (percent)1 18.5 18.9 25.7 34.5Exports to consumption (ratio)2 1.7 4.5 2.8 5.6
World Total--Production (1,000 gallons SSE) 3,633,071 3,155,406 3,822,602 3,137,734Imports (1,000 gallons SSE) 632,725 782,310 771,709 926,057Exports (1,000 gallons SSE) 2,180,237 2,195,466 2,378,965 2,370,222Net exports (1,000 gallons SSE) 1,547,513 1,413,155 1,607,257 1,444,165Apparent consumption (1,000 gallons SSE) 4,256,513 3,761,468 4,147,720 3,475,472Import penetration (percent)1 14.9 20.8 18.6 26.6Exports to consumption (ratio)2 51.2 58.4 57.4 68.2
Note.–FCOJ and NFC metric tons were converted to SSE gallons by a conversion factor of 1,405.88.
Source: PSD Online
Global Trade
Data on global imports and exports of orange juice are shown in tables I-12 and I-13. Most of theorange juice traded on the world market is imported by the United States and the European Union (tableI-12). Brazil is, by far, the most substantial orange juice exporter (table I-13).
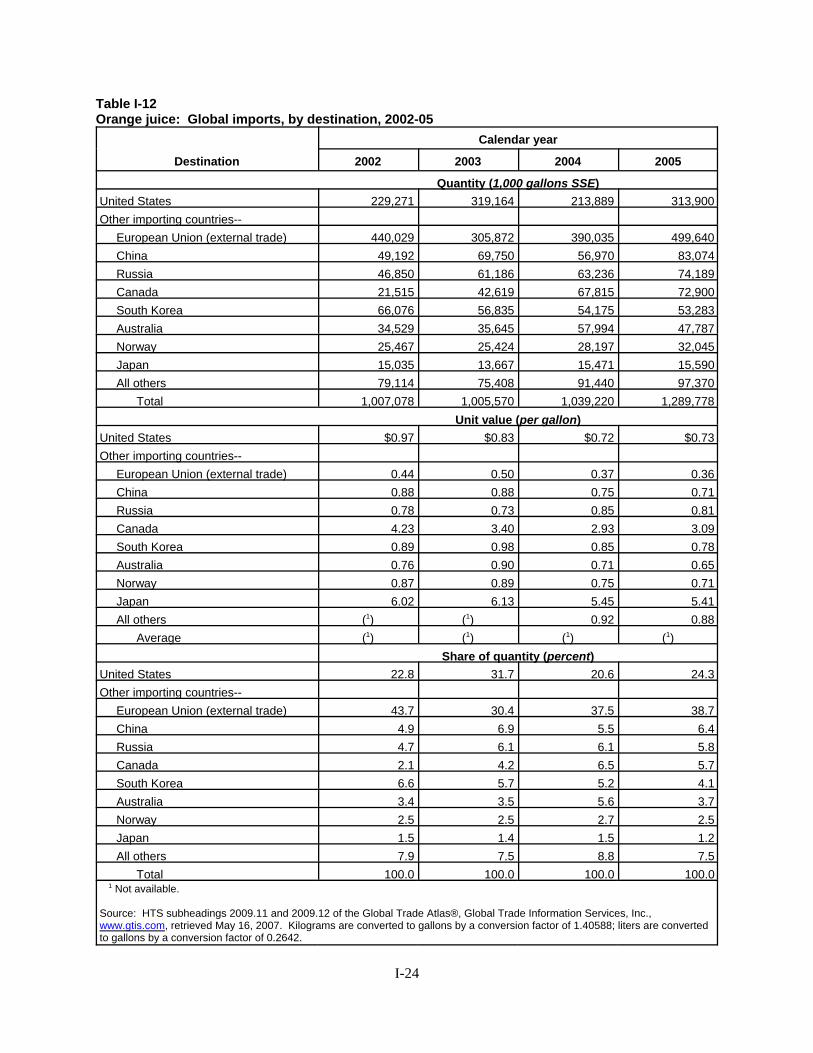
I-24
Table I-12Orange juice: Global imports, by destination, 2002-05
Destination
Calendar year
2002 2003 2004 2005
Quantity (1,000 gallons SSE)United States 229,271 319,164 213,889 313,900Other importing countries-- European Union (external trade) 440,029 305,872 390,035 499,640 China 49,192 69,750 56,970 83,074 Russia 46,850 61,186 63,236 74,189 Canada 21,515 42,619 67,815 72,900 South Korea 66,076 56,835 54,175 53,283 Australia 34,529 35,645 57,994 47,787 Norway 25,467 25,424 28,197 32,045 Japan 15,035 13,667 15,471 15,590 All others 79,114 75,408 91,440 97,370 Total 1,007,078 1,005,570 1,039,220 1,289,778
Unit value (per gallon)United States $0.97 $0.83 $0.72 $0.73Other importing countries-- European Union (external trade) 0.44 0.50 0.37 0.36 China 0.88 0.88 0.75 0.71 Russia 0.78 0.73 0.85 0.81 Canada 4.23 3.40 2.93 3.09 South Korea 0.89 0.98 0.85 0.78 Australia 0.76 0.90 0.71 0.65 Norway 0.87 0.89 0.75 0.71 Japan 6.02 6.13 5.45 5.41 All others (1) (1) 0.92 0.88 Average (1) (1) (1) (1)
Share of quantity (percent)United States 22.8 31.7 20.6 24.3Other importing countries-- European Union (external trade) 43.7 30.4 37.5 38.7 China 4.9 6.9 5.5 6.4 Russia 4.7 6.1 6.1 5.8 Canada 2.1 4.2 6.5 5.7 South Korea 6.6 5.7 5.2 4.1 Australia 3.4 3.5 5.6 3.7 Norway 2.5 2.5 2.7 2.5 Japan 1.5 1.4 1.5 1.2 All others 7.9 7.5 8.8 7.5 Total 100.0 100.0 100.0 100.0 1 Not available.
Source: HTS subheadings 2009.11 and 2009.12 of the Global Trade Atlas®, Global Trade Information Services, Inc.,www.gtis.com, retrieved May 16, 2007. Kilograms are converted to gallons by a conversion factor of 1.40588; liters are convertedto gallons by a conversion factor of 0.2642.
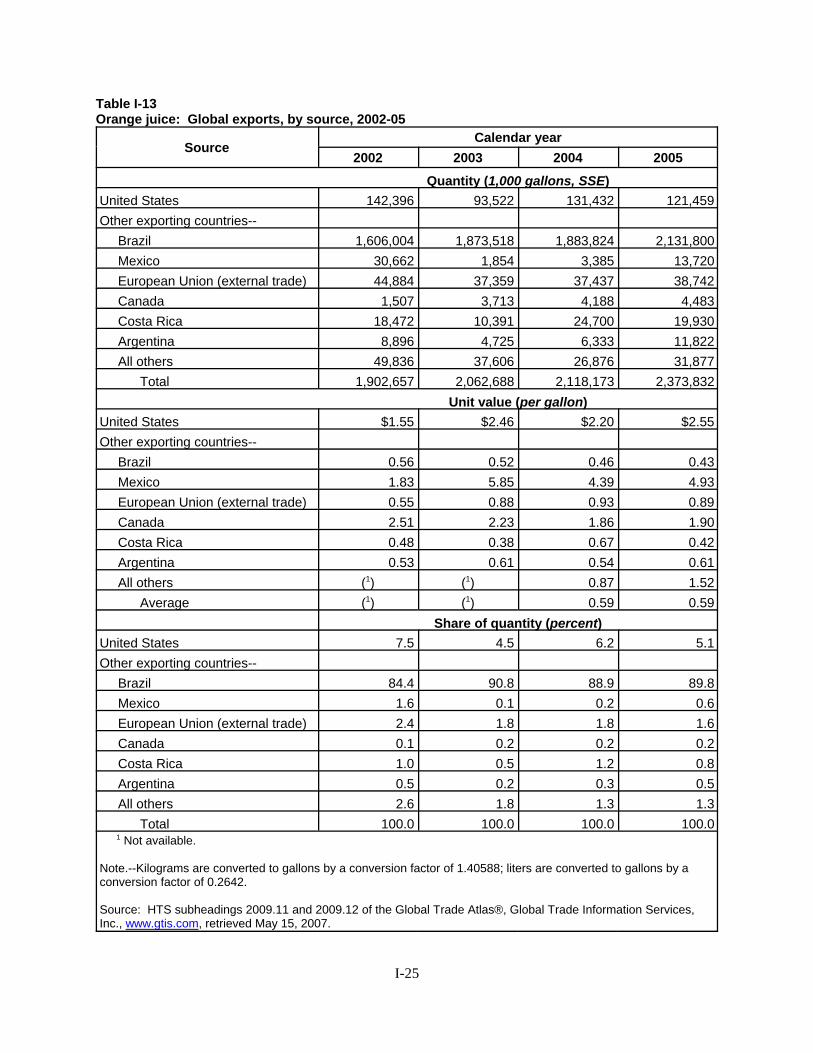
I-25
Table I-13Orange juice: Global exports, by source, 2002-05
SourceCalendar year
2002 2003 2004 2005
Quantity (1,000 gallons, SSE)United States 142,396 93,522 131,432 121,459Other exporting countries-- Brazil 1,606,004 1,873,518 1,883,824 2,131,800 Mexico 30,662 1,854 3,385 13,720 European Union (external trade) 44,884 37,359 37,437 38,742 Canada 1,507 3,713 4,188 4,483 Costa Rica 18,472 10,391 24,700 19,930 Argentina 8,896 4,725 6,333 11,822 All others 49,836 37,606 26,876 31,877 Total 1,902,657 2,062,688 2,118,173 2,373,832
Unit value (per gallon)United States $1.55 $2.46 $2.20 $2.55Other exporting countries-- Brazil 0.56 0.52 0.46 0.43 Mexico 1.83 5.85 4.39 4.93 European Union (external trade) 0.55 0.88 0.93 0.89 Canada 2.51 2.23 1.86 1.90 Costa Rica 0.48 0.38 0.67 0.42 Argentina 0.53 0.61 0.54 0.61 All others (1) (1) 0.87 1.52 Average (1) (1) 0.59 0.59
Share of quantity (percent)United States 7.5 4.5 6.2 5.1Other exporting countries-- Brazil 84.4 90.8 88.9 89.8 Mexico 1.6 0.1 0.2 0.6 European Union (external trade) 2.4 1.8 1.8 1.6 Canada 0.1 0.2 0.2 0.2 Costa Rica 1.0 0.5 1.2 0.8 Argentina 0.5 0.2 0.3 0.5 All others 2.6 1.8 1.3 1.3 Total 100.0 100.0 100.0 100.0 1 Not available.
Note.--Kilograms are converted to gallons by a conversion factor of 1.40588; liters are converted to gallons by aconversion factor of 0.2642.
Source: HTS subheadings 2009.11 and 2009.12 of the Global Trade Atlas®, Global Trade Information Services,Inc., www.gtis.com, retrieved May 15, 2007.

19 71 FR 2183, January 13, 2006. At the time of the filing of the original petition, there was an existingantidumping duty order on FCOJ from Brazil. The scope of the investigation, therefore, covers only FCOJMproduced and/or exported by those companies that were excluded or revoked from the pre-existing antidumpingorder on FCOJ from Brazil as of December 27, 2004. 70 FR 49557, August 24, 2005. This includes all Brazilianproducers/exporters except Citrovita. 20 Four additional (subject) Brazilian orange producers (Coinbra, Cutrale, Fischer/Citrosuco, and MontecitrusGroup) also provided data during the original investigation. These four firms accounted for approximately ***percent of Brazilian production of certain orange juice in 2004/05. (Original staff report, INV-DD-010 (January 27,2006), p. VII-5.) The following tabulation presents data for both the subject and nonsubject producers:
Item
Actual experience Projections Crop year (July-June) July-September
2005/06 2006/072001/02 2002/03 2003/04 2004/05 2004 2005Quantity (1,000 pounds solids)
Subject producers: Capacity *** *** *** *** *** *** *** *** Production *** *** *** *** *** *** *** ***Citrovita (nonsubject): Capacity *** *** *** *** *** *** *** *** Production *** *** *** *** *** *** *** ***Source: Tables I-14 of this memorandum and table VII-4 from the original staff report (INV-DD-010, January 27,2006).
As shown, Citrovita’s operations accounted for *** percent of total production of certain orange juice in Brazilduring crop year 2004/05. 21 Production was also *** than capacity during the interim periods.
I-26
Nonsubject Production in Brazil
Product from Brazilian producer Citrovita Agro Industrial Ltda. (“Citrovita”) constitutesnonsubject merchandise since the firm is not covered by the scope of the investigation as defined byCommerce.19 Table I-14 presents data submitted by Citrovita during the Commission’s originalinvestigation.20 Reported processing capacity *** Citrovita’s production of FCOJM in 2001/02 and2003/04 while FCOJM production was *** than reported processing capacity in 2002/03 and 2004/05.21 The firm anticipated *** excess capacity to produce FCOJM in either 2005/06 or 2006/07. ***.
Table I-14FCOJM (nonsubject Brazil): Citrovita production capacity, production, shipments, and inventories,2001/02-2004/05, July-September 2004, July-September 2005, and projected 2005/06-2006/07
* * * * * * *

22 Citrus Fruit, Fresh and Processed, Annual Statistics 2003, FAO/UN, CCP: CI/ST/2003. Compare also2003/04 data for table I-15 (Belizean orange production for exporting and processing to table I-9 (world orangeproduction)). 23 Figures based on official FAO data. Global Trade Atlas® data on exports from Belize are not available. 24 CPB did not provide a response to the Commission questionnaire sent to it in this remand investigation. 25 According to the “Pounds Solids Authority Annual Report Crop Year 2004/05" CPB processed 43 percent ofthe total orange crop in 2004/05. A total of 564 growers delivered oranges to the CPB processing plants. Ibid. There are believed to be about 1,000 orange growers in Belize. Official statistics of the Belize Citrus GrowersAssociation, www.belizecitrus.org, and the Belize Agricultural Health Authority. 26 www.citrusproductsbelize.com, retrieved May 21, 2007. 27 Figures calculated from data for 2003/04 in table I-15.
I-27
The Industries in Nonsubject Countries
Belize
Belize produced about 213,400 metric tons of oranges in the 2004/05 season, or less than 1percent of world production.22 According to the Food and Agriculture Organization of the United Nations(“FAO”) data, Belize exported 25,900 metric tons of frozen concentrated orange juice in 2004. Thisamount accounted for about 1.1 percent of world exports of concentrated orange juice in 2004.23
Citrus Products of Belize, Ltd. (“CPB”) reportedly is the primary processor of concentrated juicesand not-from-concentrate juices.24 Groves planted by CPB account for about 20 percent of the Belizeancitrus industry.25 The CPB groves in the Stann Creek Valley and Cayo District are located within 100miles of its processing facilities. CPB maintains two processing plants - one in the Alta Vista Valley(Belize Food Products Ltd. & Top Juice Ltd.) and one in the Poona Valley (Citrus Company of BelizeLtd.).26
Data on the fresh orange and orange processing industry in Belize are presented in table I-15. Asshown, the numbers of oranges processed and factory recovery of solids from oranges have risen sharplyfrom 2002/03 to 2004/05. About 95 percent of the orange production in Belize is processed into juice, 2percent is rejected at the factory, and 3 percent is exported as fresh fruit exports.27

I-28
Table I-15Fresh oranges and processed orange solids: Production in Belize, crop years 2001/02-2004/05
ItemCrop year
2001/02 2002/03 2003/04 2004/05
Fresh oranges exported (90-poundboxes) (1) (1) 169,886 (1)
Oranges rejected at factories (90-pound boxes) (1) (1) 109,987 (1)
Oranges processed at factories (90-pound boxes) 4,122,594 4,046,295 4,946,717 6,264,847
Total (90-pound boxes) (1) (1) 5,226,590 (1)
Processed orange solids (factory): CCB2 (pounds solid equivalent) (1) (1) (1) 15,751,456
BFP3 (pounds solid equivalent) (1) (1) (1) 22,797,948
Total (1) 23,374,326 28,322,764 38,549,404
1 Not available. 2 Citrus Company of Belize Ltd. 3 Belize Food Products Ltd.
Source: Pounds Solid Authority Annual Report Crop Year 2004/05, Belize Citrus Growers Association, found atwww.belizecitrus.org, retrieved May 18, 2007. According to the report, data for the two plants represent an“industry total” for the most recent crop year.
The following tabulation provides the volume of U.S. imports of certain orange juice from Belize:
ItemCrop year
2001/02 2002/03 2003/04 2004/05
Quantity (1,000 gallons SSE) 3,822 8,123 20,205 30,366
Value (1,000 dollars) 13,747 11,486 10,602 18,484
Unit value (per gallon) $3.60 $1.41 $0.52 $0.61
Source: Table I-5 of this memorandum.
All U.S. imports of orange juice from Belize were FCOJM, for which Belize was the third leadingsupplier to the United States in 2004/05 after Brazil and Mexico (tables I-5, D-1, and D-2). Belizeaccounted for 8.6 percent of the quantity of all U.S. imports of certain orange juice in 2004/05 (table I-5).

28 Compare table I-9 to table I-16. 29 Commission questionnaires in this remand investigation were sent to the following firms in Costa Rica: TicoFrut (San José); Del Oro (La Cruz, Guanacaste); Dos Pinos (San Jose); Fructa C.R., S.A. (San Jose); and SucoCitro, S.A., an affiliate of Fructa C.R. (San Jose). Only Del Oro provided a response; information provided by thefirm is shown in app. E. 30 See app. E. for data on Del Oro’s processing capacity; the firm made a ***. 31 “Costa Rica Citrus Annual 2005,” USDA Foreign Agricultural Service GAIN Report, November 15, 2005. 32 Telegram O 171611Z, May 7, 2007 from the U.S. Embassy (San Jose, Costa Rica) and letter from ***, May23, 2007.
I-29
Costa Rica
Costa Rica accounts for only a small share of the world’s orange production.28 The majority of itsorange production is exported as frozen concentrate. In 2005, Costa Rica accounted for 0.8 percent ofglobal exports of orange juice (table I-13) although it regularly supplies orange juice to the United States(table I-5).
Costa Rican orange production is concentrated in the northwest part of the country, along theborder with Nicaragua. Most of the processing is done by two companies, TicoFrut and Del Oro, whichalso process pineapples during the off-season.29 TicoFrut and Del Oro are reported by the USDA to havecontinued “to improve” their plants and processing capacity30 and, with respect to TicoFrut, purchasedadditional orange groves and replanted trees. A significant share of the fresh oranges obtained by theseprocessors are grown across the border in Nicaragua. Recent higher prices for orange juice in theinternational markets have spurred orange production in both Costa Rica and Nicaragua.31
Available data on fresh orange production in Costa Rica are presented in table I-16.
Table I-16Oranges: Acres planted, orange bearing trees, and production in Costa Rica, crop year 2005/06
Item
Crop year 2005/06
Forecast
Area planted (acres) 49,420
Oranges produced (1,000 90-pound boxes)1 8,000
Orange solids produced: Unit (1,000 pounds solid at 66 Brix) 41,600
Unit (1,000 gallons SSE ) 5,487
1 Includes an estimated 1,000 boxes coming from Nicaragua.
Note.–One hectare = 2.471 acres; one box = 40.824 kilograms; one metric ton = 191.91 SSE gallons (66 Brix).
Source: Costa Rica Citrus Annual 2005, USDA Foreign Agricultural Service GAIN Report, November 15, 2005.
There is minimal information available on the frozen concentrated orange juice processingindustry in Costa Rica. Neither the Government of Costa Rica nor any private source maintains industry-wide data although processors apparently report data on their operations to a Costa Rican governmentalauthority.32 As indicated above, the majority of the orange production in Costa Rica is exported as orangejuice. Table I-17 presents export data for Costa Rica by market. In quantity terms, exports of

I-30
Table I-17Orange juice: Export markets for product from Costa Rica, 2002-05
Export marketCalendar year
2002 2003 2004 2005Quantity (1,000 gallons SSE)
FCOJM:1
Netherlands 17,495 427 0 450 United States 883 0 0 134 Panama 95 0 543 535 All others 0 82 54 0 Total 18,472 509 597 1,119NFCOJ:2
Netherlands 0 9,877 11,883 18,810 Bahamas 0 0 10,870 0 United States 0 5 1,350 0 Total 0 9,883 24,103 18,810Total:3
Netherlands 20,619 10,716 13,376 21,866 United States 31,675 31,459 12,928 25,138 Panama 512 119 565 552 Bahamas 0 0 13,279 0 All others 1,977 2,697 3,139 4,001 Total 54,783 44,992 43,286 51,557
Unit value (per gallon)FCOJM:1
Netherlands $0.46 $0.23 (4) $0.32 United States 0.90 (4) (4) 0.76 Panama 0.56 (4) $0.47 0.53 All others (4) 0.40 0.45 (4) Total 0.48 0.25 0.46 0.47NFCOJ:2
Netherlands (4) 0.38 0.34 0.42 Bahamas (4) (4) 0.99 (4) United States (4) 0.49 1.02 (4) Total (4) 0.38 0.67 0.42Total:3
Netherlands 0.46 0.39 0.34 0.41 United States 1.00 1.05 0.92 0.94 Panama 0.58 0.58 0.47 0.52 Bahamas (4) (4) 0.98 (4) All others 0.62 0.47 0.42 0.52 Total 0.78 0.86 0.72 0.68Table continued on next page.

I-31
Table I-17–ContinuedOrange juice: Export markets for product from Costa Rica, 2002-05
Export marketCalendar year
2002 2003 2004 2005Share of quantity (percent)
FCOJM:1
Netherlands 94.7 83.8 0.0 40.2 United States 4.8 0.0 0.0 12.0 Panama 0.5 0.0 90.9 47.8 All others 0.0 16.2 9.1 0.0 TOTAL 100.0 100.0 100.0 100.0NFCOJ:2
Netherlands 0.0 99.9 49.3 100.0 Bahamas 0.0 0.0 45.1 0.0 United States 0.0 0.1 5.6 0.0 Total 0.0 100.0 100.0 100.0Total:3
Netherlands 37.6 23.8 30.9 42.4 United States 57.8 69.9 29.9 48.8 Panama 0.9 0.3 1.3 1.1 Bahamas 0.0 0.0 30.7 0.0 All others 3.6 6.0 7.3 7.8 Total 100.0 100.0 100.0 100.0 1 HTS 2009.11.00. 2 HTS 2009.12.00. 3 Exports reported under HTS subheading 2009.19.00 (“other” orange juice) were included in the total in an effortto capture all exports of certain orange juice. 4 Not applicable.
Note.–Kilograms are converted to gallons by a conversion factor of 1.40588; liters are converted to gallons by aconversion factor of 0.2642. Source: Global Trade Atlas.
orange juice from Costa Rica have ranged between a low of 43.2 million gallons SSE in 2004 and a highof 54.8 million gallons SSE in 2002. The United States is the destination for the largest amount ofexports of orange juice from Costa Rica, followed by the Netherlands.
The following tabulation provides the volume of U.S. imports of certain orange juice from CostaRica:

33 Commission questionnaires in this remand investigation were sent to the following firms: CitroFrut S.A. deC.V. (“CitroFrut”) (Monterrey, N.L.); Procimart (Tamaulipas); Citrotam International, S.P.R. de R.I. (Guemez); andFruitec (Col. America Guadalupe, N.L.). CitroFrut and Procimart provided responses to the questionnaire; dataprovided by the firms are presented in appendix E. 34 “Mexico Citrus Annual 2005,” USDA Foreign Agricultural Service GAIN Report, November 14, 2005. 35 “Mexico Citrus Semi-Annual Report 2005,” USDA Foreign Agricultural Service GAIN Report, May 11, 2005. 36 “Mexico Citrus Annual 2005,” USDA Foreign Agricultural Service GAIN Report, November 14, 2005.Production costs also vary between regions and producers. Differing cost structures are due primarily to variationsin irrigation costs but can also be attributed to fertilization and pest control costs. Ibid. 37 Calculated from figures in table I-18.
I-32
ItemCrop year
2001/02 2002/03 2003/04 2004/05
Quantity (1,000 gallons SSE) 24,054 28,755 32,020 29,658Value (1,000 dollars) 37,960 38,397 30,781 31,411Unit value (per gallon) $1.58 $1.34 $0.96 $1.06Source: Table I-5.
U.S. imports of Costa Rican orange juice have fluctuated between 24 and 32 million gallons during thelast four crop years. Costa Rica exported only FCOJM to the United States during the original period ofinvestigation (tables I-5, D-1, and D-2). Costa Rica was the fourth leading supplier of the product to theUnited States in 2004/05 after Brazil, Mexico, and Belize. Costa Rica accounted for 8.4 percent of thequantity of total U.S. imports of certain orange juice in 2004/05 (table I-5).
Mexico
Less than 9 percent of world production of oranges is in Mexico (table I-9, calculated for2004/05). Mexico’s share of total processed oranges is less than 4 percent (table I-9) while its share ofglobal exports of orange juice is less than 2 percent (table I-13).
Several firms currently process orange juice in Mexico.33 Reportedly owing to financial problemswithin the Mexican processing industry and droughts, the Mexican industry has become moreconcentrated with the number of processors declining from a previous estimate of 22 firms to only 7 in2005.34 There were an estimated 67,000 citrus growers located throughout Mexico, most of which werebelieved to be growing oranges.35 Data on orange production in Mexico are presented in table I-18 withproduction by type of orange shown in table I-19. According to the USDA, fresh orange production inthe most recent crop year fell to 3.9 million tons from 4.3 million tons in 2004/05 due to lack of rain inthe northern states during the first quarter of 2005. The heavy rainfalls caused by hurricanes duringSeptember and October 2005 were also a factor leading to reduced production. According to the 2005GAIN report “{p}roducers do not expect an increase in the number of {fresh orange} groves. In general,growers have been abandoning groves, or switching to other crops, due to the high production costs, wideswings in fresh orange prices, and marketing problems. Increases in orange production are more a resultof increased tree density than of expansion in area planted.”36 As shown in table I-18, most of the orangesgrown in Mexico are consumed domestically as fresh squeezed juice. In 2005/06 it is forecast that 11percent will be processed and less than 1 percent will be exported.37

I-33
Table I-18Oranges: Acres planted and harvested, orange bearing trees, production and utilization oforanges in Mexico, crop years 2002/03, 2003/04, 2004/05, and 2005/06
Item
Crop year
2002/03 2003/04 2004/05 2005/06
Revised Revised Estimate Forecast
Area planted (1,000 acres) 878,161 864,121 825,314 825,314
Area harvested (1,000 acres) 815,287 825,991 815,430 810,488
Bearing trees (1,000 trees) 66,648 67,523 66,660 66,256
Non-bearing trees (1,000 trees) 5,089 3,117 810 1,212
Total trees (1,000 trees) 71,737 70,640 67,470 67,468
Oranges produced (1,000 90-pound boxes) 91,520 95,613 105,392 95,588
Oranges imported (1,000 90-pound boxes) 956 441 490 441
Total supply (1,000 90-pound boxes) 92,475 96,054 105,882 96,029
Exports (1,000 90-pound boxes) 172 319 490 490
Fresh domestic consumption (1,000 90-poundboxes) 90,343 90,833 89,461 85,245
Processed (1,000 90-pound boxes) 1,961 4,902 15,931 10,294
Total distribution (1,000 90-pound boxes) 92,475 96,054 105,882 96,029
Note.–One hectare = 2.471 acres; 40.8 kg. = 90-pound box.
Source: “Mexico Citrus Annual 2004", USDA Foreign Agricultural Service GAIN Report, December 13, 2004 and "MexicoCitrus Annual 2004", USDA Foreign Agricultural Service GAIN Report, November 14, 2005.
Table I-19Oranges: Production in Mexico, by variety, 2002-04
Variety 2002 2003 2004
(1,000 90-pound boxes)
Early season and other 51,705 49,107 12,912
Valencia 46,338 44,749 84,255
Navel 495 405 313
Total 98,539 94,261 97,480
Source: Compiled from SAGARPA, SAICON statistics.
Reportedly, orange production in Mexico was forecast to decrease from 2004/05 to 2005/06 dueto both dry weather conditions and strong rainfalls, with a resulting decrease in the supply of oranges and

38 “Mexico Citrus Annual 2005,” USDA Foreign Agricultural Service GAIN Report, November 14, 2005, p. 3. 39 “Mexico Citrus Annual 2005,” USDA Foreign Agricultural Service GAIN Report, November 14, 2005.Reliable data on the Mexican orange juice production are difficult to obtain because the Government of Mexico doesnot maintain official statistics. According to the USDA FAS, the industry “tends to keep partial information most ofwhich is proprietary.” Ibid. 40 “Mexico Citrus Annual 2005,” USDA Foreign Agricultural Service GAIN Report, November 14, 2005. 41 There was no change reported in the level of inventory stocked. 42 “Mexico Citrus Annual 2005,” USDA Foreign Agricultural Service GAIN Report, November 14, 2005. 43 “Mexico Citrus Annual 2005,” USDA Foreign Agricultural Service GAIN Report, November 14, 2005, p. 11.
I-34
FCOJ production.38 Low international prices for frozen concentrated orange juice are also reported tohave led to a decline in processed orange juice production “in recent years.”39
FCOJ production for 2005 is forecast at about 59 million gallons SSE (table I-20).40 Most of theFCOJ processed in Mexico is exported since domestic consumers prefer to squeeze their own fresh orangejuice. In 2005, 88 percent is forecasted to be exported while the remaining 12 percent should beconsumed domestically.41 However, domestic demand has been slowly increasing, mainly from hotelchains and restaurants as well as increasing demand for beverages and other food products with an orangeflavoring.42
Table I-20FCOJ: Distribution in Mexico, 2002-05
Item
Market year beginning--
01/2002 01/2003 01/2004 01/2005
Quantity (1,000 gallons SSE)
Beginning stocks 1,406 1,406 1,406 4,218
Production 11,247 28,258 91,382 59,047
Imports 281 867 872 872
Total supply 12,934 30,531 93,660 64,136
Exports 5,624 22,543 82,694 52,889
Domestic consumption 5,905 6,582 6,748 7,029
Ending stocks 1,406 1,406 4,218 4,218
Total distribution 12,934 30,531 93,660 64,136
Note.–FCOJ metric tons at 65 Brix were converted to SSE gallons by a conversion factor of 1,405.88.
Source: “Mexico Citrus Annual 2004", USDA Foreign Agricultural Service GAIN Report, December 13, 2004 and"Mexico Citrus Annual 2005", USDA Foreign Agricultural Service GAIN Report, November 14, 2005.
Most Mexican orange juice is exported to the United States, followed by the Netherlands (table I-21). According to the Mexican processing industry, more orange juice is being exported to the EU andJapan following trade agreements that give it lower tariffs in those markets.43

I-35
Table I-21Orange juice: Export markets for product from Mexico, by product, 2002-05
Export marketCalendar year
2002 2003 2004 2005Quantity (thousand gallons SSE)
FCOJM:1
United States 14,241 835 1,589 8,321 Netherlands 6,878 29 186 2,740 Japan 1,436 309 311 485 Venezuela 662 0 112 309 Germany 2,931 25 142 292 United Kingdom 1,049 375 426 228 All others 3,382 175 147 744 Total 30,578 1,747 2,913 13,119NFCOJ:2 United States 36 2 346 455 Aruba 14 27 20 35 All others 34 78 105 111 Total 84 107 472 600Total:3
United States 24,043 2,844 4,226 12,663 Netherlands 6,878 35 187 2,741 Japan 1,440 309 311 485 Venezuela 746 6 119 323 Germany 2,931 25 142 292 United Kingdom 1,049 375 429 231 Aruba 41 27 20 35 All others 3,524 292 297 894 Total 40,652 3,913 5,732 17,663
Unit value (per gallon)FCOJM:1
United States $2.16 $5.81 $4.93 $5.07 Netherlands 1.16 5.67 4.69 4.77 Japan 2.94 6.49 5.69 7.00 Venezuela 3.79 (4) 5.48 5.85 Germany 0.75 3.48 3.77 4.35 United Kingdom 2.33 5.50 4.55 4.47 All others 1.73 7.99 4.61 5.56 Total 1.83 6.05 4.88 5.10NFCOJ:2 United States 0.93 4.61 0.95 0.94 Aruba 2.36 2.34 2.33 2.23 All others 2.70 2.58 2.38 2.75 Total 1.89 2.55 1.33 1.35Total:3
United States 1.49 3.03 2.74 3.80 Netherlands 1.17 5.04 4.70 4.77 Japan 2.94 6.49 5.69 7.00 Venezuela 3.46 2.37 5.28 5.71 Germany 0.75 3.48 3.77 4.35 United Kingdom 2.33 5.50 4.53 4.44 Aruba 1.04 2.34 2.33 2.23 All others 1.71 5.70 3.39 5.05 Total 1.51 3.75 3.21 4.15Table continued on next page.
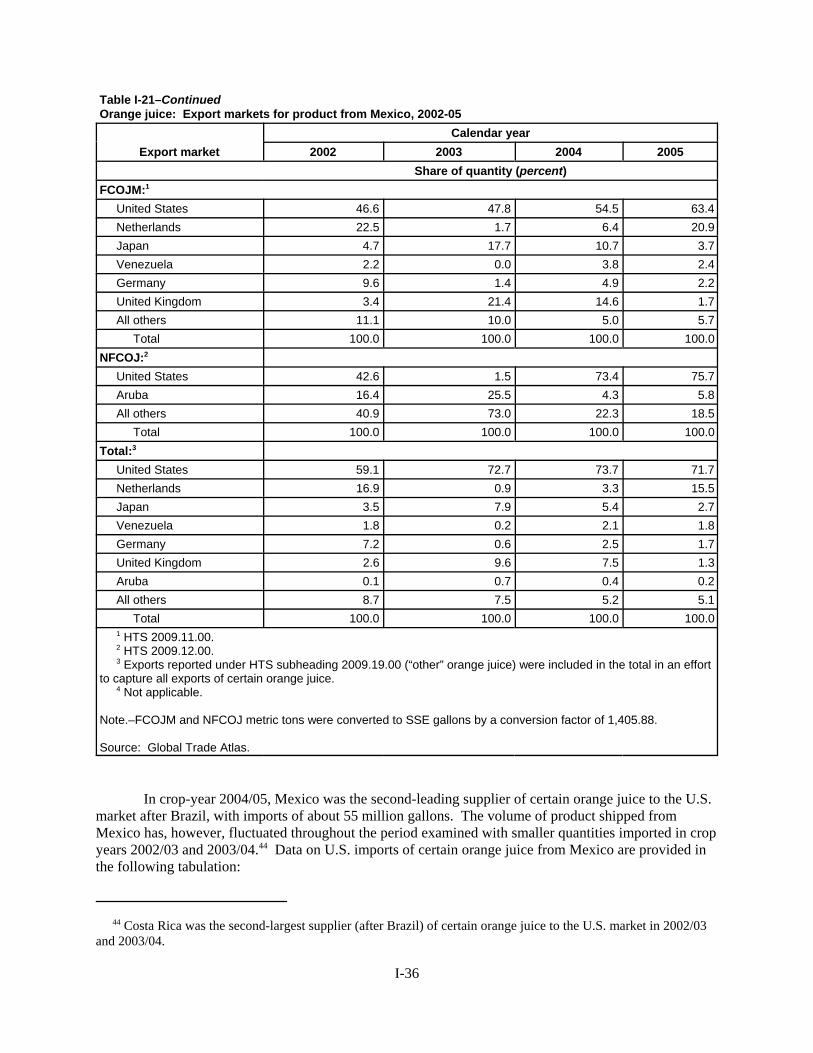
44 Costa Rica was the second-largest supplier (after Brazil) of certain orange juice to the U.S. market in 2002/03and 2003/04.
I-36
Table I-21–ContinuedOrange juice: Export markets for product from Mexico, 2002-05
Export marketCalendar year
2002 2003 2004 2005Share of quantity (percent)
FCOJM:1
United States 46.6 47.8 54.5 63.4 Netherlands 22.5 1.7 6.4 20.9 Japan 4.7 17.7 10.7 3.7 Venezuela 2.2 0.0 3.8 2.4 Germany 9.6 1.4 4.9 2.2 United Kingdom 3.4 21.4 14.6 1.7 All others 11.1 10.0 5.0 5.7 Total 100.0 100.0 100.0 100.0NFCOJ:2 United States 42.6 1.5 73.4 75.7 Aruba 16.4 25.5 4.3 5.8 All others 40.9 73.0 22.3 18.5 Total 100.0 100.0 100.0 100.0Total:3
United States 59.1 72.7 73.7 71.7 Netherlands 16.9 0.9 3.3 15.5 Japan 3.5 7.9 5.4 2.7 Venezuela 1.8 0.2 2.1 1.8 Germany 7.2 0.6 2.5 1.7 United Kingdom 2.6 9.6 7.5 1.3 Aruba 0.1 0.7 0.4 0.2 All others 8.7 7.5 5.2 5.1 Total 100.0 100.0 100.0 100.0 1 HTS 2009.11.00. 2 HTS 2009.12.00. 3 Exports reported under HTS subheading 2009.19.00 (“other” orange juice) were included in the total in an effortto capture all exports of certain orange juice. 4 Not applicable.
Note.–FCOJM and NFCOJ metric tons were converted to SSE gallons by a conversion factor of 1,405.88. Source: Global Trade Atlas.
In crop-year 2004/05, Mexico was the second-leading supplier of certain orange juice to the U.S.market after Brazil, with imports of about 55 million gallons. The volume of product shipped fromMexico has, however, fluctuated throughout the period examined with smaller quantities imported in cropyears 2002/03 and 2003/04.44 Data on U.S. imports of certain orange juice from Mexico are provided inthe following tabulation:

I-37
ItemCrop year
2001/02 2002/03 2003/04 2004/05
Quantity (1,000 gallons SSE) 41,358 13,467 8,209 54,822
Value (1,000 dollars) 43,486 16,591 8,339 53,106
Unit value (per gallon) $1.05 $1.23 $1.02 $0.97
Source: Table I-5.
Both FCOJM and NFCOJ are exported to the United States from Mexico (tables D-1 and D-2). Virtuallyall U.S. imports of NFCOJ were from Mexico and Brazil during the original period of investigation. Orange juice from Mexico is subject to a 40 million-gallon quota under NAFTA, although in 2008 theU.S. quota is scheduled to be completely phased out. In 2007, Mexican orange juice may enter theUnited States free of duty within quota, and is subject to a duty of 1.57 cents per liter over quota.


A-1
APPENDIX A
FEDERAL REGISTER NOTICES


387Federal Register / Vol. 70, No. 2 / Tuesday, January 4, 2005 / Notices
1 The imported product subject to this investigation is certain orange juice for transport and/or manufacturing, produced in two different forms: (1) Frozen orange juice in a highly concentrated form, referred to as frozen concentrated orange juice for further manufacturing (‘‘FCOJM’’); and (2) pasteurized single-strength orange juice which has not been concentrated, referred to as not-from-concentrate orange juice. Excluded from the scope of the investigation are: (1) Imports of reconstituted orange juice and frozen orange juice for retail and (2) imports of FCOJM from Brazilian manufacturers/exporters covered by
the existing antidumping duty order on frozen concentrated orange juice from Brazil.
this notice of investigation shall be served:
(a) The complainants are—3M Company, 3M Corporate Headquarters, 3M Center, St. Paul, Minnesota 55144; 3M Innovative Properties Company, 3M Corporate Headquarters, 3M Center, St. Paul, Minnesota 55144; Mr. Jean Silvestre, Grand Enclos 2, 4180 Hamoir, Belgium;
(b) The respondents are the following companies alleged to be in violation of section 337, and are the parties upon which the complaint is to be served: Boss Auto Import, S.A., Avenida del Valles, 28, 08440 Cardedeu, Barcelona, Spain; Chemicar USA, Inc., 670 New York Street, Memphis, Tennessee 38104; EMM America, Inc., 349 Owl Street, Campton, New Hampshire 03223; E.M.M. International B.V., Marsweg 59, 8013 PE Zwolle, Netherlands; Indasa, S.A., Zona Industrial de Aveiro, Lote 46, P.O. Box 3005, 3801–903, Aveiro, Portugal; Indasa U.S.A., Inc., 9 Falstrom Court, Passaic, New Jersey 07055; Intertape Polymer Corporation, 3647 Cortez Road West, Bradenton, Florida; IPG Administrative Services, Inc., 3647 Cortez Road West, Bradenton, Florida 34210; Intertape Polymer Group, Inc., 110 E. Montee de Liesse, Montreal, Quebec, Canada, H4T 1N4; Saint-Gobain Abrasifs (France), Rue de L’Ambassadeur, BP8, 78702 Conflans-Saint-Honorine, France; Saint-Gobain Abrasives, Inc., 1 New Bond Street, Worcester, Massachusetts 01606; Transtar Autobody Technologies, Inc., 2040 Heiserman Drive, Brighton, Michigan 48114; Vosschemie GmbH, Esinger Steinweg 50, D–25436 Uetersen, Germany.
(c) Steven R. Pedersen, Esq., Office of Unfair Import Investigations, U.S. International Trade Commission, 500 E Street, SW., Suite 401, Washington, DC 20436, who shall be the Commission investigative attorney, party to this investigation; and
(3) For the investigation so instituted, the Honorable Charles E. Bullock is designated as the presiding administrative law judge.
A response to the complaint and the notice of investigation must be submitted by the named respondents in accordance with section 210.13 of the Commission’s Rules of Practice and Procedure, 19 CFR 210.13. Pursuant to 19 CFR 201.16(d) and 210.13(a), such response will be considered by the Commission if received not later than 20 days after the date of service by the Commission of the complaint and the notice of investigation. Extensions of time for submitting the response to the complaint and the notice of
investigation will not be granted unless good cause therefor is shown.
Failure of a respondent to file a timely response to each allegation in the complaint and in this notice may be deemed to constitute a waiver of the right to appear and contest the allegations of the complaint and this notice, and to authorize the administrative law judge and the Commission, without further notice to the respondent, to find the facts to be as alleged in the complaint and this notice and to enter a final determination containing such findings, and may result in the issuance of a limited exclusion order or cease and desist order or both directed against the respondent.
By order of the Commission.Issued: December 28, 2004.
Marilyn R. Abbott, Secretary to the Commission.[FR Doc. 05–36 Filed 1–3–05; 8:45 am] BILLING CODE 7020–02–P
INTERNATIONAL TRADE COMMISSION
[Investigation No. 731–TA–1089 (Preliminary)]
Certain Orange Juice From Brazil
AGENCY: United States International Trade Commission.ACTION: Institution of antidumping investigation and scheduling of a preliminary phase investigation.
SUMMARY: The Commission hereby gives notice of the institution of an investigation and commencement of preliminary phase antidumping investigation No. 731–TA–1089 (Preliminary) under section 733(a) of the Tariff Act of 1930 (19 U.S.C. 1673b(a)) (the Act) to determine whether there is a reasonable indication that an industry in the United States is materially injured or threatened with material injury, or the establishment of an industry in the United States is materially retarded, by reason of imports from Brazil of certain orange juice,1 provided for in subheadings
2009.11.00, 2009.12.25, 2009.12.45, and 2009.19.00 of the Harmonized Tariff Schedule of the United States, that are alleged to be sold in the United States at less than fair value. Unless the Department of Commerce extends the time for initiation pursuant to section 732(c)(1)(B) of the Act (19 U.S.C. 1673a(c)(1)(B)), the Commission must reach a preliminary determination in antidumping investigations in 45 days, or in this case by February 10, 2005. The Commission’s views are due at Commerce within five business days thereafter, or by February 17, 2005.
For further information concerning the conduct of this investigation and rules of general application, consult the Commission’s Rules of Practice and Procedure, part 201, subparts A through E (19 CFR part 201), and part 207, subparts A and B (19 CFR part 207).EFFECTIVE DATE: December 27, 2004.FOR FURTHER INFORMATION CONTACT: Elizabeth Haines (202) 205–3200), Office of Investigations, U.S. International Trade Commission, 500 E Street, SW., Washington, DC 20436. Hearing-impaired persons can obtain information on this matter by contacting the Commission’s TDD terminal on (202) 205–1810. Persons with mobility impairments who will need special assistance in gaining access to the Commission should contact the Office of the Secretary at (202) 205–2000. General information concerning the Commission may also be obtained by accessing its Internet server (http://www.usitc.gov). The public record for this investigation may be viewed on the Commission’s electronic docket (EDIS) at http://edis.usitc.gov.SUPPLEMENTARY INFORMATION:
Background.—This investigation is being instituted in response to a petition filed on December 27, 2004, on behalf of Florida Citrus Mutual, Lakeland, FL; A. Duda & Sons (d/b/a Citrus Belle) Ovieda, FL; Citrus World, Inc., Lake Wales, FL; Peace River Citrus Products, Inc., Arcadia, FL; and Southern Garden Citrus Processing Corp. (d/b/a Southern Gardens), Clewiston, FL.
Participation in the investigation and public service list.—Persons (other than petitioners) wishing to participate in the investigation as parties must file an entry of appearance with the Secretary to the Commission, as provided in sections 201.11 and 207.10 of the Commission’s rules, not later than seven days after publication of this notice in the Federal Register. Industrial users and (if the merchandise under
VerDate jul<14>2003 18:02 Jan 03, 2005 Jkt 205001 PO 00000 Frm 00062 Fmt 4703 Sfmt 4703 E:\FR\FM\04JAN1.SGM 04JAN1

388 Federal Register / Vol. 70, No. 2 / Tuesday, January 4, 2005 / Notices
investigation is sold at the retail level) representative consumer organizations have the right to appear as parties in Commission antidumping investigations. The Secretary will prepare a public service list containing the names and addresses of all persons, or their representatives, who are parties to this investigation upon the expiration of the period for filing entries of appearance.
Limited disclosure of business proprietary information (BPI) under an administrative protective order (APO) and BPI service list.—Pursuant to section 207.7(a) of the Commission’s rules, the Secretary will make BPI gathered in this investigation available to authorized applicants representing interested parties (as defined in 19 U.S.C. 1677(9)) who are parties to the investigation under the APO issued in the investigation, provided that the application is made not later than seven days after the publication of this notice in the Federal Register. A separate service list will be maintained by the Secretary for those parties authorized to receive BPI under the APO.
Conference.—The Commission’s Director of Operations has scheduled a conference in connection with this investigation for 9:30 a.m. on January 19, 2005, at the U.S. International Trade Commission Building, 500 E Street, SW., Washington, DC. Parties wishing to participate in the conference should contact Betsy Haines (202) 205–3200 not later than January 14, 2005, to arrange for their appearance. Parties in support of the imposition of antidumping duties in this investigation and parties in opposition to the imposition of such duties will each be collectively allocated one hour within which to make an oral presentation at the conference. A nonparty who has testimony that may aid the Commission’s deliberations may request permission to present a short statement at the conference.
Written submissions.—As provided in sections 201.8 and 207.15 of the Commission’s rules, any person may submit to the Commission on or before January 24, 2005, a written brief containing information and arguments pertinent to the subject matter of the investigation. Parties may file written testimony in connection with their presentation at the conference no later than three days before the conference. If briefs or written testimony contain BPI, they must conform with the requirements of sections 201.6, 207.3, and 207.7 of the Commission’s rules. The Commission’s rules do not authorize filing of submissions with the Secretary by facsimile or electronic
means, except to the extent permitted by section 201.8 of the Commission’s rules, as amended, 67 FR 68036 (November 8, 2002).
In accordance with sections 201.16(c) and 207.3 of the rules, each document filed by a party to the investigation must be served on all other parties to the investigation (as identified by either the public or BPI service list), and a certificate of service must be timely filed. The Secretary will not accept a document for filing without a certificate of service.
Authority: This investigation is being conducted under authority of title VII of the Tariff Act of 1930; this notice is published pursuant to section 207.12 of the Commission’s rules.
By order of the Commission.Issued: December 18, 2004.
Marilyn R. Abbott, Secretary to the Commission.[FR Doc. 05–37 Filed 1–3–05; 8:45 am] BILLING CODE 7020–02–P
DEPARTMENT OF JUSTICE
Drug Enforcement Administration
Importer of Controlled Substances; Notice of Registration
By Notice dated July 28, 2004 and published in the Federal Register on August 10, 2004, (69 FR 48521), Applied Science Labs, Inc., A Division of Alltech Associates Inc., 2701 Carolean Industrial Drive, State College, Pennsylvania 16801, made application by renewal to the Drug Enforcement Administration (DEA) to be registered as an importer of the following basic classes of controlled substance:
Drug Schedule
Heroin (9200) ................................ I Cocaine (9041) ............................. II Codeine (9050) ............................. II Meperidine (9230) ......................... II Methadone (9250) ........................ II Morphine (9300) ........................... II
The company plans to import the listed controlled substances for the manufacture of reference standards.
No comments or objections have been received. DEA has considered the factors in 21 U.S.C. 823(a) and 952(a) and determined that the registration of Applied Science Labs, Inc. to import the basic classes of controlled substances is consistent with the public interest and with United States obligations under international treaties, conventions, or protocols in effect on May 1, 1971, at this time. DEA has investigated Applied
Science Labs, Inc. to ensure that the company’s registration is consistent with the public interest. The investigation has included inspection and testing of the company’s physical security systems, verification of the company’s compliance with state and local laws, and a review of the company’s background and history. Therefore, pursuant to 21 U.S.C. 952(a) and 958(a), and in accordance with 21 CFR 1301.34, the above named company is granted registration as an importer of the basic class of controlled substance listed.
Dated: December 21, 2004. William J. Walker, Deputy Assistant Administrator, Office of Diversion Control, Drug Enforcement Administration.[FR Doc. 05–58 Filed 1–3–05; 8:45 am] BILLING CODE 4410–09–P
DEPARTMENT OF JUSTICE
Drug Enforcement Administration
Manufacturer of Controlled Substances; Notice of Application
Pursuant to Section 1301.33(a) of Title 21 of the Code of Federal Regulations (CFR), this is notice that on October 28, 2004, Cambrex Charles City, Inc., 1205 11th Street, Charles City, Iowa 50616, made application by renewal and on October 13, 2004 by letter to the Drug Enforcement Administration (DEA) for registration as a bulk manufacturer of the basic classes of controlled substances listed:
Drug Sched-ule
Amphetamine (1100) ...................... II Methylphenidate (1724) ................. II Dextropropoxyphene (9273) .......... II Fentanyl (9801) .............................. II
The company plans to manufacture the listed controlled substances in bulk for distribution to its customers.
Any other such applicant and any person who is presently registered with DEA to manufacture such a substance may file comments or objections to the issuance of the proposed registration pursuant to 21 CFR 1301.33(a).
Any such comments or objections may be addressed, in quintuplicate, to the Deputy Assistant Administrator, Office of Diversion Control, Drug Enforcement Administration, United States Department of Justice, Washington, DC 20537, Attention: Federal Register Representative, Office of Liaison and Policy (ODLR) and must be filed no later than March 7, 2005.
VerDate jul<14>2003 18:02 Jan 03, 2005 Jkt 205001 PO 00000 Frm 00063 Fmt 4703 Sfmt 4703 E:\FR\FM\04JAN1.SGM 04JAN1

10993 Federal Register / Vol. 71, No. 42 / Friday, March 3, 2006 / Notices
1 The record is defined in sec. 207.2(f) of the Commission’s Rules of Practice and Procedure (19 CFR 207.2(f)).
2 Vice Chairman Deanna Tanner Okun, Commissioner Jennifer A. Hillman, and Commissioner Daniel R. Pearson dissenting.
FOR FURTHER INFORMATION CONTACT: Project Leader: Jackie W. Jones (202– 205–3466, [email protected]). Deputy Project Leader: Heidi Colby- Oizumi (202–205–3391, [email protected]).
Industry-specific information may be obtained from the above persons. For more information on legal aspects of the investigation, contact William Gearhart of the Commission’s Office of the General Counsel at 202–205–3091 or [email protected]. The media should contact Margaret O’Laughlin, Office of External Relations at 202–205– 1819 or [email protected]. Hearing impaired individuals are advised that information on this matter can be obtained by contacting the TDD terminal on 202–205–1810. General information concerning the Commission may also be obtained by accessing its internet server (http://www.usitc.gov). The public record for these investigations may be viewed on the Commission’s electronic docket (EDIS– ONLINE) at http://edis.usitc.gov/ hvwebex.
Written submissions: Because of time constraints, the Commission will not hold public hearings in connection with the advice provided under this investigation number. However, interested persons are invited to submit written statements containing data and other information concerning the matters to be addressed by the Commission. All submissions should be addressed to the Secretary, United States International Trade Commission, 500 E Street, SW., Washington, DC 20436, and should be received no later than the close of business (5:15 p.m. EST) on the date stated in the notification letter of each review of a petition. All written submissions must conform with the provisions of § 201.8 of the Commission’s Rules of Practice and Procedure (19 CFR 201.8). Section 201.8 of the rules requires that a signed original (or a copy designated as an original) and three (3) copies of each document be filed. In the event that confidential treatment of the document is requested, at least two (2) additional copies must be filed, in which the confidential business information must be deleted (see the following paragraph for further information regarding confidential business information). The Commission’s rules do not authorize filing submissions with the Secretary by facsimile or electronic means, except to the extent permitted by section 201.8 of the rules (see Handbook for Electronic Filing Procedures, ftp://ftp.usitc.gov/ pub/reports/electronic_filing_handbook. Persons with questions regarding electronic filing should contact the
Office of the Secretary (202–205–2000 or [email protected]).
Any submissions that contain confidential business information must also conform with the requirements of section 201.6 of the Commission’s Rules of Practice and Procedure (19 CFR 201.6). Section 201.6 of the rules requires that the cover of the document and the individual pages be clearly marked as to whether they are the ‘‘confidential’’ or ‘‘non-confidential’’ version, and that the confidential business information be clearly identified by means of brackets. All written submissions, except for confidential business information, will be made available in the Office of the Secretary to the Commission for inspection by interested parties. Some or all of the confidential business information provided may be included in the reviews that the Commission sends to the USTR. The Commission plans to publish a public version of each review shortly after a review is sent to the USTR. However, in the public version the Commission will not publish confidential business information in a manner that would reveal the operations of the firm supplying the information.
Persons with mobility impairments who will need special assistance in gaining access to the Commission should contact the Secretary at 202– 205–2000.
By order of the Commission. Issued: February 28, 2006.
Marilyn R. Abbott, Secretary to the Commission. [FR Doc. E6–3082 Filed 3–2–06; 8:45 am] BILLING CODE 7020–02–P
INTERNATIONAL TRADE COMMISSION
[Investigation No. 731–TA–1089 (Final)]
Certain Orange Juice From Brazil
Determination On the basis of the record 1 developed
in the subject investigation, the United States International Trade Commission (Commission) determines,2 pursuant to section 735(b) of the Tariff Act of 1930 (19 U.S.C. 1673d(b)) (the Act), that an industry in the United States is materially injured by reason of imports from Brazil of certain orange juice, provided for in subheading 2009.11.00,
2009.12.25, 2009.12.45, and 2009.19.00 of the Harmonized Tariff Schedule of the United States, that have been found by the Department of Commerce (Commerce) to be sold in the United States at less than fair value (LTFV). The Commission makes a negative finding with regard to critical circumstances.
Background
The Commission instituted this investigation effective December 27, 2004, following receipt of a petition filed with the Commission and Commerce by Florida Citrus Mutual, Lakeland, FL; A. Duda & Sons, Inc., Ovieda, FL; Citrus World, Inc., Lake Wales, FL; and Southern Garden Citrus Processing Corp., Clewiston, FL. The final phase of the investigation was scheduled by the Commission following notification of a preliminary determination by Commerce that imports of certain orange juice from Brazil were being sold at LTFV within the meaning of section 733(b) of the Act (19 U.S.C. 1673b(b)). Notice of the scheduling of the final phase of the Commission’s investigation and of a public hearing to be held in connection therewith was given by posting copies of the notice in the Office of the Secretary, U.S. International Trade Commission, Washington, DC, and by publishing the notice in the Federal Register of September 7, 2005 (70 FR 53251). The hearing was held in Washington, DC, on January 10, 2006, and all persons who requested the opportunity were permitted to appear in person or by counsel.
The Commission transmitted its determination in this investigation to the Secretary of Commerce on February 27, 2006. The views of the Commission are contained in USITC Publication 3838 (February 2006), entitled Certain Orange Juice from Brazil: Investigation No. 731–TA–1089 (Final).
By order of the Commission. Issued: February 28, 2006.
Marilyn R. Abbott, Secretary to the Commission. [FR Doc. E6–3085 Filed 3–2–06; 8:45 am] BILLING CODE 7020–02–P
INTERNATIONAL TRADE COMMISSION
[USITC SE–06–016]
Sunshine Act Meeting
AGENCY HOLDING THE MEETING: International Trade Commission.
TIME AND DATE: March 14, 2006 at 1 p.m.
VerDate Aug<31>2005 16:43 Mar 02, 2006 Jkt 208001 PO 00000 Frm 00044 Fmt 4703 Sfmt 4703 E:\FR\FM\03MRN1.SGM 03MRN1ww
hite
on
PR
OD
1PC
61 w
ith N
OT
ICE
S

12183 Federal Register / Vol. 71, No. 46 / Thursday, March 9, 2006 / Notices
submission of rebuttal briefs. Parties will be notified of the time and location.
The Department will publish the final results of this administrative review, including the results of its analysis of issues raised in any case or rebuttal brief, no later than 120 days after publication of these preliminary results, unless extended. See § 351.213(h) of the Department’s regulations.
Notification to Importers
This notice serves as a preliminary reminder to importers of their responsibility under section 351.402(f) of the Department’s regulations to file a certificate regarding the reimbursement of antidumping duties prior to liquidation of the relevant entries during this review period. Failure to comply with this requirement could result in the Secretary’s presumption that reimbursement of antidumping duties occurred and the subsequent assessment of double antidumping duties.
This administrative review and notice are issued and published in accordance with sections 751(a)(1) and 777(i)(1) of the Act.
Dated: March 2, 2006. David M. Spooner, Assistant Secretary for Import Administration. [FR Doc. E6–3358 Filed 3–8–06; 8:45 am] BILLING CODE 3510–DS–P
DEPARTMENT OF COMMERCE
International Trade Administration
(A 351–840)
Antidumping Duty Order: Certain Orange Juice from Brazil
AGENCY: Import Administration, International Trade Administration, Department of Commerce. EFFECTIVE DATE: March 9, 2006. FOR FURTHER INFORMATION CONTACT: Elizabeth Eastwood or Jill Pollack, AD/ CVD Operations, Office 2, Import Administration, International Trade Administration, U.S. Department of Commerce, 14th Street and Constitution Avenue, NW, Washington, DC 20230; telephone (202) 482–3874 or (202) 482– 4593, respectively. SUPPLEMENTARY INFORMATION:
Scope of Order
The scope of this order includes certain orange juice for transport and/or further manufacturing, produced in two different forms: (1) Frozen orange juice in a highly concentrated form, sometimes referred to as frozen
concentrated orange juice for manufacture (FCOJM); and (2) pasteurized single–strength orange juice which has not been concentrated, referred to as not–from-concentrate (NFC). At the time of the filing of the petition, there was an existing antidumping duty order on frozen concentrated orange juice (FCOJ) from Brazil. See Antidumping Duty Order; Frozen Concentrated Orange Juice from Brazil, 52 FR 16426 (May 5, 1987). Therefore, the scope of this order with regard to FCOJM covers only FCOJM produced and/or exported by those companies which were excluded or revoked from the pre–existing antidumping order on FCOJ from Brazil as of December 27, 2004. Those companies are Cargill Citrus Limitada (Cargill), Coinbra–Frutesp S.A. (Coinbra–Frutesp), Sucocitrico Cutrale, S.A. (Cutrale), Fischer S/A - Agroindustria (Fischer), and Montecitrus Trading S.A. (Montecitrus).
Excluded from the scope of the order are reconstituted orange juice and frozen concentrated orange juice for retail (FCOJR). Reconstituted orange juice is produced through further manufacture of FCOJM, by adding water, oils and essences to the orange juice concentrate. FCOJR is concentrated orange juice, typically at 42° Brix, in a frozen state, packed in retail–sized containers ready for sale to consumers. FCOJR, a finished consumer product, is produced through further manufacture of FCOJM, a bulk manufacturer’s product. The subject merchandise is currently classifiable under subheadings 2009.11.00, 2009.12.25, 2009.12.45, and 2009.19.00 of the Harmonized Tariff Schedule of the United States (HTSUS). These HTSUS subheadings are provided for convenience and for customs purposes only and are not dispositive. Rather, the written description of the scope of this order is dispositive.
Antidumping Duty Order On February 27, 2006, the
International Trade Commission (the ITC) notified the Department of Commerce (the Department) of its final determination pursuant to section 735(b)(1)(A)(i) of the Tariff Act of 1930, as amended (the Act), that the industry in the United States producing certain orange juice is materially injured by reason of less–than-fair–value imports of subject merchandise from Brazil. In addition, the ITC notified the Department of its final determination that critical circumstances do not exist with respect to imports of subject merchandise from Brazil that are subject to the Department’s partial affirmative
critical circumstances finding. Therefore, in accordance with section 736(a)(1) of the Act, the Department will direct U.S. Customs and Border Protection (CBP) to assess, upon further advice by the Department, antidumping duties equal to the amount by which the normal value of the merchandise exceeds the U.S. price of the merchandise for all relevant entries of certain orange juice from Brazil. These antidumping duties will be assessed on all unliquidated entries of certain orange juice from Brazil entered, or withdrawn from the warehouse, for consumption on or after August 24, 2005, the date on which the Department published its Notice of Preliminary Determination of Sales at Less Than Fair Value, Postponement of Final Determination, and Affirmative Preliminary Critical Circumstances Determination: Certain Orange Juice from Brazil, 70 FR 49557 (Aug. 24, 2005). With regard to the ITC negative critical circumstances determination, we will instruct CBP to lift suspension and to release any bond or other security, and refund any cash deposit made, to secure the payment of antidumping duties with respect to entries of the merchandise entered, or withdrawn from warehouse, for consumption on or after May 26, 2005 (i.e., 90 days prior to the date of publication of the preliminary determination in the Federal Register), but before August 24, 2005.
Section 733(d) of the Act states that instructions issued pursuant to an affirmative preliminary determination may not remain in effect for more than four months except where exporters representing a significant proportion of exports of the subject merchandise extend that four-month period to not more than six months. In this investigation, the six-month period beginning on the date of the publication of the preliminary determination ended on February 19, 2006. Furthermore, section 737 of the Act states that definitive duties are to begin on the date of publication of the ITC’s final injury determination. Therefore, in accordance with section 733(d) of the Act and our practice, we instructed CBP to terminate the suspension of liquidation and to liquidate, without regard to antidumping duties, unliquidated entries of certain orange juice from Brazil entered, or withdrawn from warehouse, for consumption on or after February 19, 2006, and before the date of publication of the ITC’s final injury determination in the Federal Register. See Antidumping Duty Order: Certain Color Television Receivers From the
VerDate Aug<31>2005 13:58 Mar 08, 2006 Jkt 208001 PO 00000 Frm 00023 Fmt 4703 Sfmt 4703 E:\FR\FM\09MRN1.SGM 09MRN1hsro
bins
on o
n P
RO
D1P
C70
with
NO
TIC
ES

12184 Federal Register / Vol. 71, No. 46 / Thursday, March 9, 2006 / Notices
People’s Republic of China, 69 FR 31347 (June 3, 2004). Suspension of liquidation will continue on or after this date.
On or after the date of publication of the ITC’s notice of final determination in the Federal Register, CBP will require, at the same time as importers would normally deposit estimated duties on this merchandise, cash deposits for the subject merchandise equal to the estimated weighted–average antidumping duty margins listed below. We will also instruct CBP that, for NFC, the ‘‘All Others’’ rate applies to all companies not specifically named below. However, for FCOJM, the ‘‘All Others’’ rate only applies to FCOJM produced and/or exported by Cargill and Coinbra–Frutesp.
Manufacturer/Exporter
Weighted– Average Margin
(percent)
Fischer S/A – Agroindustria ....... 12.46 Montecitrus Trading S.A. ............ 60.29 Sucocitrico Cutrale, S.A. ............ 19.19 All Others .................................... 16.51
This notice constitutes the antidumping duty order with respect to certain orange juice from Brazil, pursuant to section 736(a) of the Act. Interested parties may contact the Department’s Central Records Unit, Room B–099 of the main Commerce building, for copies of an updated list of antidumping duty orders currently in effect.
This order is published in accordance with section 736(a) of the Act and 19 CFR 351.211.
Dated: February 28, 2006. David M. Spooner, Assistant Secretary. [FR Doc. E6–3364 Filed 3–8–06; 8:45 am] BILLING CODE 3510–DS–S
DEPARTMENT OF COMMERCE
National Oceanic and Atmospheric Administration
[I.D. 013006B]
International Whaling Commission; 58th Annual Meeting; Nominations
AGENCY: National Marine Fisheries Service (NMFS), National Oceanic and Atmospheric Administration (NOAA), Commerce. ACTION: Extension of request for nominations.
SUMMARY: This notice is to extend the call for nominees for the U.S. Delegation to the June 2006 International Whaling Commission (IWC) annual meeting. A
request for nominations was previously published in the Federal Register on February 13, 2006. DATES: All written nominations for the U.S. Delegation to the IWC annual meeting must be received by April 7, 2006.
ADDRESSES: All nominations for the U.S. Delegation to the IWC annual meeting should be addressed to Bill Hogarth, U.S. Commissioner to the IWC, and sent via post to: Cheri McCarty, National Marine Fisheries Service, Office of International Affairs, 1315 East West Highway, SSMC3 Room 12603, Silver Spring, MD 20910. Prospective Congressional advisors to the delegation should contact the Department of State directly. FOR FURTHER INFORMATION CONTACT: Cheri McCarty, 301–713–9090, ext. 183. SUPPLEMENTARY INFORMATION: The Secretary of Commerce is charged with the responsibility of discharging the obligations of the United States under the International Convention for the Regulation of Whaling, 1946. The U.S. Commissioner has primary responsibility for the preparation and negotiation of U.S. positions on international issues concerning whaling and for all matters involving the IWC. He is staffed by the Department of Commerce and assisted by the Department of State, the Department of the Interior, the Marine Mammal Commission, and by other agencies. The non-federal representative(s) selected as a result of this nomination process is(are) responsible for providing input and recommendations to the U.S. IWC Commissioner representing the positions of non-governmental organizations. Generally, only one non- governmental position is selected for the U.S. Delegation.
The IWC is hosting its 58th annual meeting from June 16–20, 2006, in St. Kitts & Nevis.
Dated: March 6, 2006. William T. Hogarth, Assistant Administrator for Fisheries, National Marine Fisheries Service. [FR Doc. 06–2253 Filed 3–6–06; 3:18 pm] BILLING CODE 3510–22–S
DEPARTMENT OF COMMERCE
National Oceanic and Atmospheric Administration
[I.D. 030306C]
Endangered Species; File No. 1506
AGENCY: National Marine Fisheries Service (NMFS), National Oceanic and
Atmospheric Administration (NOAA), Commerce. ACTION: Notice; receipt of application for permit modification.
SUMMARY: Notice is hereby given that Dr. Blair E. Witherington, Florida Fish and Wildlife Conservation Commission, Fish and Wildlife Research Institute, Melbourne Beach Field Laboratory, 9700 South A1A, Melbourne Beach, Florida 32951, has requested a modification to scientific research Permit No. 1506. DATES: Written, telefaxed, or e-mail comments must be received on or before April 10, 2006. ADDRESSES: The modification request and related documents are available for review upon written request or by appointment in the following office(s):
Permits, Conservation and Education Division, Office of Protected Resources, NMFS, 1315 East-West Highway, Room 13705, Silver Spring, MD 20910; phone 301–713–2289; fax 301–427–2521; and
Southeast Region, NMFS, 263 13th Ave South, St. Petersburg, FL 33701; phone 727–824–5312; fax 727-824-5309.
Written comments or requests for a public hearing on this request should be submitted to the Chief, Permits, Conservation and Education Division, F/PR1, Office of Protected Resources, NMFS, 1315 East-West Highway, Room 13705, Silver Spring, MD 20910. Those individuals requesting a hearing should set forth the specific reasons why a hearing on this particular modification request would be appropriate.
Comments may also be submitted by facsimile at 301–427–2521, provided the facsimile is confirmed by hard copy submitted by mail and postmarked no later than the closing date of the comment period.
Comments may also be submitted by e-mail. The mailbox address for providing email comments is [email protected]. Include in the subject line of the e-mail comment the following document identifier: File No. 1506. FOR FURTHER INFORMATION CONTACT: Amy Hapeman or Patrick Opay, 301– 713–2289. SUPPLEMENTARY INFORMATION: The subject modification to Permit No. 1506, issued on March 23, 2005 (70 FR 20530) is requested under the authority of the Endangered Species Act of 1973, as amended (16 U.S.C. 1531 et seq.) and the regulations governing the taking, importing, and exporting of endangered and threatened species (50 CFR 222- 226).
Permit No. 1506 authorizes the permit holder to study neonate and juvenile
VerDate Aug<31>2005 13:58 Mar 08, 2006 Jkt 208001 PO 00000 Frm 00024 Fmt 4703 Sfmt 4703 E:\FR\FM\09MRN1.SGM 09MRN1hsro
bins
on o
n P
RO
D1P
C70
with
NO
TIC
ES
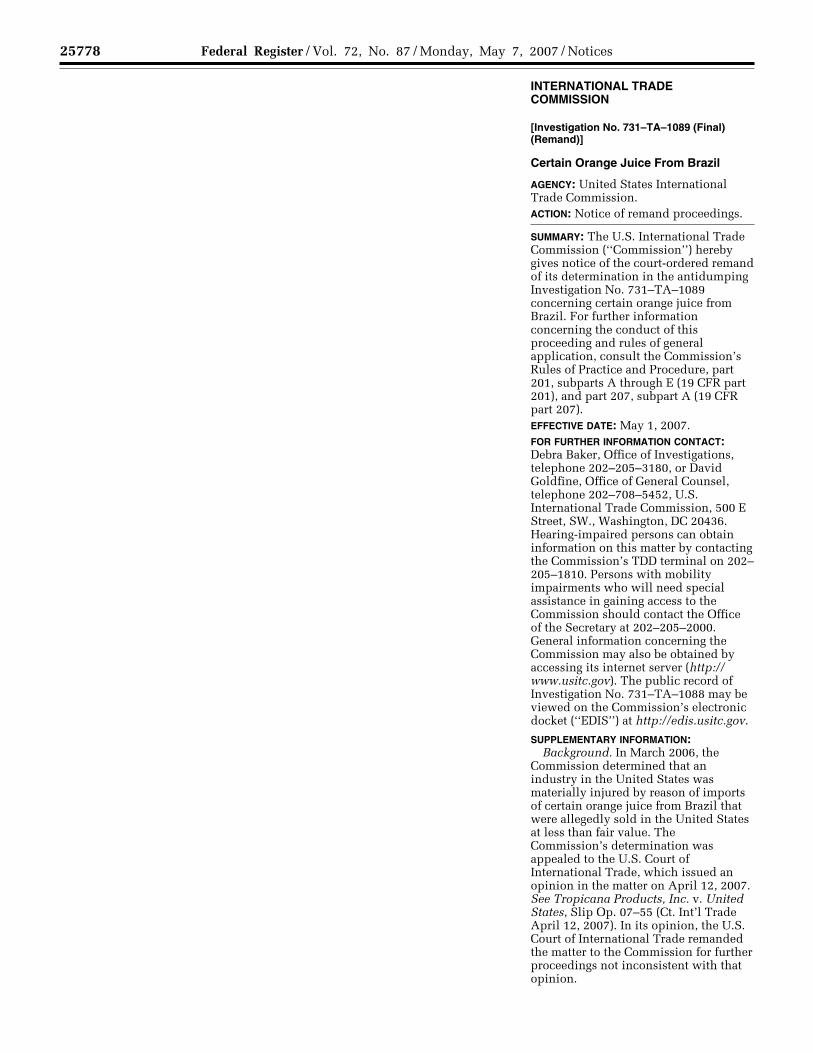
25778 Federal Register / Vol. 72, No. 87 / Monday, May 7, 2007 / Notices
in the Office of the Secretary, U.S. International Trade Commission, 500 E Street, SW., Room 112, Washington, DC 20436, telephone 202–205–2000. Hearing impaired individuals are advised that information on this matter can be obtained by contacting the Commission’s TDD terminal on 202– 205–1810. Persons with mobility impairments who will need special assistance in gaining access to the Commission should contact the Office of the Secretary at 202–205–2000. General information concerning the Commission may also be obtained by accessing its internet server at http:// www.usitc.gov. The public record for this investigation may be viewed on the Commission’s electronic docket (EDIS) at http://www.usitc.gov/secretary/ edis.htm.
FOR FURTHER INFORMATION CONTACT: Vu Q. Bui, Esq., Office of Unfair Import Investigations, U.S. International Trade Commission, telephone (202) 205–2582.
Authority: The authority for institution of this investigation is contained in section 337 of the Tariff Act of 1930, as amended, and in section 210.10 of the Commission’s Rules of Practice and Procedure, 19 CFR 210.10 (2006).
Scope of Investigation: Having considered the amended complaint, the U.S. International Trade Commission, on April 30, 2007, ordered that—
(1) Pursuant to subsection (b) of section 337 of the Tariff Act of 1930, as amended, an investigation be instituted to determine whether there is a violation of subsection (a)(1)(B) of section 337 in the importation into the United States, the sale for importation, or the sale within the United States after importation of certain GPS devices or products containing same by reason of infringement of one or more of claims 1 and 17 of U.S. Patent No. 6,417,801; claims 1, 3–5, 8–17, 19–21, and 23 of U.S. Patent No. 6,606,346; claims 1–5, 9, 10, 11–14, 29–31, and 33 of U.S. Patent No. 6,651,000; claims 1 and 2 of U.S. Patent No. 6,704,651; claims 1 and 9 of U.S. Patent No. 6,937,187; and claims 1– 3, 12, 15, 16, 19, 20, 22–24, 26, 28–31, and 33–35 of U.S. Patent No. 7,158,080, and whether an industry in the United States exists or is in the process of being established as required by subsection (a)(2) of section 337;
(2) For the purpose of the investigation so instituted, the following are hereby named as parties upon which this notice of investigation shall be served:
(a) The complainant is—Global Locate, Inc., 3190 South Bascom Avenue, San Jose, Califonia 95124.
(b) The respondents are the following entities alleged to be in violation of section 337, and are the parties upon which the complaint is to be served: SiRF Technology, Inc., 217 Devcon
Drive, San Jose, California 95112. E–TEN Corp., No. 256, Yangguang
Street, Neihu Chiu, Taipei, Taiwan 114, Taiwan.
Pharos Science & Applications, Inc., 411 Amapola Avenue, Torrance, California 90501.
MiTAC International Corporation, No. 200 Wen Hwa 2nd Road, Kuei Shan Hsiang, Taoyuan, Taiwan.
Mio Technology Limited, USA, 47988 Fremont Boulevard, Fremont, California 94538. (c) The Commission investigative
attorney, party to this investigation, is Vu Q. Bui, Esq., Office of Unfair Import Investigations, U.S. International Trade Commission, 500 E Street, SW., Suite 401, Washington, DC 20436; and
(3) For the investigation so instituted, the Honorable Robert L. Barton, Jr. is designated as the presiding administrative law judge.
Responses to the complaint and the notice of investigation must be submitted by the named respondents in accordance with section 210.13 of the Commission’s Rules of Practice and Procedure, 19 CFR 210.13. Pursuant to 19 CFR 201.16(d) and 210.13(a), such responses will be considered by the Commission if received not later than 20 days after the date of service by the Commission of the complaint and the notice of investigation. Extensions of time for submitting responses to the complaint and the notice of investigation will not be granted unless good cause therefor is shown.
Failure of a respondent to file a timely response to each allegation in the complaint and in this notice may be deemed to constitute a waiver of the right to appear and contest the allegations of the complaint and this notice, and to authorize the administrative law judge and the Commission, without further notice to the respondent, to find the facts to be as alleged in the complaint and this notice and to enter an initial determination and a final determination containing such findings, and may result in the issuance of a limited exclusion order or cease and desist order or both directed against the respondent.
By order of the Commission. Issued: April 30, 2007.
Marilyn R. Abbott, Secretary to the Commission. [FR Doc. E7–8624 Filed 5–4–07; 8:45 am] BILLING CODE 7020–02–P
INTERNATIONAL TRADE COMMISSION
[Investigation No. 731–TA–1089 (Final) (Remand)]
Certain Orange Juice From Brazil
AGENCY: United States International Trade Commission. ACTION: Notice of remand proceedings.
SUMMARY: The U.S. International Trade Commission (‘‘Commission’’) hereby gives notice of the court-ordered remand of its determination in the antidumping Investigation No. 731–TA–1089 concerning certain orange juice from Brazil. For further information concerning the conduct of this proceeding and rules of general application, consult the Commission’s Rules of Practice and Procedure, part 201, subparts A through E (19 CFR part 201), and part 207, subpart A (19 CFR part 207). EFFECTIVE DATE: May 1, 2007. FOR FURTHER INFORMATION CONTACT: Debra Baker, Office of Investigations, telephone 202–205–3180, or David Goldfine, Office of General Counsel, telephone 202–708–5452, U.S. International Trade Commission, 500 E Street, SW., Washington, DC 20436. Hearing-impaired persons can obtain information on this matter by contacting the Commission’s TDD terminal on 202– 205–1810. Persons with mobility impairments who will need special assistance in gaining access to the Commission should contact the Office of the Secretary at 202–205–2000. General information concerning the Commission may also be obtained by accessing its internet server (http:// www.usitc.gov). The public record of Investigation No. 731–TA–1088 may be viewed on the Commission’s electronic docket (‘‘EDIS’’) at http://edis.usitc.gov.
SUPPLEMENTARY INFORMATION: Background. In March 2006, the
Commission determined that an industry in the United States was materially injured by reason of imports of certain orange juice from Brazil that were allegedly sold in the United States at less than fair value. The Commission’s determination was appealed to the U.S. Court of International Trade, which issued an opinion in the matter on April 12, 2007. See Tropicana Products, Inc. v. United States, Slip Op. 07–55 (Ct. Int’l Trade April 12, 2007). In its opinion, the U.S. Court of International Trade remanded the matter to the Commission for further proceedings not inconsistent with that opinion.
VerDate Aug<31>2005 18:36 May 04, 2007 Jkt 211001 PO 00000 Frm 00043 Fmt 4703 Sfmt 4703 E:\FR\FM\07MYN1.SGM 07MYN1pwal
ker
on P
RO
D1P
C71
with
NO
TIC
ES

25779 Federal Register / Vol. 72, No. 87 / Monday, May 7, 2007 / Notices
Participation in the proceeding. Only those persons who were interested parties to the original investigation (i.e., persons listed on the Commission Secretary’s service list) and were parties to the appeal may participate in the remand proceeding. Such persons need not make any additional appearance filings with the Commission to participate in the remand proceeding. Business proprietary information (‘‘BPI’’) referred to during the remand proceeding will be governed, as appropriate, by the administrative protective order issued in the original investigation.
Written submissions. The Commission is reopening the record for the limited purpose of collecting data pertinent to its analysis called for under Bratsk Aluminum Smelter v. United States, 444 F.3d 1369 and 1375 (Fed. Cir. 2006). In addition, the Commission will permit the parties to file comments pertaining to the inquiries that are the subject of the CIT’s remand instructions, but no new factual information may be submitted with these comments. Comments should be limited to no more than twenty (20) double-spaced and single-sided pages of textual material. The parties may not submit any new factual information and may not address any issue other than the inquiries that are the subject of the CIT’s remand instructions. Any such comments must be filed with the Commission no later than May 31, 2007.
All written submissions must conform with the provisions of section 201.8 of the Commission’s rules; any submissions that contain BPI must also conform with the requirements of sections 201.6, 207.3, and 207.7 of the Commission’s rules. The Commission’s rules do not authorize filing of submissions with the Secretary by facsimile or electronic means, except to the extent permitted by section 201.8 of the Commission’s rules, as amended, 67 FR 68036 (Nov. 8, 2002).
In accordance with sections 201.16(c) and 207.3 of the Commission’s rules, each document filed by a party to the investigation must be served on all other parties to the investigation (as identified by either the public or BPI service list), and a certificate of service must be timely filed. The Secretary will not accept a document for filing without a certificate of service.
Parties are also advised to consult with the Commission’s Rules of Practice and Procedure, part 201, subparts A through E (19 CFR part 201), and part 207, subpart A (19 CFR part 207) for provisions of general applicability concerning written submissions to the Commission.
By order of the Commission. Issued: May 1, 2007.
Marilyn R. Abbott, Secretary to the Commission. [FR Doc. E7–8615 Filed 5–4–07; 8:45 am] BILLING CODE 7020–02–P


B-1
APPENDIX B
Excerpts from Tropicana Products, Inc. v. United StatesSlip Op. 07-55, CIT 2007


SLIP OP. 07-55
UNITED STATES COURT OF INTERNATIONAL TRADE
:TROPICANA PRODUCTS, INC., :
:Plaintiff, :
:and :
:LOUIS DREYFUS CITRUS, INC., and :FISCHER S/A AGROINDUSTRIA, :
:Plaintiff-Intervenors, :
:v. :
: Before: Jane A. Restani, Chief Judge:
UNITED STATES, : Court No. 06-00109:
Defendant, : Public Version:
and ::
A. DUDA & SONS, INC., CITRUS :WORLD, INC., FLORIDA CITRUS MUTUAL, :SOUTHERN GARDEN CITRUS :PROCESSING CORP., and THE COCA-COLA :COMPANY, :
:Defendant-Intervenors. :
:
OPINION
[The International Trade Commission’s affirmative determination of material injury by reason ofimports of certain orange juice from Brazil REMANDED.]
Dated: April 12, 2007
Neville Peterson, LLP (John M. Peterson, Catherine C. Chen, and George W. Thompson)for the plaintiff.
Vinson & Elkins, LLP (Christopher A. Dunn and Valerie S. Ellis) for the plaintiff-

COURT NO. 06-00109 PAGE 42
Brazilian imports in order to use the duty drawbacks from Brazilian imports to offset the higher
prices of their juice. Final Determination, at 20 n.142. While the duty drawback program does
help facilitate U.S. exports, the Commission found that the domestic industry did not need
Brazilian imports in order to export its own like product. Id. at 19–20. The Commission found
that the fact that the value of drawback credits available significantly exceeded the value of
domestic exports demonstrated that there is little correlation between U.S. exports and the
availability of drawback credits. Id. at 19–20, 20 n.142. The court agrees that the record supports
the conclusion that, although duty drawbacks help facilitate U.S. exports, duty drawbacks are not
a major factor in spurring U.S. exports.
CONCLUSION
For the foregoing reasons, the court remands the affirmative determination to the
Commission. As previously discussed, the Commission’s inventory analysis is seriously flawed
for failure to consider, among other factors, the residual demand, the inverse correlation between
inventory levels of subject imports and domestic production, and the domestic industry’s
voluntary maintenance of high inventories. Thus, upon remand, the Commission must examine
the full effects of a shortage in the supply of domestic round oranges, and how that affects the
Commission’s volume and price effects analysis. Additionally, the Commission must examine:
the opposition to the petition by a large portion of the domestic industry; whether, if prices were
adjusted to account for the LTFV margin, non-subject imports would displace subject imports;
and its price suppression analysis.
Further, although the Commission’s determinations as to the collection of data, the
lack of consideration of ULPOJ imports, and the role of blending are not erroneous when viewed

COURT NO. 06-00109 PAGE 43
in isolation, the weakness of the overall analysis and the relatedness of the issues may cause these
matters to be significant in the context of a more comprehensive analysis. Given the relatedness
of the issues, upon remand, the Commission must not only examine the four deficiencies noted
above but must also consider the totality of the evidence anew. In so doing, the Commission must
not seize upon bits of evidence to reject what the bulk of the evidence dictates. Additionally,
while the court understands that the dissent is not under direct assault here, the dissent’s finding of
no causation appears to be more logical and supported than the Commission’s finding of
causation. It would be helpful upon remand for the Commission to engage the dissent.
The Commission’s present determination acknowledges that weather and disease
caused an increase in the demand for imports but does not offer sufficient evidentiary support, or
adequate explanation, for its findings that subject imports were greater than necessary to meet that
demand and that the inventory levels of these subject imports over the course of the POI
prevented price increases that otherwise would have occurred. In a volatile supply condition,
which the Commission acknowledges, not the least by the breadth of the POI here, significant
inventory is necessary. If inventory is the key, it needs an in-depth analysis.
If it finds it necessary or efficacious, the Commission may reopen the record. The
Commission should render a determination upon remand within 75 days hereof. Objections may
be filed 20 days thereafter. Response may be filed within 11 days.
/s/ Jane A. Restani Jane A. RestaniChief Judge
Dated this 12th day of April, 2007.New York, New York.

C-1
APPENDIX C
SUMMARY DATA


Table C-3Certain orange juice: Summary data concerning the U.S. market, crop years 2001/02 - 2004/05
(Quantity=1,000 gallons, value=1,000 dollars, unit values are per gallon; period changes=percent, except where noted)Reported data Period changes
Crop years 2001/02 - 2001/02 - 2002/03 - 2003/04 -Item 2001/02 2002/03 2003/04 2004/05 2004/05 2002/03 2003/04 2004/05
Total available supply: Amount . . . . . . . . . . . . . . . . . . . 1,450,121 1,426,553 1,436,664 1,500,670 3.5 -1.6 0.7 4.5 Domestic share (1) . . . . . . . . . . 87.2 79.9 84.8 76.5 -10.7 -7.3 4.9 -8.3 Importers' share (1): Brazil . . . . . . . . . . . . . . . . . . . . 7.6 15.9 10.7 15.4 7.9 8.4 -5.2 4.7 Belize. . . . . . . . . . . . . . . . . . . . 0.3 0.6 1.4 2.0 1.8 0.3 0.8 0.6 Costa Rica. . . . . . . . . . . . . . . . 1.7 2.0 2.2 2.0 0.3 0.4 0.2 -0.3 Mexico . . . . . . . . . . . . . . . . . . . 2.9 0.9 0.6 3.7 0.8 -1.9 -0.4 3.1 All other sources . . . . . . . . . . . 0.4 0.6 0.3 0.4 -0.1 0.2 -0.4 0.1 Total imports . . . . . . . . . . . . . 12.8 20.1 15.2 23.5 10.7 7.3 -4.9 8.3
U.S. imports from: Brazil: Quantity . . . . . . . . . . . . . . . . . . 109,728 227,280 154,203 231,711 111.2 107.1 -32.2 50.3 Value . . . . . . . . . . . . . . . . . . . . 99,162 242,259 142,702 232,481 134.4 144.3 -41.1 62.9 Unit value . . . . . . . . . . . . . . . . $0.90 $1.07 $0.93 $1.00 11.0 17.9 -13.2 8.4 Ending inventory quantity . . . . 33,791 41,795 26,633 51,312 51.9 23.7 -36.3 92.7 Belize: Quantity . . . . . . . . . . . . . . . . . . 3,822 8,123 20,205 30,366 694.5 112.5 148.7 50.3 Value . . . . . . . . . . . . . . . . . . . . 13,747 11,486 10,602 18,484 34.5 -16.4 -7.7 74.3 Unit value . . . . . . . . . . . . . . . . $3.60 $1.41 $0.52 $0.61 -83.1 -60.7 -62.9 16.0 Costa Rica: Quantity . . . . . . . . . . . . . . . . . . 24,054 28,755 32,020 29,658 23.3 19.5 11.4 -7.4 Value . . . . . . . . . . . . . . . . . . . . 37,960 38,397 30,781 31,411 -17.3 1.1 -19.8 2.0 Unit value . . . . . . . . . . . . . . . . $1.58 $1.34 $0.96 $1.06 -32.9 -15.4 -28.0 10.2 Mexico: Quantity . . . . . . . . . . . . . . . . . . 41,358 13,467 8,209 54,822 32.6 -67.4 -39.0 567.8 Value . . . . . . . . . . . . . . . . . . . . 43,486 16,591 8,339 53,106 22.1 -61.8 -49.7 536.8 Unit value . . . . . . . . . . . . . . . . $1.05 $1.23 $1.02 $0.97 -7.9 17.2 -17.5 -4.6 All other sources: Quantity . . . . . . . . . . . . . . . . . . 6,325 9,244 3,733 5,586 -11.7 46.1 -59.6 49.6 Value . . . . . . . . . . . . . . . . . . . . 7,908 10,020 3,925 6,191 -21.7 26.7 -60.8 57.7 Unit value . . . . . . . . . . . . . . . . $1.25 $1.08 $1.05 $1.11 -11.4 -13.3 -3.0 5.4 All sources: Quantity . . . . . . . . . . . . . . . . . . 185,287 286,869 218,370 352,143 90.1 54.8 -23.9 61.3 Value . . . . . . . . . . . . . . . . . . . . 202,265 318,753 196,350 341,672 68.9 57.6 -38.4 74.0 Unit value . . . . . . . . . . . . . . . . $1.09 $1.11 $0.90 $0.97 -11.1 1.8 -19.1 7.9 Ending inventory quantity . . . . 35,484 41,834 26,642 54,749 54.3 17.9 -36.3 105.5
U.S. domestic shipment quantity . 1,264,833 1,139,684 1,218,294 1,148,526 -9.2 -9.9 6.9 -5.7
(Quantity=1,000 pounds, value=1,000 dollars, unit values, unit labor costs, and unit expenses are per pound; period changes=percent, except where noted)Reported data Period changes
Crop years 2001/02 - 2001/02 - 2002/03 - 2003/04 -Item 2001/02 2002/03 2003/04 2004/05 2004/05 2002/03 2003/04 2004/05
U.S. processors': Average capacity quantity . . . . . 1,645,640 1,645,641 1,690,640 1,690,640 2.7 0.0 2.7 0.0 Production quantity . . . . . . . . . . 1,405,537 1,226,103 1,465,341 965,406 -31.3 -12.8 19.5 -34.1 Capacity utilization (1) . . . . . . . . 85.4 74.5 86.7 57.1 -28.3 -10.9 12.2 -29.6 U.S. shipments: Quantity . . . . . . . . . . . . . . . . . . 1,338,675 1,194,489 1,348,799 1,048,643 -21.7 -10.8 12.9 -22.3 Value . . . . . . . . . . . . . . . . . . . . 1,331,416 1,247,495 1,321,088 1,103,316 -17.1 -6.3 5.9 -16.5 Unit value . . . . . . . . . . . . . . . . $1.20 $1.26 $1.16 $1.23 2.1 4.8 -8.2 6.1 Export shipments: Quantity . . . . . . . . . . . . . . . . . . 118,103 50,758 74,307 61,466 -48.0 -57.0 46.4 -17.3 Value . . . . . . . . . . . . . . . . . . . . 132,123 57,672 71,151 56,598 -57.2 -56.3 23.4 -20.5 Unit value . . . . . . . . . . . . . . . . $1.12 $1.14 $0.96 $0.92 -17.7 1.6 -15.7 -3.8 Ending inventory quantity . . . . . 423,741 439,812 540,384 415,181 -2.0 3.8 22.9 -23.2 Inventories/total shipments (1) . 29.1 35.3 38.0 37.4 8.3 6.2 2.7 -0.6 Production workers . . . . . . . . . . 3,445 3,445 3,542 3,040 -11.8 0.0 2.8 -14.2 Hours worked (1,000s) . . . . . . . 9,098 8,263 8,478 7,263 -20.2 -9.2 2.6 -14.3 Wages paid ($1,000) . . . . . . . . . 118,500 117,708 122,723 113,485 -4.2 -0.7 4.3 -7.5 Hourly wages . . . . . . . . . . . . . . . $13.02 $14.25 $14.48 $15.63 20.0 9.4 1.6 7.9 Productivity (pounds per hour) . 153.6 145.5 172.9 129.5 -15.7 -5.2 18.8 -25.1 Unit labor costs . . . . . . . . . . . . . $0.08 $0.10 $0.08 $0.12 42.2 15.4 -14.4 44.1
(1) "Reported data" are in percent and "period changes" are in percentage points. (2) Increase greater than 1,000 percent.
Because of rounding, figures may not add to the totals shown. Unit values and shares are calculated from the unrounded figures.
Source: Compiled from data submitted in response to Commission questionnaires and from offical USDA and Commerce statistics.
C-3

D-1
APPENDIX D
DATA ON U.S. IMPORTS OF FCOJM AND NFCOJ


D-3
Table D-1Certain orange juice: U.S. imports by source and by type of product, crop years 2001/02-2004/05
SourceCrop year
2001/02 2002/03 2003/04 2004/05Quantity (1,000 gallons SSE)
FCOJM:Brazil (subject) 104,857 206,064 142,418 209,620Mexico 38,964 12,667 7,093 51,871Belize 3,822 8,123 20,205 30,366Costa Rica 24,054 28,755 32,020 29,658Honduras 4,462 1,238 1,669 2,182Dominican Republic 768 894 430 1,120South Africa 536 5,737 237 1,006All others 533 1,294 949 1,005
Subtotal, nonsubject 73,140 58,708 62,603 117,209Total 177,997 264,772 205,021 326,829
NFCOJ:Brazil (subject) 4,871 21,216 11,785 22,091Mexico 2,394 800 1,117 2,951Belize 0 0 0 0Costa Rica 0 0 0 0Honduras 0 0 0 0Dominican Republic 2 0 387 207South Africa 0 0 0 0All others 24 81 61 65
Subtotal, nonsubject 2,419 881 1,564 3,223Total 7,291 22,097 13,349 25,314
Value1 (1,000 dollars)FCOJM:
Brazil (subject) 90,340 205,709 127,358 199,970Mexico 40,201 15,089 6,490 48,380Belize 13,747 11,486 10,602 18,484Costa Rica 37,960 38,397 30,781 31,411Honduras 5,526 1,722 1,534 2,591Dominican Republic 674 836 406 1,070South Africa 581 5,655 211 889All others 1,042 1,575 1,072 1,195
Subtotal, nonsubject 99,732 74,759 51,097 104,020Total 190,073 280,468 178,455 303,990
NFCOJ:Brazil (subject) 8,822 36,550 15,344 32,510Mexico 3,285 1,503 1,850 4,725Belize 0 0 0 0Costa Rica 0 0 0 0Honduras 0 0 0 0Dominican Republic 7 0 544 280South Africa 0 0 0 0All others 78 232 157 167
Subtotal, nonsubject 3,370 1,734 2,551 5,172Total 12,192 38,285 17,895 37,682
Table continued on next page.

D-4
Table D-1--ContinuedCertain orange juice: U.S. imports by source and by type of product, crop years 2001/02-2004/05
SourceCrop year
2001/02 2002/03 2003/04 2004/05Unit value (per gallon)
FCOJM:Brazil (subject) 0.86 1.00 0.89 0.95Mexico 1.03 1.19 0.91 0.93Belize 3.60 1.41 0.52 0.61Costa Rica 1.58 1.34 0.96 1.06Honduras 1.24 1.39 0.92 1.19Dominican Republic 0.88 0.94 0.95 0.95South Africa 1.08 0.99 0.89 0.88All others 1.95 1.22 1.13 1.19
Subtotal, nonsubject 1.36 1.27 0.82 0.89Total 1.07 1.06 0.87 0.93
NFCOJ:Brazil (subject) 1.81 1.72 1.30 1.47Mexico 1.37 1.88 1.66 1.60Belize ----- ----- ----- -----Costa Rica ----- ----- ----- -----Honduras ----- ----- ----- -----Dominican Republic 3.50 ----- 1.41 1.35South Africa ----- ----- ----- -----All others 3.29 2.88 2.59 2.57
Subtotal, nonsubject 1.39 1.97 1.63 1.60Total 1.67 1.73 1.34 1.49
Share of quantity (percent)FCOJM:
Brazil (subject) 58.9 77.8 69.5 64.1Mexico 21.9 4.8 3.5 15.9Belize 2.1 3.1 9.9 9.3Costa Rica 13.5 10.9 15.6 9.1Honduras 2.5 0.5 0.8 0.7Dominican Republic 0.4 0.3 0.2 0.3South Africa 0.3 2.2 0.1 0.3All others 0.3 0.5 0.5 0.3
Subtotal, nonsubject 41.1 22.2 30.5 35.9Total 100.0 100.0 100.0 100.0
NFCOJ:Brazil (subject) 66.8 96.0 88.3 87.3Mexico 32.8 3.6 8.4 11.7Belize 0.0 0.0 0.0 0.0Costa Rica 0.0 0.0 0.0 0.0Honduras 0.0 0.0 0.0 0.0Dominican Republic 0.0 0.0 2.9 0.8South Africa 0.0 0.0 0.0 0.0All others 0.3 0.4 0.5 0.3
Subtotal, nonsubject 33.2 4.0 11.7 12.7Total 100.0 100.0 100.0 100.0
Table continued on next page.

D-5
Table D-1--ContinuedCertain orange juice: U.S. imports by source and by type of product, crop years 2001/02-2004/05
SourceCrop year
2001/02 2002/03 2003/04 2004/05Share of value (percent)
FCOJM:Brazil (subject) 47.5 73.3 71.4 65.8Mexico 21.2 5.4 3.6 15.9Belize 7.2 4.1 5.9 6.1Costa Rica 20.0 13.7 17.2 10.3Honduras 2.9 0.6 0.9 0.9Dominican Republic 0.4 0.3 0.2 0.4South Africa 0.3 2.0 0.1 0.3All others 0.5 0.6 0.6 0.4
Subtotal, nonsubject 52.5 26.7 28.6 34.2Total 100.0 100.0 100.0 100.0
NFCOJ:Brazil (subject) 72.4 95.5 85.7 86.3Mexico 26.9 3.9 10.3 12.5Belize 0.0 0.0 0.0 0.0Costa Rica 0.0 0.0 0.0 0.0Honduras 0.0 0.0 0.0 0.0Dominican Republic 0.1 0.0 3.0 0.7South Africa 0.0 0.0 0.0 0.0All others 0.6 0.6 0.9 0.4
Subtotal, nonsubject 27.6 4.5 14.3 13.7Total 100.0 100.0 100.0 100.0
Note1.–Crop years are October - September.Note2.–Conversion factor: 1 liter = 0.2642 gallons.
1 Landed, duty-paid.
Source: Compiled from official Commerce import statistics using HTS numbers 2009.11.0060, 2009.19.2500, and 2009.12.2500
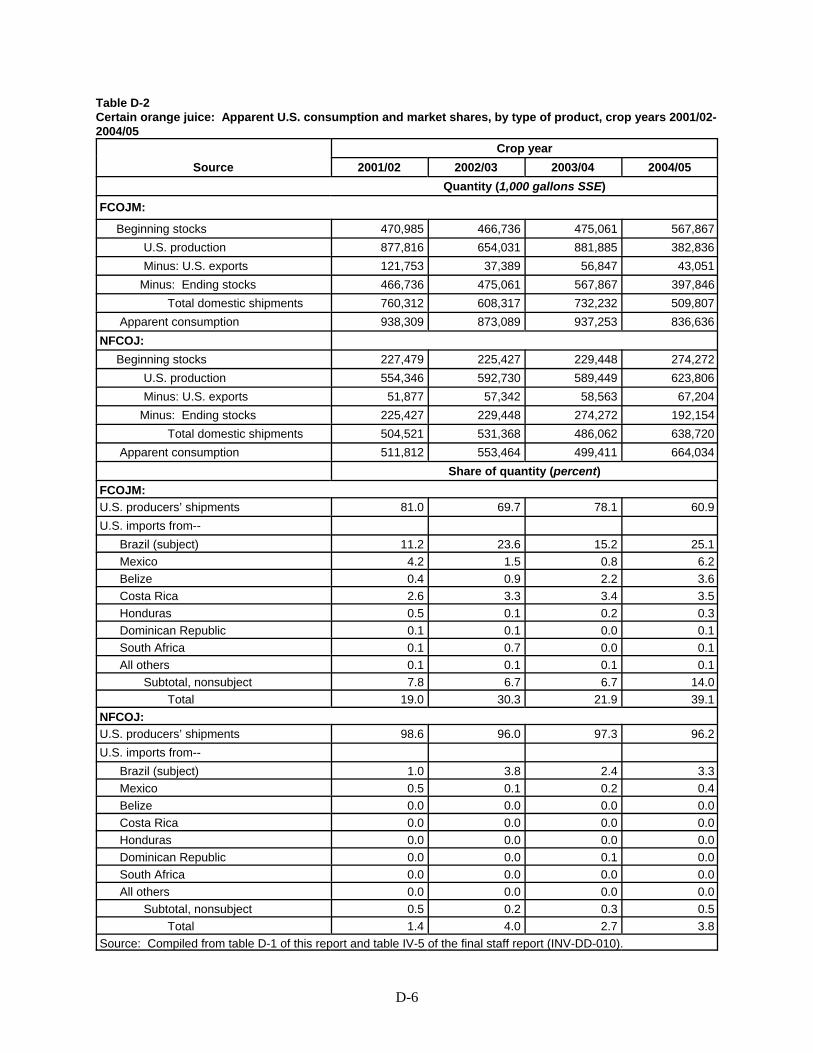
D-6
Table D-2Certain orange juice: Apparent U.S. consumption and market shares, by type of product, crop years 2001/02-2004/05
SourceCrop year
2001/02 2002/03 2003/04 2004/05Quantity (1,000 gallons SSE)
FCOJM:
Beginning stocks 470,985 466,736 475,061 567,867U.S. production 877,816 654,031 881,885 382,836Minus: U.S. exports 121,753 37,389 56,847 43,051
Minus: Ending stocks 466,736 475,061 567,867 397,846Total domestic shipments 760,312 608,317 732,232 509,807
Apparent consumption 938,309 873,089 937,253 836,636NFCOJ: Beginning stocks 227,479 225,427 229,448 274,272
U.S. production 554,346 592,730 589,449 623,806Minus: U.S. exports 51,877 57,342 58,563 67,204
Minus: Ending stocks 225,427 229,448 274,272 192,154Total domestic shipments 504,521 531,368 486,062 638,720
Apparent consumption 511,812 553,464 499,411 664,034Share of quantity (percent)
FCOJM:U.S. producers’ shipments 81.0 69.7 78.1 60.9U.S. imports from--
Brazil (subject) 11.2 23.6 15.2 25.1Mexico 4.2 1.5 0.8 6.2Belize 0.4 0.9 2.2 3.6Costa Rica 2.6 3.3 3.4 3.5Honduras 0.5 0.1 0.2 0.3Dominican Republic 0.1 0.1 0.0 0.1South Africa 0.1 0.7 0.0 0.1All others 0.1 0.1 0.1 0.1
Subtotal, nonsubject 7.8 6.7 6.7 14.0Total 19.0 30.3 21.9 39.1
NFCOJ:U.S. producers’ shipments 98.6 96.0 97.3 96.2U.S. imports from--
Brazil (subject) 1.0 3.8 2.4 3.3Mexico 0.5 0.1 0.2 0.4Belize 0.0 0.0 0.0 0.0Costa Rica 0.0 0.0 0.0 0.0Honduras 0.0 0.0 0.0 0.0Dominican Republic 0.0 0.0 0.1 0.0South Africa 0.0 0.0 0.0 0.0All others 0.0 0.0 0.0 0.0
Subtotal, nonsubject 0.5 0.2 0.3 0.5Total 1.4 4.0 2.7 3.8
Source: Compiled from table D-1 of this report and table IV-5 of the final staff report (INV-DD-010).

E-1
APPENDIX E
DATA SUBMITTED BY FOREIGN PRODUCERSIN NONSUBJECT COUNTRIES


1 ***. 2 Del Oro indicated that its exports to the United States were not subject to tariff barriers due to the CaribbeanBasin Initiative and that there is similar access to the European market. 3 Citrofrut did not provide any information on the structure of its firm operations in its response to theCommission questionnaire. With respect to Procimart, approximately *** percent of its total sales in 2004 wasrepresented by sales of the subject merchandise. Citrofrut’s and Procimart’s foreign producer questionnaireresponses.
E-3
DATA SUBMITTED ON THE ORANGE JUICE INDUSTRY IN COSTA RICA
Del Oro S.A. (“Del Oro”), a producer of orange juice in Costa Rica, provided certain data to theCommission (table E-1).1 The *** of the orange juice processed by Del Oro is shipped to the UnitedStates although the firm also maintains home market customers and ships to other regions (*** toEurope).2 Reported capacity utilization fell from over *** percent in 2002 and 2003 to slightly over ***percent in 2004 and January-September 2005. Del Oro indicated in a cover letter to the submitted datathat it made a “***” in processing capacity in 2003.
Table E-1Orange juice (nonsubject production in Costa Rica): Del Oro production capacity, production,shipments, and inventories, 2002-04, January-September 2004 and 2005, and projected 2005-06
* * * * * * *
DATA SUBMITTED ON THE ORANGE JUICE INDUSTRY IN MEXICO
Citrofrut S.A. de C.V. (“Citrofrut”) and Procimart S.A. de C.V. (“Procimart”) returnedquestionnaires on their operations in Mexico.3 The below tabulation presents production, on a firm basis,for Citrofrut and Procimart, as well as industry-wide figures for Mexico compiled by PSD Online(previously presented in SSE gallons in tables I-10 and I-11):
SourceTime period1
2002 2003 2004 2005Production quantity (1,000 pounds solids equivalent)
Citrofrut *** *** *** ***Procimart *** *** *** *** Total *** *** *** ***PSD Online 46,453 10,930 27,461 101,240
PercentCoverage *** *** *** *** 1 The following time periods are used for Citrofrut and Procimart: full year 2002, full year 2003, full year 2004,and January-September 2005 (a period which appears to be equivalent to a crop year). The data for PSD Online isfor crop years 2001/02 through 2004/05 (crop/market year period was November-October).
Note.–SSE gallons were converted to pounds solid equivalent using the conversion factor: pound solid equivalent(PSE) = 1.029 gallons.
Data submitted by Citrofrut indicate that the firm accounted for the *** of orange juice production inMexico ***.

4 Procimart’s foreign producer questionnaire response. The firm produces only nonorganic FCOJM. (***.) Ibid. 5 Data for the entire industry (table I-11) likewise shows that home market consumption of orange juice inMexico is much lower than country exports. 6 Procimart’s foreign producer questionnaire response.
E-4
Combined data for Citrofrut and Procimart on their capacity, production, and shipments of orangejuice are shown in table E-2. Capacity to process orange juice increased by *** percent from 2002 to2004 and then was *** from January-September 2004 to January-September 2005. Procimart began processing oranges in 2004 when it installed *** pounds solids equivalent of capacity.4 Combinedorange juice production for the two firms fell from 2002 to 2003 and then increased in 2004 and 2005. Production was at *** capacity in 2002 and January-September 2005 but was *** lower in 2003 and2004. Citrofrut and Procimart reported a combined capacity utilization figure of *** percent in January-September 2005 (table E-2).
Table E-2Certain orange juice (nonsubject production in Mexico): Production capacity, production,shipments, and inventories, 2002-04, January-September 2004 and 2005
* * * * * * *
The *** of the orange juice processed by the reporting firms is exported (table E-2);5 the *** arethe predominant export destinations. The unit values of exports to the United States were generally ***than those to other export markets during 2002-04, and *** than exports to the European Union and Asiaduring the January-September 2005 period.
*** projected operations in 2005 and 2006 are shown in the following tabulation:
* * * * * * *
As shown, *** producing less orange juice in 2006 than in 2005 resulting in a *** in capacity utilization. ***.6