Embed Size (px)
Citation preview

JOURNAL OF FINANCIAL AND QUANTITATIVE ANALYSIS Vol. 48, No. 1, Feb. 2013, pp. 137–164COPYRIGHT 2013, MICHAEL G. FOSTER SCHOOL OF BUSINESS, UNIVERSITY OF WASHINGTON, SEATTLE, WA 98195doi:10.1017/S0022109013000069
CEO Overconfidence and International Mergerand Acquisition Activity
Stephen P. Ferris, Narayanan Jayaraman, and Sanjiv Sabherwal∗
Abstract
This study examines the role that chief executive officer (CEO) overconfidence plays in anexplanation of international mergers and acquisitions during the period 2000–2006. Usinga sample of CEOs of Fortune Global 500 firms over our sample period, we find that CEOoverconfidence is related to a number of critical aspects of international merger activity.Overconfidence helps to explain the number of offers made by a CEO, the frequencies ofnondiversifying and diversifying acquisitions, and the use of cash to finance a merger deal.Although overconfidence is an international phenomenon, it is most extensively observedin individuals heading firms headquartered in Christian countries that encourage individu-alism while de-emphasizing long-term orientation in their national cultures.
I. Introduction
Although the causes and performance of mergers have been extensively ex-amined in the literature, few studies focus on the overconfidence of chief execu-tive officers (CEOs) and managers as a factor in explaining merger activity.1 Roll(1986) is the first to recognize the influence that individual CEO decision makingmight have on the decision to engage in merger activity with his hubris hypoth-esis. Roll argues that CEOs make relatively few mergers over their careers andhence are unable to learn from past errors. These CEOs are convinced that theirvaluation estimates of targets are correct.
∗Ferris, [email protected], Trulaske College of Business, University of Missouri, 404F CornellHall, Columbia, MO 65211; Jayaraman, [email protected], Scheller College ofBusiness, Georgia Institute of Technology, 800 W Peachtree NW, Atlanta, GA 30308; and Sabherwal,[email protected], College of Business, University of Texas at Arlington, Box 19449, Arlington, TX76019. We thank seminar participants at Georgia Institute of Technology, Louisiana State University,and Concordia University for helpful comments. We also thank the discussants at the 2010 FinancialManagement Association (FMA) and FMA Europe conferences. We are particularly grateful for theuseful comments by Clifford Li and Jerry Thursby of Georgia Tech, Paul Malatesta (the editor), andan anonymous referee.
1Among the many empirical studies that examine mergers are Asquith, Bruner, and Mullins(1983), Jensen and Ruback (1983), Bradley, Desai, and Kim (1988), Franks, Harris, and Titman(1991), Agrawal, Jaffe, and Mandelker (1992), Loughran and Vijh (1997), Rau and Vermaelen (1998),Bruner (2002), Fuller, Netter, and Stegemoller (2002), and Bouwman, Fuller, and Nain (2009).
137

138 Journal of Financial and Quantitative Analysis
Doukas and Petmezas (2007) argue that managerial overconfidence resultsfrom a self-attribution bias. Specifically, overconfident CEOs feel that the have su-perior decision-making abilities and are more capable than their peers. The pres-ence of these cognitive biases encourages CEOs to emphasize their own judgmentin decision making and to engage in highly complex transactions such as diver-sifying acquisitions. Because of their overconfidence, these CEOs tend to under-estimate the risks associated with a merger or overestimate the possible synergygains from a business combination.
Malmendier and Tate (2008) examine the extent to which overconfidencecan help to explain merger decisions and various characteristics of the deal itself.They find that overconfident CEOs are more likely to pursue acquisitions whentheir firms have abundant internal resources. They further report that overconfi-dent CEOs are significantly more likely than other CEOs to undertake a diversi-fying merger. Finally, they observe that overconfident CEOs use cash to financetheir mergers more often than other CEOs.
The literature, however, does not investigate the effect of this overconfidenceon international merger and acquisition activity. Indeed, with the exception ofDoukas and Petmezas (2007), existing studies only examine overconfidence inthe context of U.S. mergers and ignore its international characteristics.2 Becausemanagerial overconfidence is shaped in part by national cultures, we expect thatthe dispersion of overconfidence among CEOs will vary across the globe.3 Asnoted by La Porta, Lopez-de-Silanes, Shleifer, and Vishny (1998), (1999), (2000),Stulz and Williamson (2003), Doidge, Karolyi, and Stulz (2007), and Griffin, Lai,Yue, and Zhao (2009), national culture involves dimensions such as language,religion, and legal heritage. These factors can be expected to influence the ex-tent to which overconfidence affects managerial decision making. Consequently,national cultures are likely to be important for an understanding of how overcon-fidence is related to global merger activity.
In this study, we ask two fundamental research questions concerning over-confidence and international merger activity. The 1st question focuses on whethercountry or country group patterns exist in the distribution of CEO overconfidence.Comparable legal systems and national cultures or shared standards of businesspractices might produce similarities in managerial decision making as we exam-ine our sample of international mergers.
Our 2nd question investigates whether the results reported by Malmendierand Tate (2008) regarding U.S. mergers by overconfident managers hold interna-tionally and focuses on how overconfident managers conduct their mergers. Dooverconfident CEOs make more acquisition offers than their less confident coun-terparts? Do overconfident CEOs acquire targets that are more frequently outsideof their firm’s core business than other CEOs? Do overconfident CEOs finance
2The study by Doukas and Petmezas (2007) does investigate overconfidence among U.K. exec-utives. But the United Kingdom is another common law country, and the targets in their sample arelimited to private companies.
3Graham, Harvey, and Puri (2009) find that important behavioral characteristics such as optimismand patience differ significantly between U.S. and non-U.S. executives. These traits are importantdeterminants of corporate decision making and imply an important reason why overconfidence islikely to vary globally.

Ferris, Jayaraman, and Sabherwal 139
their acquisitions differently from other CEOs? Given significant internationaldifferences in the regulation of corporate merger activity and the availability ofcapital to support acquisitions, it is uncertain whether the results reported for theUnited States apply to the broader set of global mergers.
For a sample of mergers involving the Fortune Global 500 firms over the pe-riod 2000–2006, we document a number of demographic and country patterns inthe global distribution of overconfident CEOs. We determine that overconfidenceis most commonly observed in CEOs leading firms headquartered in Christiancountries. We also find that the Hofstede (1980), (2001) measures of nationalculture help to explain geographical patterns in the dispersion of overconfidentCEOs. Specifically, we discover that individualism positively influences the like-lihood that a CEO will be overconfident. CEOs operating in countries whosecultures emphasize a long-term orientation tend to be less overconfident. We con-clude that CEO overconfidence is an international phenomenon, although thereare distinct patterns in its global distribution.
This study also shows that overconfidence is related to different aspects ofmerger activity. We find that overconfidence is an important factor in explainingthe number of offers made by a CEO. This result is robust even after controllingfor firm size, the availability of internal resources, the firm’s investment opportu-nities, and total press mentions about the CEO. We confirm that overconfidence isa significant influence in the decision by CEOs to acquire an unrelated target, andthis appears to be a global phenomenon. We also determine that overconfidence’srole in selecting the deal’s financing method is robust and holds for both U.S.and international mergers. Specifically, we find that overconfident CEOs prefercash for acquiring a target because of their general belief that their firm’s equityis undervalued.
We organize the remainder of this study into 6 sections. Section II describesour data collection and the method of sample construction. We also discuss ourprocess for measuring overconfidence in this section. We present our findings re-garding international patterns in CEO overconfidence in Section III. Section IVcontains our analysis of the international determinants of overconfidence. The ef-fect of overconfidence on the number of offers, type of merger, and the methodof financing is discussed in Section V. In this section, we also examine possiblebidirectionality in the relation between press characterizations and merger activ-ity. In Section VI, we examine the extent to which country-level factors mightinfluence the nature of merger and acquisition decisions by overconfident CEOs.Section VII provides a brief summary of our findings and a discussion of theirimportance to the literature.
II. Data and the Measurement of Overconfidence
A. Data and Sample Construction
Fortune magazine provides an annual ranking of the 500 largest companiesin the world based on revenues. We begin our sample selection by compiling theselists during 2000–2006. We select all nonfinancial firms that appear at least once

140 Journal of Financial and Quantitative Analysis
in these lists. We exclude state-owned enterprises. We also identify the country inwhich our sample firm is headquartered.
For each firm in our data set, we include all of the firm’s CEOs during 2000–2006. For the 2004–2006 sample period, the Fortune lists also include the nameand gender of the CEO. During the years when a sample firm is not on the FortuneGlobal 500 list or is included during 2000–2003, when CEO information was notpresented, the names of the CEOs are hand-collected. We also hand-collect thedate of birth, birthplace, nationality, gender, education, and tenure with a firm foreach CEO in our sample.
We search an identical set of databases for each CEO. These data sourcesconsist of Mergent Online, the individual firm’s Web site, the firm’s financialstatements, and 8 other Web sites.4 We compute the age of a CEO as of 2006.We consider a CEO to have obtained a college education if he has completed anundergraduate degree. We classify a CEO as holding a graduate degree if he hasa law degree, an MBA, or a PhD.
The legal regimes for countries are obtained from the classification reportedin La Porta et al. (1998). Primary religions and languages of countries are drawnfrom Stulz and Williamson (2003). The dimensions of a country’s culture arethose created by Hofstede (1980), (2001). We consider a country to rank high(low) on a particular dimension of culture if it has a Hofstede (1980), (2001)score above (below) the median score for all the countries on that dimension.
We obtain accounting data from Compustat Global and Compustat NorthAmerica databases. We measure the size of a firm as the log of assets at the begin-ning of the year. We measure Tobin’s Q as the market value of assets over bookvalue of assets at the beginning of the year and cash flow as earnings before ex-traordinary items plus depreciation normalized by capital at the beginning of theyear.
We convert accounting data other than ratios to US$ using exchange ratesobtained from the Compustat Global database. Items measured at a specific time,such as assets, are converted from local currency to US$ based on the exchangerate at that time. Items measured over a year, such as sales, are converted to US$based on the 12-month average exchange rate over that year.
We use the Securities Data Company merger database to obtain announce-ment dates and merger financing information for completed deals by our samplefirms. Following Malmendier and Tate (2008), we require that the acquiring firmobtain a control (at least 51%) of the target shares and omit acquisitions in whichthe acquirer already holds at least 51% of the target before the deal. Furthermore,following Morck, Shleifer, and Vishny (1990), we omit acquisitions worth lessthan 5% of acquirer value. As in Malmendier and Tate (2008), we consider anacquisition as related if the target and the acquirer share the same Fama-French(1997) 48 industry group. We differentiate offers based on financing used (offersin which only cash is used to finance the acquisition versus other offers in whichsome debt or equity is used).
4We use a variety of Web sites to obtain the biographical data for our sample. Includedamong these are http://people.forbes.com, http://www.chinavitae.com/biography, and http://global.factiva.com

Ferris, Jayaraman, and Sabherwal 141
B. Measuring Overconfidence
Malmendier and Tate (2008) use the propensity of managers of the acquiringfirms to hold in-the-money equity options as their primary measure of manage-rial overconfidence. Unfortunately, such option holding data are not available forinternational CEOs. Thus, a comparable measure of overconfidence cannot beconstructed for our sample. But Malmendier and Tate (2005) also estimate anoverconfidence measure based on press releases that we can calculate for our setof global firms. That is, the descriptions of CEOs as contained in public news ar-ticles can be used to measure their overconfidence. Malmendier and Tate (2005)observe that this proxy provides direct insight into the type of person classified asoverconfident, and its strength is its ability to measure CEO beliefs as assessed byoutsiders.
To construct this press-based measure of overconfidence, we use global newssources contained in the Factiva database. Thus, we limit our analysis to globalwires (i.e., Dow Jones, PR, and Reuters) and global business publications(i.e., The Wall Street Journal (North American, European, and Asian editions),Financial Times, and the Economist). Our use of only global news sources helpsto eliminate any bias in the nature and extent of coverage that might occur withlocal media.
For each CEO of a firm, we record the number of articles related to the firmin Factiva during 2000–2006 that refer to the CEO using the terms (a) “confi-dent” or “confidence,” (b) “optimistic” or “optimism,” (c) “not confident,” (d) “notoptimistic,” or (e) “reliable,” “cautious,” “conservative,” “practical,” “frugal,” or“steady.” We then compare the number of articles that portray a CEO as confi-dent and optimistic to the number of articles that portray him as not confident, notoptimistic, reliable, cautious, conservative, practical, frugal, or steady. That is,we classify a CEO as overconfident if a + b > c + d + e. We do not classify aCEO with respect to overconfidence if we fail to find any articles that mentionthe CEO.
III. International Patterns in CEO Overconfidence
In this section, we explore the nature of CEO overconfidence and how itvaries internationally. Previous studies such as Malmendier and Tate (2005),(2008) and Campbell, Gallmeyer, Johnson, Rutherford, and Stanley (2011) ex-amine overconfidence only among the CEOs of U.S. firms. Thus, they are unableto investigate how overconfidence differs across various national cultures. YetStulz and Williamson (2003) show that national culture, as proxied by religionand language, influences the level of protection available to investors and, byimplication, the extent to which a CEO can exert influence and power. Earlierstudies such as Miller and Hoffman (1995), Diaz (2000), Halek and Eisenhauer(2001), and Osoba (2003) report an inverse relation between religiosity and indi-vidual risk tolerance. Hilary and Hui (2009) confirm this result and find that firmslocated in U.S. counties with high levels of religious participation have lowerrates of investment in both tangible and intangible assets. These findings suggestthat differences in national cultures can exert important influences on individual
142 Journal of Financial and Quantitative Analysis
behavior. Consequently, national culture has the potential to affect the global dis-tribution of overconfidence and how such overconfidence might be exhibited incorporate behaviors.
A. Sample and Data Characteristics
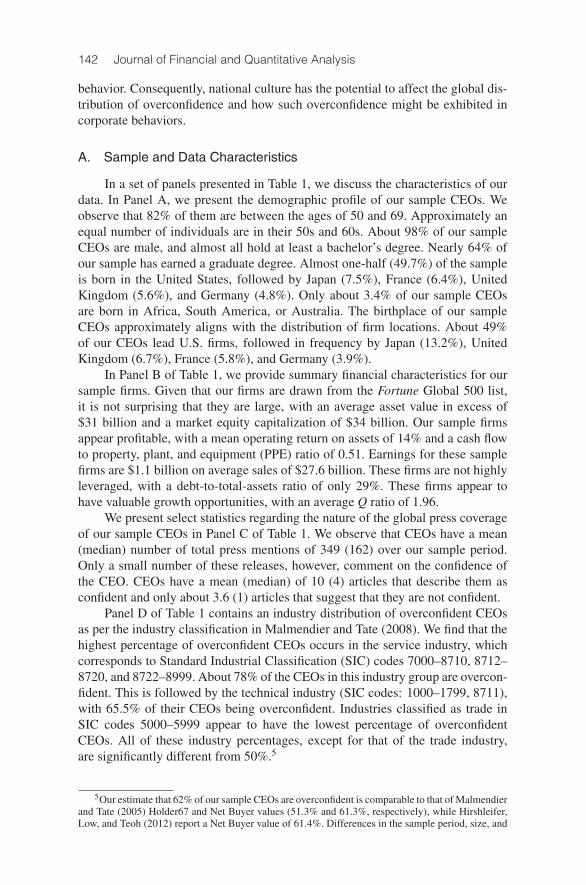
In a set of panels presented in Table 1, we discuss the characteristics of ourdata. In Panel A, we present the demographic profile of our sample CEOs. Weobserve that 82% of them are between the ages of 50 and 69. Approximately anequal number of individuals are in their 50s and 60s. About 98% of our sampleCEOs are male, and almost all hold at least a bachelor’s degree. Nearly 64% ofour sample has earned a graduate degree. Almost one-half (49.7%) of the sampleis born in the United States, followed by Japan (7.5%), France (6.4%), UnitedKingdom (5.6%), and Germany (4.8%). Only about 3.4% of our sample CEOsare born in Africa, South America, or Australia. The birthplace of our sampleCEOs approximately aligns with the distribution of firm locations. About 49%of our CEOs lead U.S. firms, followed in frequency by Japan (13.2%), UnitedKingdom (6.7%), France (5.8%), and Germany (3.9%).
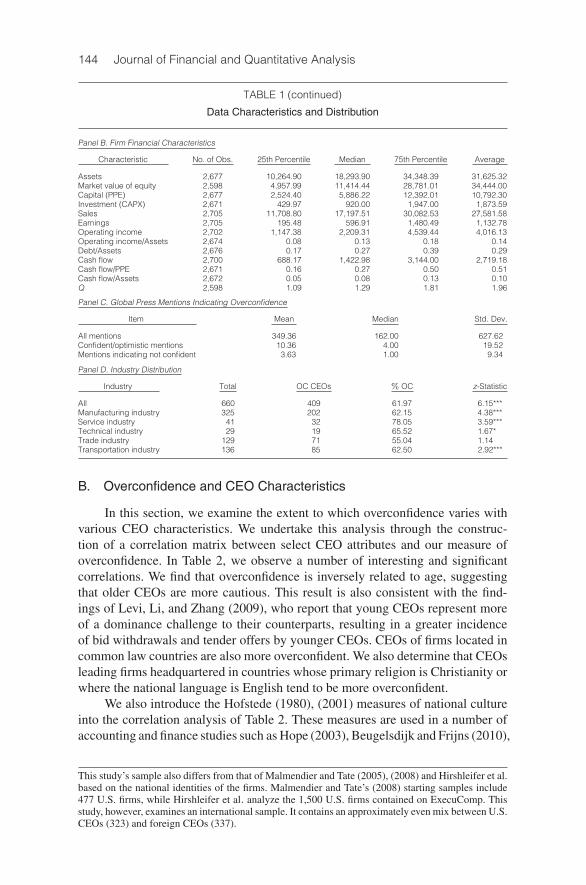
In Panel B of Table 1, we provide summary financial characteristics for oursample firms. Given that our firms are drawn from the Fortune Global 500 list,it is not surprising that they are large, with an average asset value in excess of$31 billion and a market equity capitalization of $34 billion. Our sample firmsappear profitable, with a mean operating return on assets of 14% and a cash flowto property, plant, and equipment (PPE) ratio of 0.51. Earnings for these samplefirms are $1.1 billion on average sales of $27.6 billion. These firms are not highlyleveraged, with a debt-to-total-assets ratio of only 29%. These firms appear tohave valuable growth opportunities, with an average Q ratio of 1.96.
We present select statistics regarding the nature of the global press coverageof our sample CEOs in Panel C of Table 1. We observe that CEOs have a mean(median) number of total press mentions of 349 (162) over our sample period.Only a small number of these releases, however, comment on the confidence ofthe CEO. CEOs have a mean (median) of 10 (4) articles that describe them asconfident and only about 3.6 (1) articles that suggest that they are not confident.
Panel D of Table 1 contains an industry distribution of overconfident CEOsas per the industry classification in Malmendier and Tate (2008). We find that thehighest percentage of overconfident CEOs occurs in the service industry, whichcorresponds to Standard Industrial Classification (SIC) codes 7000–8710, 8712–8720, and 8722–8999. About 78% of the CEOs in this industry group are overcon-fident. This is followed by the technical industry (SIC codes: 1000–1799, 8711),with 65.5% of their CEOs being overconfident. Industries classified as trade inSIC codes 5000–5999 appear to have the lowest percentage of overconfidentCEOs. All of these industry percentages, except for that of the trade industry,are significantly different from 50%.5
5Our estimate that 62% of our sample CEOs are overconfident is comparable to that of Malmendierand Tate (2005) Holder67 and Net Buyer values (51.3% and 61.3%, respectively), while Hirshleifer,Low, and Teoh (2012) report a Net Buyer value of 61.4%. Differences in the sample period, size, and

Ferris, Jayaraman, and Sabherwal 143
TABLE 1
Data Characteristics and Distribution
In Table 1, firms are drawn from the Fortune Global 500 lists that appear during 2000–2006. Corresponding data years are1999–2005. In Panel B, the numbers are based on all firm-year observations. All values other than ratios are in millions ofUS$. Items measured at a point in time, such as assets, are converted from local currency to US$ based on the exchangerate at that time. Items measured over a year, such as sales, are converted from local currency to US$ based on the12-month average exchange rate over that year. Earnings refer to earnings before extraordinary items. The z-statistics inPanel D are 2-tailed for the test that the proportion of overconfident CEOs is 1/2. ***, **, and * indicate 2-tailed significanceat the 1%, 5%, and 10% levels, respectively.
Panel A. CEO Demographics
Item Number Percent
Age 636 100.0030–39 1 0.1640–49 59 9.2850–59 236 37.1160–69 285 44.8170–79 51 8.0280 and above 4 0.63
Gender 660 100.00Male 647 98.03Female 13 1.97
Education 566 100.00No / some college 8 1.41Bachelor 197 34.81Master 242 42.76PhD 67 11.84Law degree 52 9.19
Birthplace 626 100.00Africa 7 1.12Japan 47 7.51Asia excluding Japan 48 7.67Australia 7 1.12France 40 6.39Germany 30 4.79United Kingdom 35 5.59Rest of Europe 76 12.14United States 311 49.68N. America excluding United States 18 2.88South America 7 1.12
Firm Location 660 100.00Africa 0 0.00Japan 87 13.18Asia excluding Japan 41 6.21Australia 8 1.21France 38 5.76Germany 26 3.94United Kingdom 44 6.67Rest of Europe 74 11.21United States 323 48.94N. America excluding United States 17 2.58South America 2 0.30
(continued on next page)
nationality of our sample firms are likely to explain whatever variances exist between our estimate ofoverconfident CEOs and those in the above studies. Malmendier and Tate (2008) examine overcon-fidence between 1980 and 1994, which provides no overlap with our study. Hirshleifer et al. studythe years between 1993 and 2003, providing only a partial overlap of 4 years. Our sample consistsof much larger firms than those studied by either Malmendier and Tate (2005), (2008) or Hirshleiferet al. (2012). Malmendier and Tate (2008) examine firms whose average total assets are less than$6 billion, compared to our set of international firms, whose mean size is over 5 times as large, ata value of $31.6 billion. Our sample also differs significantly from that of Hirshleifer et al. in termsof size. The mean level of sales for our sample firms is $27.6 billion, compared to only $4.0 billionfor firms in the Hirshleifer et al. sample. The importance of the size difference across samples is rel-evant, since previous work shows that firm size is an important determinant of CEO salary (Gabaixand Landier (2008)). Researchers such as Hayward and Hambrick (1997), Paredes (2005), and othersfurther demonstrate that CEO salary is an important determinant of subsequent CEO overconfidence.
144 Journal of Financial and Quantitative Analysis
TABLE 1 (continued)
Data Characteristics and Distribution
Panel B. Firm Financial Characteristics
Characteristic No. of Obs. 25th Percentile Median 75th Percentile Average
Assets 2,677 10,264.90 18,293.90 34,348.39 31,625.32Market value of equity 2,598 4,957.99 11,414.44 28,781.01 34,444.00Capital (PPE) 2,677 2,524.40 5,886.22 12,392.01 10,792.30Investment (CAPX) 2,671 429.97 920.00 1,947.00 1,873.59Sales 2,705 11,708.80 17,197.51 30,082.53 27,581.58Earnings 2,705 195.48 596.91 1,480.49 1,132.78Operating income 2,702 1,147.38 2,209.31 4,539.44 4,016.13Operating income/Assets 2,674 0.08 0.13 0.18 0.14Debt/Assets 2,676 0.17 0.27 0.39 0.29Cash flow 2,700 688.17 1,422.98 3,144.00 2,719.18Cash flow/PPE 2,671 0.16 0.27 0.50 0.51Cash flow/Assets 2,672 0.05 0.08 0.13 0.10Q 2,598 1.09 1.29 1.81 1.96
Panel C. Global Press Mentions Indicating Overconfidence
Item Mean Median Std. Dev.
All mentions 349.36 162.00 627.62Confident/optimistic mentions 10.36 4.00 19.52Mentions indicating not confident 3.63 1.00 9.34
Panel D. Industry Distribution
Industry Total OC CEOs % OC z-Statistic
All 660 409 61.97 6.15***Manufacturing industry 325 202 62.15 4.38***Service industry 41 32 78.05 3.59***Technical industry 29 19 65.52 1.67*Trade industry 129 71 55.04 1.14Transportation industry 136 85 62.50 2.92***
B. Overconfidence and CEO Characteristics
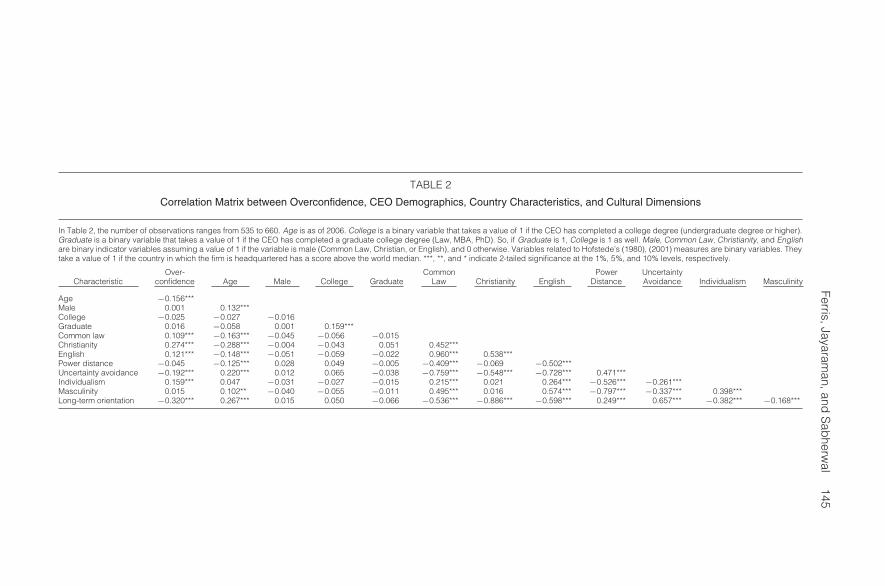
In this section, we examine the extent to which overconfidence varies withvarious CEO characteristics. We undertake this analysis through the construc-tion of a correlation matrix between select CEO attributes and our measure ofoverconfidence. In Table 2, we observe a number of interesting and significantcorrelations. We find that overconfidence is inversely related to age, suggestingthat older CEOs are more cautious. This result is also consistent with the find-ings of Levi, Li, and Zhang (2009), who report that young CEOs represent moreof a dominance challenge to their counterparts, resulting in a greater incidenceof bid withdrawals and tender offers by younger CEOs. CEOs of firms located incommon law countries are also more overconfident. We also determine that CEOsleading firms headquartered in countries whose primary religion is Christianity orwhere the national language is English tend to be more overconfident.
We also introduce the Hofstede (1980), (2001) measures of national cultureinto the correlation analysis of Table 2. These measures are used in a number ofaccounting and finance studies such as Hope (2003), Beugelsdijk and Frijns (2010),
This study’s sample also differs from that of Malmendier and Tate (2005), (2008) and Hirshleifer et al.based on the national identities of the firms. Malmendier and Tate’s (2008) starting samples include477 U.S. firms, while Hirshleifer et al. analyze the 1,500 U.S. firms contained on ExecuComp. Thisstudy, however, examines an international sample. It contains an approximately even mix between U.S.CEOs (323) and foreign CEOs (337).
Ferris,Jayaraman,and
Sab
herwal
145
TABLE 2
Correlation Matrix between Overconfidence, CEO Demographics, Country Characteristics, and Cultural Dimensions
In Table 2, the number of observations ranges from 535 to 660. Age is as of 2006. College is a binary variable that takes a value of 1 if the CEO has completed a college degree (undergraduate degree or higher).Graduate is a binary variable that takes a value of 1 if the CEO has completed a graduate college degree (Law, MBA, PhD). So, if Graduate is 1, College is 1 as well. Male, Common Law, Christianity, and Englishare binary indicator variables assuming a value of 1 if the variable is male (Common Law, Christian, or English), and 0 otherwise. Variables related to Hofstede’s (1980), (2001) measures are binary variables. Theytake a value of 1 if the country in which the firm is headquartered has a score above the world median. ***, **, and * indicate 2-tailed significance at the 1%, 5%, and 10% levels, respectively.
Over- Common Power UncertaintyCharacteristic confidence Age Male College Graduate Law Christianity English Distance Avoidance Individualism Masculinity
Age −0.156***Male 0.001 0.132***College −0.025 −0.027 −0.016Graduate 0.016 −0.058 0.001 0.159***Common law 0.109*** −0.163*** −0.045 −0.056 −0.015Christianity 0.274*** −0.288*** −0.004 −0.043 0.051 0.452***English 0.121*** −0.148*** −0.051 −0.059 −0.022 0.960*** 0.538***Power distance −0.045 −0.125*** 0.028 0.049 −0.005 −0.409*** −0.069 −0.502***Uncertainty avoidance −0.192*** 0.220*** 0.012 0.065 −0.038 −0.759*** −0.548*** −0.728*** 0.471***Individualism 0.159*** 0.047 −0.031 −0.027 −0.015 0.215*** 0.021 0.264*** −0.526*** −0.261***Masculinity 0.015 0.102** −0.040 −0.055 −0.011 0.495*** 0.016 0.574*** −0.797*** −0.337*** 0.398***Long-term orientation −0.320*** 0.267*** 0.015 0.050 −0.066 −0.536*** −0.886*** −0.598*** 0.249*** 0.657*** −0.382*** −0.168***

146 Journal of Financial and Quantitative Analysis
and Chui, Titman, and Wei (2010) since their creation by Hofstede in 1980. Thesemeasures consist of 5 different dimensions of a country’s culture. The powerdistance index captures the extent to which less powerful members of organi-zations and institutions within a country both accept and expect that power isdistributed unequally. Individualism measures the extent to which individuals areintegrated into groups within a country. Masculinity refers to the distribution ofroles between genders. Uncertainty avoidance addresses a society’s tolerance foruncertainty and ambiguity. It indicates the extent to which that country’s cultureprograms its members to feel comfortable or not in unstructured situations. Thelast of the Hofstede (1980), (2001) dimensions is long-term orientation and fo-cuses on the relative importance of thrift, perseverance, tradition, and satisfactionof social obligations. We more fully describe these Hofstede (1980), (2001) cul-tural dimensions in the Appendix.
We find that power distance, uncertainty avoidance, and long-term orienta-tion are inversely related to overconfidence, but only the latter two are statisticallysignificant. Not surprisingly, individualism and masculinity are positively corre-lated with overconfidence. The correlation coefficient for masculinity, however,is statistically insignificant.
C. Global Distribution of CEO Overconfidence
Nationality is traditionally based on the country of the CEO’s birth. Alter-natively, nationality can be defined from an “assimilated” perspective based onthe country in which the firm is headquartered. This definition argues that the at-tributes and perspectives associated with a nationally can be assimilated throughexposure and living experiences with a given nationality. It reflects the idea that aCEO’s cultural beliefs, behaviors, and perspectives will be determined by those ofthe country in which his firm is headquartered and consequently where he spendsthe majority of professional time. We find a high correlation in all of our findingsbetween the traditional and assimilation measures of nationality, with no mean-ingful difference in interpretations between the two. We elect to report the resultsin this study only for the assimilated measure of nationality.
We now more closely examine the nature of CEO overconfidence as it isexhibited globally. In Panel A of Table 3, we find the highest percentage of over-confident CEOs to be in Australia (100%), followed by Germany (88.5%). Butthe number of sample firms in Australia is small; therefore, we can infer rela-tively little from this result. After Germany, two other Western European coun-tries have a high percentage of overconfident CEOs: France, at 84.2%, and theUnited Kingdom, at 81.8%. Over 71% of the remaining European CEOs are clas-sified as overconfident, which exceeds the 63.5% estimated for U.S. CEOs. Thelowest percentage of overconfident CEOs occurs in Japan, with 29.9%, followedby the rest of Asia at 31.7%.
Given work by Stulz and Williamson (2003), Griffin et al. (2009), and Hilaryand Hui (2009) on the impact of national cultural attributes on corporate decisionmaking, we examine how national legal regime, primary religion, and officiallanguage might influence a CEO’s overconfidence. In Panel B of Table 3, we findthat CEOs tend to be overconfident regardless of legal regime, although there is a

Ferris, Jayaraman, and Sabherwal 147
TABLE 3
International Patterns of Overconfidence
In Table 3, OC refers to overconfident, and z-statistics are 2-tailed for the test that the proportion of OC CEOs is 1/2. InPanel C, a CEO of a firm is included in the high (low) group if the country of the firm’s headquarters has a Hofstede (1980),(2001) score above (below) the world median score for that measure. ***, **, and * indicate 2-tailed significance at the 1%,5%, and 10% levels, respectively.
Panel A. Overconfidence by CEO Nationality
Firm Location Total OC CEOs % OC z-Statistic
All 660 409 62.0 6.17***Japan 87 26 29.9 −3.75***Asia excluding Japan 41 13 31.7 −2.34**Australia 8 8 100.0 2.83***France 38 32 84.2 4.22***Germany 26 23 88.5 3.93***United Kingdom 44 36 81.8 4.22***Rest of Europe 74 53 71.6 3.72***United States 323 205 63.5 4.85***Canada 16 12 75.0 2.00**Brazil and Mexico 3 1 33.3 −0.58
Panel B. Overconfidence by Legal Origin, Religion, and Language
Dimension Total OC CEOs % OC z-Statistic
Legal OriginCivil law 255 141 55.3 1.69*Common law 405 268 66.2 6.52***
ReligionBuddhist 100 30 30.0 −4.00***Catholic 113 87 77.0 5.74***Christianity-other 2 1 50.0 0.00Hindu 9 5 55.6 0.34Protestant 436 286 65.6 6.51***
LanguageChinese 11 4 36.4 −0.90Dutch 19 16 84.2 2.98***English 392 262 66.8 6.65***Finnish 5 4 80.0 1.34French 38 32 84.2 4.22***German 38 33 86.8 4.54***Hindi 9 5 55.6 0.34Italian 14 10 71.4 1.60Japanese 87 26 29.9 −3.75***Korean 19 4 21.1 −2.52**Norwegian 4 3 75.0 1.00Portuguese 2 1 50.0 0.00Russian 2 1 50.0 0.00Spanish 11 5 45.5 −0.30Swedish 7 3 42.9 −0.38Thai 2 0 0.0 −1.41
Panel C. Overconfidence by Hofstede’s Cultural Dimensions
Hofstede’s Measure Total OC CEOs % OC z-Statistic
Power DistanceLow 563 352 62.5 5.93***High 97 55 56.7 1.32z-statistic to compare % OC 1.09
Uncertainty AvoidanceLow 482 326 67.6 7.73***High 178 83 46.6 −0.91z-statistic to compare % OC 4.93***
IndividualismLow 30 8 26.7 −2.55**High 630 401 63.7 6.88***z-statistic to compare % OC −4.08***
MasculinityLow 124 75 60.5 2.34**High 536 334 62.3 5.70***z-statistic to compare % OC −0.37
Long-Term OrientationLow 528 368 69.7 9.05***High 128 39 30.5 −4.41***z-statistic to compare % OC 8.20***

148 Journal of Financial and Quantitative Analysis
suggestion that CEOs of firms located in common law countries tend to be moreoverconfident than their civil law counterparts.
In the 2nd section of Panel B in Table 3, we examine the influence of themajor religion of the country in which the firm is headquartered. We find that CEOoverconfidence varies across national religions. CEOs of firms headquartered inCatholic and Protestant countries are significantly more overconfident than theircounterparts who lead companies headquartered in nations with Buddhism as themajor religion.
The final section of Panel B in Table 3 examines the influence of a coun-try’s primary language on CEO overconfidence. We observe that overconfidentCEOs are significantly more frequent in countries whose primary language isEnglish, Dutch, French, or German. Interestingly, the use of Korean or Japaneseas the primary language is negatively related to the percentage of CEOs classifiedas overconfident. This result is consistent with the results in Panel A containingthe geographical distribution of overconfidence. Due to small sample sizes, theother languages are not significantly related to a high percentage of overconfidentCEOs.
We examine the ability of national culture to influence CEO overconfidencein another way by analyzing the Hofstede (1980), (2001) cultural dimensions inPanel C of Table 3. We observe a high percentage of overconfident CEOs re-gardless of a country’s power distance or masculinity. We do find, however, thatthere are significant differences in the percentage of overconfident CEOs whenwe consider a country’s preference for uncertainty avoidance, individualism, andlong-term orientation. Countries that have a low preference for uncertainty avoid-ance have cultures that are more accepting of change and capable of taking onmore risk. We find that firms headquartered in such countries are more frequentlyled by overconfident CEOs. It might be that such individuals are more capable ofresponding to the rapid changes and dynamism of these cultures.
We further find that CEOs of firms headquartered in countries with a highlevel of individualism are significantly more overconfident than those in low-individualism countries. This is consistent with individualism’s focus on individ-ual freedom and personal challenge. As noted by Griffin et al. (2009), cultureswith a high degree of individualism emphasize independent action while encour-aging individual freedom and personal choice.
Finally, we observe that CEOs are more overconfident when they lead firmsheadquartered in countries characterized by a low level of long-term orientation.Such cultures are capable of more rapid change, and long-term traditions are lessof a barrier to innovation. Consequently, firms might believe that an overconfidentCEO with the ability to make quick decisions and remain committed provides thebest leadership in such an environment.
We conclude from Table 3 that there are significant differences in the nationalorigin of overconfident CEOs. Most typically, overconfident CEOs originate fromEurope and North America. Countries on these continents have English or otherEuropean languages as their official language and are Christian in their religiousheritage. Overconfident CEOs are also more likely to be found in firms headquar-tered in countries with a high level of individualism, a low level of uncertaintyavoidance, and a short-term orientation.

Ferris, Jayaraman, and Sabherwal 149
IV. International Determinants of Overconfidence
A number of factors can contribute to the presence of overconfidence in aCEO. In this section, we examine the influence of these factors on CEO over-confidence in a multivariate framework. In Table 4, we present the results fromlogistics regressions of overconfidence against independent variables drawn froma variety of demographic, national, cultural, and institutional variables. We usestandard errors clustered by country in these regressions. We also control for thetotal number of articles that mention a particular CEO in an effort to eliminate anyclassification bias resulting from differences in press coverage. We find that thetotal mentions variable is significant across all model specifications, indicatingthe importance of the level of press activity in shaping CEO overconfidence.
TABLE 4
Logistic Regressions of Overconfidence by CEO Demographics, Country Characteristics,and Cultural Dimensions
In Table 4, the dependent variable is CEO overconfidence. Age is as of 2006. College is a binary variable that takes a valueof 1 if the CEO has completed a college degree. Male, Common, Christianity, and English are binary variables assuminga value of 1 if the variable is male (common, Christian, or English). The 5 variables related to culture are binary variables.They take a value of 1 if the country of the firm location has a Hofstede (1980), (2001) score above the world median. Totalmentions is the total number of articles that mention the CEO. The regression coefficients reported for Total mentions aremultiplied by 100 to facilitate reporting. The z-statistics are in parentheses. ***, **, and * indicate 2-tailed significance atthe 1%, 5%, and 10% levels, respectively.
Model
Non-U.S.Independent Variable 1 2 3 4 5
No. of obs. 535 660 656 656 333
CEO DemographicsAge −0.02
(−1.21)
Male 0.24(0.39)
College −0.60(−0.68)
Firm DemographicsCommon 0.40
(0.75)
Christianity 0.96*** −0.03 0.06(2.66) (−0.07) (0.16)
English −0.24(−0.38)
Cultural DimensionsPower distance 0.70
(1.50)
Uncertainty avoidance −0.14(−0.63)
Individualism 1.00** 0.61 0.63(2.41) (1.27) (1.39)
Masculinity 0.25(0.63)
Long-term orientation −0.99*** −1.07*** −1.23***(−4.23) (−2.70) (−3.28)
Total mentions 0.42*** 0.45*** 0.52*** 0.53*** 0.43***(3.52) (3.80) (6.68) (6.56) (4.46)
Intercept 1.17 −1.39*** −1.62*** −0.94 −0.70(0.82) (−11.61) (−2.79) (−1.11) (−0.88)
In Model 1 of Table 4, we examine the explanatory power of various CEOdemographic characteristics. Barber and Odean (2001) report evidence of greater
150 Journal of Financial and Quantitative Analysis
overconfidence among male stock traders, and we find that being male is posi-tively associated with CEO overconfidence, although the coefficient is statisticallyinsignificant. We determine that both age and status as a college graduate are in-versely related to overconfidence, but neither is statistically significant.6 The uni-form statistical insignificance of these demographic variables suggests that CEOoverconfidence is shaped by factors other than the personal characteristics of theindividual.
Model 2 of Table 4 examines the role that various country characteristicsexert on the likelihood of CEO overconfidence. We observe that both a commonlaw legal heritage and Christianity as the primary religion positively influence thelikelihood that a CEO will be overconfident. But only Christianity as the majorreligion is statistically significant. The use of English as the official language hasno significant effect on the probability that a CEO is overconfident.
The influence of Hofstede’s (1980), (2001) 5 cultural dimensions is exam-ined with Model 3. We find that power distance, masculinity, and individualismpositively influence the likelihood that a CEO will be overconfident. Individu-alism is statistically significant, while masculinity and power distance are not.Uncertainty avoidance and long-term orientation are inversely related to CEOoverconfidence, but only long-term orientation is statistically significant. CEOsoperating in countries whose cultures emphasize a long-term orientation and thusare more constrained by traditions tend to have less overconfident CEOs.
In Models 4 and 5 of Table 4, we estimate combined specifications, usingthe significant variables identified in the previous 3 models. We find in Model 4that only long-term orientation is statistically significant when we simultaneouslyconsider CEO demographic, country characteristic, and cultural dimension vari-ables. Model 5 is estimated using all of the independent variables, but restricted tonon-U.S. firms. We find virtually identical results to those obtained for Model 4.We conclude that the effect of long-term orientation on CEO overconfidence isnot simply a U.S. phenomenon, but applies globally.
V. The Nature of International Merger Activity
In this section, we explore the extent to which overconfident CEOs can influ-ence a number of important dimensions of international merger activity. Specifi-cally, we examine the extent to which the findings of Malmendier and Tate (2008)concerning the number of merger offers, the incidence of diversifying versus re-lated mergers, and the method of deal financing by overconfident CEOs hold fornon-U.S. firms.
A. Number of Merger Offers
In Table 5, we provide a multivariate analysis of the relation between over-confidence and the number of merger offers made by a CEO. We estimate Poissonregressions, since the dependent variable is measured as a count. We regress the
6Graham et al. (2009) imply an explanation for the inverse relation between overconfidence anda college degree, noting that it might indicate conservatism, as those impatient with their ambitionmight decide that higher education, especially a graduate degree, is not necessary.

Ferris, Jayaraman, and Sabherwal 151
TABLE 5
Poisson Regressions of the Number of Offers per CEO
In Table 5, Poisson regressions are estimated, since the dependent variable is a count of the number of offers made perCEO. Size is measured as the log of assets. Q is the market value of assets over book value of assets. Cash flow is earningsbefore extraordinary items plus depreciation, normalized by capital. US dummy is a binary variable with a value of 1 forCEOs of American firms. Total mentions is the total number of articles that mention the CEO. The regression coefficientsreported for Total mentions are multiplied by 100 to facilitate reporting. Models 1–3 are estimated for the entire sampleand Model 4 is estimated for non-U.S. firms only. In Panel B, the number of offers in 2004–2006 is regressed againstoverconfidence estimated during 2000–2003. Prior offers is the number of offers during 2000–2003. The z-statistics are inparentheses. ***, **, and * indicate 2-tailed significance at the 1%, 5%, and 10% levels, respectively.
Model
Non-U.S.Independent Variable 1 2 3 4
Panel A. Overconfidence Estimated during 2000–2006
No. of obs. 660 660 660 337
Overconfidence 0.55*** 0.39*** 0.37*** 0.47***(4.17) (3.39) (3.36) (2.61)
Size 0.48*** 0.50*** 0.24*(3.42) (3.94) (1.92)
Q 0.01 0.01 0.00(1.06) (1.17) (1.31)
Cash flow 0.12*** 0.11*** 0.35*(3.06) (2.95) (1.68)
US dummy 0.39**(2.38)
Total mentions 0.03*** 0.02*** 0.02*** 0.03***(4.58) (4.84) (4.37) (3.02)
Intercept 0.74*** −4.04*** −4.45*** −2.00(7.99) (−2.87) (−3.34) (−1.52)
Panel B. Overconfidence Estimated during 2000–2003
No. of obs. 623 623 623 317
Overconfidence 0.57*** 0.52*** 0.52*** 0.71***(3.80) (3.47) (3.43) (3.03)
Size 0.17* 0.17* 0.21*(1.76) (1.72) (1.70)
Q 0.02** 0.02** 0.01***(2.22) (2.21) (3.40)
Cash flow 0.07 0.07 0.48**(1.48) (1.48) (2.37)
US dummy 0.01(0.07)
Total mentions 0.01 0.01 0.01 −0.01**(0.56) (0.31) (0.31) (−2.42)
Prior offers 0.06*** 0.05*** 0.05*** 0.11***(14.30) (7.89) (7.45) (7.11)
Intercept −0.33*** −2.08** −2.10** −2.80**(−2.89) (−2.16) (−2.07) (−2.19)
number of merger offers per CEO against CEO overconfidence and a set of con-trol variables. We include the logarithm of assets as a control for firm size, whilethe market-to-book ratio of asset value is a control for the firm’s investment op-portunities. Cash flow is a measure of internal resources available to the CEO tofinance the acquisition. We also include a binary indicator variable to control forstatus as a U.S. firm or otherwise. Again, the number of total press mentions isincluded as a control variable in all of the models. Following Petersen (2009),we use standard errors clustered by firm in all our regressions related to mergeractivity.

152 Journal of Financial and Quantitative Analysis
Panel A of Table 5 contains our multivariate estimates for 4 different modelspecifications. In Model 1, we estimate the regression between the number ofoffers and an indicator variable for CEO overconfidence. We obtain a statisti-cally significant coefficient for overconfidence, indicating that these CEOs tendto extend more offers than nonoverconfident CEOs. In Model 2, we introduce allcontrol variables except the U.S. indicator variable, since this specification teststhe aggregate sample without consideration of the location of a firm’s headquar-ters. Again, we find that overconfidence is positively and significantly related tothe number of merger offers made by a CEO. We also find that firm size andcash flow are significantly positive influences on the offer behavior of CEOs. Thefirm’s investment opportunities, proxied by Q, is also positive but statistically in-significant. In Model 3, we introduce the U.S. indicator variable. We obtain statis-tical significance for overconfidence as well as firm size, cash flow, and the U.S.indicator variable. We eliminate all U.S. firms from the estimation of Model 4.We continue to observe that overconfidence is statistically significant. The otherindependent variables in Model 4 are generally statistically significant.
We conclude from Panel A of Table 5 that overconfidence is an importantfactor in explaining the number of offers made by a CEO. This result is robustto controlling for firm size, the availability of internal resources, total number ofpress mentions, and the firm’s investment opportunities. Of even greater interestis our finding that this result is not limited to U.S. firms but is an internationalphenomenon.
It is possible that the press writes more frequently about CEOs and firms thatconduct mergers. Likewise, reporters might infer confidence or optimism fromdramatic decisions made by a CEO such as a merger or an acquisition. To morefully test our hypothesis that it is CEO overconfidence that affects merger activity,we reestimate our measure of CEO overconfidence using press characterizationsthat predate any merger activity.
We construct this new overconfidence measure by dividing our sample into 2subperiods. The 1st subperiod extends from 2000 through 2003. Over this subpe-riod, we use the corresponding press releases to classify the sample CEOs as eitheroverconfident or not. We then use this measure for our examination of merger andacquisition activity during the 2nd subperiod (2004–2006). Because a strategy ofserial acquisitions by a sample firm represents yet another channel for reversecausality, we also control for the number of offers made during the 2000–2003subperiod in our regression analyses.
In Panel B of Table 5, we examine the number of merger offers made byoverconfident CEOs using this new approach. We estimate 4 different model spec-ifications, including one using only our sample of non-U.S. firms. We find thatthe coefficient for overconfidence is uniformly significant and positive across allmodels. These results suggest that the influence of overconfidence on the numberof merger offers made is a robust effect.
B. Type of Acquisition
Overconfidence among CEOs can also manifest itself in the type of deal thatthey elect to undertake. More specifically, mergers that are diversifying in nature

Ferris, Jayaraman, and Sabherwal 153
are generally considered to be more uncertain and are often met with negativeannouncement period returns (Morck et al. (1990)). Because overconfident CEOsare more likely to overestimate their ability to create value from a merger, theymight be more likely to pursue acquisitions beyond their firm’s core business.Consequently, in this section, we examine the extent to which overconfident CEOsengage in diversifying mergers relative to their less confident peers. Consistentwith Malmendier and Tate (2008), we define a diversifying merger as one wherethe acquirer and target do not share the same Fama-French (1997) 48 industrygroup assignment.
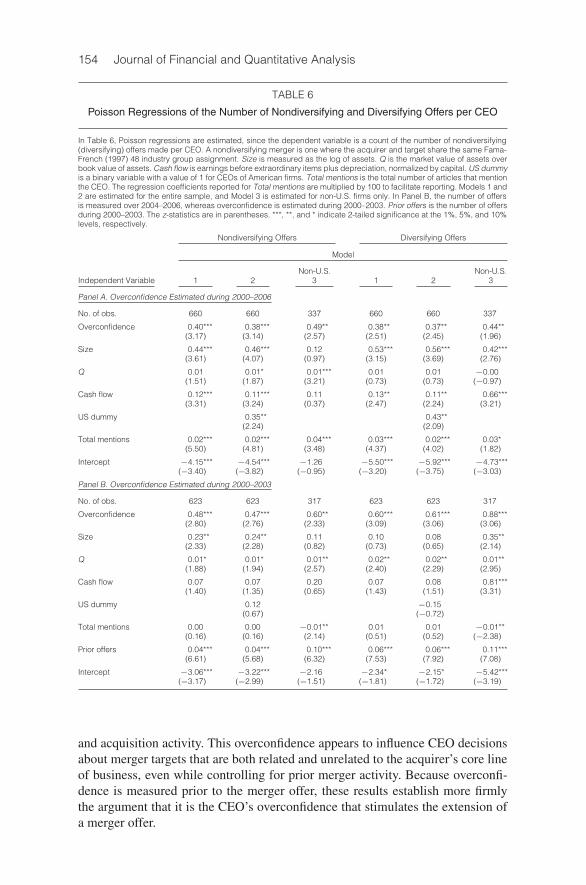
In Table 6, we introduce CEO overconfidence as an independent variable ina set of Poisson regressions examining the number of nondiversifying and diver-sifying offers. Panel A contains our findings for the aggregate sample, using thesame control variables as in Table 5. We estimate 3 models for nondiversifyingoffers and the same 3 specifications for diversifying offers. Our analysis of thenumber of nondiversifying offers made per CEO is contained in the 3 leftmostcolumns of Panel A. Model 1 is calculated for the aggregate set of firms, andwe find that overconfidence is significantly positive. The remaining regressors arelikewise positive and, except for Q, statistically significant. Model 2 also exam-ines all firms, but it makes use of a binary variable to control for classification asa U.S. firm. We find that overconfidence as well as all of the independent vari-ables are significantly positive. Model 3 is limited to only non-U.S. firms, andwe continue to observe that overconfidence is statistically significant and pos-itive. Also, Q is positive and statistically significant. The results from these 3models provide robust evidence that CEO overconfidence is an important influ-ence in the decision of firms to acquire nondiversifying targets and is a globalphenomenon.
Our analysis of diversifying mergers is provided in the 3 rightmost columnsof Panel A in Table 6. Model 1 contains all sample firms and shows thatoverconfidence is a significant factor for understanding the corporate pursuit ofunrelated targets. Firm size and cash flow are also significantly positive, while Qis insignificantly positive. Model 2 contains both U.S. and foreign firms, but italso includes a binary variable to control for U.S. firms. We again obtain a sta-tistically significant coefficient for CEO overconfidence. We further observe inModel 2 that firm size, cash flow, Q, and the U.S. indicator variable are all pos-itive and generally statistically significant. We examine our sample of non-U.S.firms in Model 3 and continue to find that the coefficient for overconfidence issignificantly positive. Firm size and cash flow are also statistically significant andpositive. These results suggest that the acquisition of unrelated targets by overcon-fident CEOs is as common abroad as it is in the United States. Furthermore, thesemultivariate results suggest that overconfidence is not a discriminating factor inexplaining a CEO’s decision to make either a diversifying or a nondiversifyingmerger offer.
In Panel B of Table 6, we reestimate these models using overconfidenceestimated during 2000–2003 while examining the type of offer extended over2004–2006. We observe that the coefficient for CEO overconfidence is consis-tently positive and significant. These results confirm those presented immediatelyabove, that CEO overconfidence has an important effect on the level of merger
154 Journal of Financial and Quantitative Analysis
TABLE 6
Poisson Regressions of the Number of Nondiversifying and Diversifying Offers per CEO
In Table 6, Poisson regressions are estimated, since the dependent variable is a count of the number of nondiversifying(diversifying) offers made per CEO. A nondiversifying merger is one where the acquirer and target share the same Fama-French (1997) 48 industry group assignment. Size is measured as the log of assets. Q is the market value of assets overbook value of assets. Cash flow is earnings before extraordinary items plus depreciation, normalized by capital. US dummyis a binary variable with a value of 1 for CEOs of American firms. Total mentions is the total number of articles that mentionthe CEO. The regression coefficients reported for Total mentions are multiplied by 100 to facilitate reporting. Models 1 and2 are estimated for the entire sample, and Model 3 is estimated for non-U.S. firms only. In Panel B, the number of offersis measured over 2004–2006, whereas overconfidence is estimated during 2000–2003. Prior offers is the number of offersduring 2000–2003. The z-statistics are in parentheses. ***, **, and * indicate 2-tailed significance at the 1%, 5%, and 10%levels, respectively.
Nondiversifying Offers Diversifying Offers
Model
Non-U.S. Non-U.S.Independent Variable 1 2 3 1 2 3
Panel A. Overconfidence Estimated during 2000–2006
No. of obs. 660 660 337 660 660 337
Overconfidence 0.40*** 0.38*** 0.49** 0.38** 0.37** 0.44**(3.17) (3.14) (2.57) (2.51) (2.45) (1.96)
Size 0.44*** 0.46*** 0.12 0.53*** 0.56*** 0.42***(3.61) (4.07) (0.97) (3.15) (3.69) (2.76)
Q 0.01 0.01* 0.01*** 0.01 0.01 −0.00(1.51) (1.87) (3.21) (0.73) (0.73) (−0.97)
Cash flow 0.12*** 0.11*** 0.11 0.13** 0.11** 0.66***(3.31) (3.24) (0.37) (2.47) (2.24) (3.21)
US dummy 0.35** 0.43**(2.24) (2.09)
Total mentions 0.02*** 0.02*** 0.04*** 0.03*** 0.02*** 0.03*(5.50) (4.81) (3.48) (4.37) (4.02) (1.82)
Intercept −4.15*** −4.54*** −1.26 −5.50*** −5.92*** −4.73***(−3.40) (−3.82) (−0.95) (−3.20) (−3.75) (−3.03)
Panel B. Overconfidence Estimated during 2000–2003
No. of obs. 623 623 317 623 623 317
Overconfidence 0.48*** 0.47*** 0.60** 0.60*** 0.61*** 0.88***(2.80) (2.76) (2.33) (3.09) (3.06) (3.06)
Size 0.23** 0.24** 0.11 0.10 0.08 0.35**(2.33) (2.28) (0.82) (0.73) (0.65) (2.14)
Q 0.01* 0.01* 0.01** 0.02** 0.02** 0.01**(1.88) (1.94) (2.57) (2.40) (2.29) (2.95)
Cash flow 0.07 0.07 0.20 0.07 0.08 0.81***(1.40) (1.35) (0.65) (1.43) (1.51) (3.31)
US dummy 0.12 −0.15(0.67) (−0.72)
Total mentions 0.00 0.00 −0.01** 0.01 0.01 −0.01**(0.16) (0.16) (2.14) (0.51) (0.52) (−2.38)
Prior offers 0.04*** 0.04*** 0.10*** 0.06*** 0.06*** 0.11***(6.61) (5.68) (6.32) (7.53) (7.92) (7.08)
Intercept −3.06*** −3.22*** −2.16 −2.34* −2.15* −5.42***(−3.17) (−2.99) (−1.51) (−1.81) (−1.72) (−3.19)
and acquisition activity. This overconfidence appears to influence CEO decisionsabout merger targets that are both related and unrelated to the acquirer’s core lineof business, even while controlling for prior merger activity. Because overconfi-dence is measured prior to the merger offer, these results establish more firmlythe argument that it is the CEO’s overconfidence that stimulates the extension ofa merger offer.

Ferris, Jayaraman, and Sabherwal 155
C. Financing Method
Overconfident CEOs not only overestimate the value they create in their ac-quisitions, but also in their own firms. They tend to view their firms as underval-ued and are more averse to the use of equity to finance an acquisition. Hence, ourexpectation is that overconfident CEOs will make greater use of cash to financetheir mergers.
Table 7 provides our multivariate analysis of merger financing choice. InPanel A, we present our findings for overconfidence estimated across the entiresample period with controls for total press mentions and the other factors used inour earlier analyses. In the leftmost 4 columns, we estimate our models withoutcontrolling for year fixed effects. In Model 1, we regress overconfidence againsta binary dependent variable having a value of 1 if the acquisition is financedonly with cash, and 0 otherwise.7 We find that the coefficient for overconfidenceis significantly positive. Model 2 includes all of the additional regressors usedin the earlier analysis of the number of merger offers by overconfident CEOs.
TABLE 7
Logistic Regressions of the Method of Merger Financing
In Table 7, the dependent variable is a binary variable with a value of 1 if the acquisition is financed only with cash, and 0otherwise. Size is the log of assets at the beginning of the year. Q is the market value of assets over book value of assets atthe beginning of the year. Cash flow is earnings before extraordinary items plus depreciation and is normalized by capitalat the beginning of the year. Total mentions is the total number of articles that mention the CEO. US dummy is a binaryvariable with a value of 1 for CEOs of American firms. The regression coefficients reported for Total mentions are multipliedby 100 to facilitate reporting. Models 1–3 are estimated for the entire sample, and Model 4 is estimated for non-U.S. firmsonly. In Panel B, we examine mergers observed during 2004–2006, while estimating overconfidence during 2000–2003.Prior offers is the number of total (nondiversifying and diversifying) offers in 2000–2003. The z-statistics are in parentheses.***, **, and * indicate 2-tailed significance at the 1%, 5%, and 10% levels, respectively.
Without Year Fixed Effects With Year Fixed Effects
Model
Independent Non-U.S. Non-U.S.Variable 1 2 3 4 1 2 3 4
Panel A. Overconfidence Estimated during 2000–2006
No. of obs. 1,363 1,363 1,363 548 1,363 1,363 1,363 548
Overconfidence 0.45*** 0.41*** 0.41*** 0.80*** 0.42*** 0.36** 0.37** 0.70***(3.04) (2.78) (2.80) (3.24) (2.66) (2.34) (2.36) (2.73)
Size 0.07 0.07 0.00 0.09* 0.09* 0.02(1.30) (1.29) (0.03) (1.67) (1.64) (0.13)
Q −0.02* −0.02* −0.02*** −0.02** −0.02** −0.02***(−1.78) (−1.79) (−6.93) (−2.21) (−2.24) (−5.00)
Cash flow 0.12* 0.12* 0.44 0.13* 0.13* 0.33(1.78) (1.81) (1.13) (1.80) (1.84) (0.86)
US dummy 0.03 0.06(0.17) (0.36)
Total mentions −0.01 −0.01* −0.01* −0.03** −0.00 −0.00 −0.00 −0.00(−1.55) (−1.73) (−1.79) (−2.18) (−0.63) (−0.74) (−0.79) (−1.52)
Intercept 0.11 −0.43 −0.44 −0.16 1.00*** 0.27 0.25 0.52(0.92) (−0.83) (−0.86) (−0.12) (4.32) (0.46) (0.41) (0.38)
(continued on next page)
7This specification of the dependent variable is consistent with the approach used by Malmendierand Tate (2008). We, however, repeat this analysis by using a binary variable that assumes a value of1 if cash or debt or both are used for financing, but no equity, and 0 otherwise. Our results remainqualitatively identical to those reported in Table 7.

156 Journal of Financial and Quantitative Analysis
TABLE 7 (continued)
Logistic Regressions of the Method of Merger Financing
Without Year Fixed Effects With Year Fixed Effects
Model
Independent Non-U.S. Non-U.S.Variable 1 2 3 4 1 2 3 4
Panel B. Overconfidence Estimated during 2000–2003
No. of obs. 501 501 501 207 501 501 501 207
Overconfidence 0.51** 0.47* 0.46* 0.79** 0.48*** 0.45* 0.44* 0.70*(1.99) (1.83) (1.81) (2.19) (1.88) (1.76) (1.74) (1.95)
Size 0.28* 0.28** 0.23 0.27* 0.27* 0.21(1.96) (1.97) (0.79) (1.93) (1.94) (0.71)
Q −0.02** −0.02* −0.03*** −0.02** −0.02** −0.02***(−2.49) (−2.43) (−4.82) (−2.30) (−2.22) (−2.91)
Cash flow 0.35 0.37* 0.00 0.32 0.34 −0.09(1.64) (1.74) (0.00) (1.53) (1.62) (−0.14)
US dummy −0.15 −0.14(−0.67) (0.55)
Prior offers 0.00 −0.02 −0.02 −0.07 0.01 −0.01 −0.01 −0.05(0.37) (−1.46) (−1.32) (−1.38) (0.74) (−1.15) (−1.07) (−0.93)
Total mentions 0.01 0.01 0.01 −0.02 0.01 0.01 0.01 −0.02(0.66) (0.76) (0.89) (−0.18) (0.79) (0.96) (1.07) (−0.16)
Intercept 0.53** −2.39 −2.32 −1.70 0.98*** −1.90 −1.83 −1.00(2.38) (−1.58) (−1.52) (−0.54) (3.70) (−1.27) (−1.20) (−0.33)
Again, we find that overconfidence is significantly positive and contributes to anunderstanding of why mergers are paid for in cash. The coefficient for cash flowis also significantly positive, consistent with the argument that abundant internalresources make it more likely that CEOs will use cash rather than what they oftenperceive as undervalued equity to finance a deal. We find, however, that Q is in-versely related to the likelihood of a cash payment for a merger. This is consistentwith the belief that CEOs are less likely to view their firm as undervalued whenthey experience higher Q ratios. Hence, CEOs will be more willing to use eq-uity rather than cash to finance their acquisitions. In Model 3, we include a binaryindicator variable for U.S. firms. The results confirm the significance of overconfi-dence for explaining the choice of merger financing. Model 4 tests whether CEOoverconfidence can explain the financing choice for non-U.S. mergers. We findthat even with these mergers, both overconfidence and the firm’s market-to-bookratio are significant in explaining the cash or equity financing choice.
The rightmost 4 columns of Panel A in Table 7 contain our regression esti-mates while controlling for year fixed effects. Most importantly, the coefficient foroverconfidence remains significantly positive across all model specifications. Thecoefficients for the control variables are qualitatively similar to those obtained forthe regressions without fixed effects.
We conclude from Panel A of Table 7 that CEO overconfidence is a signifi-cant factor in understanding why some mergers are financed with cash and otherswith equity even after controlling for firm size, internal resources, and the firm’sinvestment opportunities. The introduction of year fixed effects has no influenceon the relation between CEO overconfidence and how the firm elects to financeits merger and acquisition activity.

Ferris, Jayaraman, and Sabherwal 157
Panel B of Table 7 contains our results when we restrict our estimationof overconfidence to the subperiod 2000–2003 while examining the financingmethod used for offers extended during 2004–2006. Using the same model speci-fications as in Panel A, we continue to find that overconfidence exerts a significantimpact on the financing choice for a merger or acquisition. That is, overconfidentCEOs are more likely to use cash financing than their less confident peers. Thisresult holds for both U.S. and non-U.S. firms. The signs and significance of theother independent variables are qualitatively comparable to those in Panel A. Byseparating across time the classification of a CEO as overconfident from subse-quent merger offers and financing choices, we are able to establish more clearlythat it is overconfidence that affects the subsequent choice of merger financing.
VI. Cross-Country Influences on CEO Overconfidence
In this section, we examine the extent to which country-level factors mightinfluence the nature of merger and acquisition decisions by overconfident CEOs.Based on an untabulated univariate analysis, we find that the number of offersmade by an overconfident CEO is most strongly related to a country’s dominantreligion and Hofstede’s (1980), (2001) individualism and long-term orientationcultural measures. Using these 3 country-level factors, we now examine how theymight explain the total number of offers made while controlling for other factorsin a multivariate framework.
In Table 8, we fit our regression model across a number of country sub-samples based on these 3 cultural dimensions. CEOs are assigned to a specific
TABLE 8
Poisson Regressions of the Number of Offers per CEOfor Subgroups Based on Country Characteristics
In Table 8, because the dependent variable is a count of the number of offers made per CEO, Poisson regressions areestimated. Size is the log of assets at the beginning of the year. Q is the market value of assets over book value of assets atthe beginning of the year. Cash flow is earnings before extraordinary items plus depreciation and is normalized by capitalat the beginning of the year. Total mentions is the total number of articles that mention the CEO. The regression coefficientsreported for Total mentions are multiplied by 100 to facilitate reporting. For Hofstede’s (1980), (2001) measure, the CEOof a firm is included in the high (low) group if the country in which the firm is headquartered has a Hofstede (1980), (2001)score above (below) the world median score for that measure. The z-statistics are in parentheses. ***, **, and * indicate2-tailed significance at the 1%, 5%, and 10% levels, respectively.
Model
Religion Individualism Long-Term Orientation
Independent Variable Christianity Other Low High Low High
No. of obs. 551 109 30 630 528 128
Overconfidence 0.22* 0.66 0.67 0.30*** 0.10 0.66(1.82) (1.38) (1.05) (2.66) (0.85) (1.53)
Size 0.50*** 0.63** 0.96* 0.47*** 0.51*** 0.65**(3.53) (2.03) (1.80) (3.35) (3.68) (2.00)
Q 0.01 −0.06 0.01 0.10* 0.08 0.01(0.72) (−0.14) (1.01) (1.68) (1.31) (1.29)
Cash flow 0.12*** 1.02 1.40 0.10*** 0.10*** 0.95*(3.00) (1.50) (1.56) (2.92) (3.00) (1.72)
Total mentions 0.02*** −0.05 −0.38 0.02*** 0.02*** −0.06(4.73) (−0.85) (−1.06) (5.21) (5.08) (−1.00)
Intercept −4.00*** −6.47** −10.25** −4.08*** −4.20*** −6.71**(−2.85) (−2.08) (−2.02) (−2.87) (−3.06) (−1.96)

158 Journal of Financial and Quantitative Analysis
subsample based upon their country’s Hofstede (1980), (2001) score relative tothe median score for that measure or the identity of that country’s primary re-ligion. We continue to observe important cultural effects in the relation betweenoverconfidence and the number of offers. We find that the overconfidence of CEOsin Christian countries enhances the number of merger offers made. CEO overcon-fidence is not statistically significant, however, for our subsample of non-Christiancountries. We also observe that CEO overconfidence increases the number of of-fers when the CEO leads a firm headquartered in a country with a high level ofindividualism. Overconfidence appears not to be important when the firm is lo-cated in a country whose culture de-emphasizes individualism. Finally, we deter-mine that long-term orientation becomes insignificant for explaining the numberof merger offers by an overconfident CEO in a multivariate analysis. We concludethat cultural influences are important factors in explaining the merger offer activ-ity by overconfident CEOs, with the effects of religion and individualism mostpronounced.
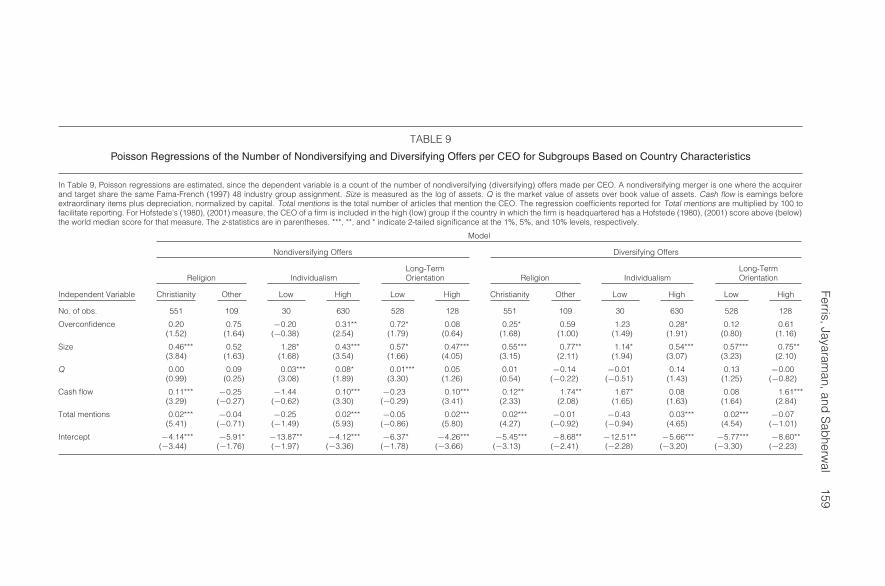
Table 9 contains our analysis of country cultural effects based on the typeof merger offer made. Again, our use of religion, individualism, and long-termorientation is motivated by their significance in a univariate examination of therelation between country factors and the frequency of related and unrelated offers.We observe in the leftmost columns how religion, individualism, and long-termorientation affect the decisions of overconfident CEOs about nondiversifying tar-gets. We find that regardless of the country’s primary religion, overconfidencehas a positive effect on the number of nondiversifying offers. Individualism andlong-term orientation, however, have a more distinct influence on the offer be-havior of overconfident CEOs. We find that overconfident CEOs make more non-diversifying mergers only in countries with high levels of individualism or lowlevels of long-term orientation.
The rightmost set of columns examines culture’s influence on the numberof diversifying offers. We observe that religion has its own effect for these kindsof mergers, with overconfidence positively influencing the number of diversify-ing offers. We find comparable results for CEOs in countries with high levelsof individualism. Unlike nondiversifying mergers, long-term orientation has nosignificant effect on how overconfidence influences the diversifying decision ofCEOs.
We conclude this analysis of cultural factors on international merger activ-ity by examining the effect of country factors on the choice of financing selectedby an overconfident CEO. Our untabulated univariate analysis suggests that thereare a number of country factors that are related to the number of cash offers ex-tended by an overconfident CEO. These factors are used in the construction ofvarious subsamples that are included in Table 10. We find that a greater use ofcash financing by overconfident CEOs holds most strongly in countries whereChristianity is the dominant religion. We further find that the Hofstede (1980),(2001) cultural measures can help to explain the merger and acquisition financingchoice. Specifically, we determine that overconfident CEOs disproportionatelyuse cash to finance their mergers when power distance, uncertainty avoidance, orlong-term orientation is low.
Ferris,Jayaraman,and
Sab
herwal
159
TABLE 9
Poisson Regressions of the Number of Nondiversifying and Diversifying Offers per CEO for Subgroups Based on Country Characteristics
In Table 9, Poisson regressions are estimated, since the dependent variable is a count of the number of nondiversifying (diversifying) offers made per CEO. A nondiversifying merger is one where the acquirerand target share the same Fama-French (1997) 48 industry group assignment. Size is measured as the log of assets. Q is the market value of assets over book value of assets. Cash flow is earnings beforeextraordinary items plus depreciation, normalized by capital. Total mentions is the total number of articles that mention the CEO. The regression coefficients reported for Total mentions are multiplied by 100 tofacilitate reporting. For Hofstede’s (1980), (2001) measure, the CEO of a firm is included in the high (low) group if the country in which the firm is headquartered has a Hofstede (1980), (2001) score above (below)the world median score for that measure. The z-statistics are in parentheses. ***, **, and * indicate 2-tailed significance at the 1%, 5%, and 10% levels, respectively.
Model
Nondiversifying Offers Diversifying Offers
Long-Term Long-TermReligion Individualism Orientation Religion Individualism Orientation
Independent Variable Christianity Other Low High Low High Christianity Other Low High Low High
No. of obs. 551 109 30 630 528 128 551 109 30 630 528 128
Overconfidence 0.20 0.75 −0.20 0.31** 0.72* 0.08 0.25* 0.59 1.23 0.28* 0.12 0.61(1.52) (1.64) (−0.38) (2.54) (1.79) (0.64) (1.68) (1.00) (1.49) (1.91) (0.80) (1.16)
Size 0.46*** 0.52 1.28* 0.43*** 0.57* 0.47*** 0.55*** 0.77** 1.14* 0.54*** 0.57*** 0.75**(3.84) (1.63) (1.68) (3.54) (1.66) (4.05) (3.15) (2.11) (1.94) (3.07) (3.23) (2.10)
Q 0.00 0.09 0.03*** 0.08* 0.01*** 0.05 0.01 −0.14 −0.01 0.14 0.13 −0.00(0.99) (0.25) (3.08) (1.89) (3.30) (1.26) (0.54) (−0.22) (−0.51) (1.43) (1.25) (−0.82)
Cash flow 0.11*** −0.25 −1.44 0.10*** −0.23 0.10*** 0.12** 1.74** 1.67* 0.08 0.08 1.61***(3.29) (−0.27) (−0.62) (3.30) (−0.29) (3.41) (2.33) (2.08) (1.65) (1.63) (1.64) (2.84)
Total mentions 0.02*** −0.04 −0.25 0.02*** −0.05 0.02*** 0.02*** −0.01 −0.43 0.03*** 0.02*** −0.07(5.41) (−0.71) (−1.49) (5.93) (−0.86) (5.80) (4.27) (−0.92) (−0.94) (4.65) (4.54) (−1.01)
Intercept −4.14*** −5.91* −13.87** −4.12*** −6.37* −4.26*** −5.45*** −8.68** −12.51** −5.66*** −5.77*** −8.60**(−3.44) (−1.76) (−1.97) (−3.36) (−1.78) (−3.66) (−3.13) (−2.41) (−2.28) (−3.20) (−3.30) (−2.23)

160JournalofFinancialand
Quantitative
Analysis
TABLE 10
Logistic Regressions of the Method of Merger Financing for Subgroups Based on Country Characteristics
In Table 10, the dependent variable is a binary variable with a value of 1 if the acquisition is financed only with cash, and 0 otherwise. Size is measured as the log of assets. Q is the market value of assets overbook value of assets. Cash flow is earnings before extraordinary items plus depreciation, normalized by capital. Total mentions is the total number of articles that mention the CEO. The regression coefficientsreported for Total mentions are multiplied by 100 to facilitate reporting. Results for individualism cannot be estimated due to the clustering of observations. For Hofstede’s (1980), (2001) measure, the CEO of a firmis included in the high (low) group if the country in which the firm is headquartered has a Hofstede (1980), (2001) score above (below) the world median score for that measure. The z-statistics are in parentheses.***, **, and * indicate 2-tailed significance at the 1%, 5%, and 10% levels, respectively.
Model
Uncertainty Long-TermLegal Origin Religion Language Power Distance Avoidance Masculinity Orientation
Independent Variable Common Other Chris. Other English Other Low High Low High Low High Low High
No. of obs. 1,004 359 1,286 77 997 366 1,254 109 1,181 182 186 1,177 1,272 84
Overconfidence 0.31** 0.69** 0.39*** 0.38 0.29* 0.76** 0.38** 0.58 0.40*** 0.46 0.81** 0.35** 0.37** 0.35(1.99) (2.01) (2.60) (0.56) (1.87) (2.32) (2.59) (0.87) (2.68) (1.04) (2.22) (2.31) (2.47) (0.58)
Size 0.09** 0.04 0.08 −0.01 0.10** 0.00 0.08* −0.16 0.10** −0.19 −0.02 0.08 0.08 −0.02(1.94) (0.28) (1.51) (−0.04) (2.03) (0.03) (1.67) (−0.41) (2.06) (−0.68) (−0.08) (1.61) (1.55) (−0.14)
Q 0.06 −0.03*** −0.02* −0.02 0.07 −0.03*** 0.06 −0.02*** 0.05 −0.03*** −0.03*** 0.06 0.06 −0.02***(0.82) (8.59) (−1.95) (−0.03) (0.85) (−8.75) (0.76) (−3.09) (0.73) (−4.89) (−5.27) (0.77) (0.86) (−3.93)
Cash flow 0.24*** 0.60 0.12* 0.17 0.25*** 0.55 0.20** 1.68 0.22** 1.52 0.26 0.21** 0.21** 0.15(2.66) (1.30) (1.82) (0.17) (2.66) (1.20) (2.51) (1.46) (2.58) (0.95) (0.74) (2.57) (2.52) (0.14)
Total mentions −0.01* −0.03** −0.01** −0.05 −0.01 −0.03** −0.01 −0.04 −0.01** −0.03 −0.05 −0.00 −0.01** −0.00(−1.57) (−2.36) (−2.03) (−0.36) (−1.50) (−2.36) (−1.49) (−1.20) (−2.10) (−1.31) (−1.63) (−1.09) (−2.54) (−0.34)
Intercept −0.71 −0.58 −0.54 0.02 −0.76 −0.18 −0.64 2.34 −0.79 1.57 0.23 −0.62 −0.64 0.25(−1.37) (−0.37) (−0.97) (0.01) (−1.45) (−0.12) (−1.23) (0.61) (−1.52) (0.54) (0.09) (−1.17) (−1.16) (0.17)

Ferris, Jayaraman, and Sabherwal 161
The results in Table 10 confirm the greater use of cash by overconfidentCEOs, but the effect appears to possess greater cross-sectional variability thanthe number of merger offers made or the type of offer extended. We find thatthe more extensive use of cash is most prevalent in countries with Christianityas the dominant religion or where the business environment and cultural normsemphasize greater risk taking, shorter time horizons, and entrepreneurism.
VII. Conclusion
This study is a novel examination of two fundamental research questionsconcerning CEO overconfidence and international merger activity. Most impor-tantly, we test whether critical deal characteristics reported by Malmendier andTate (2008) for a sample of U.S.-only mergers by overconfident managers alsoapply internationally. Given significant international variability in the regulationof corporate merger activity, varying capital market depths, and culturally basedbehavior differences, it is unclear whether results obtained for U.S. mergers willhold globally. We find that overconfidence is related to a variety of merger charac-teristics. We determine that overconfidence influences the number of offers madeby a CEO, the frequencies of nondiversifying and diversifying acquisitions, andthe use of cash rather than equity as the primary financing vehicle. We also ob-serve that there are significant cultural influences on the relation between overcon-fidence and merger activity. We further determine that our conclusions are robustto concerns about the direction of causality by constructing a premerger measureof CEO overconfidence and relating that to subsequent merger activity as well ascontrolling for prior merger activity.
We also investigate whether there exist country or country group patternsin CEO overconfidence that might otherwise be masked in an aggregate interna-tional sample of mergers. The existence of commonalities in CEO demographicsacross legal systems or national cultures might produce similar patterns in thedistribution of overconfident CEOs.
We establish a number of important findings concerning demographic andcountry patterns in the global distribution of overconfident CEOs. We find thatoverconfident CEOs tend to lead firms headquartered in Christian countries. Wealso find that the Hofstede (1980), (2001) measures of national culture help to ex-plain geographical patterns in the dispersion of overconfident CEOs. Specifically,we discover that individualism positively influences the likelihood that a CEOwill be overconfident. CEOs operating in countries whose cultures emphasize along-term orientation tend to have less overconfident CEOs. We conclude thatCEO overconfidence is an international phenomenon, although there are distinctpatterns in its global distribution.
We conclude from our empirical analysis that overconfidence is a factor inthe global market for corporate acquisitions. It is not solely a U.S. or WesternEuropean phenomenon. The presence of CEO overconfidence in the internationalmerger market indicates that behavioral considerations might occupy an increas-ing importance in our understanding of executive decision making and the natureof agency conflict within the firm. Our findings also contribute to the growing

162 Journal of Financial and Quantitative Analysis
but still immature literature establishing the importance of human psychologicalcharacteristics in understanding corporate decision making.
Appendix. Overview of the Hofstede Cultural Measures
1. Sample and Cultural Measure Construction
In 1980 Geert Hofstede published Culture’s Consequences: International Differ-ences in Work-Related Values, in which he develops his multidimensional framework forthe analysis of culture. In this work, Hofstede (1980) statistically analyzes over 116,000questionnaires collected in 1967 and 1973 from employees working in IBM subsidiariesdistributed over 72 countries around the world. Hofstede (1980) then undertakes a country-level factor analysis of these questionnaires. From this analysis, Hofstede (1980) develops4 dimensions of culture. A 5th dimension, the extent of long-term orientation, was addedin 1991.
Each index value for these 5 factors is constructed from the mean country responsescores based on questions associated with that factor. These means are calculated across a5-point response scale for each question, ranging from 1 (very frequently) to 5 (seldom).These scores are then summed and normed to have a range between 0 (smallest) and 100(largest).
We do not use the actual Hofstede (1980), (2001) individual scores for this analysis.Rather, we create portfolios based on the median value of each dimension. For instance,we separate specific countries into a high (low) individualism portfolio if its value on thisdimension is above (below) the median score. Then, firms that are headquartered in thehigh-individualism countries are assigned to this portfolio and those headquartered in thelow-individualism countries are assigned to the corresponding low-individualism portfolio.This approach allows us to present a number of comparisons of merger activity acrosscountry cultural differences.
2. The 5 Cultural Dimensions
The 5 cultural dimensions identified by Hofstede (1980), (2001) are described below:
Power Distance focuses on the amount of equality or inequality between people ina country. A high power distance ranking indicates that inequalities of power and wealthhave been allowed to grow within the society. These societies are more likely to follow acaste system that does not allow significant upward mobility of its citizens. A low powerdistance ranking indicates that the society de-emphasizes the differences between citizens’power and wealth. In these societies, equality and opportunity for everyone is stressed.
Individualism measures the degree to which society reinforces individual or collec-tive, achievement and interpersonal relationships. A high individualism ranking indicatesthat individuality and individual rights are paramount within the society. Individuals inthese societies may tend to form a larger number of looser relationships. A low individu-alism ranking typifies societies of a more collectivist nature with close ties between indi-viduals. These cultures reinforce extended families and collectives where everyone takesresponsibility for fellow members of their group.
Masculinity captures the extent to which society reinforces, or does not reinforce, thetraditional masculine work role model of male achievement, control, and power.A high masculinity ranking indicates that the country experiences a high degree of gen-der differentiation. In these cultures, males dominate a significant portion of the societyand power structure, with females being controlled by male domination. A low masculin-ity ranking indicates that the country has a low level of differentiation and discriminationbetween genders. In these cultures, females are treated equally to males in all aspects ofthe society.
Uncertainty Avoidance reflects the level of tolerance for uncertainty and ambigu-ity within the society (i.e., unstructured situations). A high uncertainty avoidance ranking

Ferris, Jayaraman, and Sabherwal 163
indicates that the country has a low tolerance for uncertainty and ambiguity. This creates arule-oriented society that institutes laws, rules, regulations, and controls in order to reducethe amount of uncertainty. A low uncertainty avoidance ranking indicates that the coun-try has less concern about ambiguity and uncertainty and has more tolerance for a varietyof opinions. This is reflected in a society that is less rule-oriented, more readily acceptschange, and takes more and greater risks.
Long-Term Orientation focuses on the degree to which the society embraces, or doesnot embrace, long-term devotion to traditional, forward-thinking values. A high long-termorientation ranking indicates that the country subscribes to the values of long-term com-mitments and respect for tradition. This is thought to support a strong work ethic, wherelong-term rewards are expected as a result of today’s hard work. Business, however, mighttake longer to develop in this society, particularly for an “outsider.” A low long-term ori-entation ranking indicates that the country does not reinforce the concept of long-term,traditional orientation. In this culture, change can occur more rapidly, as long-term tradi-tions and commitments do not become impediments to change.
ReferencesAgrawal, A.; J. Jaffe; and G. N. Mandelker. “The Post-Merger Performance of Acquiring Firms:
A Re-Examination of an Anomaly.” Journal of Finance, 47 (1992), 1605–1621.Asquith, P.; R. Bruner; and D. Mullins. “The Gains to Bidding Firms from Merger.” Journal of Finan-
cial Economics, 11 (1983), 121–139Barber, B., and T. Odean. “Boys Will Be Boys: Gender, Overconfidence, and Common Stock Invest-
ment.” Quarterly Journal of Economics, 116 (2001), 261–292.Beugelsdijk, S., and B. Frijns. “A Cultural Explanation of the Foreign Bias in International Asset
Allocation.” Journal of Banking and Finance, 34 (2010), 2121–2131.Bouwman, C.; K. Fuller; and A. Nain. “Market Valuation and Acquisition Quality: Empirical Evi-
dence.” Review of Financial Studies, 22 (2009), 633–679.Bradley, M.; A. Desai; and E. Kim. “Synergistic Gains from Corporate Acquisitions and Their Divi-
sion between the Stockholders of Target and Acquiring Firms.” Journal of Financial Economics,21 (1988), 3–40.
Bruner, R. F. “Does M&A Pay? A Survey of Evidence for the Decision-Maker.” Journal of AppliedFinance, 12 (2002), 48–68.
Campbell, T.; M. Gallmeyer; S. Johnson; J. Rutherford; and B. Stanley. “CEO Optimism and ForcedTurnover.” Journal of Financial Economics, 101 (2011), 695–712.
Chui, A.; S. Titman; and K. C. Wei. “Individualism and Momentum around the World.” Journal ofFinance, 65 (2010), 361–392.
Diaz, J. “Religion and Gambling in Sin-City: A Statistical Analysis of the Relationship betweenReligion and Gambling Patterns in Las Vegas Residents.” Social Science Journal, 37 (2000),453–458.
Doidge, C.; G. Karolyi; and R. Stulz. “Why Do Countries Matter So Much for Corporate Gover-nance?” Journal of Financial Economics, 86 (2007), 1–39.
Doukas, J., and D. Petmezas. “Acquisitions, Overconfident Managers and Self-Attribution Bias.”European Financial Management, 13 (2007), 531–577.
Fama, E., and K. French. “Industry Costs of Equity.” Journal of Financial Economics, 43 (1997),153–193.
Franks, J.; R. Harris; and S. Titman. “The Postmerger Share-Price Performance of Acquiring Firms.”Journal of Financial Economics, 29 (1991), 81–96.
Fuller, K.; J. Netter; and M. Stegemoller. “What Do Returns to Acquiring Firms Tell Us? Evidencefrom Firms that Make Many Acquisitions.” Journal of Finance, 57 (2002), 1763–1793.
Gabaix, X., and A. Landier. “Why Has CEO Pay Increased So Much?” Quarterly Journal of Eco-nomics, 123 (2008), 49–100.
Graham, J.; C. Harvey; and M. Puri. “Managerial Attitudes and Corporate Actions.” Working Paper,Duke University (2009).
Griffin, D.; K. Lai; H. Yue; and L. Zhao. “Cultural Values and Corporate Risk Taking.” Working Paper,University of British Columbia (2009).
Halek, M., and J. Eisenhauer. “Demography of Risk Aversion.” Journal of Risk and Insurance, 68(2001), 1–24.
Hayward, M., and D. C. Hambrick. “Explaining the Premiums Paid for Large Acquisitions: Evidenceof CEO Hubris.” Administrative Science Quarterly, 42 (1997), 103–127.

164 Journal of Financial and Quantitative Analysis
Hilary, G., and K. W. Hui. “Does Religion Matter in Corporate Decision Making in America?” Journalof Financial Economics, 93 (2009), 474–489.
Hirshleifer, D.; A. Low; and S. H. Teoh. “Are Overconfident CEOs Better Innovators?” Journal of Fi-nance, 67 (2012), 1457–1498.
Hofstede, G. Culture’s Consequences: International Differences in Work-Related Values, BeverlyHills, CA: Sage Publications (1980).
Hofstede, G. Culture’s Consequences: Comparing Values, Behaviors, Institutions and Organizationsacross Nations, 2nd ed. Thousand Oaks, CA: Sage Publications (2001).
Hope, O. “Disclosure Practices, Enforcement of Accounting Standards, and Analysts’ Forecast Accu-racy: An International Study.” Journal of Accounting Research, 41 (2003), 235–272.
Jensen, M., and R. Ruback. “The Market for Corporate Control: The Scientific Evidence.” Journal ofFinancial Economics, 11 (1983), 5–50.
La Porta, R.; F. Lopez-de-Silanes; A. Shleifer; and R. Vishny. “Law and Finance.” Journal of PoliticalEconomy, 52 (1998), 1113–1155.
La Porta, R.; F. Lopez-de-Silanes; A. Shleifer; and R. Vishny. “Corporate Ownership around theWorld.” Journal of Finance, 54 (1999), 471–517.
La Porta, R.; F. Lopez-de-Silanes; A. Shleifer; and R. Vishny. “Agency Problems and Dividend Poli-cies around the World.” Journal of Finance, 55 (2000), 1–33.
Levi, M.; K. Li; and F. Zhang. “Deal or No Deal: Hormones and the M&A Game.” Working Paper,University of British Columbia (2009).
Loughran, T., and A. Vijh. “Do Long-Term Shareholders Benefit from Corporate Acquisitions?”Journal of Finance, 52 (1997), 1765–1790.
Malmendier, M., and G. Tate. “Does Overconfidence Affect Corporate Investment? CEO Overconfi-dence Measures Revisited.” European Financial Management, 11 (2005), 649–659.
Malmendier, M., and G. Tate. “Who Makes Acquisitions? CEO Overconfidence and the Market’sReaction.” Journal of Financial Economics, 89 (2008), 20–43.
Miller, A., and J. Hoffman. “Risk and Religion: An Explanation of Gender Differences in Religiosity.”Journal for the Scientific Study of Religion, 34 (1995), 63–75.
Morck, R.; A. Shleifer; and R. W. Vishny. “Do Managerial Objectives Drive Bad Acquisitions?”Journal of Finance, 45 (1990), 31–48.
Osoba, B. “Risk Preferences and the Practice of Religion: Evidence from Panel Data.” Working Paper,West Virginia University (2003).
Paredes, T. A. “Too Much Pay, Too Much Deference: Behavioral Corporate Finance, CEOs and Cor-porate Governance.” Florida State University Law Review, 32 (2005), 673–762.
Petersen, M. “Estimating Standard Errors in Finance Panel Data Sets: Comparing Approaches.”Review of Financial Studies, 22 (2009), 435–480.
Rau, P. R., and T. Vermaelen. “Glamour, Value, and the Post-Acquisition Performance of AcquiringFirms.” Journal of Financial Economics, 49 (1998), 223–253.
Roll, R. “The Hubris Hypothesis of Corporate Takeovers.” Journal of Business, 59 (1986), 197–216.Stulz, R., and R. Williamson. “Culture, Openness and Finance.” Journal of Financial Economics,
70 (2003), 313–349.