Embed Size (px)
Citation preview

VEA
Central Solar Water Heating SystemsDesign Guide
7th Annual Workshop“Energy Efficient Technologies for Government Buildings”
Las Vegas, NV 28 January 2011

Session Outline• Alexander Zhivov, ERDC - Introduction, Guide scope and purpose • Alfred Woody, VEA - Design Guide approach/structure • Andy Walker, NREL - Solar irradiation in the USA, utility rates and
SHW systems cost effectiveness and maps • Gerhard Stryi-Hipp, ISE - Flat plate collectors, heat transfer fluids,
freeze protection, stagnation • Rolph Meissner, Paradigma - Evacuated tube collectors and their
application to large scale systems • Franz Mauthner, AEE - Solar supported district heating network with
direct interconnection; central SHW system elements and specifics• Ole Pilgaard, ARCON/Hellidyne - Large scale systems case studies
from Denmark • Harald Blazek, SOLID - Large scale systems case studies from Austria • Stephan Richter, GEF - Integration of Solar Hot Water generation in
district systems, analysis of different options for Army installations • Dieter Neth, Senergy - Solar Water systems applications for Army
installations, payback calculation-results•

Objective
Develop design specs and guidelines for solar water heating systems for the Army and other government agencies’ building clusters with significant usage of DHW (e.g., barracks, dining facilities, CDC, hospitals, Gyms) operating in combination with central heating systems to meet EISA 2007 SEC. 523 requirement: “if lifecycle cost-effective, as compared to other reasonably available technologies, not less than 30 percent of the hot water demand for each new Federal building or Federal building undergoing a major renovation be met through the installation and use of solar hot water heaters.’’
This guide is not intended for single residential buildings or clusters with the solar filed area less than 2000 ft2

System Scale

Sponsors
Installations Management Command, HQ US Army Corps of Engineers, HQ US Department of Energy, FEMP

Guide Outline
Solar Energy Solar Hot Water Collector Ssystem DID Installation Solar Hot Water Applications Design Considerations Appendix A: Solar Hot Water Case Studies (FPC-16, ETC-
12, HTC-2) Appendix B: Examples of design options (Fort Bliss / Fort
Bragg) Appendix C: Market Price Scenario Europe – Climate
related Economic Comparisons of Solar Systems Appendix D: Sample SRCC Rating Page

13,5 m2 (~140 ft2) gross area (12,5 m2 /~130 ft2/ absorber area)
High performance collector Antireflective glass High solar transmittance glass 75 mm back side insulation 30 mm side insulation FEP foil Selective cu/al absorber
HT-U version without foil
Large Plate Collectors - Designed for larges and midsized system

Evacuated tubes form a hermetically sealed space that is vacuum insulated. The outer surface of the inner tube is coated with a highly efficient, environmentally friendly absorber coating. The inner tube becomes hot while the outer enclosing tube remains cold.
Compound Parabolic Concentrator concentrates direct and diffuse sunlight onto the absorber from almost all directions and increases the efficiency of the tube collector.
Evacuated Tube Collectors

15 large scale plants for district heating approx. 100.000m2
European Large Scale Solar Water Heating Systems
Rang Name Country Size Built by Year
1 Marstal Denmark 18.300 ARCON 1996/02
2 Kungälv Sweden 10.000 ARCON 2000
3 Gram Denmark 10.000 ARCON 2009
4 Broager Denmark 10.000 ARCON 2009
5 Brædstrup Denmark 8.000 ARCON 2007
6 Strandby Denmark 8.000 ARCON 2008
8 Nykvarn Sweden 7.500 Scan solar 1984
7 Tørring Denmark 7.300 SUNMARK 2009
9 Sønderborg Denmark 6.000 SUNMARK 2008
10 Solar Graz Austria 5.600 SOLID 2006

Started in the mid 80’ties in Denmark and Sweden
First demonstration projects with subsidy Sweden and especially Denmark have
extensive use of district heating In Denmark many local networks (+500) 60 % of all houses are connected to district
heating
History of Solar District Heating
Location Year Size
Nykvern (S) 1984 7.500 m2
Saltum (DK) 1988 1.000 m2
Ingelstad (S) 1988 1.000 m2
Flakenberg (S) 1989 5.500 m2
Saltum District heating, 1988
Falkenberg, 1989

Still mainly Denmark and Sweden Other markets are starting up (Germany)
Demonstration and testing in the 90’s
Location Year Size
Nykvern (S) 1990 3.500 m2
Tibberupvænget (DK) 1990 1.025 m2
Otterupgaard(DK) 1994 560 m2
Højslev skole (DK) 1994 375 m2
Marstal (DK) 1996 8.000 m2
Wiggenhausen (D) 1996 2.400 m2
Ærøskøbing(DK) 1998 2.000 m2
Ry (DK) 1999 3.000 m2
Ry Fjernvarme, 1999
Marstal Fjernvarme, 1996
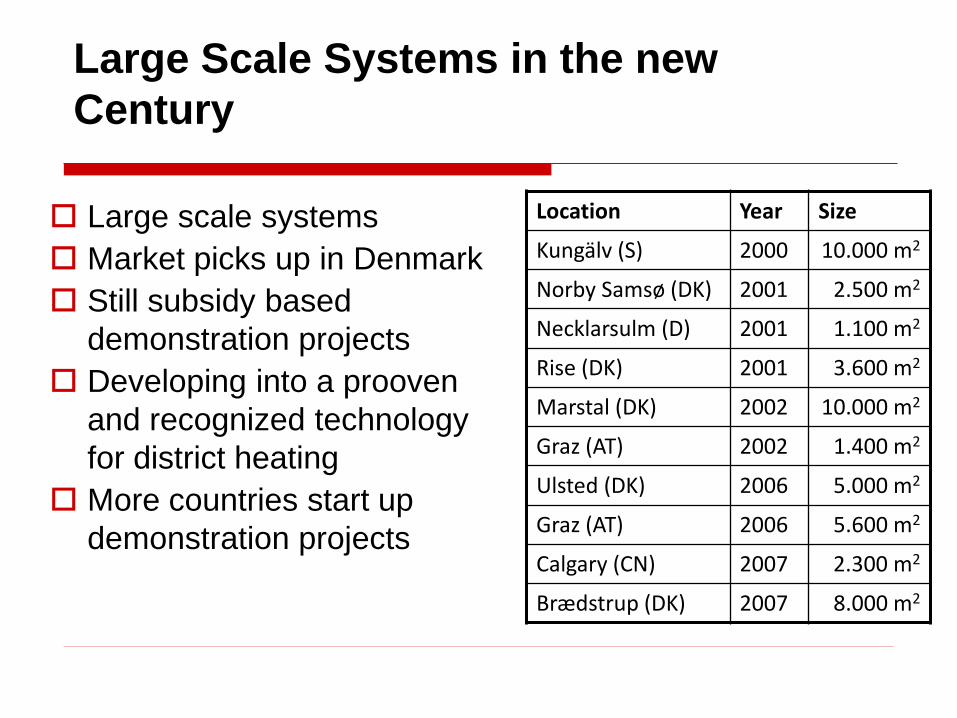
Large scale systems Market picks up in Denmark Still subsidy based
demonstration projects Developing into a prooven
and recognized technology for district heating
More countries start up demonstration projects
Large Scale Systems in the new Century
Location Year Size
Kungälv (S) 2000 10.000 m2
Norby Samsø (DK) 2001 2.500 m2
Necklarsulm (D) 2001 1.100 m2
Rise (DK) 2001 3.600 m2
Marstal (DK) 2002 10.000 m2
Graz (AT) 2002 1.400 m2
Ulsted (DK) 2006 5.000 m2
Graz (AT) 2006 5.600 m2
Calgary (CN) 2007 2.300 m2
Brædstrup (DK) 2007 8.000 m2

District heating – Beyond testing Solar has become a recognized technology for
district heating Working on commercial terms with-put subsidy
in Denmark
Standard Solar Thermal Systems Combined with District Heating Technology in Denmark
Location Year Size
Hillerød (DK) 2008 3.000 m2
Strandby (DK) 2008 8.000 m2
Sønderborg (DK) 2008/9 6.000 m2
Tørring (DK) 2009 7.500 m2
Gram (DK) 2009 10.000m2
Broager (DK) 2009 10.000m2
Andritz (AT) 2009 3.800 m2
Ærøskøbing (DK) 2009 2.200 m2
Strandby, 2008
Hillerød, 2008
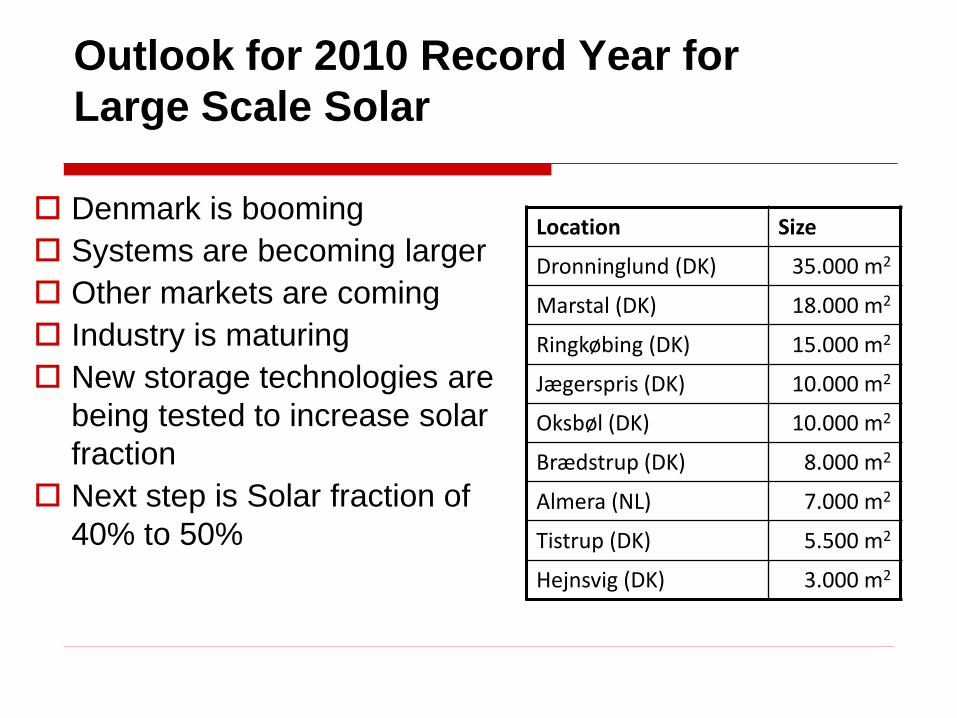
Denmark is booming Systems are becoming larger Other markets are coming Industry is maturing New storage technologies are
being tested to increase solar fraction
Next step is Solar fraction of 40% to 50%
Outlook for 2010 Record Year for Large Scale Solar
Location Size
Dronninglund (DK) 35.000 m2
Marstal (DK) 18.000 m2
Ringkøbing (DK) 15.000 m2
Jægerspris (DK) 10.000 m2
Oksbøl (DK) 10.000 m2
Brædstrup (DK) 8.000 m2
Almera (NL) 7.000 m2
Tistrup (DK) 5.500 m2
Hejnsvig (DK) 3.000 m2

Why to combine SHW with district heating ?
• Most cost effective application of Solar Thermal Energy
• Investment of 25% to 50% of one family house systems
• High annually yield possible ( > 500 kWh/m2 annually)
• Low fixed energy costs (down to approx. 25 EUR/MWh)
• Proven technology ( +20 years in operation )
• Easy to implement
• Easy to operate
• Minimal maintenance
• Solution which can bring large CO2 reduction

Key Factors of a Successful System
• Experienced advisor/planner or Turn-key supplier
• Experienced suppliers
• High performance collectors designed for large scale systems
• Low return temperature in district heating grid (30oC to 40oC is normal in Denmark)
• Optimized control system

System cost and energy Price for Large Scale Solar District Heating
Energy price based on 3% interest rate and 500 kWh/m2 annuallyAll prices are excluding subsidy / grants
System and energy costs of large scale sytems
0
100
200
300
400
500
600
500 1.000 2.000 5.000 8.000 10.000 12.000 15.000 20.000
Plant size in m2
Syst
em c
osts
pr
colle
ctor
area
(US$
/m2 )
30
35
40
45
50
55
60
65
70
Ener
gy c
osts
(US$
/MW
hth)
Complete system costs Energyprice

0
25
50
75
100
125
150
175
200
225
250
275
300
JAN FEB MAR APR MAY JUN JUL AUG SEP OCT NOV DEC
horiz
onta
l irr
adia
tion,
kW
h/(m
² mon
th)
-20
-15
-10
-5
0
5
10
15
20
25
30
35
40
mea
n ou
tsid
e ai
r tem
pera
ture
, °C
G Horizontal_AZ-Phoenix G Horizontal_KS-Topeka G Horizontal_WA-Seattle G Horizontal_AUT-Graz
T Outside_AZ-Phoenix T Outside_KS-Topeka T Outside_WA-Seattle T Outside_AUT-Graz
Monthly climate data for different locationsin the United States and in Graz, Austria