Embed Size (px)
Citation preview
CENTRAL OKANAGAN LAKEFORESHORE INVENTORYAND MAPPING
FINAL REPORT
Fisheries and Oceans Canada
District of Lake Country


CENTRAL OKANAGAN LAKEFORESHORE INVENTORY AND MAPPING
FINAL REPORTOCTOBER 2005
PREPARED BY:
Regional District of Central Okanagan Planning Services Department
Brent G. Magnan, Environmental Technologist
Todd W. Cashin, Environmental Coordinator
A PROJECT FUNDED BY:
Regional District of Central Okanagan, The Real EstateFoundation, The City of Kelowna, Ministry of Environment,Fisheries and Oceans Canada and The District of LakeCountry.


Central Okanagan Foreshore Inventory and Mapping 2005 i
EXECUTIVE SUMMARY
In the summer of 2004, the Regional District of Central Okanagan, in partner-ship with Ministry of Environment, City of Kelowna, District of Lake Country,The Real Estate Foundation and Fisheries and Oceans Canada, conducted adetailed inventory of the foreshore of Central Okanagan Lake. The aim of theproject was to categorize the foreshore according to near shore and upslopecharacteristics such as foreshore morphology, land use, existing riparian con-dition, and anthropogenic alterations. The project used Global PositioningSystem (GPS) technology and detailed digital shoreline video to capture fore-shore characteristics.
The results show that integrity of the foreshore has been compromised by res-idential and urban development, as well as by agriculture, parks, industrial, andcommercial uses. Over half of the foreshore area has been disturbed throughanthropogenic alterations, including lake infilling, beach grooming, shorelinearmouring, riparian vegetation removal, and shoreline development. This hasled to widespread degradation and fragmentation of foreshore habitats thatare relied upon by a variety of aquatic and terrestrial species. Despite theseforeshore impacts, almost half of the foreshore within the study area remainsundisturbed, which presents challenge and opportunity in the management offoreshore habitats.
Kokanee shore-spawning activities on Central Okanagan Lake are commonlyassociated with cliff/bluff and low rocky shore types that have either boulder-or bedrock-dominated substrates. Areas that are not as highly used forspawning include gravel beaches and vegetated shorelines, although limitedspawning does occur in these areas. Most of the recorded spawning locationswere associated with areas characterized as low or moderate disturbancelevel.
The information collected will be provided to local and senior governmentagencies to assist in the management of the foreshore (including adjacentupland) ecosystems. It will aid in developing regulations, standards, policies,education materials, and other management tools and will promote strongcommunity stewardship and awareness. It will also serve as a benchmark foragencies by documenting land use and riparian habitat changes, providing evi-dence for regulatory investigations, and assessing objectives set out in fore-shore protection initiatives. Recommended actions include: developing a fore-shore protection plan, identifying and protecting critical areas, prioritizing activ-ities, addressing modifications and monitoring.
The following report is presented in three parts. Part I summarizes the state ofthe foreshore of Central Okanagan Lake including results, discussion, and rec-ommendations. Part II presents an analysis of the foreshore data in conjunc-tion with existing kokanee shore-spawning data. Part III includes the technicalmethodology, technical recommendations, and detailed descriptions of theforeshore segments.


Central Okanagan Foreshore Inventory and Mapping 2005 ii
This report is the result of a continued belief by many organizations, includingthe Regional District of Central Okanagan, that if sensitive ecosystems are tobe protected, they must first be identified. The project would not have beenpossible without Fisheries and Oceans Canada’s Habitat ConservationStewardship Program and the continued support and guidance of the Ministryof Environment.
We would like to thank the following organizations for making the project a success:
• Fisheries and Oceans Canada helped guide the development of thelakeshore methodology and continue to provide technical support forrelated projects.
• The Ministry of Environment contributed financially, provided boat sup-port for the field component, and provided up-to-date kokanee spawningdata.
• The BC Conservation Foundation provided the boat operator who wasinvaluable for locating historic kokanee shore-spawning locations.
• The City of Kelowna Environment Division contributed financially and pro-vided the services of their Watershed Coordinators to collect data forthe field component.
• The City of Kelowna Parks and Recreation Division provided backupequipment for the project.
• The District of Lake Country contributed financially and provided the ser-vices of their Planning Technician to give local expertise and knowledgeduring the field component of the project.
We would also like to extend a special note of appreciation to the Real EstateFoundation of British Columbia for their generous financial contribution andcontinued support.
This project would not have been possible without the assistance of the following agencies and staff:
• BC Conservation Foundation - Nick Ipatowich.
• City of Kelowna - Mark Watt, Tracy Guidi, Michelle Kam and FredSchaad.
• District of Lake Country - Mike Reiley and Paul Wolanski.
• Fisheries and Oceans Canada - Adrian Wall, Brad Mason, MichaelCrowe, and Bruce Runciman.
• Ministry of Environment - Steve Matthews and Andrew Wilson.
• Regional District of Central Okanagan - Ken Arcuri, Jason Johnson, and Rhodri (Hodge) Keogh.
• Community Mapping Network.
ACKNOWLEDGEMENTS


Principal Authors Brent Magnan, RDCOTodd Cashin, RDCO
Report Editor Rowena Rae, Sumac Writing and Editing
Report Design Jane Ritchie, BigSage Resources
Draft report editorial review and preparation Andrew Wilson, MoE Brad Mason, DFO Bruce Runciman, DFOFred Schaad, City of Kelowna
Project Management Todd Cashin, RDCOBrent Magnan, RDCO
GIS Brent Magnan, RDCO
Cartography Brent Magnan, RDCO
Photos Todd Cashin, RDCO Brent Magnan, RDCOAndrew Wilson, MoE
Field Crew Nick Ipatowich, BCCFTodd Cashin, RDCO Brent Magnan, RDCO Michelle Kam, City of KelownaTracy Guidi, City of KelownaRhodri (Hodge) Keogh, RDCOPaul Wolanski, District of Lake CountryChris McKillican, Digital Spark
Financial and In-kind Contributions Regional District of Central Okanagan The Real Estate Foundation of BCCity of KelownaDistrict of Lake CountryMinistry of Environment BC Conservation FoundationFisheries and Oceans Canada
Recommended Citation Regional District of Central Okanagan, 2005. Okanagan Lake Foreshore Inventory and Mapping: Volume I. Kelowna, BC.
Central Okanagan Foreshore Inventory and Mapping 2005 iii
CONTRIBUTORS

iv Central Okanagan Foreshore Inventory and Mapping 2005
DL Disturbance Level
GIS Geographic Information System
GPS Global Positioning System
Lake Country District of Lake Country
NMEA National Marine Electronics Association
North Westside RDCO North Westside OCP Area
RDCO Regional District of Central Okanagan
OCP Official Community Plan
SHIM Sensitive Habitat Inventory and Mapping
SEI Sensitive Ecosystem Inventory
The City City of Kelowna
TRIM Terrain Resource Information Mapping
Westside RDCO Westside OCP Area
MoE Ministry of Environment
ACRONYMS &ABBREVIATIONS

Central Okanagan Foreshore Inventory and Mapping 2005 v
Beach Grooming The removal of native coarse substrate materi-als within the foreshore, usually to promote ormaintain recreational use of the area.
Carrying Capacity The capacity of a lake to accommodate recre-ational use (e.g., boating, skiing, bathing) andresidential occupation of the foreshore andadjacent upland areas without excessive over-crowding, pollution, and consequent danger tohuman health and safety.
Continuous Retaining Wall A retaining wall that is contiguous over adjacentproperty boundaries and is counted as oneretaining wall.
Discontinuous Retaining Wall A retaining wall that is confined to a single property.
Disturbance Level A subjective measurement, categorized asLow, Medium, or High, of the overall health ofthe foreshore. Disturbance level is based onvisual observations of the foreshore and uplandareas according to disturbance, beach groom-ing, and presence of retaining walls, docks,groynes, and marinas.
Foreshore The part of a shore that lies between the high-est and lowest watermarks.
Marine Railways Railway tracks used to lift boats in and out ofthe water or to adjacent boat houses.
NMEA Output The information transmitted from a marine elec-tronic device to a computer or to other equip-ment. The National Marine ElectronicsAssociation has developed a specification thatdefines the interface between various pieces ofmarine electronic equipment.
Segment Linear section of lake foreshore and adjacentupland area that has similar characteristics,including shore type, substrate, riparian vegeta-tion, land use, modifications, and density ofdevelopment.
Upland The terrestrial area adjacent to the foreshore.
DEFINITIONS


EXECUTIVE SUMMARY . . . . . . . . . . . . . . . . . . . . . . . . . . . . . . . . . . . . . . . . . . . . . . . . . . . . . . . .i
ACKNOWLEDGEMENTS . . . . . . . . . . . . . . . . . . . . . . . . . . . . . . . . . . . . . . . . . . . . . . . . . . . . . .ii
CONTRIBUTORS . . . . . . . . . . . . . . . . . . . . . . . . . . . . . . . . . . . . . . . . . . . . . . . . . . . . . . . . . . . .iii
ACRONYMS AND ABBREVIATIONS . . . . . . . . . . . . . . . . . . . . . . . . . . . . . . . . . . . . . . . . . . . . .iv
DEFINITIONS . . . . . . . . . . . . . . . . . . . . . . . . . . . . . . . . . . . . . . . . . . . . . . . . . . . . . . . . . . . . . . .v
PART I – STATE OF THE FORESHORE
CHAPTER 1 INTRODUCTION . . . . . . . . . . . . . . . . . . . . . . . . . . . . . . . . . . . . . . . . . . . . . . . . . .1
Definition of Foreshore . . . . . . . . . . . . . . . . . . . . . . . . . . . . . . . . . . . . . . . . . . . . . . . . . . . . . .1
Problem Statement . . . . . . . . . . . . . . . . . . . . . . . . . . . . . . . . . . . . . . . . . . . . . . . . . . . . . . . . .1
Background to the Foreshore Inventory and Mapping Project . . . . . . . . . . . . . . . . . . . . . . . . .2
Overview Map of the Study Area . . . . . . . . . . . . . . . . . . . . . . . . . . . . . . . . . . . . . . . . . . . . . . .3
Purpose and Objectives of the Foreshore Inventory and Mapping Project . . . . . . . . . . . . . . . .4
CHAPTER 2 METHODOLOGY . . . . . . . . . . . . . . . . . . . . . . . . . . . . . . . . . . . . . . . . . . . . . . . . . .5
Study Area . . . . . . . . . . . . . . . . . . . . . . . . . . . . . . . . . . . . . . . . . . . . . . . . . . . . . . . . . . . . . . . .5
Field Assessment . . . . . . . . . . . . . . . . . . . . . . . . . . . . . . . . . . . . . . . . . . . . . . . . . . . . . . . . . . .5
Presentation of Results . . . . . . . . . . . . . . . . . . . . . . . . . . . . . . . . . . . . . . . . . . . . . . . . . . . . . .9
Notes to the Data User . . . . . . . . . . . . . . . . . . . . . . . . . . . . . . . . . . . . . . . . . . . . . . . . . . . . .10
CHAPTER 3 RESULTS . . . . . . . . . . . . . . . . . . . . . . . . . . . . . . . . . . . . . . . . . . . . . . . . . . . . . . .11
Physical Characteristics of the Study Area . . . . . . . . . . . . . . . . . . . . . . . . . . . . . . . . . . . . . .11
Area 1: RDCO South Slopes . . . . . . . . . . . . . . . . . . . . . . . . . . . . . . . . . . . . . . . . . . . . . . . . .13
Area 2: City of Kelowna . . . . . . . . . . . . . . . . . . . . . . . . . . . . . . . . . . . . . . . . . . . . . . . . . . . . .15
Area 3: District of Lake Country . . . . . . . . . . . . . . . . . . . . . . . . . . . . . . . . . . . . . . . . . . . . . .17
Area 4: RDCO North Westside OCP Area . . . . . . . . . . . . . . . . . . . . . . . . . . . . . . . . . . . . . .19
Area 5: RDCO Westside OCP Area . . . . . . . . . . . . . . . . . . . . . . . . . . . . . . . . . . . . . . . . . . .21
CHAPTER 4 DISCUSSION . . . . . . . . . . . . . . . . . . . . . . . . . . . . . . . . . . . . . . . . . . . . . . . . . . . .23
State of the Foreshore of Central Okanagan Lake . . . . . . . . . . . . . . . . . . . . . . . . . . . . . . . . .23
Regional Protection . . . . . . . . . . . . . . . . . . . . . . . . . . . . . . . . . . . . . . . . . . . . . . . . . . . . . . . .24
Action Items . . . . . . . . . . . . . . . . . . . . . . . . . . . . . . . . . . . . . . . . . . . . . . . . . . . . . . . . . . . . . .25
CHAPTER 5 CONCLUSION . . . . . . . . . . . . . . . . . . . . . . . . . . . . . . . . . . . . . . . . . . . . . . . . . . .27
CHAPTER 6 RECOMMENDED ACTIONS . . . . . . . . . . . . . . . . . . . . . . . . . . . . . . . . . . . . . . . .29
CHAPTER 7 REFERENCES . . . . . . . . . . . . . . . . . . . . . . . . . . . . . . . . . . . . . . . . . . . . . . . . . . . .33
TABLE OF CONTENTS

PART II: CASE STUDY: KOKANEE SHORE SPAWNING IN CENTRAL OKANAGAN LAKE
CHAPTER 1 INTRODUCTION . . . . . . . . . . . . . . . . . . . . . . . . . . . . . . . . . . . . . . . . . . . . . . . . .35
CHAPTER 2 KOKANEE DATA . . . . . . . . . . . . . . . . . . . . . . . . . . . . . . . . . . . . . . . . . . . . . . . . .37
Notes to the Data User . . . . . . . . . . . . . . . . . . . . . . . . . . . . . . . . . . . . . . . . . . . . . . . . . . . . .37
CHAPTER 3 RESULTS . . . . . . . . . . . . . . . . . . . . . . . . . . . . . . . . . . . . . . . . . . . . . . . . . . . . . . .39
CHAPTER 4 DISCUSSION . . . . . . . . . . . . . . . . . . . . . . . . . . . . . . . . . . . . . . . . . . . . . . . . . . . .41
CHAPTER 5 REFERENCES . . . . . . . . . . . . . . . . . . . . . . . . . . . . . . . . . . . . . . . . . . . . . . . . . . . .43
PART III: TECHNICAL ADDENDUM
CHAPTER 1 TECHNICAL METHODOLOGY . . . . . . . . . . . . . . . . . . . . . . . . . . . . . . . . . . . . . .45
Sources . . . . . . . . . . . . . . . . . . . . . . . . . . . . . . . . . . . . . . . . . . . . . . . . . . . . . . . . . . . . . . . . .45
Pre-field Assessment . . . . . . . . . . . . . . . . . . . . . . . . . . . . . . . . . . . . . . . . . . . . . . . . . . . . . . .45
Field Assessment . . . . . . . . . . . . . . . . . . . . . . . . . . . . . . . . . . . . . . . . . . . . . . . . . . . . . . . . . .45
Data Management . . . . . . . . . . . . . . . . . . . . . . . . . . . . . . . . . . . . . . . . . . . . . . . . . . . . . . . . .46
Database Development and Refinement . . . . . . . . . . . . . . . . . . . . . . . . . . . . . . . . . . . . . . . .47
Quality Control . . . . . . . . . . . . . . . . . . . . . . . . . . . . . . . . . . . . . . . . . . . . . . . . . . . . . . . . . . . .48
CHAPTER 2 TECHNICAL RECOMMENDATIONS . . . . . . . . . . . . . . . . . . . . . . . . . . . . . . . . . .49
Methodologies . . . . . . . . . . . . . . . . . . . . . . . . . . . . . . . . . . . . . . . . . . . . . . . . . . . . . . . . . . . .49
Digital Video . . . . . . . . . . . . . . . . . . . . . . . . . . . . . . . . . . . . . . . . . . . . . . . . . . . . . . . . . . . . . .49
CHAPTER 3 SEGMENT DESCRIPTIONS . . . . . . . . . . . . . . . . . . . . . . . . . . . . . . . . . . . . . . . . .51
Area 1: RDCO South Slopes (segments 1-3) . . . . . . . . . . . . . . . . . . . . . . . . . . . . . . . . . . . .51
Area 2: City of Kelowna (segments 4-55) . . . . . . . . . . . . . . . . . . . . . . . . . . . . . . . . . . . . . . .53
Area 3: District of Lake Country (segments 56-86) . . . . . . . . . . . . . . . . . . . . . . . . . . . . . . . .65
Area 4: RDCO North Westside OCP Area (segments 87-138) . . . . . . . . . . . . . . . . . . . . . . .71
Area 5: RDCO Westside OCP Area (segments 139-165) . . . . . . . . . . . . . . . . . . . . . . . . . . .85
CHAPTER 4 REFERENCES . . . . . . . . . . . . . . . . . . . . . . . . . . . . . . . . . . . . . . . . . . . . . . . . . . . 91
TABLESTable 1. Land use adjacent to the foreshore . . . . . . . . . . . . . . . . . . . . . . . . . . . . . . . . . . . . . .6Table 2. Predominant shore types as defined by the Resources Inventory Committee (1999) .6 Table 3. Foreshore conditions . . . . . . . . . . . . . . . . . . . . . . . . . . . . . . . . . . . . . . . . . . . . . . . . .7Table 4: Foreshore modifications . . . . . . . . . . . . . . . . . . . . . . . . . . . . . . . . . . . . . . . . . . . . . . .8Table 5: Disturbance level . . . . . . . . . . . . . . . . . . . . . . . . . . . . . . . . . . . . . . . . . . . . . . . . . . . .8Table 6: Total disturbed and natural shoreline for the Central Okanagan Lake study area . . .11
APPENDICES Appendix A – Key to Lakeshore DatabaseAppendix B – Database Hardcopy Appendix C – Video Documentation (DVD) Appendix D – Photo Documentation, Arcview Shapefiles and field survey forms (CD) Appendix E – Summary Maps 1-4 of Study Area Appendix F – Summary Map of Kokanee Spawning Locations Appendix G – Data Tables Corresponding to Figures 2-28 in Parts I and II

CENTRAL OKANAGAN LAKEFORESHORE INVENTORY AND MAPPING
PART ISTATE OF THE FORESHORE

REPORT PREPARED BY Regional District of Central Okanagan Planning Services DepartmentBrent G. Magnan, Environmental TechnologistTodd W. Cashin, Environmental Coordinator
A PROJECT FUNDED BY Regional District of Central Okanagan, The Real Estate Foundation, The City of Kelowna, Ministry of Environment and The District of Lake Country.

Central Okanagan Foreshore Inventory and Mapping 2005 PART I: State of the Foreshore 1
The Okanagan Valley has long been the focal point of southern BritishColumbia for residents and tourists. The uniqueness of the landscape, mild cli-mate, and scenic nature have made it a place of social, recreational, econom-ic, and environmental importance. Of particular importance, and the focus ofthis report, is the link between the aquatic and terrestrial environments alongOkanagan Lake. The foreshore – the part of the shore between the high andlow watermarks – has significant biological, ecological, and social significanceto residents of the Okanagan Basin (human and otherwise) and is extremelysensitive to disturbance. Foreshore ecosystems function upon intricate rela-tionships to provide living space for permanent and transitory species and tosupport primary production and food webs (Batelle, 2001). Many provinciallylisted threatened and endangered species rely on these ecosystems through-out the Okanagan Valley (BC Species and Ecosystems explorer, 2005). Theability of these ecosystems to maintain function is often determined by their rel-ative stability and resiliency to disturbance (Smith, 1992).
Historically, the long-term effects of foreshore disturbance were not well under-stood, resulting in inadequate protection, a cumulative loss of foreshore habi-tats, and ultimately, public and agency frustration over management of the fore-shore. There are numerous reasons for such widespread frustration: the diffi-cult task of coordinating a large-scale effort in managing resources over multi-ple jurisdictions and agencies; lack of inter-agency cooperation and programintegration; limited funding resources; and limited consequences for foreshoredegradation. These challenges often lead to further frustration by landowners,developers, and government staff alike. Foreshore ecosystems in theOkanagan continue to be the subject of development pressure, which furthercompromises ecosystem functions. The lack of comprehensive information onforeshore ecosystem relationships makes foreshore management difficult.
The Central Okanagan has become the most heavily urbanized area in mainlandBritish Columbia outside the Lower Mainland. A steady influx of people isstraining the capacity of land and water resources to meet human demandthroughout the valley, with the greatest pressures being experienced in urbancentres along Okanagan Lake. Degradation of water quality and declining waterquantity throughout the Okanagan basin have been attributed to increasedurbanization (and agricultural land use), but there is little likelihood of reprieveas the population continues to grow. Some of the areas most sensitive tourbanization are those located along the foreshore of Okanagan Lake. Red-list-ed ecosystems such as the black cottonwood–water birch plant association(BC Species and Ecosystems Explorer, 2005) support a wide variety of threat-ened and endangered species, such as the yellow breasted chat, and are oftencritical to the completion of species’ life cycles.
Chapter 1 INTRODUCTION
Definition of Foreshore
The foreshore is defined here as thepart of the shore that lies between the highest and lowest watermarkson a given water body.
Problem Statement

2 PART I: State of the Foreshore Central Okanagan Foreshore Inventory and Mapping 2005
Regionally, foreshore degradation on Okanagan Lake is difficult to manage. Ingeneral, only high priority foreshore modifications and disturbances are inves-tigated by governing agencies because of a lack of coordinated inter-govern-mental foreshore protection policies and reduced staffing and funding levelsfor enforcing violations. Public education has long been a priority in the man-dates of resource managers at all levels of government, yet public awareness,understanding, and involvement in foreshore protection issues are persistent-ly low. In addition, incentives for foreshore protection are also lacking.
One of the greatest challenges to changing past practices is found in the vary-ing degree of scientific information and expertise that resides in agenciesresponsible for foreshore management. Where information does exist, it isoften limited in detail, scope, availability, and comprehensiveness, making itexceedingly difficult for resource managers to make educated, informed deci-sions on a local scale. It has become apparent that a coordinated approach iscritical if foreshore ecosystems are to be preserved for future generations.
In response to the continual increase in foreshore development alongOkanagan Lake and to address the current lack of foreshore data, theRegional District of Central Okanagan (RDCO) initiated the Central OkanaganLake Foreshore Inventory and Mapping Project in 2004.
The geographic area of the project was defined by the RDCO boundaries,within which the priority areas of partner agencies were inventoried andmapped. Thus, the study area included priority areas of the RDCO, the Cityof Kelowna, the District of Lake Country, and the Ministry of Environment(Figure 1, Study Area Map on following page). The priorities of MoE includethe historic and recent occurrences of kokanee shore-spawning locations onOkanagan Lake. The north end of the lake, and the southern basin were notincluded in the study area.
The RDCO Planning Services Department is turning its focus toward thedevelopment of regulations, guidelines, education, and other managementtools to protect habitats and species in settlement areas. For example, recentdevelopment has prompted the RDCO to identify aquatic and terrestrial devel-opment permit areas.
The goal of these areas is to protect sensitive habitats by requiring develop-ers to follow specified policies and guidelines when working within the devel-opment permit areas (RDCO, 2004). The development permit areas weredelineated based on the Sensitive Habitat Inventory and Mapping (SHIM)(Mason and Knight, 2001) and Sensitive Ecosystem Inventory (SEI) (Iversonand Cadrin, 2003), projects undertaken by the RDCO.
The SHIM mapping has been successful in accurately documenting sensitivehabitats throughout the Central Okanagan, but it focused largely on streamand riparian corridors, whereas the SEI mapping documents sensitive terres-trial habitats. To augment the SHIM project, provide further information forrefining the development permit areas, and to better manage foreshore habi-tats, the RDCO began applying SHIM methodologies to lakes.
Beginning in 2002, the RDCO was instrumental in developing ForeshoreInventory and Mapping methodology with the aid of Fisheries and OceansCanada. This methodology was first used on Osoyoos Lake and has beenunder revision following similar projects on Christina and Kootenay lakes.
Problem Statementcont’d
Background to theForeshore Inventory &Mapping Project
A coordinated approach is critical ifforeshore ecosystems are to be preserved for future generations.

Central Okanagan Foreshore Inventory and Mapping 2005 PART I: State of the Foreshore 3
Figure 1.
Overview of Study Area
�
�����
���������
������
��
�����������
��
�����������
���������
���������
���������
���� ��
������������
���������
���!����
������������
������
������������
��"���
����
�������
#�����
��$%
���������
����������
���&����'����
����
�� (�'���������
)��*!+�
�
Stu
dy A
rea
Adm
inis
trat
ive
Bou
ndar
ies
Roa
ds
TR
IM S
trea
ms

4 PART I: State of the Foreshore Central Okanagan Foreshore Inventory and Mapping 2005
The Central Okanagan Foreshore Inventory and Mapping Project is intendedto address objectives established by regional strategies on the basis of scien-tific evaluations and site-specific data compiled through the project. A numberof local, regional, provincial, and federal documents were reviewed during thisinventory, including but not limited to the following:
• Regional Growth Management Strategy
• Okanagan Lake Action Plan
• Okanagan Shuswap Land Resource Management Plan
The objectives found in these strategies are the foundation of the project andwill guide the discussion and recommendations sections at the end of thisdocument.
The purpose of the Central Okanagan Lake Foreshore Inventory and Mappingproject is to provide baseline information for future decision-making aboutdevelopment of the central Okanagan Lake foreshore. The project is intendedto help partnering agencies identify the ecological condition of the foreshore,evaluate resource values, and explore conservation and restoration opportu-nities associated with lakeshore habitats. The information will be useful forlocal, regional, provincial, and federal organizations when addressing develop-ment issues related to foreshore sensitivity.
The project will also provide agencies with an easily accessible inventory ofland use, shore type, existing riparian condition, and anthropogenic alterationsalong central Okanagan Lake. It will aid in developing land use policies, regu-lations, and standards and is intended to increase long-term environmentalplanning capabilities for the protection of aquatic and riparian habitat withinexisting local government land use planning programs. The project will serveas a benchmark for regulatory agencies by documenting current foreshorecondition, and it will also provide evidence for regulatory investigations and willassess objectives set out in foreshore protection initiatives.
The objectives of this project are to:
• provide an overview of foreshore habitat condition on central OkanaganLake;
• inventory foreshore morphology, land use, riparian condition, andanthropogenic alterations on central Okanagan Lake;
• obtain spatially accurate digital video of the shoreline of centralOkanagan Lake, made available through a Geographic InformationSystem (GIS);
• develop an easily accessible GIS database on the ecological integrity ofthe central Okanagan Lake foreshore;
• collect information that will aid in prioritizing critical areas for conserva-tion and/or protection;
• make the information available to planners, politicians, and other keyreferring agencies that review applications for land developmentapproval.
Purpose of theForeshore Mapping &Inventory Project
Objectives of theForeshore Mapping &Inventory Project

Central Okanagan Foreshore Inventory and Mapping 2005 PART I: State of the Foreshore 5
The study area includes 121 km of central Okanagan Lake foreshore within theRDCO in the Southern Interior of British Columbia. The area encompassesboth sides of Okanagan Lake from Okanagan Mountain Provincial Park (to thesouth) to the RDCO boundary (to the north) (Figure 1, opposite). The studyarea includes the administrative boundaries of the District of Lake Country(Lake Country), the City of Kelowna (City), the RDCO Westside OCP Area(Westside), the RDCO North Westside OCP Area (North Westside), and anadditional 7.5 km section of shoreline on the South Slopes between OkanaganMountain Provincial Park and the City boundary. Data were also collected forTsinstikeptum First Nations lands I.R. #9 and I.R. #10; however, these are notsummarized as part of the results.
Throughout the study area, segments of 100-2600 m were identified accordingto foreshore morphology. The inventory and mapping results from these seg-ments are summarized in Part I of the report for each of five administrativeareas (RDCO Westside OCP Area, RDCO North Westside OCP area, RDCOSouth Slopes, District of Lake Country and City of Kelowna). Part III includesa detailed description of each segment and provides a summary of the ecolog-ical and social importance of specific segments of the foreshore.
Note: The segments are based on shoreline morphology and may straddleadministrative boundaries.
Field assessments were conducted on June 22, 23, 24, and 25, 2004 aboardthe Nerka K (MoE – Okanagan Lake Action Plan sampling boat). The surveyteam followed the shoreline from an optimal distance of 60 m and at a speedof 4 knots. The entire shoreline was recorded using digital video. A GPS unitwas used to delineate foreshore segments, which are contiguous sections ofshoreline that are determined by similar foreshore characteristics including landuse designation adjacent to the foreshore, shore type, foreshore condition andmodifications, and disturbance level (see Tables 1-5, on the following pages,for detailed descriptions). All of the information collected was input into thefinal database via field cards and the GPS unit.
There are no land use definitions consistent across all jurisdictions in the studyarea. The land uses that were recorded for this project (Table 1) were obtainedfrom local zoning bylaw maps and cross-referenced into the database. Landuse designations determine the type of activity that may occur on the land, witheach designation having different effects on the land.
Study Area
Chapter 2METHODOLOGY
Field Assessment
City of Kelowna (right) and WestsideOCP area (left) comprise almost half ofthe study area.Photo: B. Magnan

6 PART I: State of the Foreshore Central Okanagan Foreshore Inventory and Mapping 2005
Table 1.
Land use adjacent to the foreshore
Table 2.
Predominant shore types asdefined by the ResourcesInventory Committee(1999a)
Land Use Designation Purpose
Institutional To accommodate administrative, institutional, and serviceuses.
CrownTo accommodate forest and resource management uses onlarge parcels that are generally within the Forest LandReserve.
Industrial To accommodate industrial activities.
AgriculturalTo accommodate agricultural operations and related activi-ties on parcels that are usually located on the AgriculturalLand Reserve.
Commercial To accommodate a mix of commercial, retail, recreation,and service uses primarily intended for Town Centre areas.
Park To accommodate active recreation, community oriented cul-tural centres, and some associated uses.
Urban Residential To accommodate varied density residential use with some associated uses.
RuralTo accommodate agricultural and rural uses on parcels thatare 0.5 ha or greater and located outside the AgriculturalLand Reserve.
Shore Type Description
Cliff/Bluff Adjacent to steeper slopes, usually indicating a steep-sidedlake basin or sudden drop-off.
Sand Beach Often associated with alluvial fans or other shoreline depo-sition areas.
Gravel Beach
Often associated with low gradient foreshore, coves withpockets of riparian vegetation among steeper hillsides, oralluvial fans. Often associated with low gradient foreshore,coves with pockets of riparian vegetation among steeperhillsides, or alluvial fans.
Vegetated ShorelineCharacters of undisturbed foreshore with narrow litoralwidth. Vegetation is commonly shrubs and small trees.Overhanging vegetation occurs to the mean water level.
Low Rocky Shore Cobble, boulder, or bedrock substrate often prevalentalong the base of steeper shorelines.
WetlandCharacteristic of wide littoral zones with fine substrates promoting abundant emergent vegetation such as sedges,reeds, and cattails.

Central Okanagan Foreshore Inventory and Mapping 2005 PART I: State of the Foreshore 7
Table 3.
Foreshore Conditions Condition Description
Natural Shoreline is unmodified.
Disturbed Foreshore has been modified through human alteration.
Cliff/bluff Vegetated Shore
Sand Beach Low Rocky Shore
Wetland Gravel beach
Table 2.
Examples of predominantshore types.Photos: T. Cashin

Disturbance Level Description
Low
Segments that show little or limited signs of foreshore distur-bance and impacts. These segments exhibit healthy, functioningriparian vegetation. They have substrates that are largely undis-turbed, limited beach grooming activities, and no to few modi-fications.
Medium
Segments that show moderate signs of foreshore disturbanceand impacts. These segments exhibit isolated, intact, function-ing riparian areas (often between residences). Substrates (where disturbed) exhibit signs of isolated beachgrooming activities. Retaining walls (where present) are gener-ally discontinuous. General modifications are well spaced anddo not impact the majority of the foreshore segment.
High
Segments that show extensive signs of disturbance andimpacts. These segments exhibit heavily disturbed riparian veg-etation, often completely removed or replaced with non-nativespecies.Modifications to the foreshore are extensive and likely continu-ous or include a large number of docks. Generally, residentialdevelopment is high intensity. Modifications often impact amajority of the foreshore.
8 PART I: State of the Foreshore Central Okanagan Foreshore Inventory and Mapping 2005
Table 5.
Disturbance level
As a method of qualifying the overall health of the foreshore, each segment wasassigned a value describing disturbance level (DL). The DL is a qualitative mea-surement of the overall health of the foreshore and can be categorized as Low,Medium, or High (Table 5). The DL is based on visual observations during theassessment, including attributes from the database such as percent disturbed,retaining wall number and type, docks per kilometre, groynes per kilometre,beach grooming, and presence of marinas.
Table 4.
Foreshore modificationsModifications Description
Docks Long, narrow structures stretching into a body of water.
Retaining Walls Structural walls with the primary function of supporting soil frombehind or any caused by wave action.
Groynes Protective structures of stone or concrete that extend from shoreinto the water to prevent a beach from washing away.
Boat Launches Sections of foreshore dedicated to launching boats and removing boats with vehicles.
Marine Railways Railway tracks used to lift boats in and out of the water or toadjacent boat houses.
Marinas Harbours specially designed to moor a collection of boats.

Central Okanagan Foreshore Inventory and Mapping 2005 PART I: State of the Foreshore 9
The report is presented in three parts. Part I contains an overall summary ofresults for the study area and individual summaries for each of the five adminis-trative areas. Individual data were not summarized for Tsinstikeptum I.R. #9 andI.R. #10. Part II contains a case study highlighting the relationship between exist-ing kokanee spawning locations and the foreshore data collected as a part ofthis project. Part III contains technical methods, technical recommendations,and detailed descriptions of each segment.
Appendices contain the following information:
Appendix A: A key to the field headings in the Arcview foreshoredatabase.
Appendix B: A hard copy of the database.
Appendix C: Video documentation of the shoreline (on DVD).
Appendix D: Photo documentation, Arcview shapefiles for the foreshoreand kokanee spawning databases, and field site cards for each segment (all on CD-ROM).
Appendix E: Foreshore summary maps showing segment locations andcharacteristics.
Appendix F: Summary map of kokanee spawning locations.
Appendix G: Data tables with details for all figures presented in Part I.
Presentation of Results
Disturbance Level: High Disturbance Level: Medium Disturbance Level: Low
Table 5.
Examples of Disturbance LevelsPhotos: T. Cashin
10 PART I: State of the Foreshore Central Okanagan Foreshore Inventory and Mapping 2005
The information in this report is intended to provide an overview of the stateof the foreshore of central Okanagan Lake within the RDCO boundaries. Touse the information appropriately, it is important to recognize the conditionsunder which the data were collected and the situations in which the informa-tion is intended to be applied. The data are intended to aid in the managementof foreshore ecosystems on a broad scale and do not preclude the need forsite-specific visits to detail or clarify the information contained herein. The fol-lowing describes the conditions under which the dataset was compiled. Theuser should understand these conditions when determining the applicability ofthe dataset to specific circumstances.
• The data were collected from a boat. Percentages (e.g., % disturbed)were based on visual observations of field personnel and are esti-mates rather than direct measurements. For example, a number like80% disturbed is an estimated percentile rather than a physical mea-surement of the length of disturbed foreshore within the segment.
• Segment breaks have been interpolated from GPS locations ontoexisting Terrain and Resource Information Management (TRIM) linework with the aid of local cadastral and land use maps. Segmentbreak locations are applicable at a large scale only, and may requirefurther refinement at smaller scales.
• Associated maps are intended to be used only at the scale provided(Appendix E and F). See digital shapefile data for more detailed infor-mation and accurate delineation of segments (Appendix D).
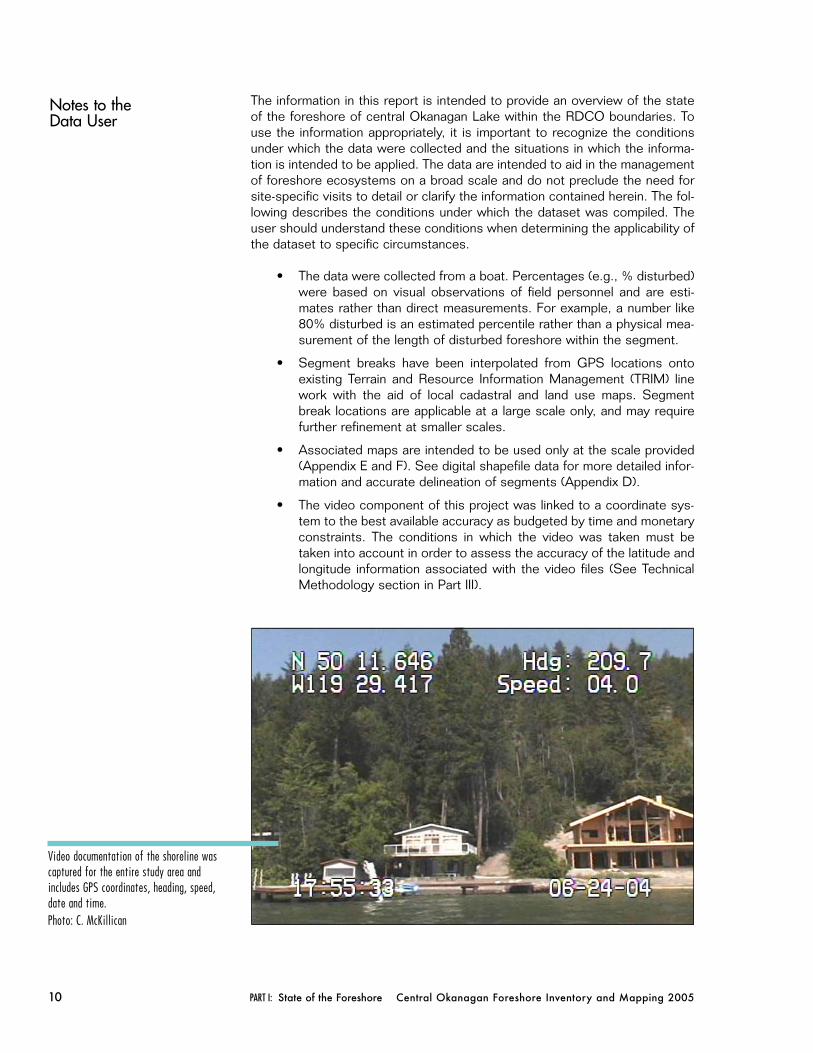
• The video component of this project was linked to a coordinate sys-tem to the best available accuracy as budgeted by time and monetaryconstraints. The conditions in which the video was taken must betaken into account in order to assess the accuracy of the latitude andlongitude information associated with the video files (See TechnicalMethodology section in Part III).
Notes to the Data User
Video documentation of the shoreline wascaptured for the entire study area andincludes GPS coordinates, heading, speed,date and time. Photo: C. McKillican

Foreshore length (m) % of total
Disturbed 63,837 52
Natural 58,049 48
Total foreshore 121,886 100
Central Okanagan Foreshore Inventory and Mapping 2005 PART I: State of the Foreshore 11
In total, 121,886 m of foreshore were surveyed and divided into 165 contigu-ous segments. Less than half of the total foreshore length is in natural condi-tion and more than half is disturbed (Table 6). North Westside and City ofKelowna each have over 35,000 m of foreshore, with natural conditions occur-ring on two-thirds of North Westside’s foreshore and on one third of City ofKelowna’s foreshore (Figure 2). Westside has just over 20,000 m of foreshore,approximately one-third of which remains in natural condition. District of LakeCountry has nearly 18,000 m of foreshore, of which just over half is natural. TheSouth Slopes and Tsinstikeptum areas each have slightly less than 5,000 m intotal. Over 80% of the South Slopes foreshore is natural, while only 2% ofTsinstikeptum foreshore remains in natural condition (Figure 2).
Land use on areas adjacent to the foreshore is primarily rural, with park andurban residential each accounting for 20% (Figure 3). The remaining land usesare commercial, agricultural, industrial, Crown, and institutional, each occupying <10% of adjacent lands.
Shore type is divided among gravel beaches, which represent one-third of theforeshore, and cliff/bluff, sand beach, and vegetated shore, each representingone-fifth of the foreshore (Figure 4). Low rocky shore makes up the bulk of theremaining foreshore, with wetland accounting for <1%. Throughout the studyarea, there are nearly 700 retaining walls and over 1,000 docks for a frequen-cy of nearly 10 docks/km (Figure 5). Additional foreshore modifications include125 groynes, 64 boat launches, 46 marine railways, and 8 marinas.
PhysicalCharacteristics of the Study Area
Chapter 3RESULTS
Table 6.
Total disturbed and natural shoreline for theCentral Okanagan.
0 5,000 10,000 15,000 20,000 25,000 30,000 35,000 40,000
RDCO North Westside OCP
Area
City of Kelowna
RDCO Westside OCP Area
District of Lake Country
RDCO South Slopes
Tsinstikeptum I.R. # 9 and
I.R. #10
Shoreline length (m)
Natural Disturbed
Figure 2.
The length of natural anddisturbed foreshore ineach administrative area.

12 PART I: State of the Foreshore Central Okanagan Foreshore Inventory and Mapping 2005
0 10,000 20,000 30,000 40,000 50,000
Rural (41%)
Urban Residential (20%)
Park (19%)
Commercial (9%)
Agriculture (5%)
Industrial (3%)
Crown (3%)
Institutional (<1%)
Shoreline length (m)
0 5,000 10,000 15,000 20,000 25,000 30,000 35,000 40,000
Gravel Beach (31%)
Cliff/Bluff (22%)
Vegetated Shore (20%)
Sand Beach (16%)
Low Rocky Shore (9%)
Wetland (<1%)
Shoreline length (m)
0
2
4
6
8
10
Docks Retaining
Walls *
Groynes Boat
Launches
Marine
Railways
Marinas
Nu
mb
er
of
str
uctu
res
pe
rkm 1,089
692
12564 46
8
* Retaining walls per km is not accurate representation as length of
retaining wall was not determined.
Numbers above the bars indicate the total number of structures.
Figure 3.
The land use on areas adjacent to the foreshore forthe study area.
Figure 4.
The length of each primaryshore type in the study area.
Figure 5.
Modifications along the foreshore of the study area.

Central Okanagan Foreshore Inventory and Mapping 2005 PART I: State of the Foreshore 13
The RDCO South Slopes area is located on the south side of Okanagan Lakebetween Okanagan Mountain Provincial Park and the City of Kelowna boundary.
Only three segments were surveyed in the South Slopes for a total of 4,909m. Shorelines in this area remain primarily natural as access is limited to theprivately owned large holdings that make up most of the area. The majority ofland use is rural, with some agriculture occurring on flatter sites (Figure 6),accounting for most of the area’s disturbance. The South Slopes area is char-acterized by rocky outcrops and cliff/bluff extending into the lake, with graveland sand beaches in small coves and alluvial fans (Figure 7). The majority ofdisturbance has occurred on gravel beaches (generally alluvial fans) whereslopes are more suitable for building. In addition, this area was substantiallyaffected by the Okanagan Mountain Park fire in 2003, which resulted in loss ofmost of the vegetation. Few modifications exist in this area as most of the fore-shore remains undeveloped (Figure 8). The entire length of the South Slopesarea was categorized as low disturbance level (Figure 9).
AREA 1
RDCO South Slopes
0 1,000 2,000 3,000 4,000 5,000
Rural
Park
Agricultural
Crown
Shoreline length (m)
Natural Disturbed
0 1,000 2,000 3,000
Gravel Beach
Cliff/Bluff
Vegetated Shore
Sand Beach
Low Rocky Shore
Wetland
Shoreline length (m)
Natural Disturbed
Figure 6.
The land use on areasadjacent to the foreshore in RDCO South Slopes.
Figure 7.
The length of each primaryshore type in RDCO SouthSlopes.

14 PART I: State of the Foreshore Central Okanagan Foreshore Inventory and Mapping 2005
0
0.2
0.4
0.6
0.8
1
1.2
1.4
Docks Retaining
Walls *
Groynes Boat
Launches
Marine
Railways
Marinas
1
Numbers above the bars indicate the total number of structures.
6
* Retaining walls per km is not accurate representation as length of
retaining wall was not determined.
Nu
mb
er
of
str
uctu
res
pe
rkm
0
1,000
2,000
3,000
4,000
5,000
6,000
Low Moderate High
100%
Figure 8.
Modifications along theforeshore in RDCO SouthSlopes.
Figure 9.
The disturbance level offoreshore and uplandareas in RDCO SouthSlopes.
Representative foreshore of Area 1South SlopesPhoto: T. Cashin

Central Okanagan Foreshore Inventory and Mapping 2005 PART I: State of the Foreshore 15
The City of Kelowna area is bordered by the RDCO South Slopes to the south-west and the District of Lake Country to the north.
In the City of Kelowna, 52 segments were identified along a total surveyedshoreline of 35,505 m, and 63% of this was found to be disturbed. The major-ity of land along the City of Kelowna foreshore is considered rural, with urbanresidential and park also well represented (Figure 10). Disturbance within theseland uses has occurred primarily in residential and park areas; however, thoselocations with commercial, industrial, and institutional land uses are complete-ly disturbed (Figure 10).
Most of the foreshore within the City of Kelowna is sand beach, coinciding withthe large alluvial fan of Mission Creek (Figure 11). The fan is bordered by steephillsides and rocky slopes to the south and cliff/bluffs to the north. Thecliff/bluff foreshore remains largely undisturbed since most of it falls withinKnox Mountain Park. Areas comprised of sand beach are almost entirely dis-turbed, and as seen in other locations, they are easily developed due to gentlegrades and easily disturbed soils (Figure 11). Numerous modifications havebeen made to the foreshore area, including the building of 392 docks, 241retaining walls, and 4 marinas (Figure 12). Nearly 60% of the City’s foreshorewas categorized as having a high disturbance level (Figure 13).
AREA 2
City of Kelowna
0 2,000 4,000 6,000 8,000 10,000 12,000 14,000 16,000 18,000
Rural
Urban Residential
Park
Commercial
Agricultural
Industrial
Crown
Institutional
Shoreline length (m)
Natural Disturbed
0 5,000 10,000 15,000
Gravel Beach
Cliff/Bluff
Vegetated Shore
Sand Beach
Low Rocky Shore
Wetland
Shoreline length (m)
Natural Disturbed
Figure 10.
The land use on areas adjacent to the foreshore inthe City of Kelowna.
Figure 11.
The length of each primaryshore type in the City ofKelowna.

16 PART I: State of the Foreshore Central Okanagan Foreshore Inventory and Mapping 2005
0
2
4
6
8
10
12
Docks Retaining
Walls *
Groynes Boat
Launches
Marine
Railways
Marinas
Nu
mb
er
of
str
uctu
res
pe
rkm
4171531
241
Numbers above the bars indicate the total number of structures.
392
* Retaining walls per km is not accurate representation as length of
retaining wall was not determined.
0
5,000
10,000
15,000
20,000
25,000
Low Moderate High
Sh
ore
line
len
gth
(m)
27%
15%
58%
Figure 13.
The disturbance level offoreshore and upland areasin the City of Kelowna.
Figure 12.
Modification along theforeshore in the City ofKelowna.
Typical marina and associated development in Areas 2–City ofKelowna.Photo: T. Cashin

Central Okanagan Foreshore Inventory and Mapping 2005 PART I: State of the Foreshore 17
The District of Lake Country is located immediately north of the City ofKelowna and is bordered by the North Okanagan Regional District to the north.
Thirty-one segments were surveyed over a shoreline length of 18,344 m; 45%of this was identified as disturbed. Land use within this area is primarily rural,with additional lands being Crown, urban residential, agricultural, and park(Figure 14). Almost 20% of the area is classified as Crown land, which is fore-shore area that falls within a road right-of-way and remains undisturbed. Mostdisturbance in Lake Country occurs primarily in association with rural, urbanresidential, and agricultural land uses.
Shore types in Lake Country were found to be primarily gravel beach and veg-etated shore, with some cliff/bluff and smaller amounts of low, rocky shore(Figure 15). Nearly 60% of the gravel beach habitat has been disturbed throughdevelopment, while other shore types are disturbed to a much lesser extent.Modifications to the foreshore include 203 docks, 103 retaining walls, 6groynes, 10 boat launches, 13 marine railways, and 1 marina (Figure 16). Thedisturbance level was assessed as being fairly equally split among low, moder-ate, and high categories (Figure 17).
AREA 3 District of LakeCountry
0 2,000 4,000 6,000 8,000 10,000
Rural
Urban Residential
Park
Commercial
Agricultural
Industrial
Crown
Institutional
Shoreline length (m)
Natural Disturbed
0 2,000 4,000 6,000 8,000 10,000
Gravel Beach
Cliff/Bluff
Vegetated Shore
Sand Beach
Low Rocky Shore
Wetland
Shoreline length (m)
Natural Disturbed
Figure 14.
The land use on areasadjacent to the foreshore inthe District of Lake Country.
Figure 15.
The length of each primaryshore type in the District ofLake Country.

18 PART I: State of the Foreshore Central Okanagan Foreshore Inventory and Mapping 2005
0
2
4
6
8
10
12
Docks Retaining
Walls *
Groynes Boat
Launches
Marine
Railways
Marinas
Nu
mb
er
of
str
uctu
res
pe
rkm
Numbers above the bars indicate the total number of structures.
203
103
6 10 13 1
* Retaining walls per km is not accurate representation as length of
retaining wall was not determined.
0
1,000
2,000
3,000
4,000
5,000
6,000
7,000
Low Moderate High
Shore
line
length
(m)
36%35%
29%
Figure 16.
Modifications along the foreshore in the District of Lake Country.
Figure 17.
The disturbance level of foreshore and upland areasin the District of LakeCountry.
Typical shoreline morphology and disturbance in Area 3–District of LakeCountry.Photo: T. Cashin

Central Okanagan Foreshore Inventory and Mapping 2005 PART I: State of the Foreshore 19
The North Westside OCP Area is located on the west side of Okanagan Lakeand is bordered by the North Okanagan Regional District to the north and BearCreek to the south.
Fifty-two segments were surveyed in North Westside over a shoreline length of38,116 m; 36% of this was disturbed. Land use is primarily rural and park, withsome urban residential and commercial lands also represented (Figure 18).Disturbance was found to occur primarily on foreshore areas associated withrural, urban residential, and commercial land uses. Institutional and industrialland uses occurred adjacent to only a small length of shoreline but they wereboth 100% disturbed. The North Westside area has many steep hillsides androck bluffs that extend into the lake, and as a result, development activitiesoccur mainly on flatter sites such as the alluvial fans of Shorts and Whitemancreeks and on low gradient hillsides. Some residential development hasoccurred on benchlands atop steep bluffs, which provide building sites thathave limited potential impact on the foreshore.
Shore type is evenly distributed between cliff/bluff, gravel beach, and vegetat-ed shoreline, with smaller amounts of low rocky shore and sand beach (Figure19). Most of the cliff/bluff and vegetated shores remain natural throughoutNorth Westside, but two-thirds of gravel beach foreshore areas are disturbed,which is largely associated with development of alluvial fans and small covesthroughout the area. Modifications such as docks, retaining walls, and groynes(Figure 20) are found primarily in residential areas, but are also found in areaswith rural, commercial, and institutional land use. Half of North Westside wascharacterized as low disturbance level, with 28% moderate and 22% high dis-turbance (Figure 21).
AREA 4
RDCO NorthWestside OCP Area
0 5,000 10,000 15,000 20,000
Rural
Urban Residential
Park
Commercial
Agricultural
Industrial
Crown
Institutional
Shoreline length (m)
Natural Disturbed
Figure 18.
The land use on areasadjacent to the foreshore in the RDCO North Westside OCP area.
Figure 19.
The length of each primaryshore type in the RDCONorth Westside OCP area.
0 3,000 6,000 9,000 12,000
Gravel Beach
Cliff/Bluff
Vegetated Shore
Sand Beach
Low Rocky Shore
Wetland
Shoreline length (m)
Natural Disturbed

20 PART I: State of the Foreshore Central Okanagan Foreshore Inventory and Mapping 2005
0
1
2
3
4
5
6
7
8
Docks Retaining
Walls *
Groynes Boat
Launches
Marine
Railways
Marinas
268
171
51
15 2
* Retaining walls per km is not accurate representation as length of
retaining wall was not determined.
29
Nu
mb
er
of
str
uctu
res
pe
rkm
Numbers above the bars indicate the total number of structures.
0
5,000
10,000
15,000
20,000
25,000
Low Moderate High
50%
28%
22%
Shore
line
length
(m)
Figure 20.
Modification along the foreshore in the RDCONorth Westside OCP area.
Figure 21.
The disturbance level offoreshore and upland areasin the RDCO NorthWestside OCP area.
Typical foreshore in Area 4–NorthWestside OCP area.Photo: T. Cashin

Central Okanagan Foreshore Inventory and Mapping 2005 PART I: State of the Foreshore 21
The Westside OCP Area is located on the west side of Okanagan Lake acrossfrom the City of Kelowna. It is bordered to the north by the North WestsideOCP area and to the south by the District of Peachland.
In total, 20,420 m of shoreline in 23 segments were assessed in Westside. Ofthis length, 14,480 m or 71% was disturbed. Urban residential is the dominantland use in this area, with park, rural, agricultural, and commercial also well rep-resented (Figure 22). Large portions of alluvial fans in Westside have beenused for residential development or agriculture in the past; recent pressures onthese areas include commercial resort development. Most urban residentialand commercial lands are associated with disturbed foreshore, and over half ofthe foreshore adjacent to park lands is also disturbed. Rural lands have less dis-turbed foreshore.
Foreshore type is dominated by gravel beach, sand beach, and vegetatedshore, corresponding with the alluvial fans of McDougall and Powers creeks(Figure 23). The low gradient alluvial fans are situated between cliff/bluff to thesouth and steep hillsides promoting low rocky shores to the north. The majori-ty of the cliff/bluff remains natural, while gravel beach, sand beach, and lowrocky shore habitats are heavily disturbed. Most foreshore modifications occurin segments zoned residential and include docks, retaining walls, beach groom-ing, and riparian clearing (Figure 24). The majority of shoreline was categorizedas having a high disturbance level (Figure 25).
AREA 5
RDCO Westside OCP Area
0 2,000 4,000 6,000 8,000
Rural
Urban Residential
Park
Commercial
Agricultural
Industrial
Crown
Institutional
Shoreline length (m)
Natural Disturbed
0 2,000 4,000 6,000 8,000
Gravel Beach
Cliff/Bluff
Vegetated Shore
Sand Beach
Low Rocky Shore
Wetland
Shoreline length (m)
Natural Disturbed
Figure 22.
The land use on areas adjacent to the foreshore in the RDCO Westside OCP area.
Figure 23.
The length of each primaryshore type in the RDCOWestside OCP area.

22 PART I: State of the Foreshore Central Okanagan Foreshore Inventory and Mapping 2005
0
2,000
4,000
6,000
8,000
10,000
12,000
14,000
Low Moderate High
Shore
line
length
(m)
22%
13%
65%
0
2
4
6
8
10
12
Docks Retaining
Walls *
Groynes Boat
Launches
Marine
Railways
Marinas
Nu
mb
er
of
str
uctu
res
pe
rkm
338
220
17
1
* Retaining walls per km is not accurate representation as length of
retaining wall was not determined.
Numbers above the bars indicate the total number of structures.
Figure 24.
Modifications along the foreshore in the RDCOWestside OCP area.
Figure 25.
The disturbance level offoreshore and upland areasin the RDCO Westside OCP area.
Typical foreshore modification anddisturbance in Area 5–Westside OCPArea.Photo: T. Cashin

The foreshore (and adjacent upland areas) of central Okanagan Lake haveundergone substantial alteration. Over half of the lake foreshore area studiedhas been disturbed through anthropogenic alterations, which have been direct-ed largely by topography. Areas found to have the highest impacts from devel-opment generally exhibit gentle gradients with fine substrate materials that areeasily moved during development activities. These areas mostly include graveland sand beaches, such as those found on alluvial fans. Areas that are lesseasily disturbed, such as cliff/bluffs, pose access and development constraintsthat lead to more site-specific impacts to the foreshore, such as blasting andfilling.
Land use that occurs on upland areas adjacent to the foreshore has a greatimpact on the type and intensity of foreshore alterations. Residential and urbandevelopment, agriculture, parks, and commercial uses of upland areas have hadthe highest impact on the integrity of the foreshore in the central Okanagan.Land uses such as industrial and institutional were found to promote exception-ally high impact activities, although their incidence is low relative to other landuses. In the North Westside and Westside areas and in the City of Kelowna,percent disturbed values averaged over 90% for both institutional and industri-al land uses. A similar relationship was observed with commercial land uses.While disturbance on rural land use areas was considerably lower than otherland use types, these areas constituted nearly half (40%) of the foreshore with-in the study area. As these areas have the potential for future subdivision and,therefore, increased foreshore impacts, it is imperative that foreshore protec-tion issues associated with land use are adequately addressed by local andregional government planning and approval processes.
Foreshore modifications include lake infilling, beach grooming, shorelinearmouring, construction of foreshore structures (groynes, retaining walls,docks, boat houses, and marine railways), riparian vegetation removal, modifi-cation of the land base (blasting and moving of material for roads or develop-ment activities), and importing substrate materials (usually for recreational pur-poses). Such activities were found to be similar for adjacent propertiesthroughout the study area, especially in areas zoned as urban/residential.
Neighbours tend to conduct similar activities that cause foreshore impacts;where one resident had built a house immediately adjacent to the foreshore,others appeared to do the same. This also occurred with foreshore modifica-tions such as docks, retaining walls, groynes, and imported materials. Suchactivities pose a special challenge to regulatory agencies when dealing withprecedence, consistency, and the manner in which development and redevel-opment are viewed or managed.
For example, property owners are often granted accretion rights through Landand Water BC for accreted land adjacent to Okanagan Lake, even though theaccretion occurred as a result of a man-made structure such as a groyne. Thisis contrary to Regional policy, which states:
Retain land currently in public ownership located next to water (such asstreams and shorelines) and waterbodies (lakes and reservoirs) in public ownership (RDCO, 2004)
Chapter 4DISCUSSION
State of the Foreshore ofCentral Okanagan Lake
Central Okanagan Foreshore Inventory and Mapping 2005 PART I: State of the Foreshore 23

The mandates of Provincial agencies often permit activities that are contraryto regional or local government policy, such as the reconstruction of damagedretaining walls within the high water mark, thereby setting precedent through-out the Central Okanagan.
Foreshore modifications may impact environmental, social, economic, andcommercial values; however, it is often difficult to determine the thresholdbeyond which significant impacts occur. The cumulative effects of theseimpacts are not easily measured, but could be examined by determining car-rying capacity. The carrying capacity of a lake is defined as a lake’s ability toaccommodate recreational use (e.g., boating, skiing, bathing) and residentialoccupation of the foreshore and adjacent upland areas without excessiveovercrowding, pollution, and consequent danger to human health and safety(adapted from NALMS, 2005).
Carrying capacity has many connotations including biological, ecological, andsocial and is an approach by which growth and development may be balancedwith retention of social and environmental values. Carrying capacity is not eas-ily measured and has not been addressed in this study; however, determiningcarrying capacity may be useful in assessing cumulative loss of foreshorehabitats resulting from human disturbance. A measure of successive impactsthat ultimately tip the balance of ecological stasis would be of great value inforeshore management.
Despite many foreshore impacts revealed by this project, half of the foreshorewithin the study area remains undisturbed. The bulk of the undisturbed fore-shore is in the South Slopes, North Westside, District of Lake Country, andoutlying areas of the City of Kelowna. These areas present a unique challengeto governing agencies responsible for balancing unprecedented growth withenvironmental protection. They are key to preserving the remaining intactecosystems that exist along Okanagan Lake.
Intact ecosystems have biological, social, and economic value; the cost ofprotecting such areas may be low compared to the cost of restoring them(Battelle et al., 2001). In addition, the effectiveness of restoration is oftenunclear. For example, most foreshore restoration efforts on Okanagan Lakeare recent and have not been monitored for long-term effectiveness.Challenges are especially formidable when dealing with foreshore protectionissues in areas where long-term visions have not been established, such asthose areas without an Official Community Plan to guide development.
Regional Protection
State of the Foreshoreof Central OkanaganLake cont’d
The foreshore of Knox Mountain Park(photo centre) in the City of Kelownareamins undisturbed.Photo: B. Magnan
24 PART I: State of the Foreshore Central Okanagan Foreshore Inventory and Mapping 2005
Central Okanagan Foreshore Inventory and Mapping 2005 PART I: State of the Foreshore 25
On the contrary, foreshore protection can be equally as challenging in areaswhere long-term visions have been established. As identified, parks within thestudy area constitute almost 20% of the foreshore. Park management strate-gies vary greatly throughout the Central Okanagan and are dictated by the man-dates of the overseeing agencies. Park classifications fall into a continuum fromRegional or Provincial parks (with little disturbance), where natural features aremaintained for the general public, to parks that are categorized as community,neighbourhood, linear, athletic, or waterfront parks, where management differsgreatly between each designation but most of the parks are geared towardrecreation and unimpeded public access.
A clear understanding of regional strategies may guide future decisions andpromote a more coordinated approach to foreshore management among regu-latory agencies. The information presented in this report is consistent with themanagement initiatives set forth in a number of regional strategies, includingthe Regional Growth Management Strategy, the Okanagan Lake Action Plan,and the Okanagan Shuswap Land Resource Management Plan. These strate-gies are key to establishing a regional vision and common goals while consid-ering provincial interests (RDCO, 2002). Action items from these documentsinclude:
1. Planning for development by first knowing what to protect and thendeveloping and using management tools to achieve the desiredlevel of protection (RDCO Regional Growth Strategy – RDCO,2002);
2. Managing water resources to ensure their long-term health and sustainability (RDCO Regional Growth Strategy – RDCO, 2002);
3. Developing protection and restoration plans for shore-spawning habitats and implementing effective shoreline protection andpreservation activities (Okanagan Lake Action Plan – MWLAP,2004); and
4. Conducting inventories of the known salmon watersheds for loca-tions of critical habitat (Okanagan Shuswap Land ResourceManagement Plan – FRBC, 2001).
Using guidance from the regional strategies together with information gainedfrom this inventory, we can begin to identify and prioritize critical habitat areason central Okanagan Lake. A case study example of this is included in Part II ofthis report where we analyze kokanee shore-spawning data alongside the fore-shore condition data. Subsequent efforts should concentrate on protecting crit-ical habitats using tools available in a regional planning environment.
These tools include regional policies, foreshore plans, and foreshore develop-ment guidelines, all of which should be examined and updated to include sci-ence-based policy direction for conservation planning. This direction should beintent on achieving a higher quality of development that preserves the integrityof upland areas and maintains environmental attributes of the foreshore whilefacilitating human use. Other potential tools include public education, which canbe used to curtail the loss of critical habitat on private property, and expandingpartnerships, which can increase local government’s ability to adapt to increas-ing development pressure.
Regional Protectioncont’d
Action items


Central Okanagan Foreshore Inventory and Mapping 2005 PART I: State of the Foreshore 27
The foreshore of central Okanagan Lake is dominated by gravel beach, sandbeach, cliff/bluff, and vegetated shore types. Over half of the foreshore of cen-tral Okanagan Lake has been disturbed by anthropogenic alterations. Historicaldisturbance has resulted in changes to all shore types and particularly in a lossof the majority of wetland habitats. Land use adjacent to the foreshore is dom-inated by rural activities, with moderate amounts of both urban residential andpark space. Most of the disturbance can be characterized by the removal ofnative riparian vegetation and primary modifications including docks, retainingwalls, beach grooming activities, and groynes.
In light of the cumulative foreshore impacts presented, efforts to restore andenhance previously disturbed sites and protect remaining natural areas on cen-tral Okanagan Lake should be put forth collectively by all levels of government.The results of this inventory are intended to increase the effectiveness andcoordination of foreshore management activities on Okanagan Lake, leading toimproved ecosystem structure and function and better integration of humanuse with environmental protection. The dissemination of this material will helppromote a coordinated ecosystem-based approach that is essential to suc-cessful foreshore management. In order to adequately address foreshore pro-tection issues, it is important to examine the way residents and stewards viewforeshore ecosystems. The key to protection is our ability to recognize andacknowledge our influence on these systems and the role they play in thehealth and vitality of Okanagan Lake (Battelle, 2001). Preservation of theseecosystems is critical in maintaining the environmental, social, and economicvalues that have long drawn people to the Okanagan region.
Chapter 5CONCLUSION
Foreshore modifications include lakeinfilling, removal of riparian vegetation,dock structures and blasting of parentforeshore material.Photo: T. Cashin


Central Okanagan Foreshore Inventory and Mapping 2005 PART I: State of the Foreshore 29
Decisions regarding the management of the Okanagan Lake foreshore zoneshould be based on the best available science and should reflect policies setout in regional strategies and guidelines as well as those of senior levels of gov-ernment. Based on the current state of the foreshore, measures must be takento conserve areas that contribute to maintaining and restoring sensitive fore-shore ecosystems and to preserving the ecological integrity of Okanagan Lake.
Regional and local governments possess a variety of means to ensure devel-opment is sensitive to environmental values. These include Official CommunityPlans, zoning, and bylaws and are useful in many situations, provided the base-line information on which decisions are made is both current and accurate. Thefollowing provides action items that local governments may use to achieve ahigher level of habitat protection. Included are specific recommendations thatpertain to the management of Okanagan Lake.
• Set objectives, which should consider shore type and disturbance levelfor the management of Okanagan Lake.
• Address specific zoning of the foreshore of Okanagan Lake.
• Include regulations and guidelines for new development, re-develop-ment, and management of existing development.
• Designate protection of critical areas in policies.
• Explore a memorandum of understanding with all levels of governmentregarding foreshore management roles and responsibilities.
• Develop jointly with all partnering agencies.
• Consider lakeshore development guidelines being developed else-where (e.g., Lindros Project Development, Urban Systems, 2004).
• Examine carrying capacity to determine the impact of foreshore modifications and activities on shore zone ecosystems.
• Gather more information to determine a method of quantifying carry-ing capacity.
Chapter 6RECOMMENDEDACTIONS
ACTION #1
Develop a foreshoreprotection plan.
ACTION #2
Determine carryingcapacity.

30 PART I: State of the Foreshore Central Okanagan Foreshore Inventory and Mapping 2005
• Use the information presented in this report to help identify critical habitat areas on central Okanagan Lake (e.g., kokanee shore-spawninglocations).
• Identify additional critical habitat areas for species other than kokaneethrough further analysis and future addition to the project database (e.g.,migration and rearing areas for juvenile fish).
• Identify critical areas on the remainder of Okanagan Lake through a subsequent inventory, and compile the information with the currentdatabase.
• Protect fish spawning areas (including historic kokanee spawning areasthat have habitat and features conducive to shore spawning) and adja-cent upland areas.
• Protect undeveloped areas adjacent to the foreshore. This is especiallyimportant when dealing with ecosystems that are threatened or endan-gered. Foreshore types characterized as vegetated shore are especiallyvulnerable since they occur infrequently on Okanagan Lake and likelycontain plant communities that are provincially listed as “at risk.”
• Protect substrates from alteration. Beach grooming, lake infilling, impor-tation of sand, armouring, and dredging all have the potential to negative-ly impact substrate materials.
• Pursue agreements between local governments and provincial agenciesabout foreshore management. “Head lease” agreements give one partycontrol over the management of the foreshore and have been obtainedby local governments such as the District of Peachland. This will reducedifficulties in coordinating inter-agency management strategies.
• Restore or enhance foreshore areas affected by past modifications,such as armouring, infilling, beach grooming, etc., if restoration orenhancement is likely to benefit habitat quality.
• Prevent or mitigate further modifications to foreshore areas where theyare likely to reduce habitat quality. For example, in kokanee spawningareas, modifications should not disrupt wind and wave action.
• Make technical guidance available to agencies and the public regardingalternatives to traditional shoreline modifications such as armouring.Such guidelines should be developed in conjunction with senior govern-ment agencies to ensure consistency with regulatory requirements andresource management objectives.
• Inventory the foreshore of both the north and south of Okanagan Lakeand compile the information with the current database.
ACTION #3
Identify critical areasfor protection,restoration, andenhancement.
ACTION #4
Protect critical andnatural areas.
ACTION #5
Address modifications.

Central Okanagan Foreshore Inventory and Mapping 2005 PART I: State of the Foreshore 31
ACTION #6
Monitor habitat lossesand gains to measuresuccess.
ACTION #7
Make inventory data and habitat information available.
ACTION #8
Identify further challenges and opportunities.
• Develop and produce indicators, actions, and timelines.
• Initiate a detailed habitat monitoring program on Okanagan Lake.
• Develop a coordinated enforcement protocol with all levels of government to respond to foreshore habitat impacts.
• Compare results from a monitoring program to the original inventorydata to determine compliance with best management practices andeffectiveness of protection activities.
• Provide federal, provincial, and local jurisdictions with inventory data.
• Provide partnering agencies with inventory data.
• Make the inventory data available to the public via the Internet throughcontinued partnership with the Community Mapping Network.
• Determine fisheries sensitive zones for a variety of fish species onOkanagan Lake.
• Conduct a detailed study to examine the relationship between currentkokanee spawning locations and the level of foreshore disturbancealong Okanagan Lake (a preliminary analysis of these data is includedin Part II of this report).
• Conduct a detailed study to examine the relationship between uplandspring locations and kokanee spawning areas.
• Obtain more detailed information to determine critical spawning areasfor shore-spawning kokanee along Okanagan Lake.
• Conduct a detailed study to identify critical habitats for other aquaticspecies and life stages.


Central Okanagan Foreshore Inventory and Mapping 2005 PART I: State of the Foreshore 33
Andrusak et al., 2002. Okanagan Lake Action Plan Year 5 (2000) Report.Ministry of Environment (formerly Ministry of Water, Land and Air
Protection), Penticton, BC.
Anonymous, 1996. Channel Assessment Procedure Guidebook. BC Ministry of
Forests and BC Ministry of Environment, Lands and Parks, Victoria, BC.
Battelle Marine Sciences Laboratory et al., 2001. Reconnaissance Assessmentof the State of the Nearshore Ecosystem: Eastern Shore of Central PugetSound, Including Vashon and Maury Islands (WRIAs 8 and 9). King County
Department of Natural Resources, Seattle, Washington.
BC Species and Ecosystems Explorer, 2005 – Government of British Columbia,
Ministry of Sustainable Resource Management and Water, Land and Air
Protection. (Accessed January, 2005).
http://srmapps.gov.bc.ca/apps/eswp/search.do
City of Kelowna, 1997. Lake Okanagan Shore Zone Plan. Planning Services
and Development Department, Kelowna, BC.
City of Kelowna, 2003. Zoning Bylaw no. 8000. Kelowna, BC.
City of Kelowna, 2003. City of Kelowna Official Community Plan. Kelowna, BC.
District of Lake Country, 2001. District of Lake Country Official CommunityPlan. Winfield, BC.
Dobson Engineering Ltd, 2000. Water Resources in the Central Okanagan – A Discussion Paper Within the Growth Management Strategy – Final Report.Regional District of Central Okanagan. Kelowna, BC.
FRBC (Forest Renewal BC), 2001. Okanagan–Shuswap Land and ResourceManagement Plan.
Hatfield Consultants Ltd, 1996. Shoreline Inventory and Fisheries SensitivityClassification of Main Arm Shuswap Lake. Department of Fisheries and
Oceans, Kamloops, BC.
Iverson and Cadrin, 2003. Sensitive Ecosystem Inventory: Central Okanagan2000-2001.
Lindros Project Development, Urban Systems, 2004. Lakeshore development
guidelines. Draft. Thompson Nicola Regional District, Kamloops, BC.
Chapter 7REFERENCES

34 PART I: State of the Foreshore Central Okanagan Foreshore Inventory and Mapping 2005
Mason, B. and R. Knight, 2001. Sensitive Habitat Inventory and Mapping.
Community Mapping Network. Vancouver, BC. 315pp + viii. M. Johannes,
Editor.
Ministry of Water, Land and Air Protection, 2004. Okanagan Lake Action Plan.Summary of Priority Activities. Penticton, BC.
NALMS (North American Lake Management Society), 2005.
http://www.nalms.org/glossary/lkword_c.htm
RDCO (Regional District of Central Okanagan), 2002. Regional GrowthStrategy - Environmental Protection Discussion Paper. Kelowna, BC.
RDCO (Regional District of Central Okanagan), 2004. Westside OfficialCommunity Plan. Bylaw 1050. Planning Services Department, Kelowna, BC.
RDCO (Regional District of Central Okanagan), 1997. Lakeview OfficialCommunity Plan. Regional District of Central Okanagan, Kelowna, BC.
Resources Inventory Committee, 1999a. Reconnaissance (1:20,000) Fish andFish Habitat Inventory: Lake Survey Form Field Guide; Errata #3 (March,
2004). BC Ministry of Fisheries – Fisheries Inventory Section, Victoria, BC.
Resources Inventory Committee 1999b. Overview Fish and Fish HabitatInventory Methodology. BC Ministry of Fisheries – Fisheries Inventory
Section, Victoria, BC.
Roed, Murray A, 1995. Geology of the Kelowna Area and Origin of theOkanagan Valley, British Columbia. Kelowna Geology Committee, Kelowna
BC.
Smith, Robert L., 1992. Elements of Ecology. Third Edition. Harper Collins
Publishers Inc., New York.
True Consulting Group, 1999. North Westside Official Community Plan.
Regional District of Central Okanagan, Kelowna, BC.
Urban Systems, 1997. Westbank Official Community Plan. Regional District of
Central Okanagan, Kelowna, BC.
Woodroffe, J., 1990. Foreshore Plan – Regional District of Central Okanagan.Woodroffe Consulting, City and Regional Planning, Victoria, BC.
References cont’d