Embed Size (px)
Citation preview

Approved for public release; distribution is unlimited.
ERD
C/C
ERL
TR-0
4-23
Central Heating and Power Plant Conversion at Fort Wainwright, AK Heating Only with Backup Generation Option John L. Vavrin, Noel L. Potts, John Westerman, Robert Lorand, Charles Schmidt, Raymond Heintel, and Michael R. Kemme
November 2004
Con
stru
ctio
n E
ngin
eeri
ng
Res
earc
h La
bora
tory


ERDC/CERL TR-04-23November 2004
Central Heating and Power Plant Conversion at Fort Wainwright, AK: Heating Only with Backup Generation Option John L. Vavrin, Noel L. Potts, and Michael R. Kemme Construction Engineering Research Laboratory PO Box 9005 Champaign, IL 61826-9005 Charles Schmidt and Raymond Heintel Charles Schmidt & Associates John Westerman and Robert Lorand Science Applications International Corporation, Germantown, MD
Final Report Approved for public release; distribution is unlimited.
Prepared for U.S. Army Corps of Engineers Washington, DC 20314-1000
Under Work Unit No. CFM; Task GB22

ii ERDC/CERL TR-04-23
ABSTRACT: The Fort Wainwright (FWA) military community has a critical need to establish its power and heating requirements to successfully complete a series of planned capital improvements. The CHPP upgrade coincides with an expansion of FWA’s mission within the next 5 years. To help the installation successfully complete these changes within the specified time frame, the Construction Engineering Research Laboratory (CERL) conducted an independent technical assessment of the FWA CHPP. This follow-on study, which was completed in April 2003, expanded on the recommenda-tion of previous work to convert the installation CHPP to heating only, and to purchase all electricity from the local elec-tric utility.
DISCLAIMER: The contents of this report are not to be used for advertising, publication, or promotional purposes. Citation of trade names does not constitute an official endorsement or approval of the use of such commercial products. All product names and trademarks cited are the property of their respective owners. The findings of this report are not to be construed as an official Department of the Army position unless so designated by other authorized documents.
DESTROY THIS REPORT WHEN IT IS NO LONGER NEEDED. DO NOT RETURN IT TO THE ORIGINATOR.

ERDC/CERL TR-04-23 iii
Contents
List of Figures and Tables ............................................................................................................. vii
Conversion Factors.......................................................................................................................... x
Preface............................................................................................................................................... xi
1 Introduction ................................................................................................................................ 1 Background......................................................................................................................... 1 Objective............................................................................................................................. 2 Approach ............................................................................................................................ 2 Scope.................................................................................................................................. 2 Mode of Technology Transfer ............................................................................................. 3
2 Plant Overview ........................................................................................................................... 4 Summary of Existing Mechanical Systems......................................................................... 4 Summary of Existing Electrical Systems ............................................................................ 5 Summary of Existing Control System................................................................................. 5 Summary of Existing Projects............................................................................................. 6 Summary of Planned Projects ............................................................................................ 6 Reliability ............................................................................................................................ 6
FWA Mechanical Systems............................................................................................................. 6 FWA Electrical Infrastructure ......................................................................................................... 6
3 GVEA Power System Reliability ............................................................................................10 Historical Outages ............................................................................................................ 10 Power Outage Prevention................................................................................................. 10 GVEA Backup Power Generation..................................................................................... 14 Supply and Transmission Issues ...................................................................................... 14 Conclusions on GVEA Reliability...................................................................................... 15 Conclusion ........................................................................................................................ 15
4 FWA Existing Loads ................................................................................................................16 Electrical ........................................................................................................................... 16 Heating.............................................................................................................................. 16
5 FWA Load Growth....................................................................................................................21 Planned Projects............................................................................................................... 21

iv ERDC/CERL TR-04-23
Electrical ........................................................................................................................... 21 Heating.............................................................................................................................. 22
6 Project Options ........................................................................................................................27 Option 1 Overview ............................................................................................................ 28 Option 2 Overview ............................................................................................................ 29
7 Conversion to Heating Only Design Considerations .........................................................31 Required Control System Modifications ........................................................................... 31
Option 1: System Modification ..................................................................................................... 31 Option 2: Total Replacement ....................................................................................................... 32 Option 3: Upgrade to the “Ovation” System................................................................................. 32 Recommended Approach ............................................................................................................ 32 Cost Comparison......................................................................................................................... 33
Steam System Modifications ............................................................................................ 33 Conversion to 100 psig at 470 °F ................................................................................................ 33 Pressure Reducing Stations ........................................................................................................ 33 Required Modifications ................................................................................................................ 34 Optional Modifications Considered ..............................................................................................34 Recommended Approach ............................................................................................................ 34
Mothball Steam Turbines .................................................................................................. 35 Required Changes to the Steam Turbines ................................................................................... 35 Options Considered..................................................................................................................... 35 Recommended Approach ............................................................................................................ 36
Electrical Switchgear ........................................................................................................ 37 Required Modifications ................................................................................................................ 37 Options Considered..................................................................................................................... 37 Recommended Approach ............................................................................................................ 38
Electrical Substations ....................................................................................................... 38 Existing Substations .................................................................................................................... 38 New Substations.......................................................................................................................... 39 Substation Size............................................................................................................................ 39 Substation Location ..................................................................................................................... 40 Recommended Approach ............................................................................................................ 41 Budgetary Costs .......................................................................................................................... 42 Explanation of Approach.............................................................................................................. 43
Heat Plant Backup Electrical Generation ......................................................................... 44 Minimum Requirements............................................................................................................... 44 Options Considered..................................................................................................................... 45 Recommended Approach ............................................................................................................ 45
Installation Critical Electrical Loads .................................................................................. 46 Existing Backup Generators ........................................................................................................ 46

ERDC/CERL TR-04-23 v
Heating System ........................................................................................................................... 46 Critical Equipment ....................................................................................................................... 46 Critical Buildings .......................................................................................................................... 47 Load Shedding and Load Shaving............................................................................................... 47 Options Considered..................................................................................................................... 49 Option 1— Total Installation Backup............................................................................................49 Option 2— Backup for Critical Loads Only (Distributed Generation) ........................................... 50 Option 3— Backup for Critical Loads Only (Centralized Generation) .......................................... 51 Recommendation ........................................................................................................................ 52
8 Cost Estimate Details ..............................................................................................................53 Construction Costs ........................................................................................................... 53 Controls ............................................................................................................................ 54 Steam Conversion ............................................................................................................ 55 Mothball Turbines ............................................................................................................. 56 Switchgear ........................................................................................................................ 56 Substations ....................................................................................................................... 57 CHP Backup Generators .................................................................................................. 58 Critical Load Backup Generators...................................................................................... 59 Operational and Maintenance Costs ................................................................................ 61
Diesel Fuel Costs ........................................................................................................................ 61 Generator Routine Maintenance Costs ....................................................................................... 61 PRV Maintenance........................................................................................................................ 61
9 Lifecycle Cost Analysis...........................................................................................................65 Key Assumptions of the Analysis...................................................................................... 65 Life Cycle Cost Summary ................................................................................................. 65
10 Environmental Considerations ..............................................................................................69 Introduction ....................................................................................................................... 69 CHPP Boiler Impacts on Emissions of Air Pollutants ....................................................... 70 Potential Environmental Impacts of New Substations ...................................................... 76
Stormwater Runoff Management During Construction and Operation......................................... 76 Possible Adverse Health Impacts on Nearby Residents During the Operational Phase of
the Project ............................................................................................................................ 76 Noise Impacts.............................................................................................................................. 77 Cumulative Environmental Impacts ............................................................................................. 77 Conclusions ................................................................................................................................. 77
Potential Environmental Impacts of Backup Power Generators....................................... 78 Air Quality Impacts....................................................................................................................... 78 Noise Impacts.............................................................................................................................. 85 Stormwater Runoff Management During Construction and Operation......................................... 86 Odors........................................................................................................................................... 86

vi ERDC/CERL TR-04-23
Flood Hazards and Encroachment on Wetlands.............................................................. 86 Protection of Historic Properties ....................................................................................... 86 Summary/Conclusion........................................................................................................ 86
11 Anti-Terrorism/Force Protection............................................................................................89 Location of New Infrastructure.......................................................................................... 89 New Electrical Substations ............................................................................................... 89 Backup Generator Housing .............................................................................................. 90
12 Summary and Recommendations.........................................................................................91 Control System ................................................................................................................. 91
Requirement ................................................................................................................................ 91 Option Selected ........................................................................................................................... 91
Steam System Modifications ............................................................................................ 91 Requirement ................................................................................................................................ 91 Option Selected ........................................................................................................................... 92
Mothball Steam Turbines .................................................................................................. 92 Requirement ................................................................................................................................ 92 Option Selected ........................................................................................................................... 92
Electrical Switchgear ........................................................................................................ 92 Requirement ................................................................................................................................ 92 Option Selected ........................................................................................................................... 92
Electrical Substations ....................................................................................................... 92 Requirement ................................................................................................................................ 92 Option Selected ........................................................................................................................... 93
Heat Plant Backup and Electrical Generation .................................................................. 93 Requirement ................................................................................................................................ 93 Option Selected ........................................................................................................................... 93
Installation Critical Electrical Loads .................................................................................. 93 Requirement ................................................................................................................................ 93 Option Selected ........................................................................................................................... 93
Appendix A: Project Implementation Tasks...............................................................................94
Report Documentation Page.........................................................................................................96

ERDC/CERL TR-04-23 vii
List of Figures and Tables
Figures
1 FWA electrical generation and usage ....................................................................... 17 2 FWA monthly electrical demand................................................................................ 18 3 Peak day generator load profile ................................................................................ 19 4 Heating loads – hourly rates ..................................................................................... 20 5 Peak day thermal heating load profile....................................................................... 20 6 FWA projected monthly peak demand ...................................................................... 24 7 FWA projected annual electric loads......................................................................... 25 8 FWA monthly peak heating steam demand .............................................................. 25 9 FWA projected annual heating steam load ............................................................... 26 10 Standard 20 MVA GVEA substation .......................................................................... 39 11 Proposed generator and substation locations........................................................... 40 12 Substation arrangement............................................................................................ 41 13 Projected annual electric costs by rate schedule...................................................... 43 14 FWA CHPP NPV analysis ........................................................................................ 67 15 Actual emissions changes at the coal fired boilers ................................................... 73 16 Emissions from new combustion sources at FWA contributing towards the
PSD threshold for NOx.............................................................................................. 81 17 Tank assumptions and emissions from fuel tank for combustion turbines................ 84 18 Tank assumptions and emissions from fuel tank for reciprocating engine
generators ................................................................................................................. 85 19 LADD AFB, Fort Wainwright, AK ............................................................................... 87
Tables
1 CHPP outages............................................................................................................. 7 2 1999 line bumps and feeder trips................................................................................ 7 3 2000 line bumps and feeder trips................................................................................ 8 4 2001 line bumps and feeder trips................................................................................ 9 5 Recent GVEA outage history for distribution line to FWA ......................................... 11 6 1999 summary of average GVEA power outages..................................................... 11

viii ERDC/CERL TR-04-23
7 2000 summary of average GVEA power outages..................................................... 12 8 2001 summary of average GVEA power outages..................................................... 13 9 FWA and GVEA electrical generation summary........................................................ 17 10 FWA monthly electrical demand................................................................................ 18 11 Heating loads–daily and hourly rates........................................................................ 19 12 FWA planned projects ............................................................................................... 23 13 Annual energy use intensity (EUI) estimate.............................................................. 24 14 Cost buildup summary .............................................................................................. 30 15 Total replacement vs. system upgrade configuration................................................ 33 16 Option summary........................................................................................................ 35 17 Switchgear option cost overview............................................................................... 38 18 Substations capacity specified at project outset ....................................................... 41 19 Substation budgetary costs ....................................................................................... 42 20 GVEA rate options..................................................................................................... 42 21 Generator sizing per plant loads ............................................................................... 44 22 Existing backup generator capacity .......................................................................... 45 23 Lift station summary .................................................................................................. 47 24 Mission critical facilities ............................................................................................. 48 25 Critical power generation options.............................................................................. 49 26 Project cost estimate................................................................................................. 53 27 Control cost details.................................................................................................... 54 28 Steam conversion cost details................................................................................... 55 29 Mothball turbine cost detail ....................................................................................... 56 30 Switchgear cost detail ............................................................................................... 56 31 Substation cost detail ................................................................................................ 57 32 CHP backup generators cost detail........................................................................... 58 33 Critical load backup generator cost detail ................................................................. 59 34 Critical load backup generator cost detail ................................................................. 60 35 IC engine fuel cost estimate...................................................................................... 62 36 IC engine maintenance cost estimate....................................................................... 62 37 Annual maintenance cost estimates ......................................................................... 63 38 Control system projected cost schedule ................................................................... 64 39 Security annual cost estimate ................................................................................... 64 40 Electric and coal annual project costs....................................................................... 64 41 Projected lifecycle costs............................................................................................ 66 42 Present value and cumulative NPV .......................................................................... 67 43 Permit application: enforceable limitations summary............................................... 71

ERDC/CERL TR-04-23 ix
44 Estimated actual emission changes of criteria air pollutants at the CHPP (tons/year) ................................................................................................................. 73
45 Estimated actual emission changes at the CHPP (lb/year) ...................................... 74 46 Backup generator required for conversion to CHP ................................................... 78 47 Criteria air pollutant emission factors for combustion turbine generators
(lb/MMBtu) fuel input ................................................................................................. 79 48 Criteria air pollutant emission factors for reciprocating engine generators
(lb/hp-hr) power output.............................................................................................. 79 49 Cumulative net emission change for PSD evaluation at Fort Wainwright main
post............................................................................................................................ 80 50 Emission calculations for five 6.5 MW turbine generators (tons/year)...................... 80 51 Emission calculations for four 1.5 MW and two 0.15 MW reciprocating engine
generators (tons/year)............................................................................................... 80 52 Non-criteria emission estimates for five 6.5 MW combustion turbine generators
(lbs/year) ................................................................................................................... 82 53 Non-criteria emission estimates for four 1.5MW and two 0.15 MW
reciprocating engine generators (lbs/year) ............................................................... 82

x ERDC/CERL TR-04-23
Conversion Factors
Non-SI* units of measurement used in this report can be converted to SI units as follows:
Multiply By To Obtain acres 4,046.873 square meters
cubic feet 0.02831685 cubic meters
cubic inches 0.00001638706 cubic meters
degrees (angle) 0.01745329 radians
degrees Fahrenheit (5/9) x (°F – 32) degrees Celsius
degrees Fahrenheit (5/9) x (°F – 32) + 273.15. kelvins
feet 0.3048 meters
gallons (U.S. liquid) 0.003785412 cubic meters
horsepower (550 ft-lb force per second) 745.6999 watts
inches 0.0254 meters
kips per square foot 47.88026 kilopascals
kips per square inch 6.894757 megapascals
miles (U.S. statute) 1.609347 kilometers
pounds (force) 4.448222 newtons
pounds (force) per square inch 0.006894757 megapascals
pounds (mass) 0.4535924 kilograms
square feet 0.09290304 square meters
square miles 2,589,998 square meters
tons (force) 8,896.443 newtons
tons (2,000 pounds, mass) 907.1847 kilograms
yards 0.9144 meters
*Système International d’Unités (“International System of Measurement”), commonly known as the “metric system.”

ERDC/CERL TR-04-23 xi
Preface
This study was conducted for Assistant Chief of Staff for Installation Management under Military Interdepartmental Purchase Request (MIPR) 2JCERG4065, “As-sessment of Required Power and Heat for Fort Wainwright Military Command, Al-ternatives to Current System and Recommendations for Future Work”; Work Unit CFM; Task GB22. The technical monitor was Hank Gignilliat, DAIM-FDF-U.
The work was performed by the Energy Branch (CF-E) of the Facilities Division (CF), Construction Engineering Research Laboratory (CERL), and concluded in April 2003. The CERL Principal Investigator was John L. Vavrin. Part of this work was done by Schmidt Associates, Inc, Cleveland, OH and Science Applications In-ternational Corporation, German-town, MD under contract No. DACA88-98-D-0003, delivery order No. 0013. The technical editor was William J. Wolfe, Information Technology Laboratory. Thomas Hartranft is Chief, CEERD-CF-E, and Michael Golish is Chief, CEERD-CF. The associated Technical Director was Gary W. Schanche, CEERD-CV-T. The Director of CERL is Dr. Alan W. Moore.
CERL is an element of the U.S. Army Engineer Research and Development Center (ERDC), U.S. Army Corps of Engineers. The Commander and Executive Director of ERDC is COL James R. Rowan, and the Director of ERDC is Dr. James R. Houston.


ERDC/CERL TR-04-23 1
1 Introduction
Background
The Fort Wainwright (FWA) military community has a critical need to establish its power and heating requirements to successfully complete a series of planned capital improvements. By 2005, the Central Heating and Power Plant (CHPP) will have had over $90 million worth of planned capital improvements. If unforeseen defi-ciencies are found, it is estimated that his figure may rise even higher. At the time of this work, the boiler and systems upgrade, originally estimated to cost $29 mil-lion, had increased to $45 million. The baghouse project, originally awarded for $25 million, was also anticipated to require additional funds. The cooling system up-grade, a congressional add-on that was to have been awarded in September 2002, was estimated at $23 million. FWA had requested an additional $60M to correct all deficiencies and for other anticipated projects. However, according to plant person-nel, only about $25 million was needed to complete the current OMA project and to keep the plant operation for 10+ years.
The CHPP upgrade coincided with FWA’s expanding mission. Within 5 years of this project, FWA was scheduled to receive the Stryker Brigade Combat Team (SBCT), a new high-tech training simulator, and a new hospital, all to come on-line. To help the installation successfully complete these changes within the specified time frame, the Office of the Assistant Chief of Staff for Installation Management (ACSIM) re-quested the U.S. Army Engineer Research and Development Center, Construction Engineering Research Laboratory (ERDC-CERL) to conduct an independent techni-cal assessment of the FWA CHPP. This study, which was completed in April 2003, was undertaken to expand on the recommendation of the earlier work* to convert the installation CHPP to heating only, and to purchase all electricity from the local electric utility.
* Martin J. Savoie, John L. Vavrin, Michael R. Kemme, Charles Schmidt, John Westerman, John Lanzarone, Hank
Gignilliat, and Norm Miller, Central Heating and Power Plant Alternatives Review: Fort Wainwright, Alaska, ERDC/CERL TR-03-11 (Engineer Research and Development Center, Construction Engineering Research Labora-tory [ERDC- CERL], Champaign, IL, May 2003).

2 ERDC/CERL TR-04-23
Objective
The overall objective of this project was to assess the condition of the Fort Wain-wright Central Heat and Power Plant, analyze alternatives to the current system, develop recommendations for future project work, and provide feedback to senior Army leadership. This work was to more fully exploring the previous study’s rec-ommendations, which were to: 1. Convert the CHPP to heating only 2. Purchase all electricity from the local electric utility, Golden Valley Electric Asso-
ciation 3. Install backup generation on the Installation.
Approach
The assessment team contracted assistance from Science Applications International Corp. (SAIC) and Schmidt Associates, Inc. (Appendix A includes a description of the contractors’ qualifications.) Other team members were Hank Gignilliat, DAIM-FDF-UE and John Lanzarone, HQUSACE. Also critical to the investigation were coordination and information gathering efforts by the Pacific Ocean Division (POD) and Alaska District Corps of Engineers and Fort Wainwright Directorate of Public Works staff. The team made an independent technical assessment of the FWA CHPP. In this work, POD and ERDC-CERL augmented the field data and quick analysis of the first study by detailing the “Heating-Only” solution to the current CHPP modernization strategy during the development of 1391s for implementing the interim solution.
Scope
This study was undertaken to assess future heating and electricity requirements of FWA. This assessment would help FWA develop plans to meet its energy needs based on how long the existing CHPP would continue to satisfy FWA heat loads, and on how large the electrical supply and backup equipment must be to meet fu-ture electrical loads. This results of this study, which was based on data that pro-duced results with relative accuracy, were meant to enable future planning, and not to determine final design.

ERDC/CERL TR-04-23 3
Mode of Technology Transfer
The results of this work have been transmitted to Fort Wainwright, USARAK, USARPAC, and ACSIM for implementation. This report will be made available through the World Wide Web (WWW) at URL:
www.cecer.army.mil

4 ERDC/CERL TR-04-23
2 Plant Overview
Summary of Existing Mechanical Systems
The Central Heat and Power Plant (CHPP) at Fort Wainwright, AK (FWA) is a coal-fired steam boiler plant that currently provides a majority of the steam and electric-ity to the Installation. The CHPP consists of six 150,000 lb/hr coal-fired stoker boil-ers that produce 400 psig steam at 650 °F. Two original boilers are no longer func-tional and have been abandoned in-place. The CHPP has five steam turbine generators. There are three 5 MW condensing turbine generators, a 2 MW condens-ing turbine generator, and a 5 MW noncondensing turbine generator. The 2 MW condensing turbine generator, Turbine No. 2, has been down for 30 years and is not economical to repair. It has been abandoned in place.
The steam is used to run the turbines for electrical generation and to provide heat-ing to the Installation through a network of utilidors. The boilers provide steam at a pressure of 400 psig and steam is supplied to the utilidors at 100 psig. The utili-dors provide some of the utilities (the distribution piping) to the buildings on the Installation including steam for heating, potable water, and sewer. The system has been designed so that the radiant heat from the steam piping provides freeze pro-tection to the potable water and sewer during the extreme cold winter tempera-tures. If these services freeze during the winter, the Installation will become non-functional and all personnel would need to be evacuated.
Turbine condenser cooling water is provided from a cooling pond located adjacent to the CHPP. During the winter months, this pond creates an ice fog that moves across the valley. This fog significantly reduces visibility on a nearby highway, which results in an unsafe situation for vehicles. To address this issue, a plan is underway to install an air-cooled condenser and eliminate the pond as a source of cooling.
Coal is delivered to the plant by rail. The coal is mined near Healy, AK and is pur-chased from the Usibelli Coal Mine, Inc. FWA maintains a coal pile with a 90 day minimum inventory.

ERDC/CERL TR-04-23 5
Summary of Existing Electrical Systems
The plant was originally served internally from two independent 2400-volt switch-gear line-ups. When the CHPP was modified in 1950, two additional independent feeds were added from the 12,470-volt line-up. This left the plant with four individ-ual services, the failure of any one of which could seriously cripple the power plant—either reducing its capacity by one-half or taking it off-line totally. An im-provement project now under construction will replace the separate 2,400-volt line-ups with one double-ended 4,160-volt switchgear line-up. After this project is com-pleted, the plant will be served internally from 4,160-volt power and 12,470 volt power.
Circuit protection is provided by protective relays in the switchgear line-up, with distribution protection on the distribution circuits. All circuit breakers are Magna-blast type breakers located inside the turbine building on the operating floor level. Although Magna-blast type breakers were the industry standard from the 1950s to the late 1970s, the protective relays are seriously outdated and some are constantly out of service for repair. Demand metering and ammeters on some of the cubicles are currently out of service. Additionally, two of the central control system trans-ducers are out of calibration and yield unreliable data.
Summary of Existing Control System
The boilers and turbine generator sets are currently controlled by a Westinghouse distributed control system. Installed approximately 6 years ago (1996) the West-inghouse WDPF control system was funded under HSQ PO No. 2763239-8419, as Westinghouse project D3904. Westinghouse introduced the WDPF system family in 1982 and introduced its replacement in 1997. The system is comprised of approxi-mately 7000-8000 points of monitoring and control, which covers both the boiler side and the turbine generator side. The control points are evenly divided between the steam generation side and the turbine generator side. The system head end compu-tation and control is running on an IBM OS/2 operating system platform installed on Intel 386 class personal computers (PCs). The OS/2 system has major limita-tions in retrieving data. It was reported in the field that this system cannot write to CD writers, only to floppy disk drives, because drivers were never written for this version of OS/2. This makes data transfer and retrieval very slow. The marginal performance of this system causes a large amount of time to be spent retrieving data, which delays other tasks.
Point interface is handled by a series of distributed control cabinets that are net-worked together and connected to the head end via a proprietary network configura-

6 ERDC/CERL TR-04-23
tion. These network cards are beginning to fail on a regular basis and replacements are difficult to obtain.
Summary of Existing Projects
Major projects that are underway at the CHPP are the refurbishment of the boilers and the addition of baghouses for each boiler. Another project currently underway is the replacement of the separate 2,400-volt line-ups with one double-ended 4160-volt switchgear line-up. After this project is complete, the plant will be served in-ternally from 4,160-volt power and 12,470 volt power.
Summary of Planned Projects
The major planned project is the conversion of the cooling system from a cooling pond to an air-cooled condenser. This project is the result of a need to eliminate the ice fog problems that create a driving hazard on the nearby highway. This project is currently on hold pending the outcome of the project recommended in this report.
Reliability
FWA Mechanical Systems
Table 1 summarizes the CHPP outages as recorded in the plant operator’s logbook. In several of the cases, an outage was noted by the plant operator, but details of the outage were not included.
FWA Electrical Infrastructure
Tables 2 to 4 summarize FWA line bumps and feeder trips as recorded in the plant operator’s logbook.

ERDC/CERL TR-04-23 7
Table 1. CHPP outages.
Date Description Start End Duration (hr:min)
12/13/2000 Plant Down (UPS Outage) 15:58 16:01 0:03
1/30/2001 Plant Outage
2/23/2001Blown Superheater Tube (open feeders 11,22,23,24) Loose Plant @ 16:34
13:40 20:08 6:28
3/29/2001 Loose Plant and UPS
6/18/2001 Plant Down (GVEA looses North Pole and Chena 5) 0:00
3/17/2002
4/8/2002
4/24/2002
6/7/2002 GVEA Out (Frequency=57.77) 16:30
6/25/2002Number of Occurances 10Total Outage Time 6:31
Table 2. 1999 line bumps and feeder trips. p p
Date Description Start End Duration (hr:min)
5/29/1999 Healy #2 Tripped off line 20:45 20:46 0:016/27/1999 Line Problem @ Glass Park 0:44 0:45 0:017/13/1999 #12 Feeder Trip 8:42 8:43 0:017/18/1999 #15 Feeder Trip 8:27 9:36 1:09
7/30/1999 GVEA lost tie between Wasilla and Willow 7:00 7:01 0:01
9/11/1999 Healy #2 Tripped off line 12:30 0:30 1:0010/27/1999 #5 Bulga Tripped 14:00 14:01 2:0010/27/1999 #22 Feeder Tripped 16:56 16:57 0:0111/15/1999 #15 Switch Tripped 0:0111/17/1999 Unit #5 in Achorage went down 11:10 11:11 0:0112/7/1999 Truck hit pole on #23 Feeder 9:03 10:20 1:1712/18/1999 #24 Feeder Tripped 13:16 1:17 PM 0:01Number of Occurances 12Total Outage Time 5:34

8 ERDC/CERL TR-04-23
Table 3. 2000 line bumps and feeder trips. p p
Date Description Start End Duration (hr:min)
1/17/2000 #14 Feeder Tripped 17:45 17:47 0:02
1/18/2000 #11 Feeder Tripped (Transformer and down line) 7:22 7:57 0:35
1/28/2000 #13 Feeder Tripped 17:43 19:07 1:24
2/2/2000 Bumps due to high winds on the intertie 0:01
2/14/2000 #11 Feeder Tripped 12:46 12:47 0:013/6/2000 Unit lost in Anchorage 2:45 2:46 0:013/8/2000 #10 Feeder Tripped 12:37 12:37 0:004/4/2000 #13 Feeder Tripped 12:14 12:15 0:01
4/22/2000 #11 Feeder Tripped (blown transformer) 7:30 8:37 1:07
4/23/2000 Bumps due to loss of units in Anchorage 12:59 13:03 0:04
4/29/2000 #11 Feeder Tripped 8:59 9:01 0:025/26/2000 #10 Feeder Tripped (Tree) 8:45 8:47 0:025/31/2000 #11 Feeder Tripped 10:33 11:20 0:476/8/2000 Bump (Anchorage looses unit) 15:58 15:59 0:018/6/2000 Bump (blown relay on 69 line) 12:30 12:31 0:018/15/2000 #10 Feeder Tripped 23:24 23:25 0:018/20/2000 #24 Feeder Tripped 14:55 14:57 0:029/24/2000 #22 Feeder Tripped 15:08 15:09 0:019/30/2000 #24 Feeder Tripped 11:19 11:28 0:09
10/6/2000 #24 Feeder Tripped (Replace Fuse) 12:00
12/13/2000 Plant Down (UPS Outage) 15:58 16:01 0:0312/19/2000 #23 Feeder Tripped 12:38 12:40 0:02Number of Occurances 22Total Outage Time 4:27

ERDC/CERL TR-04-23 9
Table 4. 2001 line bumps and feeder trips. p p
Date Description Start End Duration (hr:min)
1/15/2001 #14 Feeder Tripped 6:35 6:36 0:011/15/2001 #22 Feeder Tripped 12:45 12:46 0:011/15/2001 #23 Feeder Tripped (down line) 4:36 6:35 1:59
1/28/2001 Bump (Anchorage looses generator) 2:10 2:11 0:01
2/23/2001Blown Superheater Tube (open feeders 11,22,23,24) Loose Plant @ 16:34
13:40 20:08 6:28
4/4/2001 Loose Plant (UPS) 0:006/2/2001 #10 Feeder Tripped 6:57 6:58 0:01
6/18/2001 Plant Down (GVEA looses North Pole and Chena 5) 0:00
7/1/2001 #22 Feeder Shutdown (Damaged Pole) 9:01 15:13 6:12
7/28/2001 Bump (GVEA) 7:28 7:29 0:018/13/2001 #22 Feeder Tripped 13:35 13:36 0:011/18/2001 #10 Feeder Tripped 1:09 1:10 0:018/18/2001 #10 Feeder Tripped 2:10 3:50 1:408/22/2001 #10 Feeder Tripped 7:10 8:03 0:538/22/2001 #10 Feeder Tripped 14:14 14:15 0:018/23/2001 #10 Feeder Tripped 12:00 12:01 0:018/23/2001 #10 Feeder Tripped 13:26 13:27 0:01
10/1/2001 Drop #11 Feeder for load shed due to Boiler #4 problems 0:24 0:32 0:08
11/1/2001 #23 Feeder Tripped 10:02 10:17 0:1511/1/2001 #22 Feeder Tripped (down line) 13:23 15:13 1:5012/4/2001 Boiler #3 blows header12/5/2001 Boiler #4 lost stoker 19:30Number of Occurances 22Total Outage Time 19:35

10 ERDC/CERL TR-04-23
3 GVEA Power System Reliability
Historical Outages
GVEA service reliability is determined by the number, magnitude, and duration of customer outages. While high reliability is critical to Fort Wainwright, the tem-perature levels experienced in the Fairbanks area make reliability even more criti-cal than for most utilities. Temperatures in interior Alaska have been recorded from –78 °F to 93 °F, but typically average from –22 °F to –2 °F in the winter and from 50 °F to 72 °F in the summer. Loss of electrical power during the cold winter months, even for 4 to 6 hrs, can have severe impacts. At –20 °F, a typical residence that was at 70 °F before an outage would generally begin freezing in 9 hrs and be totally frozen in 23 hrs. Table 5 lists the most recent outage history for GVEA’s dis-tribution line to Fort Wainwright.
Tables 6 to 8 list GVEA’s power outage details over the past 3 years. The values represent details for the various types of outages. The data shows that the average GVEA customer experiences 3.6 to 5.1 outages per year with the average outage time ranging from 26 to 35 minutes per occurrence.
GVEA’s Supervisory Control and Data Acquisition (SCADA) computer system al-lows them to remotely control all turbines and substation breakers as far south as Cantwell. This reduces the number of times a line crew must be dispatched to in-vestigate a system disturbance. SCADA also provides cost-based dispatching; min-ute-by-minute loads are tracked to obtain the next megawatt of power at the least cost. To prevent over-capacity on distribution lines, GVEA limits the electrical loads to 50 percent of design capacity.
Power Outage Prevention
GVEA uses a load-shedding approach to handle supply or distribution disruptions. They rotate customer load loss to share the burden. Certain critical facilities such as hospitals, airports, and power stations are never cut off. GVEA has expressed confidence that they can provide reliable power to FWA based on their current sys-tem design, reserve capacity, and historical reliability data.

ERDC/CERL TR-04-23 11
Table 5. Recent GVEA outage history for distribution line to FWA.
Date of Outage Duration of Outage 7 June 2002 34 minutes 17 March 2002 3 minutes 18 June 2001 16 minutes 11 September 2000 2 minutes
Table 6. 1999 summary of average GVEA power outages.
Number of Outages
Customers Affected
Customer Hours
Minutes per Customer*
Category A: Power SupplyUnit Trip 31 230,429 13,525.53 22.223Transmission 14 77,971 13,628.76 22.392Recloser 0 0 0.00 0.000Silos Event 13 76,706 7,296.07 11.988
19 131,373 23,626.00 38.818
Category B: Extreme StormWind 115 22,129 24,734.53 40.639Snow 32 2,054 265.12 0.436Rain 0 0 0.00 0.000Flood/Lighting 34 4,439 6,859.90 11.271
138 11,207 31,786.77 52.226
Category C: PrearrangedPlanned 162 9,181 2,372.36 3.898
145 4,485 2,273.35 3.735
Category D: OtherTrees 78 12,004 5,545.77 9.1118Animals 266 19,755 2,672.09 4.3903Teardown 70 12,044 9,140.72 15.0184Equipment 166 34,166 26,311.22 43.2300
536 27,316 43,133.68 70.8697
Total Outages 838 174,381 100,819.87 165.6496Avg. Number of Customers: 36,518* Based on total number of customers
Hours Per Customer 2.761Interruptions per Customer 4.775Minutes per Interruption 34.690
g y
The average customer experienced 4.8 interruptions in electric service for at total outage time of 2.76 hours. The average duration of each interruption was 35 minutes.

12 ERDC/CERL TR-04-23
Table 7. 2000 summary of average GVEA power outages.
Number of Outages
Customers Affected
Customer Hours
Minutes per Customer*
Category A: Power SupplyUnit Trip 22 112,111 9,854.47 15.998Transmission 17 157,420 43,217.90 70.159Recloser 19 10,504 11.68 0.019Silos Event 7 30,723 2,249.32 3.651
25 161,380 50,052.09 81.253
Category B: Extreme StormWind 18 3,655 198.33 0.322Snow 62 21,832 1,938.98 3.148Rain 9 489 335.32 0.544Flood/Lighting 21 1,563 304.05 0.494
82 1,798 31,786.77 51.602
Category C: PrearrangedPlanned 303 25,574 3,419.70 5.551
272 6,570 3,136.00 5.091
Category D: OtherTrees 84 22,681 2,962.88 4.810Animals 255 62,716 4,790.50 7.777Teardown 63 8,255 1,921.48 3.119Equipment 200 57,521 19,379.47 31.460
513 20,125 28,385.48 46.080
Total Outages 892 189,873 84,300.60 136.852Avg. Number of Customers: 36,960* Based on total number of customers
Hours Per Customer 2.281Interruptions per Customer 5.137Minutes per Interruption 26.639
2000 - GVEA Outage Summary
The average customer experienced 5.1 interruptions in electric service for at total outage time of 2.28 hours. The average duration of each interruption was 27 minutes.

ERDC/CERL TR-04-23 13
Table 8. 2001 summary of average GVEA power outages.
Number of Outages
Customers Affected
Customer Hours
Minutes per Customer*
Category A: Power SupplyUnit Trip 14 97,226 10,546.61 16.935Transmission 6 22,446 2,447.98 3.931Recloser 15 8,963 110.65 0.178Silos Event 46 253,981 16,050.87 25.773
21 106,448 20,241.01 32.501
Category B: Extreme StormWind 18 5,073 1,436.35 2.306Snow 4 709 350.53 0.563Rain 1 3 3.00 0.005Flood/Lighting 9 666 56.15 0.090
23 1,073 1,840.58 2.955
Category C: PrearrangedPlanned 285 23,565 29,508.50 47.382
248 8,671 29,188.71 46.868
Category D: OtherTrees 99 38,475 7,974.23 12.8042Animals 255 62,690 4,347.30 6.9804Teardown 44 7,379 1,119.38 1.7974Equipment 171 35,967 14,486.77 23.2613
438 19,696 27,579.85 44.2848
Total Outages 730 135,888 78,850.16 126.6093Avg. Number of Customers: 37,367* Based on total number of customers
Hours Per Customer 2.110Interruptions per Customer 3.637Minutes per Interruption 34.816
g y
The average customer experienced 3.6 interruptions in electric service for at total outage time of 2.11 hours. The average duration of each interruption was 34 minutes.
GVEA employs “aggressive” automatic under-frequency relaying to automatically shed load as the means of reestablishing load-generation balance within time con-straints necessary to avoid system collapse. While this technique causes some ser-vice interruptions, it has been shown to reduce costs and lower rates for GVEA cus-tomers.
During normal operations, GVEA’s load shedding bias is 10 MW / 0.1 Hz. When cut off from import power from Wasilla (Anchorage), their load bias decreases to 2.5 MW / 0.1 Hz. GVEA’s minimum frequency set point is 58.7 Hz. Load shedding will occur within approximately 2 seconds to maintain system balance.

14 ERDC/CERL TR-04-23
A worst-case occurs when the Fairbanks-Healy intertie is lost. Under this circum-stance, all power generation must come from GVEA’s Fairbanks plants, which amounts to approximately 231MW of capacity. At peak winter load of 185 MW, the reserve margin is about 46 MW. If, for example, the North Pole plant goes down, GVEA can only feed about 97 MW. Load shedding via automatic underfrequency relaying could only reduce load by 32.5 MW ([60-58.7]/0.1x2.5) before the entire sys-tem would likely fail. While such an event has a low probability of occurrence, it is still a possibility. Completion of a parallel transmission intertie into Fairbanks, as discussed below will virtually eliminate such a catastrophic event.
GVEA Backup Power Generation
GVEA maintains oil-fired combustion turbine generators and diesel engine genera-tors to provide emergency backup generation for their system. These units are lo-cated in Fairbanks at the Chena Power Plant and at the Zehnder facility. Total winter backup capacity is approximately 75 MW and summer capacity is 65 MW. Start-up time for these units is: • large combustion turbine generators – 15 minutes from cold start • smaller combustion turbine generators – 10 to 15 minutes from cold start • stationary diesel engine generators – 8 minutes from cold start.
All backup generators are housed in heated buildings.
Supply and Transmission Issues*
GVEA has adequate “Firm” generation capacity to meet peak load with even the largest generation unit off line. However, the loss of the existing intertie (between Healy and Fairbanks) would disconnect 100 MW of power generated at Healy No. 1 and Anchorage. If this line is out of service, GVEA must start and run most of their local Fairbanks generation units to provide power to its members. This situation happened as recently as 25 September 1997, and all available generators in the Fairbanks area were run to meet the loads. While they should still have a reserve
* The discussion focuses on GVEA as the power supplier since it is currently supplying power to the installation and
has the required capacity to meet the installation’s load requirements. This does not preclude the possibility of al-ternative power providers such as Aurora Energy. However, Aurora currently is committed to selling 95 percent of its power to GVEA.

ERDC/CERL TR-04-23 15
margin of 20 percent at winter peak load (Table 6), the loss of only one of the 60 MW turbines at the North Pole Station would exceed the reserve margin. Under such circumstances GVEA would have to shed load and resort to a “rolling blackout” to maintain system balance. Under the worst-case scenario, the loss of a large genera-tion unit, such as the North Pole plant, could potentially result in the collapse of the system. However, completion of the Northern Intertie will provide a redundant line to deliver power to Fairbanks, which makes the worst-case scenario highly unlikely.
Conclusions on GVEA Reliability • A review of FWA plant information from 1999 – 2002 indicates an average of
3-5 GVEA-related line bumps per year, each lasting under 1 minute. In addi-tion, outages lasting from 2 minutes – 34 minutes on the distribution line serving FWA were noted in the 2000 – 2002 time frame. This compares fa-vorably with the disruptions associated with the FWA distribution system.
• Typical customers on the GVEA system experienced 3.6 – 4.8 outages annu-ally, with each outage averaging 26 to 35 minutes in the 1999 – 2001 time frame.
• Current plans to strengthen the GVEA system including the parallel intertie into Fairbanks will eliminate major problems that could be caused by loss of the Fairbanks-Healey intertie.
• Battery backup (20 MWh) of GVEA generators will help ensure against ser-vice disruptions.
Conclusion
GVEA should be able to provide power to the Installation reliably.

16 ERDC/CERL TR-04-23
4 FWA Existing Loads
Electrical
Table 9 summarizes the electricity generated by the FWA CHPP (“Generator”) as well as the GVEA imports and exports in MWh. The GVEA numbers are measured at the substation and do not include electricity transferred across the backdoor in-tertie.
The consumption of electricity varies seasonally, with the peak usage occurring dur-ing the winter months. Figure 1 shows the monthly totals for electricity generated by the CHPP and the net electric usage for FWA. Net usage is equal to the CHPP generation + GVEA Import – GVEA Export. The total net electric consumption by FWA between June 2001 and May 2002 was 90,783 MWh.
Table 10 and Figure 2 present the electrical generator loads for FWA based on FWA CHPP electrical data between May 2001 and April 2002. Hourly data was obtained for the peak day between May 2001 and April 2002, which was 6 November 2001. The average generator load for the day was 15.85 MW, and the data shows that the peak demand based on an hour average was 17.22 MW (Figure 3).
Heating
The total annual steam requirement for heating between June 2001 and May 2002 was 1,441,735 thousand pounds (klbs) (Savoie et al. 2003, p 8). To better character-ize the heat load requirements for FWA, the CHPP plant heating data were ana-lyzed on a daily basis and simple daily averages were calculated to identify repre-sentative heating rates (Table 11 and Figure 4).
Hourly data was obtained for the peak day between May 2001 and April 2002, which was 6 November 2001. The average demand for the day was 253 klb/hr. Figure 5 shows that the peak demand based on an hour average was 265 klb/hr (Sa-voie et al. 2003, p 14).

ERDC/CERL TR-04-23 17
Table 9. FWA and GVEA electrical generation summary.
Month Monthly Total Daily Average Hourly Avg Monthly Total Daily Average Monthly Total Daily AverageMWh MWh MWh
Apr-01 6,355.0 211.8 8.8 640.9 21.4 374.8 12.5May-01 7,833.5 252.7 10.5 33.2 1.1 815.4 26.3Jun-01 6,300.0 203.2 8.5 13.9 0.4 842.1 27.2Jul-01 5,737.1 185.1 7.7 34.2 1.1 780.3 25.2
Aug-01 5,884.0 189.8 7.9 113.2 3.7 808.8 26.1Sep-01 5,981.4 199.4 8.3 185.3 6.2 493.7 16.5Oct-01 8,181.2 263.9 11.0 588.1 19.0 196.4 6.3Nov-01 8,923.5 297.5 12.4 443.7 14.8 567.0 18.9Dec-01 9,368.1 302.2 12.6 639.1 20.6 408.7 13.2Jan-02 10,109.2 326.1 13.6 213.6 6.9 596.1 19.2Feb-02 9,195.5 328.4 13.7 237.2 8.5 643.7 23.0Mar-02 9,453.9 305.0 12.7 154.3 5.0 720.2 23.2Apr-02 7,650.3 255.0 10.6 427.8 14.3 612.6 20.4
May-02 7,605.0 245.3 10.2 500.8 16.2 487.5 15.7
Generator GVEA Import GVEA Export
Ft. Wainwright - Electric
0.00
2000.00
4000.00
6000.00
8000.00
10000.00
12000.00
Apr-
01
May
-01
Jun-
01
Jul-0
1
Aug-
01
Sep-
01
Oct
-01
Nov
-01
Dec
-01
Jan-
02
Feb-
02
Mar
-02
Apr-
02
May
-02
Month
MW
h
Power Plant Net Usage
Figure 1. FWA electrical generation and usage.

18 ERDC/CERL TR-04-23
Table 10. FWA monthly electrical demand.
Generator Loads (MW)Month Average Max
May 10.5 11.5June 8.5 11.4July 7.7 8.5Aug 7.9 8.5Sept 8.3 11.3Oct 10.9 13.9Nov 12.4 15.8Dec 12.5 14.9Jan 13.5 15.5Feb 13.7 14.9Mar 12.7 14.0Apr 10.6 12.9
Ft. Wainwright - Electric Generation
0.0
2.0
4.0
6.0
8.0
10.0
12.0
14.0
16.0
18.0
May
June
July
Aug
Sept
Oct
Nov Dec Jan
Feb
Mar
Apr
Month
Rat
e of
Gen
erat
ion
- MW
Average Max
Figure 2. FWA monthly electrical demand.

ERDC/CERL TR-04-23 19
Peak Day Generator Load Profile
10.00
11.00
12.00
13.00
14.00
15.00
16.00
17.00
18.001:
00
2:00
3:00
4:00
5:00
6:00
7:00
8:00
9:00
10:0
0
11:0
0
12:0
0
13:0
0
14:0
0
15:0
0
16:0
0
17:0
0
18:0
0
19:0
0
20:0
0
21:0
0
22:0
0
23:0
0
0:00
Time of Day
Gen
erat
or O
utpu
t - M
W
Figure 3. Peak day generator load profile.
Table 11. Heating loads–daily and hourly rates.
Month Average Max Average MaxMay 3,689.0 4,892.9 153.7 203.9June 2,833.9 4,467.9 118.1 186.2July 3,311.6 4,241.3 138.0 176.7Aug 3,216.5 3,469.4 134.0 144.6Sept 3,514.1 3,928.5 146.4 163.7Oct 3,636.8 5,769.5 148.7 240.4Nov 5,291.6 6,525.8 220.5 271.9Dec 4,585.2 5,306.3 191.1 221.1Jan 3,949.9 5,062.5 164.6 210.9Feb 3,895.6 4,413.6 162.3 183.9Mar 3,422.7 3,909.2 142.6 162.9Apr 3,286.8 3,938.5 137.0 164.1
Daily Hourly

20 ERDC/CERL TR-04-23
Ft. Wainwright Heating LoadsHourly Rates
0.0
50.0
100.0
150.0
200.0
250.0
300.0M
ay
June
July
Aug
Sept
Oct
Nov
Dec Jan
Feb
Mar
Apr
Month
klbs
/hou
r
Average Max
Figure 4. Heating loads – hourly rates.
Peak Day Thermal Heating Load Profile
200
210
220
230
240
250
260
270
1:00
3:00
5:00
7:00
9:00
11:0
0
13:0
0
15:0
0
17:0
0
19:0
0
21:0
0
23:0
0
Time of Day
Stea
m -
klbs
Figure 5. Peak day thermal heating load profile.

ERDC/CERL TR-04-23 21
5 FWA Load Growth The load growth described in this study is conceptual in nature, is based on data available as of October 2002, and is intended to support future planning as of that date. It is not intended to serve as a design tool. A subsequent study* has produced load growths that supersede those described here.
Planned Projects
Table 12 summarizes the planned projects for FWA as of October 2002. The build-ing data listed in Table 12 is based on the FWA Master Plan. Steam usage is based on the net heating value of 1246 Btu/lb of steam. The net impact on FWA electric and heating loads are estimated based on typical loads for types of facilities in the Alaska climate (Table 13). The loads are based on 2001 operational data from the FWA Birchwood Housing area, then extrapolated for other building types using the U.S. Department of Energy (DOE) commercial building energy consumption survey (CBECS).
Electrical
The monthly forecast of electrical load growth was estimated using the peak electric load profile for the existing FWA electrical loads as the base year case and estimat-ing that, on average, the new buildings will have a similar annual load profile. Fig-ure 6 shows the monthly peak load forecast.
The large demand increase in 2006 is mostly attributed to the new hospital. This demand includes the existing hospital in operation while the new hospital is tested and verified. In 2007, the model drops the entire load attributable to the existing hospital. By the end of 2010, the peak electrical demand for FWA will be 25.4 MW.
* Curtis L. Bagnall, Anthony C. Taladay, John L. Vavrin, William T. Brown, and Alexander M. Zhivov, Joint Long-
Range Energy Study for Greater Fairbanks Military Complex, ERDC/CERL Draft TR(ERDC-CERL, Champaign, IL, September 2004).

22 ERDC/CERL TR-04-23
Also, note that the project peak demand will exceed the capacity of the existing CHPP in 2006. Figure 7 shows the projected annual electric requirements for FWA. The total annual electric consumption is projected to double between 2002 and 2010.
Heating
The monthly forecast of steam heating load growth was estimated using the peak heating steam load profile for the existing FWA thermal loads as the base year case and estimating that on average the new buildings will have a similar annual load profile. Figure 8 shows the monthly peak load forecast. The largest impact to the heat load growth is the addition of new family housing.
Figure 9 shows the projected annual steam heating requirements for FWA. Total annual steam heating consumption is projected to increase by approximately 50 percent between 2002 and 2010 at an average rate of 5.5 percent annually.

ERDC/CERL TR-04-23 23
Table 12. FWA planned projects.
Beneficiary Occupancy Date (BOD)
Project # Title Square Footage Demo Net Square
Footage Peak (kW) Annual (kWh)
Monthly (kWh)
Peak (lbs/hr) Annual klbs
Aug-02 53735 CHPP Cooling
Oct-02 16809 Biathlon Live Fire
Oct-02 54790 Birch Hill Trail and Lighting
Mar-03 58146 Ice Rink Change House 3,600 3,600 18.0 63,072.0 5,256.0 101.1 535.0
Jun-03 54033 Assembly Building 12,500 12,500 62.5 219,000.0 18,250.0 351.0 1,857.5
Jun-03 50416 Barracks Upgrade 0 0 0.0 0.0 0.0 0.0 0.0
Jul-03 46098 Birch Hill Ski Lodge 7,140 7,140 35.7 125,092.8 10,424.4 200.5 1,061.0
Sep-03 56389 Utilidor Upgrade Phase 2 0 0.0 0.0 0.0 0.0 0.0
Oct-03 57961 Perimeter Boundary Fence 0 0.0 0.0 0.0 0.0 0.0
Oct-03 41585 Whole Neighboorhood Revitalization 0 0.0 0.0 0.0 0.0 0.0
Oct-03 58003 MOUT Upgrade (Montgomery) 0 0.0 0.0 0.0 0.0 0.0
Dec-03 44383 CHPP Emission Reduction 0 0.0 0.0 0.0 0.0 0.0
Jan-04 57341 Mission Support Training Facility - MSTF 115,000 115,000 2760.0 21,759,840.0 1,813,320.0 922.5 4,882.7
Jun-04 53387 Sniper Range 1,700 1,700 8.5 29,784.0 2,482.0 13.6 72.2
Jul-04 46292 AFH Replacement 48,015 149,976 -101,961 -611.8 -1,325,493.0 -110,457.8 -2044.8 -10,822.6
Aug-04 48777 CHPP Upgrade 0 0.0 0.0 0.0 0.0 0.0
Sep-04 55847 Modified MOUT - Shoot House 2,153 0 2,153 10.8 37,720.6 3,143.4 60.4 319.9
Sep-04 56922 ASP Upgrade - Lower 21,007 0 21,007 210.1 1,196,138.6 99,678.2 337.0 1,783.8
Sep-04 58056 UAV Maintenance Facility (DTA) 3,000 3,000 30.0 170,820.0 14,235.0 48.1 254.7
Oct-04 50504 Family Housing 127,180 162,041 -34,861 -209.2 -453,193.0 -37,766.1 -699.1 -3,700.3
Oct-04 57353 IBCT small BOF and 2 medium COF's 27,845 0 27,845 139.2 487,844.4 40,653.7 558.4 2,955.6
Oct-04 57354 Brigade Motor Pool - Phase 1 36,370 0 36,370 363.7 2,070,907.8 172,575.7 1021.1 5,404.7
Apr-05 57785 IBCT 200FA AFH 200,000 0 200,000 1200.0 2,600,000.0 216,666.7 4010.9 21,228.9
Apr-05 58187 IBCT 2 COF's 14,482 0 14,482 86.9 188,266.0 15,688.8 290.4 1,537.2
May-05 56388 JR NCO Housing Replacement 305,508 305,508 1833.0 3,971,604.0 330,967.0 6126.8 32,428.0
May-05 56921 Pallet Processing Facility 59,391 0 59,391 593.9 3,381,723.5 281,810.3 1667.5 8,825.7
Jul-05 42031 IPBC/Multipurpose Training Range 16,000 16,000 80.0 280,320.0 23,360.0 256.7 1,358.7
Oct-05 49938 Army Lodging 53,505 79,738 -26,233 -157.4 -341,029.0 -28,419.1 -526.1 -2,784.5
Nov-05 56951 Alert Holding Area 96,237 96,237 962.4 5,479,734.8 456,644.6 2702.0 14,301.1
Apr-06 53401 Battle Area Course 7,262 7,262 72.6 413,498.3 34,458.2 203.9 1,079.2
Apr-06 58551 Brigade Motor Pool - Phase 2 66,000 0 66,000 660.0 3,758,040.0 313,170.0 1058.9 5,604.4
Sep-06 16716 Modified Record File 2,000 0 2,000 20.0 113,880.0 9,490.0 56.2 297.2
Sep-06 56693 Combined Arms Collective Training 3,500 0 3,500 35.0 199,290.0 16,607.5 98.3 520.1
Oct-06 34810 Bassett Hospital Replacement 255,159 155,226 99,933 1499.0 9,848,397.2 820,699.8 2805.8 14,850.3
Oct-06 46789 CIS Barraks Phase 4A + COFs 87,657 0 87,657 525.9 1,139,541.0 94,961.8 1757.9 9,304.3
Oct-06 47125 CIS Barraks Phase 4B + COFs 89,132 0 89,132 534.8 1,158,716.0 96,559.7 1787.5 9,460.9
Oct-06 47673 AFH Replacement 46,800 54,626 -7,826 -47.0 -101,738.0 -8,478.2 -156.9 -830.7
Oct-07 46790 CIS Barracks Phase 4C + COFs 63,155 0 63,155 378.9 821,015.0 68,417.9 1266.5 6,703.6
Oct-07 56550 AFH Replacement 60,019 74,988 -14,969 -89.8 -194,597.0 -16,216.4 -300.2 -1,588.9
Oct-07 58048 IBCT Barracks 55,800 0 55,800 334.8 725,400.0 60,450.0 1119.0 5,922.9
Oct-07 58188 Tanana River Bridge Infrastructure 0 0.0 0.0 0.0 0.0 0.0
Oct-08 14453 ACES Facilities, Library/MOS/Ed Center 26,700 0 26,700 133.5 467,784.0 38,982.0 428.4 2,267.3
Oct-08 46290 AFH Replacement 138,720 142,952 -4,232 -25.4 -55,016.0 -4,584.7 -84.9 -449.2
Oct-08 55704 Upgrade Transient Quarters 52,333 52,333 314.0 680,329.0 56,694.1 1049.5 5,554.9
May-09 29554 Replace Hanger #2 54,508 52,594 1,914 19.1 108,983.2 9,081.9 53.7 284.4
May-09 41751 Replace Hanger #3 54,508 52,594 1,914 19.1 108,983.2 9,081.9 53.7 284.4
Oct-09 55344 MP Station 4,000 0 4,000 20.0 70,080.0 5,840.0 64.2 339.7
Totals 2,217,886 924,735 1,293,151 11,821 59,204,739 4,933,728 26,660 141,104
Net Electric Steam

24 ERDC/CERL TR-04-23
Table 13. Annual energy use intensity (EUI) estimate. gy yType of Facility
Watts/sf watt-hrs/sf/yr Load Factor BTU/hr/sf BTU/sf/yr
Computer Center 20 157,680 0.90 10 52,900
Hospital 15 98,550 0.75 35 185,100
Industrial 10 56,940 0.65 35 185,100
Housing 6 13,000 0.25 25 132,250Offices 5 17,520 0.40 20 105,800
Electricity Heating
FWA Projected Monthly Peak Demand
0.0
5.0
10.0
15.0
20.0
25.0
30.0
35.0
Month
MW
Figure 6. FWA projected monthly peak demand.

ERDC/CERL TR-04-23 25
FWA Projected Annual Electric Loads
0.000
20,000.000
40,000.000
60,000.000
80,000.000
100,000.000
120,000.000
140,000.000
160,000.000
180,000.000
200,000.000
2002 2003 2004 2005 2006 2007 2008 2009 2010
Year
kWh/
year
Figure 7. FWA projected annual electric loads.
FWA Monthly Peak Heating Steam Demand
0
50
100
150
200
250
300
350
400
450
Month
kph
Figure 8. FWA monthly peak heating steam demand.

26 ERDC/CERL TR-04-23
FWA Projected Annual Heating Steam Load
0
500,000
1,000,000
1,500,000
2,000,000
2,500,000
2002 2003 2004 2005 2006 2007 2008 2009 2010
Year
klbs
/yea
r
Figure 9. FWA projected annual heating steam load.

ERDC/CERL TR-04-23 27
6 Project Options This Project is a continuation of a previous project conducted during the summer of 2002. The scope of that work was to assess the condition of the Fort Wainwright Central Heat and Power Plant, analyze alternatives to the current system, develop recommendations for future project work, and provide feedback to senior Army leadership. That study analyzed the following options: 1. Status Quo (current MCA investment only) 2. Conversion to heating only plant
a. Coal b. Conversion to heating only plant-approved OMA funds, back-up power
3. Heating only plant with oil backup 4. Current CHPP renovation path 5. Standalone CHPP to meet future loads 6. Electricity produced to follow heat load 7. Oil-fired combustion turbines 8. Pressurized fluid bed combustor 9. Circulating fluid bed combustor 10. Heating only satellite plants 11. GVEA electricity/Aurora Energy heating.
Other potential solutions considered included: • individual boilers at each building • natural gas technologies • renewable energy technologies/wind energy.
The recommendation from the report on the previous project was to convert the CHPP to heating only, purchase all electricity from the local electric utility, Golden Valley Electric Association, and to install backup generation on the Installation.
For the purposes of developing a DD1391 to formally request project funding, two alternatives for supplying FWA with the projected requirements for both electricity and heat have been evaluated. Option 1 is the above-listed option 2b, (to convert the existing CHPP to heating only, purchase all required electricity from GVEA and to install backup generation to ensure electric and heating service during a loss of GVEA power). Option 2 is the above-listed option 5, (to expand the existing CHPP so that it can continue to supply a majority of FWA electricity and all heating and to increase the GVEA electric import capacity to ensure electric service during a loss of

28 ERDC/CERL TR-04-23
the CHPP power). While these two options do not provide exactly the same level of service and reliability, they both are designed to meet future load growth and are similar enough to base a valid comparison to determine which option is best for the Installation.
Option 1 Overview
The “Convert FWA CHPP to Central Heating Plant” concept is to: • convert the existing boilers and associated systems producing 400 PSIG,
725 °F steam to a 100 PSIG, 470 °F system • provide redundant piping between the boiler steam loop and the post extrac-
tion header • provide positive separation between the existing steam system and the tur-
bines • provide a long-term (15 year) storage system for the existing turbines • install new substation(s) sized for the future installation electrical load
growth • relocate installation electrical feeders to the new substation • remove the existing switchgear in the plant.
The “Provide Electrical Backup Generators” concept is to provide and install backup electric generators to cover the critical loads on Fort Wainwright. The generators will include all necessary control systems to allow automatic startup and shutdown, along with local and remote trouble alarm annunciation. The project includes all ancillary systems and new heated structures to allow year round operation. The critical electrical load will be split among multiple generator sets.
Major Components of the project are as follows: • upgrade controls • steam conversion through new pressure reducing valves and desuperheaters • disposition or preservation of existing steam generators • removal of switchgear • install new electrical substations • provide backup generation for critical loads (generators, electrical interface,
controls, fuel storage, etc.) • provide backup generation for CHP (generators, electrical interface, controls,
fuel storage, etc.).
The cost to construct this proposed modification to the CHPP is estimated at $78 million. Average annual operating costs are estimated to be $470,000, plus the cost of coal and electricity. This estimate is based on engineering cost build-up from a

ERDC/CERL TR-04-23 29
conceptual design using vendor quotes, MCACES, and PC Cost. The project will result in a reliable system that meets all environmental requirements. The con-struction is assumed to take 2 years. The data in Table 14 summarize of the cost buildup. Detailed cost development is presented later in this report.
Option 2 Overview
This option consists of upgrading and expanding the CHPP to meet a majority of future electrical load s and all the future heating requirements of the installation. Under this scenario, the CHPP would continue to operate much as it does now. Ma-jor Components of the project are: • upgrade controls • additional steam turbines • steam system modifications to support new steam turbines • upgrade switchgear • expand size of air-cooled condenser • overall CHPP upgrades to bring the plant up to current standards • install new electrical substations • provide backup generation for CHP (generators, electrical interface, controls,
fuel storage, etc.).
The cost of all improvements and modifications is estimated to be $153M. Average annual operating costs are estimated to be $340,800, plus the cost of coal. This es-timate is based on the previous study sited above, with some modifications to reflect the same load forecasts, escalation, locality factors, and contingencies as the de-tailed estimate of Option 1 above. With this option, cost uncertainties in terms of the condition of the existing equipment may lead to unforeseen costs in future years.
Note that, for both options, the existing baghouse project is still required.

30 ERDC/CERL TR-04-23
Table 14. Cost buildup summary.
Description Labor Equipment Material Other Total Cost
Controls $245,745 $1,533 $239,971 $3,356,539 $3,843,789
PRV's $9,222,039 $0 $6,318,374 $0 $15,540,412
Mothball Turbines $99,210 $0 $92,913 $0 $192,124
Remove Swichgear $566,346 $21,744 $1,082,292 $0 $1,670,384
New Substations $735,745 $42,628 $7,413,859 $13,733,040 $21,925,274
CHP Backup Generators $828,788 $26,093 $3,411,750 $0 $4,266,630
Critical Load Back Generators $3,066,694 $189,068 $24,935,110 $1,762,183 $29,953,056
Sub-Total $14,764,566 $281,066 $43,494,270 $18,851,763 $77,391,668

ERDC/CERL TR-04-23 31
7 Conversion to Heating Only Design Considerations Several decisions were required to ensure that the conversion to heating only pro-ject would ultimately satisfy the requirements and desires of the installation. A project development report was developed and presented to the key stakeholders of the project team. The report presented an overview of each major design require-ment and presented options for achieving the requirement. This section presents issues, options, and recommendations for the project design.
Required Control System Modifications
The existing control system is comprised of approximately 7000-8000 points of monitoring and control, which covers both the boiler side and the turbine/generator side. Approximately half of the sensors are dedicated to controlling the steam gen-eration side of the plant and the other half are for the control of the tur-bine/generator side. The system head end computation and control resides on an Intel 386 class computer with an IBM OS/2 operating system. The OS/2 operating system creates a huge nuisance in retrieving data. It was reported in the field that the operating system does not write to CD writers, only to a floppy disk drive, be-cause drivers were never written for this version of OS/2. This makes data transfer and retrieval very slow. The marginal performance of this system causes a large amount of time to be spent retrieving data, causing delays in other tasks.
Three options for improving the control system performance have been considered: (1) system modification, (2) total replacement, and (3) a system upgrade.
Option 1: System Modification
When the CHPP is converted to heating only, the control system will need to be modified to eliminate the electric generation control. The primary tasks are to re-move the existing controls and to modify the software programs for monitoring and control of electric generation. The cost of modifying the existing system is $300,000. This option is the least expensive in terms of installed costs, but is anticipated to be more expensive in the long run due to increased obsolescence (i.e., reduced and more

32 ERDC/CERL TR-04-23
expensive support) and the great amount of time required by CHP personnel to use effectively.
Option 2: Total Replacement
The total replacement path option is to purchase and install a totally new system. The advantage of the new system is that it can be procured through a competitive bidding process thereby controlling the cost of the project. In contrast, the proprie-tary nature of the existing system limits the choice of vendors who are capable of modifying it. The disadvantage of the total replacement option is that it will re-quire a substantial shutdown of the entire power plant for and extended period of time to switch over equipment and tune the programming.
Option 3: Upgrade to the “Ovation” System
The proposed system upgrade option for this system is to install the Emerson-Westinghouse “Ovation” system. Upgrading to Ovation will require replacing the redundant processor boards in each distributed processing unit (DPU) with ovation processors. Additionally the WESNET cabling needs to be replaced with fast Ethernet cabling, since Ovation communicates on an Ethernet network. With an upgrade to Ovation the distributed control cabinets can be retained with the excep-tion of the processor cards, which have the network interface on them. There is a significant reprogramming effort involved in the conversion. However, a significant portion of the conversion can be handled by a software migration package. This package will construct about 80 percent of the new point data and interface. The remaining 20 percent will require manual reprogramming. The entire switchover has been performed at cogeneration plants larger than the FWA CHPP in a single weekend shutdown.
The advantage of this option is that the Ovation control system is an open protocol and able to communicate with Allen Bradley PLC’s as well as with “Ovation.” This will help lower the cost of small control projects in the future. A further benefit of Ovation is that the hardware is not software specific.
Recommended Approach
It is recommended to proceed with Option 3, the migration upgrade to the Ovation system. Emerson-Westinghouse Ovation is an accepted standard in the coal-fired electric utility industry. It appears to be highly supported and very powerful, and the open protocol has benefits for future expansion.

ERDC/CERL TR-04-23 33
Table 15. Total replacement vs. system upgrade configuration.
Control System Comparison Total New system Upgrade to “Ovation” Software New New Network New New HMI Stations New New Engineering Station(s) New New History Station New New DPU Processors New New I/O cards New Existing Ease of replacement Difficult Difficult Competitive Bid Yes ? Approximate Cost $10.8 million $3.85 million
The existing redundant processors in each of the existing DPUs will be replaced with new Ovation processors while the Q rack (the input/output rack) will be re-tained. The Human Machine Interfaces (HMIs) will be replaced with current vin-tage workstations. This will include the engineering workstations, the operator work stations, the historian station, and the calculation stations. The current screens and displays will be converted for the new higher resolution displays.
Cost Comparison
Table 15 presents a Total Replacement vs. System Upgrade comparison.
Steam System Modifications
Conversion to 100 psig at 470 °F
Steam produced at 400 psig–650 °F must be reduced to 100 psig–470 °F for the utilidor load, 50 psig for CHP miscellaneous heating, and 10 psig for deareator heat-ing. This will be accomplished by passing the steam through pressure reducing sta-tions and then desuperheaters.
Pressure Reducing Stations
The pressure reducing valves (PRVs) and desuperheaters will be located in the boiler building at the platform level below the mud drum. PRVs will be connected to the common 12-in., 400 psig, header, which connects boilers No. 3, No. 5, and No. 7. Each PRV will be fed by its own 10-in. line coming from a new tap. These lines will parallel the existing lines to the turbines. The 10-in. lines from the desu-

34 ERDC/CERL TR-04-23
perheaters will run down to the condenser level and tie into the common 16-in., 100 psig header, which serves the utilidors.
Required Modifications
To produce 400,000 lb/hr. of 100 psig steam will require three operating PRV/desuperheater combinations. Also, 45,000 lb/hr of 10 psig steam will be pro-duced by one station and 40,000 lb/hr of 50 psig steam will be generated in another station. The total estimated installed cost is:
PRV & desuperheater for 100 psig steam 3 PRV & desuperheaters installed
$5,820,000
PRV & desuperheater for 10 psig steam 1 PRV & desuperheater installed
$ 1,940,000
PRV & desuperheater for 50 psig steam 1 PRV & desuperheater installed
$ 1,940,000
Total Cost $ 9,700,000
Optional Modifications Considered
Due to the critical nature of the heating system during the winter, it would be pru-dent to provide one backup desuperheater at each of the three stations as a means of providing backup in the event of a system failure of one of the new PRV stations. The estimated incremental cost of providing the backup stations is:
PRV & desuperheater for 100 psig steam 1 PRV & desuperheater installed
$ 1,940,000
PRV & desuperheater for 10 psig steam 1 PRV & desuperheater installed
$ 1,940,000
PRV & desuperheater for 50 psig steam 1 PRV & desuperheater installed
$ 1,940,000
Total Additional Cost $ 5,820,000
Recommended Approach
The recommended approach for the conversion of the steam system is to provide one backup desuperheater at each of the three stations as a means of providing backup in the event of a system failure of one of the new PRV stations. Thus the 100 psig steam system would have four PRV stations, the 10 psig system would have two PRV stations and the 50 psig system would have two PRV stations. The total esti-mated cost for the recommended approach is:

ERDC/CERL TR-04-23 35
PRV & desuperheater for 100 psig steam 4 PRV & desuperheaters installed
$ 7,760,000
PRV & desuperheater for 10 psig steam 2 PRV & desuperheaters installed
$ 3,880,000
PRV & desuperheater for 50 psig steam 2 PRV & desuperheaters installed
$ 3,880,000
Total Cost $ 15,520,000 (Note: Prices include Alaska factor and is based on intended piping run and location.)
Mothball Steam Turbines
Required Changes to the Steam Turbines
A fundamental change to the CHPP to heating only is the elimination of the electric generation function. One of the design issues is what to do with the steam turbines once they are no longer part of the power plant process.
Options Considered
There are four basic methods of decommissioning to be considered in mothballing the turbine/generator sets (Table 16).
Abandon in Place, No Preservation
At a minimum, the turbines will be disconnected from the steam loop and aban-doned in place. This is the least-cost option to pursue. The consequences of this op-tion are that the turbines will not be able to be brought back into service in a timely or cost effective manner. Also, they will remain in the plant until plans for re-placement or removal are undertaken.
If the strategy is to use the turbines at future time, one or more of the following op-tions should be considered.
Table 16. Option summary.
No preservation Desiccant Nitrogen Turning Gear Materials Deterioration Rapid Slow Slow N/A Known state of preservation N/A Unknown Known Known Rotor Warp Highest Highest Highest Lowest Cost Lowest Moderate High Highest

36 ERDC/CERL TR-04-23
Mothball with Desiccant
The turbines are disconnected and sealed with blank off plates. To prevent damage from moisture inside the turbines, desiccant material is placed inside to absorb moisture. This is the lowest cost preservation option, but does not guarantee that the turbine will be preserved for an extended period of time.
Mothball with Nitrogen Blanket
The turbines are disconnected and sealed with blank off plates. To prevent damage from moisture and other decomposing processes inside the turbines, the turbines are pressurized with an inert gas (nitrogen). This option is more expensive than the desiccant approach but is also more effective for long-term preservation. One dis-advantage of this approach is that the containment of the nitrogen can be problem-atic since it can leak from inside the turbine.
Add Turning Gear to Turbines
Turning gears can be installed to slowly rotate the turbine shaft. This is done to prevent the turbine shaft from taking a permanent bow from its own weight as it sits idle. If the shaft should take a bow, the entire shaft and rotor assembly will need to be removed and shipped to a rebuilding shop to be repaired, usually in the lower 48 states.
Recommended Approach
While it is understood that there is a desire to keep the options open for a long-term energy solution at FWA, it is recommended to abandon the existing turbines and forego any preservation activities. Even by standards of the time when this power plant was designed, the turbines operate at very low pressures resulting in ineffi-cient power generation. Industry has been using design pressures of 900 to 1250 psig since the 1930s for steam to drive electric generating turbines. At such low pressure as 400 psig, turbine generators are notably inefficient, compared to higher pressures. Due to the lack of efficiency of these turbines, it is highly unlikely there is any market for the turbines. In addition, due to the inefficiency of these turbines, any likely future electric generation projects for FWA would be based on more state-of-the-art and high efficiency technologies.

ERDC/CERL TR-04-23 37
Electrical Switchgear
Required Modifications
The existing switchgear dates to the original construction of the current CHPP. It is old technology (not used since the late 1970s) and still contains almost all of the original protective relays, meters and controls. As noted in previous reports, this line-up is intended to be replaced due to its condition. Although the circuit breaker portion of the line-up can continue to function as currently configured, it does need to be updated with new protection relays and controls. If the switchgear were to remain, updating the circuit breakers would be a complicated scheduling task to maintain power to the installation. Working on this switchgear is the equivalent of “open heart surgery” for the installation.
Since most of the line-up serves electrical loads on the installation outside the CHPP, when the new utility substations are installed, these breakers will have no further use. Once the turbines are decommissioned, the breakers serving the tur-bine/generators will no longer be needed and will be removed.
Options Considered
For the remainder of the switchgear there are two options: (1) upgrade the relays and controls, or (2) replacement of these components. Option 1 will maintain the current 12,470V switchgear as the service for the CHP and will continue the current single-ended circuits to transformers SS-2, SS-3, Ltg-2, and Ltg-3. Under this op-tion the emergency generators will be added to the 12,470 volt switchgear line-up.
Option 2 will eliminate single point failure possibilities that would shut down the entire plant. The best configuration for reliability is to convert the recently in-stalled 4,160-volt switchgear into the service entrance switchgear for the CHP. It has adequate bus capacity to serve the entire CHP load. The service transformers will be increased in size and additional breakers need to be added to the line-up. The additional breakers will feed the four remaining CHP loads that are now served at 12,470 volts and provide a connection point for the new “black start” generators. The existing 12,470 volt and 7,200 volt step-down transformers will be replaced with 4,160 volt primary transformers. Table 17 lists the overall costs of the two op-tions.

38 ERDC/CERL TR-04-23
Table 17. Switchgear option cost overview.
Retain 12,470 V Service Make 4,160 V Service Basic removal $56,700 $94,500 Refurbish Breakers 507,000 0 New Breakers 0 609,600 Replacement transformers 0 199,000 Generator voltage adder 10,000 0 Subtotal cost $573,700 $903,100 Simplified CHP Service No Yes Simplified troubleshooting No Yes Single point failures Yes No
Recommended Approach
Option 2, which involves reconfiguring the 4,160-volt switchgear to be the CHP ser-vice switchgear, is recommended. Although this is not the lowest cost option, it will greatly simplify the main electrical distribution in the CHP. This will eliminate the possibility of failure of old equipment forcing the CHP offline. This approach also improves electric supply reliability by eliminating the single points of failure, which can cause the plant to shutdown due to feeder failure. The simplified service will also make troubleshooting feeder problems much quicker during a failure. The dou-ble-ended systems will allow quicker restoration of power. The elimination of the 12,470 switchgear will eliminate one possible link in the failure chain.
Electrical Substations
Existing Substations
As indicated in section titled, “Electrical” (IN Chapter 4, p 16), the year 2000 elec-trical requirements for are installation are projected to be 32.5 MW. Once the CHPP is heating only, it is proposed to purchase all electricity from an off-installation provider such as GVEA. The current import capability to FWA from GVEA is 12.5 MW.
The installation needs reliable electrical service under any failure condition. In the existing distribution system this is exemplified by an arrangement that allows re-mote sections of the distribution circuits to be fed either from their normal breaker at the plant, or from their distant end from another circuit which is fed from an-other breaker in the plant.

ERDC/CERL TR-04-23 39
New Substations
The design considerations for the new substations are the primary service voltage, size, and location. GVEA is transitioning from the 69 kV services to 138 kV services to the greatest extent possible. GVEA indicates that their 138 kV service is more reliable and robust than the 69 kV services that FWA is currently using. There is 138 kV service near FWA and GVEA recommends that any new service for FWA be supplied through the 138 kV service. GVEA is also standardizing on a “cookie cut-ter” substation to allow quicker restoration of service when failures occur in their substations. Figure 10 shows this standard GVEA substation. These are rated 20 MVA nominal and can be fed from either 69 kV or 138 kV. They even have a mobile substation transformer, the longest lead-time item in a substation repair (possibly up to 26 weeks), to allow replacements within 8 hrs from failure of a transformer.
Substation Size
Conveniently, the standard substation size (12/16/20 MVA) matches well to one-half of the total load when fan cooled ratings are used. This size will allow the entire installation to run short term on two substations. An option is to provide a third substation for backup of any one of the two required units. The third substation would also be of value to support the growth of the installation and could help main-tain the current practice of having spare distribution capacity for redundancy throughout the installation. Furthermore, the third substation would help support the required distribution system upgrades that will be required for the planned growth.
Figure 10. Standard 20 MVA GVEA substation.

40 ERDC/CERL TR-04-23
Figure 11. Proposed generator and substation locations.
Substation Location
The substations will be located to take into account the existing FWA distribution infrastructure, force protection issues, and load growth. The existing distribution center for FWA electrical service is the CHPP so one or more substations should be located at or near the CHPP. Force protection issues will require that multiple sub-stations not be co-located, they not be visible from outside the installation, and they have security (fencing, locks, lights, alarms, etc.). The major load growth areas pro-jected for the installation are new family housing, the new hospital, and the SBCT. Figure 11 shows the proposed locations.
Location X is intended to support the proposed growth of residential housing but not to impede the expansion in this area of the installation. Location Z is intended to support the proposed growth that will be concentrated in this area of the installa-tion. Installing the substation at location Z at this time will reduce the future cost for individual facilities’ electrical infrastructure in this area since the installed elec-tric capacity will be located closer the new loads.
Option 1—Minimum Requirements
The basic requirement is to provide new substations sufficient to meet the projected peak demand for the entire installation. Due to the remote nature of FWA and the

ERDC/CERL TR-04-23 41
lead-time requirements for substation components, the minimum requirement is to have redundancy for the substation (s) incorporated into the design. The initial op-tion is to provide 100 percent redundancy with two transformers. The estimated cost for this option is $13,500,000.
Option 2—Base Design on GVEA Standard
The second option is to base the design on the GVEA standard 20 MVA substation. This size is also an economical choice when comparing redundant capacity pur-chased. Although it would seem that the substation capacity could be installed over time, the load growth curve shows that the load rises by 2006 to almost the total expected growth. Therefore the substation capacity must be specified into a project at the outset for completion by 2006 (Table 18).
Table 18. Substations capacity specified at project outset.
Number of Substation Transformers
Redundant Capacity Installed for N+1
2 100% 3 50%
Recommended Approach
Option 2 (install three standard substations (rated 12/26/20 MVA based on their air cooled rating) is recommended. This allows two substations (should one fail) to match the expected load growth of 32.5 MW within their fan cooled rating. Use GVEA standard distribution hardware and configuration for reliability and ease of repair following a failure. Supply the substation from the 138 kV circuit, which is the highest reliability. Add primary side breakers to standard substation to protect the integrity of the 138 kV line and allow partial restoration following a failure. Figure 12 shows the recommended configuration.
138 kV service circuit from GVEA west
138 kV connection on Post
138 kV circuit from GVEA east
20 MVA substation138 kV : 12,470 V (typical for 3)
Central Plant
Figure 12. Substation arrangement.

42 ERDC/CERL TR-04-23
Budgetary Costs
Table 19 lists the costs to implement Option 2 (base design on GVEA standard).
Table 19. Substation budgetary costs.
Quantity Per Unit Cost Extended Cost Basic substation 3 1,600,000 $ 4,800,000 Additional bay structure 3 600,000 1,800,000 Additional breakers 12 100,000 1,200,000 138 kV breakers 9 200,000 1,800,000 12 kV line rework 7 95,000 665,000 238 kV line work 4.5 600,000 2,700,000 Subtotal substation $ 12,965,000
Due to the substantial quantity of electricity that FWA will be purchasing from GVEA, GVEA is willing to entertain various financing and maintenance options. The exact options cannot be determined until GVEA conducts its own analysis of projected revenue to determine if they can cover some of the cost for the substations (Table 19) through their existing rate structure, and if they can prorate the addi-tional costs over an extended time frame and add the cost to FWA’s monthly in-voices.
An analysis was conducted to determine the electric rate that FWA should select when 100 percent of the electric supply is purchased from GVEA. Table 20 lists the rate options. These rates were modeled based on the project electric loads of FWA and compared to determine the most economically favorable option (Figure 13 shows the results).
The data shows that the projected costs are nearly the same for both the GS-2(2) 12,470 volt service and GS-2(3) 138 kV service. Under the rate GS-2(2), the instal-lation is metered on the low voltage side of the meter and GVEA owns and main-tains the substation.
Table 20. GVEA rate options.
Rate Schedules Current Rates Effective Rates
(Includes Fuel Credit) GS-2 (1) Services 50 kW and higher of demand per Billing Cycle
Customer Charge* $50 Demand Charge** $7/kW Energy Charge*** 0 – 15,000 kWh Over 15,000 kWh
8.152 ¢/kWh 6.401 ¢/kWh
7.482 ¢/kWh 5.731 ¢/kWh
GS-2 (2)

ERDC/CERL TR-04-23 43
Rate Schedules Current Rates Effective Rates
(Includes Fuel Credit) Services at Primary Voltage (up to 12,470 volts) Customer Charge $100 Demand Charge $8/kW Energy Charge 0 – 15,000 kWh Over 15,000 kWh
6.667 ¢/kWh 5.837 ¢/kWh
5.997 ¢/kWh 5.167¢/kWh
GS-2 (3) Services at Transmission Voltage (up to 138 kV)
Customer Charge $180 Demand Charge $11.25/kW Energy Charge (All Energy) 5.197 ¢/kWh 4.527 ¢/kWh
* Customer Charge = Fixed charge ($) that appears monthly on billing statement and is designed to help defray some of the fixed costs involved in providing electric service. These costs include power plant facilities, poles and transformers, vehicles, labor, office equipment and office space.
** Demand Charge = Charge based on maximum rate of delivery of electricity during a billing period, measured in kilowatts (kW). Demand rate is the maximum average power taken for any xx minute interval in the billing period.
*** Energy Charge + Charge (¢/kWh) for the amount of energy used during the billing cycle.
Projected Annual Electric Costs by Rate Schedule
$6,000,000
$8,000,000
$10,000,000
$12,000,000
$14,000,000
$16,000,000
2002 2003 2004 2005 2006 2007 2008 2009 2010
Year
Dol
lars
GS-2(1) GS-2(2) GS-2(3)
Figure 13. Projected annual electric costs by rate schedule.
Explanation of Approach
Since the main installation Switchgear will be removed, two specific functions need to be replaced. The existing switchgear provides power to the installation external to the CHPP and also powers systems internal to the CHPP. Replacement of the switchgear for the installation loads external to the CHPP will be provided in the electrical substations which will be located remote from the CHPP, closer to the load locations. The replacement of these breakers will simply replace the existing break-

44 ERDC/CERL TR-04-23
ers at their current capacity. This will eliminate any major rework of the circuits. The installation circuit size does not maximize the capability of the breakers, but is adequate for current use and will be retained. The CHP will be fed with two cir-cuits, one from each of the two closest substations. The substation breakers will be provided with SCADA monitoring to allow quick restoration of service, especially during the cold winter months.
Heat Plant Backup Electrical Generation
Minimum Requirements
Currently the CHPP does not have a “black start” capability. Either the plant must be able to generate a minimum amount of electricity or GVEA power must be avail-able to start the plant equipment. If neither is available the plant can not be started.
Table 21. Generator sizing per plant loads.
Load KVA Boilers & turbines running 12 Oct 2002 (3) 1,296 Misc. plant load 1,037 New ID fans (3) 895 Remaining boiler 730 Start 1 additional boiler 730 Turbines load to decommission (512) Total expected plant load 4,176
To provide an adequate level of safety during power failures/outages and allow an orderly start up, emergency generator power is required. If the plant is lost on a power failure and unable to restart in approximately 20 minutes in the midst of winter, some of the utilidors could freeze before they could be reheated. The power source must be automatically started and available in 15 to 30 seconds, to prevent major reheating efforts in the installation heating distribution system. This level of start is only available through the use of reciprocating engine driven generators. The fuel of choice at FWA will be Arctic Diesel oil. The sizing of the generator is based on the plant loads listed in Table 21.
To run the above loads, three (3), 1500 kW generators will be required. To provide the same level of Force Protection as the CHP, the new CHP generator will be lo-cated in a building adjacent to the CHP. This location is internal to the installation with no sight lines from outside the installation.

ERDC/CERL TR-04-23 45
Running three generator sets will consume approximately 324 gal of fuel per hour. Seven days of fuel storage on site represents 55,000 gal of diesel fuel. Fuel will be stored in two, 25,000-gal storage tanks, located in a spill retention dike. Each set should be tested at least once a month and observed by a mechanic. This represents approximately 1 work-day per month. The sets can be run more frequently through a SCADA to improve reliability. Testing every 2 weeks would consume approxi-mately 2,000 gal of fuel oil per month. The estimated cost for this option is $3,200,000.
Options Considered
In keeping with the philosophy of incorporating an N+1 design which allows for an additional unit to be on standby in the event of failure of one of the primary units. The option evaluated is to provide one additional 1,500 kW generator for increased reliability. The estimated incremental cost for this option is $1,100,000 and would bring the total cost of the CHP backup to $4,300,000.
Table 22. Existing backup generator capacity.
Building Description
Backup Generator Capacity
Fuel Tank
(Gallons)3565 Water Treatment 25 kW 5001060 Communications 270 kW 10001193 Power Plant Building 20 kW 5001555 Post Headquarters 250 kW 10001563 Plant/Utilities Building 190 kW 10001580 Flight Control Tower 130 kW 25003028 MP Station 25 kW 5003407 Brigade HQ Building 60 kW 1000
4065 Medical Center/Hospital2@425 kW & 1@200 kW 12,000
Recommended Approach
The recommendation is to proceed with the N+1 strategy and to install four 1,500 kW generators in a new building located adjacent to the CHP. Install above-ground fuel storage tanks with a combined capacity of 55,000 gal of diesel fuel. This pro-vides the highest level of reliability for CHP backup generation.

46 ERDC/CERL TR-04-23
Installation Critical Electrical Loads
Existing Backup Generators
The installation has a limited number of existing backup diesel generators that ser-vice a number of critical loads at various facilities. Table 22 lists the inventory of the existing backup generators.
Heating System
The buildings on the installation are heated by steam supplied from the CHPP. This steam is distributed through the utilidors to mechanical rooms where the heat from the steam is transferred to glycol liquid to circulate through the building sys-tems. Once the heat is transferred from the steam, the condensate must be re-turned to the CHPP for efficient operation. The transfer equipment and the con-densate return pumps are electrically driven. Without electric power there will be no heat transfer and the buildings will begin to cool down and soon freeze. If steam flow has stopped, the steam lines will cool down and then require heating back up. This is a manual operation, which requires bleeding steam from the end of each line. If the steam is not bled out while the line is heated up, condensate will collect and the line will become waterlogged. Once waterlogged with condensate, steam line explosions can occur. Explosions of this type pose a serious risk to equipment and personnel.
The basic design approach for this project is to keep the central heating plant oper-ating as the heating source for the installation. However, due to the mechanical de-sign of extracting the heat from the utilidors and distributing the heat into the buildings, electricity must be provided to operate the pumps, fans, and controls at each building.
Critical Equipment
Table 23 includes a summary list of critical equipment. In addition to existing backup generators and heating equipment, the table includes sewer lift stations that are required to operate at all times.

ERDC/CERL TR-04-23 47
Table 23. Lift station summary.
Description Load kW New housing heating pumps 3 locations, w/ (1) 15 HP glycol pump & (1) 1.5 HP
condensate pump 55.8
Old housing heating pumps 179 locations, w/ (1) 1.5 HP glycol pump, (1) 1.5 HP condensate pump, & 9 1.7 A zone pumps
1063.3
Large bldg. heating system 21 locations, w/ (1) 25 HP glycol pump, (1) 2 HP con-densate pump, & (4) 25 HP air handlers
2891.7
Barracks & small bldg. Heating pumps 160 locations, w/ (1) 5 HP glycol pump & (1) 2 HP con-densate pump
1393.9
Sewage lift pumps Bldg. #1002 Assume (2) 7.5 HP 11.2 Bldg. #1026 (2) 3 HP 4.5 Bldg. #1045 (2) 2 HP 3.0 Bldg. #1047 (2) 2 HP 3.0 Bldg. #1049 (2) 2 HP 3.0 Bldg. #1051 (2) 7.5 HP 11.2 Bldg. #1056 (2) 5 HP, (2) 2 HP, (1) 1 HP 12.0 Bldg. #1555 (2) 3 HP 4.5 Bldg. #1557 (2) 2 HP 3.0 Bldg. #1562 (2) 3 HP 4.5 Bldg. #3403 (1) 2 HP, (1) 1/2 HP, (2) 7.5 HP 13.1 Bldg. #3724 (2) 3 HP, (1) 10 HP, (1) ¾ HP 12.6 Bldg. #4162 (2) 3 HP, (1) 1/2 HP, (1) 7.5 HP 10.5
N. Post Tie-line (2) 15 HP 22.5 N. Luzon Station (2) 5 HP 7.5 S. Luzon Station (2) 5 HP 7.5
Critical Buildings
FWA has provided a list of the facilities that have been identified as mission critical facilities and must be fully functional at all times to support the needs and re-quirements of the installation (Table 24).
Load Shedding and Load Shaving
Automatic load shedding is one method of saving the installation energy costs. Load shedding is managing and controlling the loads on the installation. It involves either shutting off equipment, lights, and/or heat, or it involves changing the oper-ating conditions of the lights and/or heat. An example of load shedding is shutting off lights during peak demands, or shutting off an electric heater for a period of time. An example of changing operating parameters is a night setback thermostat. Unlike a night setback thermostat, load shedding is usually needed when the users are the busiest in normal course of operations.

48 ERDC/CERL TR-04-23
Table 24. Mission critical facilities.
Description Load kW Fire Dept #1054 9387 sq. ft. @ 5 w/sq. ft. 46.9 Fire Dept. #3004 7939 sq. ft. @ 5 w/sq. ft. 38.2 Fire Dept. #4380 3731 sq. ft. @ 5 w/sq. ft. 18.7 Post HQ #1555 91,460 sq. ft. @ 5 w/sq. ft. 457.3 BLM HQ #1541 42,170 sq. ft. @ 5 w/sq. ft. 210.9 MP Station #3028 5770 sq. ft. @ 5 w/sq. ft. 28.9 Control Tower #1580 3872 sq. ft. @ 20 w/sq. ft. 77.4 Communication #1060 16,879 sq. ft. @ 20 w/sq. ft. 337.6 Communication #1070 4000 sq. ft. @ 20 w/sq. ft. 337.6 Dining Facility #1004 12,997 sq. ft. @ 10 w/sq. ft. 130.0 Dining Facility #3416 15,121 sq. ft. @ 10 w/sq. ft. 151.2 Dining Facility #3728 15,121 sq. ft. @ 10 w/sq. ft. 151.2 Dining Facility #3451 Assumed 15,121 sq. ft. @ 10 w/sq. ft. 151.2 Medical Clinic #3406 25,222 sq. ft. @ 15 w/sq. ft. 378.3 Old Hospital #4065 Assume deleted 0 New Bates Hospital Assume self sufficient 0 Water Treatment #3565 13,398 sq. ft. @ 15 w/sq. ft. 301.0 CHPP #3595 Assume self sufficient 0 Fueling #2078 285 sq. ft. @ 10 w/sq. ft. 2.9 Fueling #3484 411 sq. ft. @ 10 w/sq. ft.. 4.1 Commissary #3703 94,676 sq. ft. @ 6 w/sq. ft. 568.0 Hanger #6 47,985 sq. ft. @ 5 w/sq. ft. 239.9 DPW #3022 west 7164 sq. ft. @ 5 w/sq. ft. 35.8 DPW #3022 east 7164 sq. ft. @ 5 w/sq. ft. 35.8 Child Development Center #4024 19,677 sq. ft. @ 6 w/sq. ft. 118.1
Another method of control, which is often mistaken for load shedding, is “load shav-ing.” Load shaving represents spending energy dollars on an alternate form of en-ergy to save dollars on the energy resource of interest. This is done when electricity costs are the highest and the cost savings are greater than the cost of fuel and op-eration to generate electricity. Encorp at Fort Bragg did exactly this. The installa-tion will still use the same amount of electrical energy, the difference is that the electricity comes from generators on-site, instead of from the utility. The electric energy still needs to be produced. This process does produce air emissions at the installation. These emissions must be managed as well as the cost of the energy that is burned in the generators. Another aspect of this operation is that the air quality issues may not be a direct trade off, due to the different emissions condi-tions.

ERDC/CERL TR-04-23 49
Options Considered
For purposes of analysis and to assure the best plan is in place for Fort Wainwright the critical load back up is provided as three options. Option 1 is total installation back up. Options 2 and 3 are backup for critical loads only. Both Options 1 and 3 use centralized generators. Option 2 uses distributed generators. Distributed gen-erators will be located near each building on the installation, while the centralized generation options will be located in the vicinity of the current CHPP. The data in Table 25 summarizes the three options.
“Critical only” capacity refers to planning for the critical building list, plus those pieces of equipment needed for heating the buildings. The standby power for the CHP will be located at the CHP as described in the Heat Plant Backup Electrical Generation Section (p 44).
Table 25. Critical power generation options.
Option 1: Central Generators for Total
Post Backup
Option 2: Distributed Generators for Critical
loads only
Option 3: Central Generators for Critical
loads only Number of sets 4+1 201 2 + 1 Fuel storage tanks 12 201 10 Work-hours needed per month to test each set once monthly
14 603 8
FTE for testing 0.08 3.5 0.05 Locations to secure 1 201 1 Budget cost $ 30,000,000 $ 34,000 000 $ 33,000,000 Controls FTE 0.1 1 1
Generators for standby will start within 5-10 minutes and are not intended for life support and extremely critical functions, such as emergency communication, hospi-tal patients, police, and fire safety response.
All generators will be located internal to the installation or shielded from line of sight of those outside the installation fence. All generators will be housed in build-ings for both force protection and weather protection.
Option 1— Total Installation Backup
This option provides standby generation on site, with a total capacity equal to the installation’s projected electrical demands in the year 2010, less the power required for backing up the CHPP auxiliaries. Although this involves the most generation capacity, it is the simplest system to construct and maintain. At one central point,

50 ERDC/CERL TR-04-23
sufficient generation will be provided to power the entire installation, should the utility service fail. This option includes combustion turbines summer rated at 6.5 MW each and winter rated at 7.8 MW each.* Four will be needed to meet the base load (less the CHP auxiliary load) and one will be needed to allow maintenance and repair. The combustion turbine facility will also include two small diesel generator sets that will provide the start up power to the combustion turbines. The combus-tion turbines can also be run in parallel with the utility, in an effort to peak shave or provide the utility support. Fuel oil will be provided from a single aboveground oil storage tank, located inside a retention basin and berm with fence.
Option 1 Equipment Requirement: Five (5) 6.5 MW combustion turbines, 450,000-gal fuel oil storage, 7700 sq ft building, Overhead electrical connections, and a SCADA system.
Total Estimated Cost: $30,000,000
The advantages to this approach are that it is the least complex of the options evaluated, the work-hours required for monthly testing are the lowest, and fueling logistics are straightforward for a centralized storage facility. For reliability, this option provides an N+1 backup strategy for the critical loads. Finally, in the event of a loss of power to the installation, all installation activities will be supplied with electricity so that normal mission activities can proceed in an unrestrained manner.
The disadvantages of this approach are total installed capacity of backup generation equal to the entire installation electric load (less the CHP load), the required fuel storage is the largest of the options evaluated and the centralized approach may be less desirable from a Force Protection point of view.
Option 2— Backup for Critical Loads Only (Distributed Generation)
Under this option, diesel engine distributed generators located near each remote critical load are used to provide back up power. The electrical service or distribu-tion system in the building will be modified to add an automatic transfer switch. All generator locations will be centrally monitored and may be remotely run. This will reduce the manpower required for routine operations while still maintaining excellent reliability.
* Combustion turbine performance is strongly influenced by ambient conditions. The higher the temperature, the
less dense the intake air to the turbines, and the less power generated or efficiency.

ERDC/CERL TR-04-23 51
The advantage to this approach is that the total installed capacity of backup gen-eration is lower than the total electric requirement for the entire installation. In addition, a failure of one generator does not result in a loss of electrical supply to a large portion of the installation. Finally, this approach could potentially provide backup for facilities when there is a failure on one of the installation electrical dis-tribution lines.
The disadvantages of this approach are that it is the most complex of the options evaluated, the work-hours required for monthly testing is high, siting issues for each generator need to be addressed and fueling logistics for 201 fuel storage tanks could prove to be a problem. In addition, this option does not provide for an N+1 backup strategy for any building or critical equipment.
Option 2 Equipment Requirement: (162) 30 kW generators, (5) 50 kW genera-tors, (26) 150 kW generators, (3) 250 kW generators, and (5) 500 kW diesel gen-erator sets, (193) 170 sq ft buildings and (8) 250 sq ft buildings, automatic trans-fer switch installation, base mounted oil storage, and a SCADA system.
Total Estimated Cost: $34,000,000
Option 3— Backup for Critical Loads Only (Centralized Generation)
Under this option, centrally located standby power is installed to meet critical loads only. This option involves locating combustion turbines in a central location and distributing the power through the normal distribution system. Since only enough generator capacity will be provided to supply the critical loads, each building will need to be modified so that all noncritical loads will be shed in a power failure. Likewise, each building will need to be arranged for remote restoration of power when utility service returns. Although this is the most complex option, it provides the best availability of load control and monitoring for the installation. Using this SCADA equipment, the central dispatch location can be instantly notified of power failures on the installation. Also, if load curtailment should be desirable either for utility cost control or as a necessity to keep the utility on line, the installation will be able to remotely control its electrical loads. Additionally, although with less re-duction potential than in option 1, the installation can peak shave using the com-bustion turbine generators in an effort to control utility load or for economic rea-sons.
Option 3 Equipment Requirement: Three (3) 6.5 MW combustion turbines, 180,000-gal fuel oil storage, 4,000 sq ft building, Overhead line connections, a SCADA system, controls at 197 residential and small buildings, 30 medium buildings, and 20 large buildings.

52 ERDC/CERL TR-04-23
Total Estimated Cost: $33,000,000
Recommendation
Option 1 is recommended. The critical power loads should be supplied from cen-trally located standby generators sized to meet the entire projected electrical load of the installation. This is the least costly and most flexible solution.

ERDC/CERL TR-04-23 53
8 Cost Estimate Details The tables in this chapter list detailed cost estimates for conversion to the “heating-only” option: Table 26 for the entire project Tables 33 and 34 for critical load backup generators. Table 27 for controls Table 35 for IC engine fuel costs. Table 28 for steam conversion Table 36 for engine maintenance Table 29 to mothball turbines Table 37 annual maintenance Table 30 for switchgear Table 38 for the control system Table31 for substations Table 39 for annual security Table 32 for CHP backup generators Table 40 for electricity and coal (annual)
Construction Costs
The total cost estimate was developed through a detailed conceptual design and ap-plying costs from either MCACES, PCCOST database values, and price quotes. All the raw values are based on the cost that is appropriate for the continental United States. These values are then scaled to account for the location factor (2.01), con-tingency (12 percent) and Supervision, Inspection and Overhead (6.5 percent). The cost development details are presented in the following sections
Table 26. Project cost estimate.
Description Labor Equipment Material Other Total Cost
Controls $245,745 $1,533 $239,971 $3,356,539 $3,843,789
PRV's $9,222,039 $0 $6,318,374 $0 $15,540,412
Mothball Turbines $99,210 $0 $92,913 $0 $192,124
Remove Switchgear $566,346 $21,744 $1,082,292 $0 $1,670,384
New Substations $735,745 $42,628 $7,413,859 $13,733,040 $21,925,274
CHP Backup Generators $828,788 $26,093 $3,411,750 $0 $4,266,630
Critical Load Back Generators $3,066,694 $189,068 $24,935,110 $1,762,183 $29,953,056
Sub-Total $14,764,566 $281,066 $43,494,270 $18,851,763 $77,391,668

54 ERDC/CERL TR-04-23
Controls
Table 27. Control cost details.
Description Quantity Units Labor Equipment Material Other Unit Cost Total Cost Source
Factory Upgrade Package 1 LS $0.00 $0.00 $0.00 $1,400,000.00 $1,400,000.00 $1,400,000.00 USR
Telephone cable, #22 AWG, on poles, 4 pair 14.5 MLF $5,739.25 $639.60 $3,175.50 $0.00 $658.92 $9,554.00 MIL
Factory Engineer Field programming 1 LS $6,400.00 $0.00 $0.00 $0.00 $6,400.00 $6,400.00 USR
Remove and replace proc units 16 EA $0.00 $0.00 $0.00 $0.00 $0.00 $0.00 USR
Remove and replace HMI units 6 EA $7,200.00 $0.00 $72,000.00 $0.00 $13,200.00 $79,200.00 USR
Conversion start-up 1 LS $83,160.00 $0.00 $19,250.00 $0.00 $102,410.00 $102,410.00 USR
MCACES Sub-Total $102,499.25 $639.60 $100,091.03 $1,400,000.00 $1,603,229.87 $1,603,230.00Locality Factor 2.01 $206,023.49 $1,285.60 $201,182.97 $2,814,000.00 $3,222,492.04 $3,222,492.30Contingency 12% $24,722.82 $154.27 $24,141.96 $337,680.00 $386,699.04 $386,699.08SIO 6.50% $14,998.51 $93.59 $14,646.12 $204,859.20 $234,597.42 $234,597.44Grand Total $245,744.82 $1,533.46 $239,971.05 $3,356,539.20 $3,843,788.50 $3,843,788.82

ERDC/CERL TR-04-23 55
Steam Conversion
Table 28. Steam conversion cost details. Description Quantity Units Labor Equipment Material Other Unit Cost Total Cost Source10" Tie to main steam header 8 EA $120,000.00 $0.00 $16,000.00 $0.00 $17,000.00 $136,000.00 USR10" gate valve, 600# 24 EA $51,456.00 $0.00 $315,912.00 $0.00 $15,307.00 $367,368.00 USR8" globe valve, 600# 8 EA $15,088.00 $0.00 $98,472.00 $0.00 $14,195.00 $113,560.00 USR1" gate valve, 800# drain 16 EA $2,784.00 $0.00 $3,040.00 $0.00 $364.00 $5,824.00 USR10" schedule 80, grade A, including 3 1/2" insulation, Al 600 FT $94,506.00 $0.00 $72,600.00 $0.00 $278.51 $167,106.00 USR
10" ell, schedule 80, grade A 48 EA $26,880.00 $0.00 $15,200.16 $0.00 $876.67 $42,080.00 USR10" tee, schedule 80, grade A 32 EA $27,648.00 $0.00 $15,360.00 $0.00 $1,344.00 $43,008.00 USR8" PRV & piolets 8 EA $26,400.00 $0.00 $208,000.00 $0.00 $29,300.00 $234,400.00 USR16" gate valve, 300 # 16 EA $70,560.00 $0.00 $280,480.00 $0.00 $21,940.00 $351,040.00 USR16" schedule 40, grade, 200 1,600.00 LF $369,600.00 $0.00 $152,000.00 $0.00 $326.00 $521,600.00 USR16" schedule 40, grade A, ell 96 EA $133,056.00 $0.00 $82,080.00 $0.00 $2,241.00 $215,136.00 USR16" schedule 40, grade A, tee 32 EA $48,576.00 $0.00 $30,880.00 $0.00 $2,483.00 $79,456.00 USRDesuperheater spray nozzle 8 EA $17,152.00 $0.00 $120,000.00 $0.00 $17,144.00 $137,152.00 USR
1" control valve for Desuperheater 8 EA $17,152.00 $0.00 $80,000.00 $0.00 $12,144.00 $97,152.00 USR
16" tie-in in turbine room 8 EA $200,000.00 $0.00 $0.00 $0.00 $25,000.00 $200,000.00 USR1" gate valve, 800# (drain) 48 EA $4,176.00 $0.00 $4,560.00 $0.00 $182.00 $8,736.00 USRstructural support steel 8 LS $121,944.00 $0.00 $149,304.00 $0.00 $33,906.00 $271,248.00 USRseismic hangers 8 LS $1,200,000.00 $0.00 $80,000.00 $0.00 $160,000.00 $1,280,000.00 USRtie-in to feedwater header 8 LS $24,000.00 $0.00 $4,000.00 $0.00 $3,500.00 $28,000.00 USR1 1/2", sch 80, grade A 1,200.00 LF $37,392.00 $0.00 $11,592.00 $0.00 $40.82 $48,984.00 USR1 1/2", 3000#, socket weld ell 80 LF $6,512.00 $0.00 $2,288.00 $0.00 $110.00 $8,800.00 USR1 1/2", 800#, gate valve 32 EA $3,792.00 $0.00 $6,336.00 $0.00 $316.50 $10,128.00 USR1/2", 800#, gate valve 32 EA $2,784.00 $0.00 $3,040.00 $0.00 $182.00 $5,824.00 USRseismic hangers 8 LS $160,000.00 $0.00 $80,000.00 $0.00 $30,000.00 $240,000.00 USR
safety valve, 6" x 8" set @ 150psig 8 LS $52,800.00 $0.00 $116,016.00 $0.00 $21,102.00 $168,816.00 USR
10" vent pipe 400 LF $63,000.00 $0.00 $48,400.00 $0.00 $278.50 $111,400.00 USR10" vent pipe 400 LF $0.00 $0.00 $0.00 $0.00 $0.00 $0.00 USR12" combined vent pipe 720 LF $163,296.00 $0.00 $125,438.40 $0.00 $401.02 $288,734.00 USRroof opening 8 LS $40,000.00 $0.00 $24,000.00 $0.00 $8,000.00 $64,000.00 USRseismic hangers 8 LS $160,000.00 $0.00 $80,000.00 $0.00 $30,000.00 $240,000.00 USRsteam traps 40 EA $104,000.00 $0.00 $0.00 $0.00 $2,600.00 $104,000.00 USRcontrol, loop controller 16 EA $12,000.00 $0.00 $40,000.00 $0.00 $3,250.00 $52,000.00 USRc, start-upontrol, loop controller 16 EA $16,000.00 $0.00 $0.00 $0.00 $1,000.00 $16,000.00 USRcontrol, pressure transmitter 8 EA $6,000.00 $0.00 $20,000.00 $0.00 $3,250.00 $26,000.00 USRcontrol, pressure transmitter, start-up 8 EA $6,000.00 $0.00 $0.00 $0.00 $750.00 $6,000.00 USR
control, temperature transmitter 24 EA $5,400.00 $0.00 $13,200.00 $0.00 $775.00 $18,600.00 USRcontrol, temperature transmitter, start-up 24 EA $5,124.00 $0.00 $0.00 $0.00 $213.50 $5,124.00 USR
control, thermo well 24 EA $5,400.00 $0.00 $2,400.00 $0.00 $325.00 $7,800.00 USRcontrol, orifice plate 16 EA $70,200.00 $0.00 $40,000.00 $0.00 $6,887.50 $110,200.00 USRcontrol, orifice plate, 1 1/2" 8 EA $3,300.00 $0.00 $9,600.00 $0.00 $1,612.50 $12,900.00 USRcontrol, flow transmitter 24 EA $76,500.00 $0.00 $60,000.00 $0.00 $5,687.50 $136,500.00 USRcontrol, flow transmitter, start-up 24 EA $24,000.00 $0.00 $0.00 $0.00 $1,000.00 $24,000.00 USRcontrol, flow recorder 8 EA $12,000.00 $0.00 $24,000.00 $0.00 $4,500.00 $36,000.00 USRcontrol, cabinet 8 EA $12,000.00 $0.00 $24,000.00 $0.00 $4,500.00 $36,000.00 USRcontrol, Westinghouse interface 8 LS $60,000.00 $0.00 $16,000.00 $0.00 $9,500.00 $76,000.00 USRcontrol, Westinghouse interface, start-up 8 LS $20,000.00 $0.00 $0.00 $0.00 $2,500.00 $20,000.00 USR
control, Westinghouse programming 8 LS $48,000.00 $0.00 $12,000.00 $0.00 $7,500.00 $60,000.00 USR
control, Westinghouse programming, start-up 8 LS $100,000.00 $0.00 $0.00 $0.00 $12,500.00 $100,000.00 USR
MCASES Sub-Total $3,846,478.00 $0.00 $2,635,370.47 $0.00 $6,481,848.47 $6,481,848.00Locality Factor 2.01 $7,731,420.78 $0.00 $5,297,094.64 $0.00 $13,028,515.42 $13,028,514.48Contingency 12% $927,770.49 $0.00 $635,651.36 $0.00 $1,563,421.85 $1,563,421.74SIO 6.50% $562,847.43 $0.00 $385,628.49 $0.00 $948,475.92 $948,475.85Grand Total $9,222,038.71 $0.00 $6,318,374.49 $0.00 $15,540,413.20 $15,540,412.07

56 ERDC/CERL TR-04-23
Mothball Turbines Table 29. Mothball turbine cost detail.
Description Quantity Units Labor Equipment Material Other Unit Cost Total Cost Sourcesplit piping at flange and install blind flange 20 EA $16,380.00 $0.00 $24,560.00 $0.00 $2,047.00 $40,940.00 USR
Remove control points from programming 1 LS $25,000.00 $0.00 $12,000.00 $0.00 $37,000.00 $37,000.00 USR
MCASES Sub-Total $41,380.00 $0.00 $38,753.60 $0.00 $80,133.60 $80,134.00Locality Factor 2.01 $83,173.80 $0.00 $77,894.74 $0.00 $161,068.54 $161,069.34Contingency 12% $9,980.86 $0.00 $9,347.37 $0.00 $19,328.22 $19,328.32SIO 6.50% $6,055.05 $0.00 $5,670.74 $0.00 $11,725.79 $11,725.85Grand Total $99,209.71 $0.00 $92,912.84 $0.00 $192,122.55 $192,123.51
Switchgear
Table 30. Switchgear cost detail. Description Quantity Units Labor Equipment Material Other Unit Cost Total Cost SourcePrimary Facilitiesrem Swyd substa, switchgear, w/air CB, 1200 A, 750 MVA, 13.8 10 EA $13,349.83 $1,994.72 $10,000.00 $0.00 $2,534.45 $25,345.00 MIL
Swyd substa, vacuum CB, 1200 A, 500 MVA, 13.8 kV 8 EA $6,051.92 $904.27 $76,912.00 $0.00 $10,483.52 $83,868.00 MIL
Electric ServiceSwyd substa oil xfmr, 14.4 kV, 2 winding, 3 phase, 5000 kVA 2 EA $4,545.99 $111.63 $110,542.00 $0.00 $57,599.81 $115,200.00 MIL
Swyd substa, vacuum CB, 1200 A, 500 MVA, 13.8 kV 2 EA $1,512.98 $226.07 $19,228.00 $0.00 $10,483.52 $20,967.00 MIL
Substn,112.5-1500kVA xfmr, 15 kV, 600A,2 posn floor mtd, fused 4 EA $3,377.19 $504.62 $44,138.00 $0.00 $12,004.95 $48,020.00 MIL
Substn, primary lightning arrestors, accessories, fused LB 4 EA $0.00 $0.00 $3,838.00 $0.00 $959.50 $3,838.00 MIL
Substn, accessories, key interlock, fused LB sw 4 EA $0.00 $0.00 $4,376.00 $0.00 $1,094.00 $4,376.00 MIL
Substn, dry xfmr, 150 kVA, 4160 V pri, 208y/120 V secondary 2 EA $727.36 $17.86 $9,210.00 $0.00 $4,977.61 $9,955.00 MIL
Substn, dry xfmr, 500 kVA, 4160 V pri, 480y/277 V secondary 2 EA $1,414.31 $34.73 $26,432.00 $0.00 $13,940.52 $27,881.00 MIL
Substn, switchgear 277/480 V, manual, 800 A, w/air circuit 4 EA $1,620.07 $275.27 $10,650.00 $0.00 $3,136.33 $12,545.00 MIL
Site Improvements and DemolitionSwyd substa oil xfmr, pad and containment 2 EA $203,621.08 $5,000.00 $110,542.00 $0.00 $159,581.54 $319,163.00 MIL
MCASES Sub-Total $236,220.73 $9,069.17 $451,420.08 $0.00 $696,709.96 $696,711.00Locality Factor 2.01 $474,803.67 $18,229.03 $907,354.36 $0.00 $1,400,387.02 $1,400,389.11Contingency 12% $56,976.44 $2,187.48 $108,882.52 $0.00 $168,046.44 $168,046.69SIO 6.50% $34,565.71 $1,327.07 $66,055.40 $0.00 $101,948.18 $101,948.33Grand Total $566,345.81 $21,743.59 $1,082,292.28 $0.00 $1,670,381.64 $1,670,384.13

ERDC/CERL TR-04-23 57
Substations
Table 31. Substation cost detail. Description Quantity Units Labor Equipment Material Other Unit Cost Total Cost SourcePrimary FacilitiesSwyd substa oil circuit breaker, 138 kV, 3500 MVA 9 EA $71,899.83 $1,765.53 $764,190.00 $0.00 $93,095.04 $837,855.00 MIL
Swyd substa oil circuit breaker access,adj 3 shot,recloser relay 9 EA $21,600.00 $0.00 $177,750.00 $0.00 $22,150.00 $199,350.00 MIL
Swyd substa oil circuit breaker access, 1 ph, overcurrent relay 9 EA $22,500.00 $0.00 $212,400.00 $0.00 $26,100.00 $234,900.00 MIL
Swyd substa oil CB access, 3ph, directional overcurrent relay 30 EA $3,567.95 $0.00 $99,090.00 $0.00 $3,421.93 $102,658.00 MIL
Swyd substa oil CB access, 3ph, under/over volt, voltage relay 30 EA $2,862.42 $0.00 $66,840.00 $0.00 $2,323.41 $69,702.00 MIL
Swyd substa oil CB access, differential relay package 9 EA $3,233.93 $0.00 $32,670.00 $0.00 $3,989.33 $35,904.00 MIL
Swyd substa oil xfmr, 14.4 kV, 2 winding, 3 phase, 12/14/20 kVA 3 EA $91,629.61 $2,250.00 $605,850.00 $0.00 $233,243.20 $699,730.00 MIL
Swyd substa, switchgear, w/air CB, 1200 A, 500 MVA, 13.8 kV 30 EA $34,042.07 $5,086.53 $873,600.00 $0.00 $30,424.29 $912,729.00 MIL
Excavate trench, hvy soil, 4'-6' D, 3/4 CY excavator 1,275.00 CY $1,512.92 $650.12 $0.00 $0.00 $1.70 $2,163.00 CIV
Hauling, off hwy haulers, 26 CY, 1 mile RT @ 20 mph (4.2 cyc/hr) 1,275.00 CY $349.86 $659.05 $0.00 $0.00 $0.79 $1,009.00 MIL
Placing conc, footings, spread, over 5 CY, direct chute 1,275.00 CY $13,897.50 $628.96 $0.00 $0.00 $11.39 $14,526.00 MIL
CMU, back-up, 8" x 8" x 16", no scaf/reinf, 2000 psi 900 SF $2,874.51 $0.00 $1,170.00 $0.00 $4.49 $4,045.00 MIL
CMU, decorative, 8" x 8" x 16", split/scored split, no 2,100.00 SF $9,094.47 $0.00 $8,505.00 $0.00 $8.38 $17,599.00 MIL
Walls & ceilings, plywood pnl & veneer, brush, one coat, appl 2,100.00 SF $522.27 $0.00 $0.00 $0.00 $0.25 $522.00 CIV
Ctg & paints, zinc rich epoxy, E-303B, 1 mil 450 SF $0.00 $0.00 $45.00 $0.00 $0.10 $45.00 CIV
Fence,scty,10' x 10',transom for10' fence,galv,dbl,gate,w/3 barb 1,500.00 EA $1,335.36 $589.68 $2,766.48 $0.00 $781.92 $4,692.00 MIL
Fence, CL scty, galv,10'H, 2.5"line post@10',3"pull 6 LF $13,905.00 $6,150.00 $20,850.00 $0.00 $27.27 $40,905.00 MIL
substation structure 6 LF $0.00 $0.00 $0.00 $3,600,000.00 $600,000.00 $3,600,000.00 USR
substation insulators and hardware 3 LF $0.00 $0.00 $0.00 $435,000.00 $145,000.00 $435,000.00 USR
Support FacilitiesElectric795 ACSR, 138 kv line 4.5 MI $0.00 $0.00 $0.00 $1,350,000.00 $300,000.00 $1,350,000.00 USR336 ACSR, 12.47 kv line 7 MI $0.00 $0.00 $0.00 $343,000.00 $49,000.00 $343,000.00 USRInformation SystemsFiber optic sys, aerial/duct, cable, 62.5 microns, outdoor 23,760.00 LF $11,060.28 $0.00 $44,906.40 $0.00 $2.36 $55,967.00 MIL
Fiber optic sys, transmission, connectors, 62.5 micron cable 12 EA $233.23 $0.00 $109.56 $0.00 $28.57 $343.00 MIL
Fiber optic sys, receiver, 1.9 mile range 4 EA $155.48 $0.00 $2,972.00 $0.00 $781.87 $3,127.00 MIL
Fiber optic sys, transmitter, 1.9 mile range 4 EA $155.48 $0.00 $2,972.00 $0.00 $781.87 $3,127.00 MIL
Fiber optic sys, cable enclosure, interior NEMA 13 4 EA $444.24 $0.00 $571.20 $0.00 $253.86 $1,015.00 MIL
MCASES Sub-Total $306,876.41 $17,779.87 $3,092,293.10 $5,728,000.00 $4,221,430.96 $9,144,950.00Locality Factor 2.01 $616,821.58 $35,737.54 $6,215,509.13 $11,513,280.00 $8,485,076.23 $18,381,349.50Contingency 12% $74,018.59 $4,288.50 $745,861.10 $1,381,593.60 $1,018,209.15 $2,205,761.94SIO 6.50% $44,904.61 $2,601.69 $452,489.06 $838,166.78 $617,713.55 $1,338,162.24Grand Total $735,744.79 $42,627.74 $7,413,859.29 $13,733,040.38 $10,120,998.93 $21,925,273.68

58 ERDC/CERL TR-04-23
CHP Backup Generators
Table 32. CHP backup generators cost detail. Description Quantity Units Labor Equipment Material Other Unit Cost Total Cost SourcePrimary FacilitiesBuildingCMU, decorative, 8" x 8" x 16", split/scored split, no 4,650.00 SF $20,134.50 $0.00 $18,832.50 $0.00 $8.38 $38,967.00 MIL
Framing, joists, 2" x 4" 2,557.50 BF $1,713.53 $0.00 $1,508.93 $0.00 $1.26 $3,222.00 RSMSheathing, plywood on roof, ext CDX, 3/4" thick 4,650.00 SF $2,139.00 $0.00 $3,766.50 $0.00 $1.27 $5,906.00 MIL
Wall/ceiling insul,3.5" thk,R11, 15" W, fbgls, foil faced, 4,650.00 SF $790.50 $0.00 $1,488.00 $0.00 $0.49 $2,279.00 MIL
Wall/ceiling insul, 6" thk, R19, 15" W, fbgls, foil faced, 4,360.00 SF $915.60 $0.00 $1,744.00 $0.00 $0.61 $2,660.00 MIL
Walls & ceilings, plywood pnl & veneer, spray, one coat, appl 4,360.00 SF $523.20 $0.00 $0.00 $0.00 $0.12 $523.00 CIV
Ctg & paints, Type I paint, TT-P-615, 600 SF/Gal 4,360.00 SF $0.00 $0.00 $218.00 $0.00 $0.05 $218.00 CIV
Sheathing, plywood, exterior CDX, 5/8" thick 4,970.40 SF $2,634.31 $0.00 $3,330.17 $0.00 $1.20 $5,964.00 MIL
Roof truss, 2" x 4",1' overhang,32' span, plate conn,24" OC,4/12 65.4 EA $1,657.89 $514.04 $4,939.01 $0.00 $108.73 $7,111.00 MIL
Asphalt shingles,210-235 lb/sq, inorganic, class A, std strip 4,970.40 SQ $246,531.84 $0.00 $127,192.54 $0.00 $75.19 $373,724.00 MIL
Excavate trench, hvy soil, 4'-6' D, 3/4 CY excavator 310 CY $368.90 $158.10 $0.00 $0.00 $1.70 $527.00 CIV
Backfill, sand bedding trenches, front-end loader, 1.5 CY 232.5 CY $232.50 $160.43 $3,685.13 $0.00 $17.54 $4,078.00 MIL
Concrete ready mix, regular weight, 3500 psi 77.5 CY $0.00 $0.00 $4,979.38 $0.00 $64.25 $4,979.00 RSM
Forms in place, footing, spread, plywood, 1 use 620 SF $2,120.40 $0.00 $1,054.00 $0.00 $5.12 $3,174.00 MIL
CMU, back-up, 12" x 8" x 16", no scaf/reinf, 2000 psi 1,860.00 SF $7,514.40 $0.00 $3,645.60 $0.00 $6.00 $11,160.00 MIL
Excavating, bulk, dozer, small area, open site, shaping w/small 4,360.00 CY $3,313.60 $1,656.80 $0.00 $0.00 $1.14 $4,970.00 MIL
Base, prepare & roll sub-base, small areas to 2500 SY 483.96 SY $246.82 $183.90 $0.00 $0.00 $0.89 $431.00 MIL
Concrete ready mix, regular weight, 3500 psi 87.2 CY $0.00 $0.00 $5,602.60 $0.00 $64.25 $5,603.00 RSM
Finishing floors, monolithic, float finish 4,360.00 SF $1,526.00 $0.00 $0.00 $0.00 $0.35 $1,526.00 MIL
Clear & grub, clear site w/335 HP dozer, trees to 12" dia 65.4 EA $165.46 $289.72 $0.00 $0.00 $6.96 $455.00 AF
Clear & grub, grub & stack, 400 HP dozer 261.6 CY $75.86 $164.81 $0.00 $0.00 $0.92 $241.00 AF
Generators and InfrastructureGenerator set, dsl eng, xfr sw&fuel tank,1500 kW, incl btry, 4 EA $38,895.68 $4,625.36 $1,057,200.00 $0.00 $275,180.26 $1,100,721.00 MIL
Fuel Oil Tankage 2 EA $9,000.00 $1,500.00 $91,522.00 $0.00 $51,011.00 $102,022.00 USRCompaction, steel wheel tandem roller, 5 ton 240 CY $53.50 $46.70 $0.00 $0.00 $0.42 $100.00 AF
Backfill, strl, sand & gravel, no cmpct, 75 HP dozer, 50' haul 2040 CY $702.78 $354.76 $0.00 $0.00 $0.52 $1,058.00 RSM
Concrete ready mix, regular weight, 3500 psi 100 CY $0.00 $0.00 $6,425.00 $0.00 $64.25 $6,425.00 RSM
Finishing floors, monolithic, broom finish 2100 SF $835.80 $0.00 $0.00 $0.00 $0.40 $836.00 MIL
Finishing floors, add, hardener,metallic, .50 PSF, heavy service
2100 SF $809.97 $0.00 $1,176.00 $0.00 $0.95 $1,986.00 MIL
Fence, CL scty, galv,10'H, 2.5"line post@10',3"pull 300 LF $2,782.20 $1,228.59 $4,170.00 $0.00 $27.27 $8,181.00 MIL
Total $345,684.24 $10,883.21 $1,423,028.10 $0.00 $1,779,595.55 $1,779,596.00Locality Factor 2.01 $694,825.32 $21,875.25 $2,860,286.48 $0.00 $3,576,987.06 $3,576,987.96Contingency 12% $83,379.04 $2,625.03 $343,234.38 $0.00 $429,238.45 $429,238.56SIO 6.50% $50,583.28 $1,592.52 $208,228.86 $0.00 $260,404.66 $260,404.72Grand Total $828,787.64 $26,092.80 $3,411,749.71 $0.00 $4,266,630.16 $4,266,631.24

ERDC/CERL TR-04-23 59
Critical Load Backup Generators
Table 33. Critical load backup generator cost detail. Description Quantity Units Labor Equipment Material Other Unit Cost Total Cost SourcePrimary FacilitiesBuildingCMU, decorative, 8" x 8" x 16", split/scored split, no 6030 SF $26,109.90 $0.00 $24,421.50 $0.00 $8.38 $50,531.00 MIL
CMU, decorative, 8" x 8" x 16", split/scored split, no 6030 SF $26,109.90 $0.00 $24,421.50 $0.00 $8.38 $50,531.00 MIL
Framing, joists, 2" x 4" 3316.5 BF $2,222.06 $0.00 $1,956.74 $0.00 $1.26 $4,179.00 RSMFraming, joists, 2" x 4" 3316.5 BF $2,222.06 $0.00 $1,956.74 $0.00 $1.26 $4,179.00 RSMSheathing, plywood on roof, ext CDX, 3/4" thick 6030 SF $2,773.80 $0.00 $4,884.30 $0.00 $1.27 $7,658.00 MIL
Sheathing, plywood on roof, ext CDX, 3/4" thick 6030 SF $2,773.80 $0.00 $4,884.30 $0.00 $1.27 $7,658.00 MIL
Wall/ceiling insul,3.5" thk,R11, 15" W, fbgls, foil faced, 6030 SF $1,025.10 $0.00 $1,929.60 $0.00 $0.49 $2,955.00 MIL
Wall/ceiling insul,3.5" thk,R11, 15" W, fbgls, foil faced, 6030 SF $1,025.10 $0.00 $1,929.60 $0.00 $0.49 $2,955.00 MIL
Wall/ceiling insul, 6" thk, R19, 15" W, fbgls, foil faced, 9,510.00 SF $1,997.10 $0.00 $3,804.00 $0.00 $0.61 $5,801.00 MIL
Walls & ceilings, plywood pnl & veneer, spray, one coat, appl 9,510.00 SF $1,141.20 $0.00 $0.00 $0.00 $0.12 $1,141.00 CIV
Ctg & paints, Type I paint, TT-P-615, 600 SF/Gal 9,510.00 SF $0.00 $0.00 $475.50 $0.00 $0.05 $476.00 CIV
Sheathing, plywood, exterior CDX, 5/8" thick 10,841.40 SF $5,745.94 $0.00 $7,263.74 $0.00 $1.20 $13,010.00 MIL
Roof truss, 2" x 4",1' overhang,32' span, plate conn,24" OC,4/12 142.65 EA $3,616.18 $1,121.23 $10,772.93 $0.00 $108.73 $15,510.00 MIL
Asphalt shingles,210-235 lb/sq, inorganic, class A, std strip 10,841.40 SQ $537,733.44 $0.00 $277,431.43 $0.00 $75.19 $815,165.00 MIL
Excavate trench, hvy soil, 4'-6' D, 3/4 CY excavator 402.00 CY $478.38 $205.02 $0.00 $0.00 $1.70 $683.00 CIV
Backfill, sand bedding trenches, front-end loader, 1.5 CY 301.50 CY $301.50 $208.04 $4,778.78 $0.00 $17.54 $5,288.00 MIL
Concrete ready mix, regular weight, 3500 psi 100.50 CY $0.00 $0.00 $6,457.13 $0.00 $64.25 $6,457.00 RSM
Forms in place, footing, spread, plywood, 1 use 804.00 SF $2,749.68 $0.00 $1,366.80 $0.00 $5.12 $4,116.00 MIL
CMU, back-up, 12" x 8" x 16", no scaf/reinf, 2000 psi 2,412.00 SF $9,744.48 $0.00 $4,727.52 $0.00 $6.00 $14,472.00 MIL
Excavating, bulk, dozer, small area, open site, shaping w/small 9,510.00 CY $7,227.60 $3,613.80 $0.00 $0.00 $1.14 $10,841.00 MIL
Base, prepare & roll sub-base, small areas to 2500 SY 1055.61 SY $538.36 $401.13 $0.00 $0.00 $0.89 $939.00 MIL
Concrete ready mix, regular weight, 3500 psi 190.20 CY $0.00 $0.00 $12,220.35 $0.00 $64.25 $12,220.00 RSM
Finishing floors, monolithic, float finish 9510 SF $3,328.50 $0.00 $0.00 $0.00 $0.35 $3,329.00 MIL
Clear & grub, clear site w/335 HP dozer, trees to 12" dia 99.99 EA $252.97 $442.96 $0.00 $0.00 $6.96 $696.00 AF
Clear & grub, grub & stack, 400 HP dozer 399.96 CY $115.99 $251.97 $0.00 $0.00 $0.92 $368.00 AF
Ltg misc 1 LS $0.00 $0.00 $0.00 $45,000.00 $45,000.00 $45,000.00 USRpower misc. 1.00 LS $0.00 $0.00 $0.00 $65,000.00 $65,000.00 $65,000.00 USROverhead coml, no frame, manual, 10' x 10' H, steel, 24 ga 6.00 EA $1,852.26 $0.00 $3,076.86 $0.00 $821.52 $4,929.00 MIL
Overhead bridge crane, 2 girder, 25 ton, 50' span 5.00 EA $20,976.00 $2,920.00 $292,984.85 $0.00 $63,376.17 $316,881.00 MIL

60 ERDC/CERL TR-04-23
Table 34. Critical load backup generator cost detail. Description Quantity Units Labor Equipment Material Other Unit Cost Total Cost SourceGenerators and UnfrastructureGenerator set, gas turbine, 6000 kW 5.00 EA $441,895.80 $52,549.00 $8,000,000.00 $0.00 $1,698,888.96 $8,494,445.00 MIL
Generator set, dsl eng, xfr sw&fuel tank, 250 kW, incl btry, 0.00 EA $0.00 $0.00 $0.00 $0.00 $49,406.44 $0.00 MIL
Generator set, dsl eng, xfr sw&fuel tank, 300 kW, incl btry, 2.00 EA $7,025.27 $919.82 $98,500.00 $0.00 $53,222.54 $106,445.00 MIL
Automatic transfer switch, 600 amp, enclosed 600 volt, 4 pole 1.00 EA $644.52 $0.00 $10,631.25 $0.00 $11,275.77 $11,276.00 MIL
Automatic transfer switch, access, time delay relay 1.00 EA $77.34 $0.00 $226.40 $0.00 $303.74 $304.00 MIL
Automatic transfer switch, access, under voltage relay 1 EA $77.34 $0.00 $428.00 $0.00 $505.34 $505.00 MIL
Automatic transfer switch, four position selector switch, access 1 EA $115.89 $0.00 $387.20 $0.00 $503.09 $503.00 MIL
Automatic transfer switch, access, pilot light 4 EA $309.37 $0.00 $368.00 $0.00 $169.34 $677.00 MIL
Automatic transfer switch, aux contact when normal fails,access 2 EA $154.68 $0.00 $212.80 $0.00 $183.74 $367.00 MIL
Automatic transfer switch, access, plant exerciser 1 EA $154.68 $0.00 $292.00 $0.00 $446.68 $447.00 MIL
Automatic transfer switch, access, battery charger 2 EA $309.37 $0.00 $1,216.00 $0.00 $762.68 $1,525.00 MIL
Oil filled xfmr,500 kVA xfmr, liquid containment area, curb & 1 EA $1,631.61 $29.60 $394.09 $0.00 $2,055.30 $2,055.00 MIL
Cu bus duct w/ fitting & support, 800 amp, 3P, 4W, feeder 400 LF $10,760.64 $0.00 $110,000.00 $0.00 $301.90 $120,761.00 MIL
Substn,112.5-1500kVA xfmr, 15 kV, 600A,2 posn floor mtd, fused 1 EA $844.30 $126.15 $11,034.50 $0.00 $12,004.95 $12,005.00 MIL
Substn, dry xfmr, 500 kVA, 13800 V pri, 480y/277 V secondary 1 EA $707.15 $17.36 $13,100.00 $0.00 $13,824.52 $13,825.00 MIL
Substn, switchgear 277/480 V, manual, 800 A, w/air circuit 10 EA $4,050.17 $688.17 $26,625.00 $0.00 $3,136.33 $31,363.00 MIL
Swyd substa, vacuum CB, 1200 A, 500 MVA, 13.8 kV 8 EA $6,051.92 $904.27 $76,912.00 $0.00 $10,483.52 $83,868.00 MIL
Shielded ca, in duct, 500 kcmil, no splice/termn, copper, XLP, 5.2 MLF $7,867.24 $1,175.56 $29,640.00 $0.00 $7,439.00 $38,683.00 MIL
Conduit in conc slab, 1.5" dia, incl cplg, steel, rigid 2200 LF $6,182.00 $0.00 $6,974.00 $0.00 $5.98 $13,156.00 MIL
Special wires & fittings, #14-2 conductor, sound, shielded with 17.6 MLF $15,340.86 $0.00 $5,755.20 $0.00 $1,198.64 $21,096.00 MIL
Cable tray ladder type, al, 6" rung spacing, 6" wide 1300 LF $6,006.00 $0.00 $13,312.00 $0.00 $14.86 $19,318.00 RSM
Swyd substa, vacuum CB, 1200 A, 500 MVA, 13.8 kV 8 EA $0.00 $0.00 $0.00 $0.00 $0.00 $0.00 USR
Sychronizing Switchgear Section 1 EA $25,000.00 $0.00 $100,000.00 $0.00 $125,000.00 $125,000.00 USRFuel Oi Fuel Oil Tankage 12 $54,000.00 $9,000.00 $549,132.00 $0.00 $51,011.00 $612,132.00 USRCompaction, steel wheel tandem roller, 5 ton 1,440.00 CY $320.98 $280.22 $0.00 $0.00 $0.42 $601.00 AF
Fence, CL scty, galv,10'H, 2.5"line post@10',3"pull 500 LF $4,637.00 $2,047.65 $6,950.00 $0.00 $27.27 $13,635.00 MIL
Backfill, strl, sand & gravel, no cmpct, 75 HP dozer, 50' haul 3,750.00 CY $1,291.88 $652.13 $0.00 $0.00 $0.52 $1,944.00 RSM
Finishing floors, add, hardener,metallic, .50 PSF, heavy service
12600 SF $4,859.82 $0.00 $7,056.00 $0.00 $0.95 $11,916.00 MIL
Finishing floors, monolithic, broom finish 12600 SF $5,014.80 $0.00 $0.00 $0.00 $0.40 $5,015.00 MIL
Concrete ready mix, regular weight, 3500 psi 470 CY $0.00 $0.00 $30,197.50 $0.00 $64.25 $30,198.00 RSM
Support FacilitiesAluminum cable, ACSR, on poles, 477.0 15.4 MLF $11,714.78 $1,305.46 $20,555.00 $0.00 $2,180.21 $33,575.00 AF
Steam connection 1 LS $0.00 $0.00 $0.00 $65,000.00 $65,000.00 $65,000.00 USRSite prep 1 LS $0.00 $0.00 $0.00 $225,000.00 $225,000.00 $225,000.00 USRDCS connection to CHP 1 LS $0.00 $0.00 $0.00 $335,000.00 $335,000.00 $335,000.00 USRMCASES Sub-Total $1,279,106.71 $78,859.54 $10,400,341.67 $735,000.00 $12,493,307.90 $12,493,308.00Locality Factor 2.01 $2,571,004.49 $158,507.68 $20,904,686.76 $1,477,350.00 $25,111,548.88 $25,111,549.08Contingency 12% $308,520.54 $19,020.92 $2,508,562.41 $177,282.00 $3,013,385.87 $3,013,385.89SIO 6.50% $187,169.13 $11,539.36 $1,521,861.20 $107,551.08 $1,828,120.76 $1,828,120.77Grand Total $3,066,694.15 $189,067.96 $24,935,110.36 $1,762,183.08 $29,953,055.50 $29,953,055.74

ERDC/CERL TR-04-23 61
Operational and Maintenance Costs
The recurring operational and maintenance costs that have been included with the analysis of the conversion to heating only are as follows: • diesel fuel • combustion turbine generator maintenance • diesel engine generator maintenance • PRV maintenance • control training, support, and maintenance • security personnel • coal costs • electricity purchases from GVEA.
Diesel Fuel Costs
The cost of diesel fuel has been included since it will be consumed during the monthly testing that will be required to ensure that the generators will reliably start when needed during the event of a power loss from GVEA. The estimate is based on one, 2-hr full load test conducted every 2 weeks. The details of the fuel cost estimate are presented in Table 35.
Generator Routine Maintenance Costs
The cost of routine maintenance has been included since hours of generator opera-tion will be accumulated during the monthly testing. Scheduled testing will be re-quired to ensure that the generators will reliably start when needed during the event of a power loss from GVEA. The estimate is based on one 2-hr full load test conducted every 2 weeks. Table 36 lists the details of the routine maintenance cost estimate.
PRV Maintenance
The cost of routine maintenance has been included for the PRV and desuperheater stations. This new equipment will require annual routine maintenance to ensure proper operation and desired reliability. Table 37 lists the annual maintenance cost estimates.

62 ERDC/CERL TR-04-23
Table 35. IC engine fuel cost estimate. Combustion TurbinesSolar Taurus 70Oil consumption rate at full load 610.00 gphNumber of turbine sets 5.00 Subtotal fuel (gallons/hour) 3,050.00 gph
Hours / test 2.00 hoursSubtotal fuel 6,100.00 gal.
Tests per year 26 Annual Fuel Requirement 158,600.00 gal.Estimated Fuel Cost 1.046 $/galAnnual Fuel Cost for Turbines 165,895.60$
Diesel Generator Sets1.5 MW CaterpillarOil consumption rate at full load 108.00 gphNumber of turbine sets 4.00 Subtotal fuel (gallons/hour) 432.00 gph
Hours / test 2.00 hoursSubtotal fuel 864.00 gal.
Tests per year 26.00 Annual Fuel Requirement 22,464.00 gal.Estimated Fuel Cost 1.046 $/galAnnual Fuel Cost for Diesel Generators 23,497.34$
Total Annual Fuel Costs Total Cost ($)Annual Fuel Cost for Turbines 165,895.60$ Annual Fuel Cost for Diesel Generators 23,497.34$ Total 189,392.94$
Table 36. IC engine maintenance cost estimate.
PRV maintenanceMan-Hours per Annual Test 2 hrs/PRV
Rebuild every 5 years 2 men2 days8 hrs/day
32hrs/prv/5yrs
Average Annual Maintenance Time / PRV 8.4hrs/yr/PRV
Total Number of PRV's 7
Average Annual Maintenance Time 58.8Hrs/yrLabor Rate 95$/hr
5,586.00$ Annual Equipment Costs 3,500.00 partsAnnual Maintenance Cost 9,086.00$

ERDC/CERL TR-04-23 63
Table 37. Annual maintenance cost estimates.
PRV maintenanceMan-Hours per Annual Test 2 hrs/PRV
Rebuild every 5 years 2 men2 days8 hrs/day
32hrs/prv/5yrs
Average Annual Maintenance Time / PRV 8.4hrs/yr/PRV
Total Number of PRV's 7
Average Annual Maintenance Time 58.8Hrs/yrLabor Rate 95$/hr
5,586.00$ Annual Equipment Costs 3,500.00 Annual Maintenance Cost 9,086.00$
parts
Controls
Recurring annual costs for the control system consists of system training for CHP operators, software updates, and parts replacements. It is anticipated that the only cost during the initial years will consist of training. Beyond the initial years, peri-odic training, software upgrades and replacement costs are projected with costs in-creasing every 5 years. Table 38 lists the projected cost schedule.
Security
To provide for continuous Force Protection, costs have been estimated for routine inspections of the substations and generator facilities to ensure that a breach of se-curity has not occurred. Table 39 lists the basis of the annual cost estimate.
Coal and Electricity Costs
The annual cost of electricity presented in 6.5.8 for GVEA rate schedule GS(2)-2 were used. The coal requirement was calculated based on the projected heating loads. The annual costs are presented in Table 40.

64 ERDC/CERL TR-04-23
Table 38. Control system projected cost schedule. 2002 -$ 2015 40,000$ 2003 25,600$ 2016 75,000$ 2004 25,600$ 2017 75,000$ 2005 25,600$ 2018 75,000$ 2006 20,000$ 2019 75,000$ 2007 20,000$ 2020 75,000$ 2008 20,000$ 2021 100,000$ 2009 20,000$ 2022 100,000$ 2010 20,000$ 2023 100,000$ 2011 40,000$ 2024 100,000$ 2012 40,000$ 2025 100,000$ 2013 40,000$ 2026 125,000$ 2014 40,000$ 2027 125,000$
Table 39. Security annual cost estimate. Security Inspection RoundsTime required per inspection 0.25 hrs/site/shiftNumber of sites to inspect per shift 7 sitesNumber of shifts per day 3 shifts/dayDays per year for inspections 365 days/yrTotal Annual Man-Hours Required 1916.25 hrs/yrSecurity Cost/Hour 65 $/hrTotal Annual Security Costs 124,556.25$
Table 40. Electric and coal annual project costs.
Year MWh/year Electric ($) Coal ($) Total ($)2002 93,198 $6,736,100 $6,842,054 $13,578,1542003 98,033 $7,055,745 $7,191,186 $14,246,9312004 120,289 $8,579,524 $7,554,796 $16,134,3192005 132,608 $9,534,348 $7,841,837 $17,376,1852006 152,806 $11,058,281 $8,213,236 $19,271,5172007 171,196 $12,420,041 $8,709,589 $21,129,6302008 169,840 $12,300,462 $9,107,684 $21,408,1462009 176,796 $12,776,772 $9,560,351 $22,337,1232010 183,456 $13,213,880 $10,019,550 $23,233,4292011 185,291 $13,213,880 $10,119,745 $23,333,6252012 187,144 $13,213,880 $10,220,943 $23,434,8222013 189,015 $13,213,880 $10,323,152 $23,537,0322014 190,905 $13,213,880 $10,426,384 $23,640,2632015 192,815 $13,213,880 $10,530,648 $23,744,5272016 194,743 $13,213,880 $10,635,954 $23,849,8342017 196,690 $13,213,880 $10,742,314 $23,956,1932018 198,657 $13,213,880 $10,849,737 $24,063,6162019 200,644 $13,213,880 $10,958,234 $24,172,1142020 202,650 $13,478,157 $11,067,816 $24,545,9742021 204,676 $13,478,157 $11,178,495 $24,656,6522022 206,723 $13,478,157 $11,290,280 $24,768,4372023 208,790 $13,478,157 $11,403,182 $24,881,3392024 210,878 $13,478,157 $11,517,214 $24,995,3712025 212,987 $13,478,157 $11,632,386 $25,110,5432026 215,117 $13,478,157 $11,748,710 $25,226,8672027 217,268 $13,478,157 $11,866,197 $25,344,354

ERDC/CERL TR-04-23 65
9 Lifecycle Cost Analysis
Key Assumptions of the Analysis
• Fort Wainwright’s coal-fired central plant will be required for the generation of steam as long as Fort Wainwright remains open.
• The installation has a current minimum power load of 10 MW in the summer and a maximum power load of 17 MW in the winter. The installation has a steam heat load of approximately 265,000 lb/hr during peak demand (at -60 °F)
• The installation has a projected year 2010 minimum power load of 20 MW in the summer and a maximum power load of 32.5 MW in the winter.
• The installation has a projected year 2010 steam heat load of approximately 400,000 lb/hr during peak demand (at –60 °F)
• The heating plant is currently the only method of supplying steam for heat-ing the facilities on the installation due the infrastructure of the utilidors. Fort Wainwright has an extensive steam supply and condensate infrastruc-ture in place that cannot be served from other steam sources, private or pub-lic.
• The initial investment required for the conversion to heating only project is $78,000,000.
• The annually recurring maintenance cost for the heating plant, backup gen-erator testing, and backup generator maintenance is $470,000.
• Additional operating costs are the cost of coal for the heating plant and the cost of electricity purchased from GVEA.
• This analysis has been generated using a discount rate of 3.2 percent
• This analysis uses the Inflation Index of 2.1 percent annually.
Life Cycle Cost Summary
Table 41 lists the lifecycle costs for each cost component with the inflation rates ap-plied. This information is the output of the ECONPACK software package provided by the U.S. Army Corps of Engineers. Table 42 lists the resulting annual present
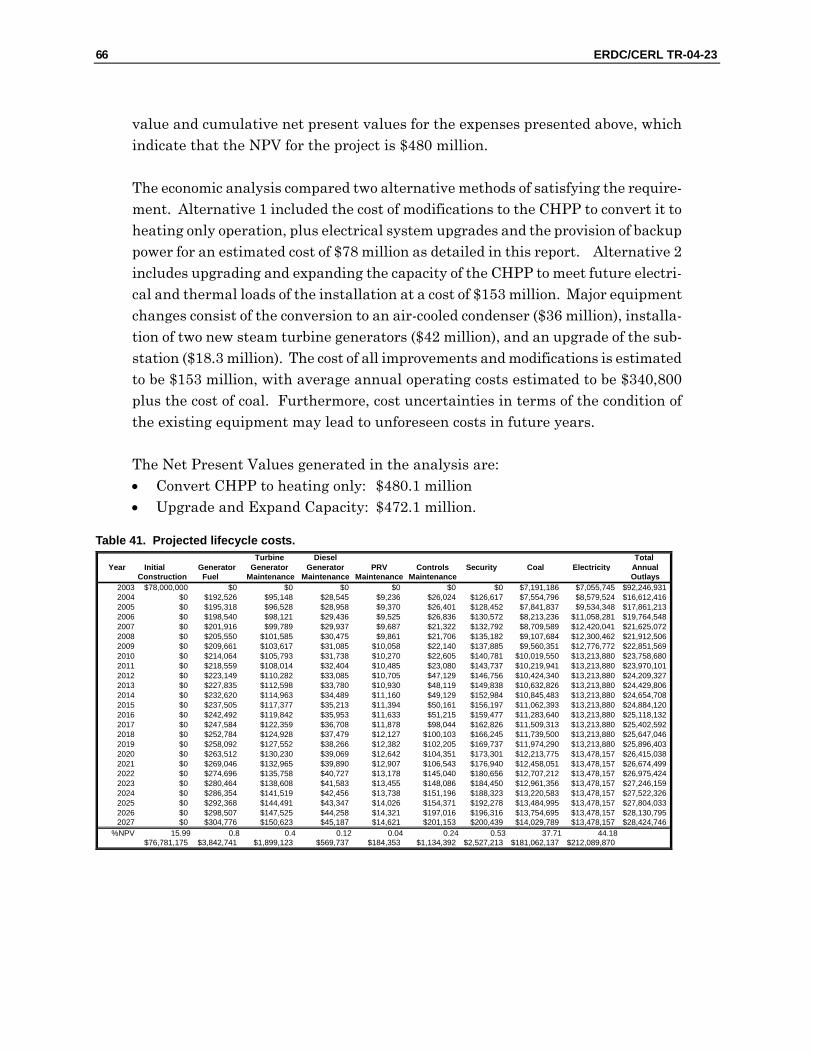
66 ERDC/CERL TR-04-23
value and cumulative net present values for the expenses presented above, which indicate that the NPV for the project is $480 million.
The economic analysis compared two alternative methods of satisfying the require-ment. Alternative 1 included the cost of modifications to the CHPP to convert it to heating only operation, plus electrical system upgrades and the provision of backup power for an estimated cost of $78 million as detailed in this report. Alternative 2 includes upgrading and expanding the capacity of the CHPP to meet future electri-cal and thermal loads of the installation at a cost of $153 million. Major equipment changes consist of the conversion to an air-cooled condenser ($36 million), installa-tion of two new steam turbine generators ($42 million), and an upgrade of the sub-station ($18.3 million). The cost of all improvements and modifications is estimated to be $153 million, with average annual operating costs estimated to be $340,800 plus the cost of coal. Furthermore, cost uncertainties in terms of the condition of the existing equipment may lead to unforeseen costs in future years.
The Net Present Values generated in the analysis are: • Convert CHPP to heating only: $480.1 million • Upgrade and Expand Capacity: $472.1 million.
Table 41. Projected lifecycle costs. Turbine Diesel Total
Year Initial Generator Generator Generator PRV Controls Security Coal Electricity AnnualConstruction Fuel Maintenance Maintenance Maintenance Maintenance Outlays
2003 $78,000,000 $0 $0 $0 $0 $0 $0 $7,191,186 $7,055,745 $92,246,9312004 $0 $192,526 $95,148 $28,545 $9,236 $26,024 $126,617 $7,554,796 $8,579,524 $16,612,4162005 $0 $195,318 $96,528 $28,958 $9,370 $26,401 $128,452 $7,841,837 $9,534,348 $17,861,2132006 $0 $198,540 $98,121 $29,436 $9,525 $26,836 $130,572 $8,213,236 $11,058,281 $19,764,5482007 $0 $201,916 $99,789 $29,937 $9,687 $21,322 $132,792 $8,709,589 $12,420,041 $21,625,0722008 $0 $205,550 $101,585 $30,475 $9,861 $21,706 $135,182 $9,107,684 $12,300,462 $21,912,5062009 $0 $209,661 $103,617 $31,085 $10,058 $22,140 $137,885 $9,560,351 $12,776,772 $22,851,5692010 $0 $214,064 $105,793 $31,738 $10,270 $22,605 $140,781 $10,019,550 $13,213,880 $23,758,6802011 $0 $218,559 $108,014 $32,404 $10,485 $23,080 $143,737 $10,219,941 $13,213,880 $23,970,1012012 $0 $223,149 $110,282 $33,085 $10,705 $47,129 $146,756 $10,424,340 $13,213,880 $24,209,3272013 $0 $227,835 $112,598 $33,780 $10,930 $48,119 $149,838 $10,632,826 $13,213,880 $24,429,8062014 $0 $232,620 $114,963 $34,489 $11,160 $49,129 $152,984 $10,845,483 $13,213,880 $24,654,7082015 $0 $237,505 $117,377 $35,213 $11,394 $50,161 $156,197 $11,062,393 $13,213,880 $24,884,1202016 $0 $242,492 $119,842 $35,953 $11,633 $51,215 $159,477 $11,283,640 $13,213,880 $25,118,1322017 $0 $247,584 $122,359 $36,708 $11,878 $98,044 $162,826 $11,509,313 $13,213,880 $25,402,5922018 $0 $252,784 $124,928 $37,479 $12,127 $100,103 $166,245 $11,739,500 $13,213,880 $25,647,0462019 $0 $258,092 $127,552 $38,266 $12,382 $102,205 $169,737 $11,974,290 $13,213,880 $25,896,4032020 $0 $263,512 $130,230 $39,069 $12,642 $104,351 $173,301 $12,213,775 $13,478,157 $26,415,0382021 $0 $269,046 $132,965 $39,890 $12,907 $106,543 $176,940 $12,458,051 $13,478,157 $26,674,4992022 $0 $274,696 $135,758 $40,727 $13,178 $145,040 $180,656 $12,707,212 $13,478,157 $26,975,4242023 $0 $280,464 $138,608 $41,583 $13,455 $148,086 $184,450 $12,961,356 $13,478,157 $27,246,1592024 $0 $286,354 $141,519 $42,456 $13,738 $151,196 $188,323 $13,220,583 $13,478,157 $27,522,3262025 $0 $292,368 $144,491 $43,347 $14,026 $154,371 $192,278 $13,484,995 $13,478,157 $27,804,0332026 $0 $298,507 $147,525 $44,258 $14,321 $197,016 $196,316 $13,754,695 $13,478,157 $28,130,7952027 $0 $304,776 $150,623 $45,187 $14,621 $201,153 $200,439 $14,029,789 $13,478,157 $28,424,746
%NPV 15.99 0.8 0.4 0.12 0.04 0.24 0.53 37.71 44.18$76,781,175 $3,842,741 $1,899,123 $569,737 $184,353 $1,134,392 $2,527,213 $181,062,137 $212,089,870

ERDC/CERL TR-04-23 67
Table 42. Present value and cumulative NPV. CUMULATIVE
YEAR PRESENT NET PRESENTVALUE VALUE
2003 $90,805,484 $90,805,4842004 $15,845,766 $106,651,2502005 $16,508,655 $123,159,9062006 $17,701,413 $140,861,3192007 $18,767,176 $159,628,4942008 $18,426,960 $178,055,4552009 $18,620,786 $196,676,2402010 $18,759,643 $215,435,8842011 $18,339,709 $233,775,5932012 $17,948,394 $251,723,9862013 $17,550,245 $269,274,2322014 $17,162,610 $286,436,8422015 $16,785,183 $303,222,0252016 $16,417,666 $319,639,6912017 $16,088,754 $335,728,4452018 $15,739,903 $351,468,3482019 $15,400,132 $366,868,4802020 $15,221,468 $382,089,9482021 $14,894,361 $396,984,3092022 $14,595,339 $411,579,6482023 $14,284,712 $425,864,3602024 $13,982,076 $439,846,4352025 $13,687,200 $453,533,6352026 $13,418,659 $466,952,2942027 $13,138,446 $480,090,741
Figure 14 shows the cumulative net present values of the two options, for compari-son.
FWA CHPP NPV Analysis
$0
$100,000,000
$200,000,000
$300,000,000
$400,000,000
$500,000,000
2003
2005
2007
2009
2011
2013
2015
2017
2019
2021
2023
2025
2027
Conversion to Heating Only CHPP Expansion
Figure 14. FWA CHPP NPV analysis.

68 ERDC/CERL TR-04-23
This economic analysis shows that the conversion of the CHPP to heating only is the lower first cost option and that the 25 year NPV is within 2 percent of the alterna-tive. The NPV of the heating only option is lower than the CHPP expansion option for the first 20 years until 2024 when they are nearly equal. Beyond 2024, the plant expansion, as modeled, has the more favorable NPV. The level of uncertainty of an-nual cost comparisons of the two options in the years beyond the first 15 is consid-ered fairly high as the probability of additional impacts increases. The main driver in the later years is that the annual outlay for electricity and coal is estimated to be greater than the cost of coal only for the generation of both electricity and heat.
A sensitivity analysis indicates that the results could favor either option if addi-tional costs were encountered during implementation, or if annual costs were to in-crease. The estimate with the highest certainty is the conversion to heating only as this approach relies more on new equipment purchase and a switch to electric sup-ply by the local utility, whereas the expansion option relies on continued reliability of the older existing equipment of the CHPP. Furthermore, the conversion to heat-ing only is favorable for discount rates above 4.3 percent and the plant expansion is favorable for discount rates less than 4.3 percent

ERDC/CERL TR-04-23 69
10 Environmental Considerations
Introduction
The CHPP conversion to a CHP will result in environmental impacts from changes at the CHPP and from the installation of new substations and backup power gen-erators. The potential impacts include air pollution emissions, groundwater and surface water contamination, noise, and increased exposure to electric and magnetic fields (EMF). From the viewpoint of both cost and environmental effects, air quality impacts are by far the most significant.
FWA produces air pollution emissions from a wide variety of sources including the CHPP, fuel storage and dispensing operations, aerospace activity, landfills, reme-diation sites, ozone depleting substances, and fugitive dust. The CHPP is by far the largest stationary source of air pollution at FWA. The primary pollutants from the CHPP are nitrogen oxides (NOx), sulfur oxides (Sox), and carbon monoxide (CO). FWA’s Title V Operating Permit Application indicates that estimated potential emissions of particulate matter (PM10) would be reduced from 749.0 tons/year (TPY) to 13.0 TPY after the completion of the ongoing baghouse project.
FWA’s Title V Operating Permit application reports that the installation is classi-fied as a Prevention of Significant Deterioration (PSD) Major Facility and a Nonat-tainment Area (NAA) Major Facility.* The application for an operating permit is now under review by the Alaska Department of Environmental Conservation (ADEC) and should be issued sometime in FY03. Fort Wainwright is located in a Serious CO nonattainment area. Future expansion at Fort Wainwright must in-
* Major stationary sources of air pollution and major modifications to major stationary sources are required by the
Clean Air Act to obtain an air pollution permit before commencing construction. The process, called new source re-view (NSR), is required whether the major source or modification is planned for an area where the national ambi-ent air quality standards (NAAQS) are exceeded (nonattainment areas), or where an area where air quality is ac-ceptable (attainment and unclassifiable areas). Permits for sources in attainment areas are referred to as prevention of significant air quality deterioration (PSD) permits, while permits for sources located in nonattainment areas (NAA) are referred to as NAA permits.

70 ERDC/CERL TR-04-23
clude careful consideration of how the increased activity will affect the quantity and type of air emissions from the installation.
The CHPP has been in violation of opacity limitations since opacity limitations have been part of the Alaska air pollution regulations. Poor opacity is caused by exces-sive emissions of particulate matter. PM emissions at the CHPP are only partly controlled by a multicyclone that offers good control efficiency for relatively large particles, but poor efficiency for the small particles that are the most efficient at creating high opacity plumes. Compliance with air quality regulations at the CHPP has been a major issue since 1992 when the ADEC began reporting violations of the opacity requirement. Fort Wainwright was subject to a formal complaint from USEPA because of emissions from the CHPP. The USEPA calculated a fine of $27.02M: $750,000 due to seriousness of violation, $12M due to recapture of eco-nomic benefit, and $14M due to size of business. Even though this penalty was re-duced to a maximum of $2M in Section 314 of the FY01 DOD Authorization Act, the Army was (and at this writing still is) contesting this penalty. The Army believes the penalties were not calculated properly and did not want this case to set a prece-dent.
CHPP Boiler Impacts on Emissions of Air Pollutants
The CHPP is currently undergoing projects to modernize the boilers and install bag-houses to control PM emissions. ADEC has issued construction permit 0031-AC059 to cover these changes and air pollution emissions from the Bassett Army Commu-nity Hospital Replacement project and planned soil restoration work. At the CHPP, the permit covers emissions from coal combustion in the boilers, propane combus-tion from in-duct heaters, and coal preparation activities. The propane duct burners are being installed to prevent low temperature flue gas from entering the baghouse during boiler startup, shutdown, or malfunctions. Once installed, a properly operat-ing baghouse should easily prevent the CHPP from exceeding opacity and flue gas concentration limits.
The construction permit contains limitations and conditions on the operations and emissions from the CHPP. Table 43 lists these limitations as they appear in Fort Wainwright’s Title V application. In most cases, these limitations were agreed upon by Fort Wainwright to prevent the changes from being classified as major under the provisions of the Prevention of Significant Deterioration (PSD) Major Facility or New Source Review (NSR) programs. All these conditions and limitations would remain in effect until the permit is modified or replaced by a new permit.

ERDC/CERL TR-04-23 71
Table 43. Permit application: enforceable limitations summary.
FORM 4B
Equipment or Group ID# Enforceable Limitation Compliance Method Descrip-
tion EU01 Central Heat and Power Plant
336,000 TPY coal Facility operating reports to record the amount of coal burned per month and maintain 12-month rolling total of coal consumption.
EU01 Central Heat and Power Plant
Visible emissions may not reduce visibility through the exhaust ef-fluent by greater than 20% for more than 3 minutes in any 1 hour.
Monitor and record opacity for each successive 10-second pe-riod using COMS.
EU01 Central Heat and Power Plant
Limit PM10 emissions to less than 0.05 gr./dscf
Reference Section 2 of the CAM Plan in Appendix F of this permit application. Comply with the Per-mit to Construct 0031-AC059 Conditions 28.1 thru 28.3.
EU01 Central Heat and Power Plant
SO2 emissions may not exceed 500 PPM averaged over 3 hours.
Conduct an analysis of a repre-sentative sample using the proce-dures established in ASTM D3176-74 to determine the weight percent, dry basis of sulfur, car-bon, nitrogen, and oxygen. For the same boiler load used in the calculation, determine the volume percent of oxygen in the exhaust with an oxygen analyzer or by an ORSAT analysis, and calculate the 3-hour exhaust concentration of SO2.
EU01 Central Heat and Power Plant
Atmospheric gas emissions shall not exceed 20% opacity or greater.
Monitor and record opacity for each successive 10-second pe-riod using COMS.
EU01 Central Heat and Power Plant
Limit monthly average steam pro-duction to 150,000 lbs/hr/b/r.
Calculate and record the average daily steam production rate based on hours of operation per day and steam production readings re-corded at no less than 10-minute intervals.
EU01 Central Heat and Power Plant
Burn a grade of propane with a fuel sulfur content not to exceed 250 PPM by weight
Obtain a certification from sup-plier. If certification is unavailable, analyze a sample of fuel from each shipment to determine sulfur content using an approved ASTM method.

72 ERDC/CERL TR-04-23
FORM 4B
Equipment or Group ID# Enforceable Limitation Compliance Method Descrip-
tion EU01 Central Heat and Power Plant
Limit the total NOx emissions to two tons (1) per 12-month rolling period.
Monitor and record the cumulative total monthly NOx emissions. Calculate and record the cumula-tive 12-month rolling total NOx emissions using the run time for each burner system. Alternatively, NOx emissions can be calculated by monitoring fuel burner propane consumption, and calculating the emission rates using the pub-lished AP-42 emission factor 19lbs NOx /1000 gallons of pro-pane burned. Based on this heat-ing value of propane, 90,500 Btu/gal., this factor is equivalent to 0.210 lbs NOx /MMBtu. Report in the Facility Operating Report required by the Permit to Con-struct 0031-AC059 Condition 41, the cumulative monthly and 12-month rolling total NOx emissions.
EU01 Central Heat and Power Plant
Do not use coal containing greater than 30% by weight fines content.
Analyze a sample from each coal shipment to determine fine con-tent using an approved ASTM method.
The conversion of the CHPP to a CHP would initially result in significantly less coal being burned. Emissions would be proportionately reduced. For example, if the conversion of the CHPP occurred in FY03, it is anticipated that the coal usage rate at the CHP would drop from 204,523 TPY to 134,800 TPY. However, because of the large expansion projects planned for Fort Wainwright, the coal consumption re-quired to meet the annual heating load would grow back to 200,000 TPY by 2010. Table 44 shows both the estimated emission reductions in 2003 and the follow on emission increases in 2010 that would occur with these changes in coal usage. Fig-ure15 shows these same changes graphically for NOx, CO, and SO2. All emission rates were estimated using the same procedures used in the Title V application. The PM and PM10 emission rates shown in Table 44 are estimates of the emissions after the baghouse is installed at the CHPP. The emission decreases that would oc-cur after the conversion to a CHP cannot be credited as a net emission decrease since the decreases will be essentially eliminated by 2010 and the decreases would not be permanent or enforceable.

ERDC/CERL TR-04-23 73
Table 44. Estimated actual emission changes of criteria air pollutants at the CHPP (tons/year).
Year Pollutant 2002 2003 2010
NOx 726.06 478.54 710.00CO 511.31 337.00 500.00SO2 608.46 401.03 595.00PM — 8.09 12.00PM10 — 4.85 7.20VOC 5.11 3.37 5.00
0
100
200
300
400
500
600
700
800
2000
2001
2002
2003
2004
2005
2006
2007
2008
2009
2010
Year
TPY
NOx Source TestCOSO2
Figure 15. Actual emissions changes at the coal fired boilers.
The possible exception to this would be if FWA were willing to accept a lower limita-tion on coal usage. This limitation is probably not a good idea since it would effec-tively reduce the capacity of the CHP to produce heat up to its full capabilities. Ta-ble 45 shows estimates of emission changes for many other pollutants. All emission factors used to make these emission estimates were taken from FWA’s Title V ap-plication.
Although the emissions at the CHP would grow significantly in response to the in-creased heat load, these increases would not be counted towards the NOx threshold levels (significance levels) that would trigger PSD permit review or NSR. This is because the emission increases are related to changes in process throughput and not to a physical or permanent process change. Changes in throughput do not trigger PSD permit review or NSR.

74 ERDC/CERL TR-04-23
Table 45. Estimated actual emission changes at the CHPP (lb/year).
Year Pollutant 2002 2003 2010
Arsenic 83.85443 55.268 82 Beryllium 4.294983 2.8308 4.2 Formaldehyde 7.36E-10 4.85E-10 7.2E-10 Hydrochloric Acid Mist 245427.6 161760 240000 Hydrofluoric Acid Mist 30678.45 20220 30000 Antimony 3.681414 2.4264 3.6 Cadmium 10.43067 6.8748 10.2 Chromium 53.17598 35.048 52 Chromium (VI) 16.15732 10.6492 15.8 Cobalt 20.4523 13.48 20 Magnesium 2249.753 1482.8 2200 Manganese 100.2163 66.052 98 Mercury 16.97541 11.1884 16.6 Nickel 57.26644 37.744 56 Selenium 265.8799 175.24 260 Biphenyl 0.347689 0.22916 0.34 Acenaphhene 0.104307 0.068748 0.102 Acenapthylene 0.051131 0.0337 0.05 Anthracene 0.04295 0.028308 0.042 Benzo(a)anthracene 0.016362 0.010784 0.016 Benzo(a)pyrene 0.007772 0.005122 0.0076 Benzo(b,j,k)fluoranthene 0.022498 0.014828 0.022 Benzo(g,h,I)perylene 0.005522 0.00364 0.0054 Chrysene 0.020452 0.01348 0.02 Fluoranthene 0.145211 0.095708 0.142 Fluorine 0.186116 0.122668 0.182 Indeno(1,2,3-cd)pyrene 0.012476 0.008223 0.0122 Napthalene 2.658799 1.7524 2.6 Phenanthrene 0.552212 0.36396 0.54 Pyrene 0.067493 0.044484 0.066 5-Methyl chrysene 0.0045 0.002966 0.0044 2,3,7,8-TCDD 2.92E-06 1.93E-06 2.86E-06 Total TCDD 1.9E-05 1.25E-05 1.86E-05 Total PeCDD 9.14E-06 6.03E-06 8.94E-06 Total HxCDD 5.87E-06 3.87E-06 5.74E-06 Total HpCDD 1.71E-05 1.12E-05 1.67E-05 Total OCDD 8.51E-05 5.61E-05 8.32E-05 Total PCDD 0.000136 8.98E-05 0.000133 2,3,7,8-TCDF 1.04E-05 6.87E-06 1.02E-05 Total TCDF 8.26E-05 5.45E-05 8.08E-05 Total PeCDF 7.22E-05 4.76E-05 7.06E-05 Total HxCDF 3.93E-05 2.59E-05 3.84E-05

ERDC/CERL TR-04-23 75
Year Pollutant 2002 2003 2010
Total HpCDF 1.57E-05 1.04E-05 1.54E-05 Total OCDF 1.36E-05 8.94E-06 1.33E-05 Total PCDF 0.000223 0.000147 0.000218 Acetaldehyde 116.5781 76.836 114 Acetophenone 3.067845 2.022 3 Acrolein 59.31167 39.092 58 Benzene 265.8799 175.24 260 Benzyl chloride 143.1661 94.36 140 Bis(2-ethylhexyl)phthalate 14.93018 9.8404 14.6 Bromoform 7.976397 5.2572 7.8 Carbon disulfide 26.58799 17.524 26 2-Chloroacetophenone 1.431661 0.9436 1.4 Chlorobenzene 4.499506 2.9656 4.4 Chloroform 12.06686 7.9532 11.8 Cumene 1.083972 0.71444 1.06 Cyanide 511.3075 337 500 2,4-Dinitrotoluene 0.057266 0.037744 0.056 Dimethyl sulfate 9.817104 6.4704 9.6 Ethyl benzene 19.22516 12.6712 18.8 Ethyl chloride 8.589966 5.6616 8.4 Ethylene dichloride 8.18092 5.392 8 Ethylene dibromide 0.245428 0.16176 0.24 Formaldehyde 49.08552 32.352 48 Hexane 13.70304 9.0316 13.4 Isophorone 118.6233 78.184 116 Methyl bromide 32.72368 21.568 32 Methyl chloride 108.3972 71.444 106 Methyl ethyl ketone 79.76397 52.572 78 Methyl hydrazine 34.76891 22.916 34 Methyl methacrylate 4.09046 2.696 4 Methyl tert butyl ether 7.158305 4.718 7 Methylene chloride 59.31167 39.092 58 Phenol 3.272368 2.1568 3.2 Propionaldehyde 77.71874 51.224 76 Tetrachloroethylene 8.794489 5.7964 8.6 Toluene 49.08552 32.352 48 1,1,1-Trichloroethane 4.09046 2.696 4 Styrene 5.113075 3.37 5 Xylenes 7.567351 4.9876 7.4 Vinyl acetate 1.554375 1.02448 1.52 Total Trace Metals 2793.989 1841.503 2732.2 Total Polynuclear Aromatic 4.245488 2.798178 4.1516 Hydrocarbons (PAH)

76 ERDC/CERL TR-04-23
Year Pollutant 2002 2003 2010
Total PCDD/PCDF 0.00036 0.000237 0.000352 Total Various 1878.826 1238.324 1837.276 Organic Cmpds (TVOC) (PAH+PCDD/PCDF+TVOC) 1883.072 1241.122 1841.428 Total Trace HAPs
The CHP can continue to increase boiler output until it violates one of the enforce-able limitations shown in Table 43. It is unlikely that any of these limitations would be violated since they allow the CHP to operate at near full capacity. How-ever, if a significant physical or permanent process change were made at the CHPP, then the commensurate emission changes would need to be considered in an NSR applicability analysis at FWA.
Potential Environmental Impacts of New Substations
Stormwater Runoff Management During Construction and Operation
This should be minor to negligible, and should be mitigable.
Possible Adverse Health Impacts on Nearby Residents During the Operational Phase of the Project
Potential human health impacts due to exposure to electric and magnetic fields (EMF) during operation of the proposed substations are addressed. An authorita-tive report under the auspices of the National Institute of Environmental Health Sciences noted that evidence from epidemiological studies suggests “small increased risk with increasing exposure” associated with two forms of cancer, childhood leu-kemia and chronic lymphocytic leukemia in occupationally exposed adults. How-ever, the results of laboratory (animal and human) toxicology and mechanistic stud-ies predominantly fail to indicate a cause-and-effect relationship between exposure to EMF at environmental levels and disease. Magnetic field levels in the vicinity of the proposed substation were calculated for current and future peak summer load-ing conditions, using a computer model that has been tested and verified by power engineers. The highest magnetic fields occur inside the substation yard fence and under the transmission lines, and the magnetic field levels decay with increasing distance from the transmission lines and the transformers. Future magnetic fields along the Installation perimeter fences adjoining the substation will be highest near the northwest corner of the substation. These calculated results indicate magnetic fields ranging from background low levels (comparable to the lowest values meas-

ERDC/CERL TR-04-23 77
ured under indoor home conditions) to maximum values similar to magnetic fields found within a few inches of common household appliances.
Noise Impacts
Noise impacts from operation of the proposed substations need to be addressed. This would require data from GVEA on noise levels around their standard substa-tion. Possible language:
Future noise levels were estimated for the initial installation (one transformer) and maximum loading (four transformers), based on measured current ambient sound levels at the site. The results indicate that low-noise transformers must be used. DPW will install fence slatting along the northern substation yard fence, and slatting will be provided along the northern Installation perimeter fence to attenuate noise levels for homes adjoining the northern Installation pe-rimeter fence. In addition, AP proposes tree planting in the limited available space between the fences. The combined effects of these measures will reduce the noise levels for the potentially affected homes and will be in compliance with the regulations governing noise in residential areas. DPW will conduct noise level surveys of the substation following the installation of each of the transform-ers to ensure regulatory compliance.
Cumulative Environmental Impacts
Increased stormwater runoff is a potential cumulative impact that must be miti-gated. No other identifiable cumulative environmental impacts from the proposed action are apparent.
Operation of the substation at full capacity will increase noise and magnetic field levels in the vicinity. Fence slatting and planting of trees will mitigate noise levels below State of Alaska regulatory limits. Also, DPW will conduct noise level surveys of the initial substation and later increases in capacity to ensure regulatory compli-ance. Although magnetic field levels will increase with operation of the substation, they will remain within the range of typical indoor home environments. A cause-and-effect relationship between such EMF levels and adverse human health im-pacts has not been demonstrated.
Conclusions
The principal conclusions are: (1) Implementation of the proposed actions would result in no significant, nonmitigable, adverse environmental or socioeconomic im-pacts related to the construction phase of the project. There is no compelling evi-

78 ERDC/CERL TR-04-23
dence that operation of the substations will cause adverse impacts to human health. (2) Siting the substation at another location would either be incompatible with the availability of suitable land elsewhere on installation, based on current land use planning, or outside the Installation and near the existing substation and transmis-sion lines.
Potential Environmental Impacts of Backup Power Generators
Air Quality Impacts
The conversion to a CHP requires the installation of large diesel-fired electrical gen-erators to provide full backup in the case of electrical interruption from GVEA. Al-though these generators would be operated infrequently, their large size would re-sult in significant emissions after a short period of operation. Table 46 lists the generators used in the recommended backup options. This generator mix is de-signed to completely cover the maximum peak electrical demand of 32.5 MW antici-pated for 2010.
Table 46. Backup generator required for conversion to CHP.
Type and size Number of Sets Total Generation 6.5 MW Combustion turbine 5 32.5 MW 0.15 MW Reciprocating engine 2 0.30 MW 1.5 MW Reciprocating engine 4 6 MW
A combination of EPA and vendor provided emission factor information was used to estimate potential emissions from these generators. Since the largest emissions from these generators are NOx and CO, vendor guaranteed emission factors were obtained for these pollutants. Most manufacturers of backup electrical power sys-tems can provide equipment that generates much smaller emissions of NOx than would be predicted using EPA emission factors. FWA could take advantage of this by adding required emission levels to the electrical generator equipment specifica-tions and then adding these same emissions levels to a construction permit as a user requested limitation to avoid triggering PSD permit review. These emission levels would likely need to be verified through periodic emissions stack tests. Ta-bles 47 and 48 list both EPA and vendor provided emission factors for criteria air pollutants for combustion turbine generators and diesel engine generators, respec-tively. Note the decrease from the EPA NOx emission factor to the vendor provided NOx emission factor.

ERDC/CERL TR-04-23 79
Table 47. Criteria air pollutant emission factors for combustion turbine generators (lb/MMBtu) fuel input.
Pollutant Emission FactorNOx 8.80E-01 NOx from vendor 3.70E-01 CO 3.30E-03 CO from vendor 1.18E-01 SO2 3.03E-01 VOC 4.10E-04 PM 1.20E-02 Pb 1.40E-05
Table 48. Criteria air pollutant emission factors for reciprocating engine generators (lb/hp-hr) power output.
Pollutant Emission Factor NOx 2.40E-02 NOx from vendor 1.50E-02 CO 5.50E-03 CO from vendor 1.50E-03 SO2 2.43E-03 PM 7.00E-04 VOC 7.10E-04
To not trigger EPA PSD reviews, the generators can only be operated in a manner that generates no more than an estimated 20.32 TPY of NOx. This number repre-sents the difference between the 40 TPY NOx increase threshold that triggers PSD permit review and the estimated 19.68 TPY increase in NOx stemming from new facilities at FWA (e.g., deployment of the Stryker Brigade Combat Team (SBCT) at FWA). Table 49 shows the changes in emissions relative to the change thresholds that trigger PSD reviews for all criteria pollutants.
The amount of NOx emitted will depend on the amount of time the generators are operated and the mixture of reciprocating engine and combustion turbine genera-tors. An analysis was performed to estimate emissions from both generator types, combine them, and add in the effects of the other planned combustion sources at FWA. Table 50 shows criteria air pollutant emission estimates for the five 6.5 MW combustion turbine generators at different operating intervals. Table 51 shows the same emission estimates for the reciprocating engine generators. Assuming that both types of generators are operated for the same amount of time for maintenance and backup power production, then the emissions can be added to estimate total emissions from both generator types.

80 ERDC/CERL TR-04-23
Table 49. Cumulative net emission change for PSD evaluation at Fort Wainwright main post.
Pollutant Emissions (tons/year) Activity NOx Sox CO VOC PM10
Emissions Baseline 2,848 1,310 2,388 163 768 CHPP Upgrade/Baghouse Project 0 0 0 0 -546.2 Install Boilers and Generators at new hospital 9.63 2.91 2.23 0.31 0.35 Remove Boilers and Generators at Bassett -0.17 -0.02 -0.04 -0.01 -0.01 SBCT EIS Projects 8.32 0.55 1.79 0.67 0.62 SBCT Vehicle Fielding, Deployment, Training, Maneuver Activities
1.9 0 0.7 0.3 19.4
Net Emissions Change 19.68 3.44 4.68 1.27 -525.84 PSD/NSR Thresholds 40 40 100 40 15
Table 50. Emission calculations for five 6.5 MW turbine generators (tons/year).
Operating time (hours/year) Pollutant 120 200 350 500 8760
NOx 19.9 33.2 58.1 82.9 1,453.1 NOx from vendor 8.4 13.9 24.4 34.9 611.0 CO 0.1 0.1 0.2 0.3 5.4 CO from vendor 2.7 4.4 7.8 11.1 194.8 SO2 6.9 11.4 20.0 28.6 500.3 VOC 0.0 0.0 0.0 0.0 0.7 PM 0.3 0.5 0.8 1.1 19.8
Table 51. Emission calculations for four 1.5 MW and two 0.15 MW reciprocating engine generators (tons/year).
Operating time (hours/year) Pollutant 120 200 350 500 8,760
NOx 12.2 20.3 35.5 50.7 887.7 NOx from vendor 7.6 12.7 22.2 31.7 554.8 CO 2.8 4.6 8.1 11.6 203.4 CO from vendor 0.8 1.3 2.2 3.2 55.5 SO2 1.2 2.0 3.6 5.1 89.8 PM 0.4 0.6 1.0 1.5 25.9 VOC 0.4 0.6 1.0 1.5 26.3
The generator emissions can then be added to emissions shown in Table 49 to ac-count for all emissions contributing towards the NOx threshold. Figure 16 shows how NOx and other criteria air pollutants will vary with the operating time of the backup generators when the emissions from Table 49 are included.

ERDC/CERL TR-04-23 81
0
40
80
120
160
200
0 100 200 300 400 500 600
Operating Hours of Generators Needed for Conversion to CHP
TPY
NOx EPANOx from vendorCO EPACO from vendorSO2 EPAPM EPAVOC EPA
Figure 16. Emissions from new combustion sources at FWA contributing towards the PSD threshold for NOx.
If EPA emission estimation methods are used, the generators could run 75 hrs be-fore the NOx threshold is exceeded. If vendor guaranteed emission estimates are used, then the generators could operate 151 hrs before exceeding the threshold. The hours of operation include the generator operation time required for maintenance purposes which could be as much as 2 hrs a month. If the generators are run 2 hrs a month for maintenance, that leaves 51 or 127 hrs of operation allowed for generat-ing emergency power. To avoid a PSD permit review, FWA must either accept this level of limitation on the hours of operation of the generators in a permit, add NOx emission control technology to the generators, or create a creditable NOx emission reduction at another combustion source. The EPA has published emission factors for noncriteria air pollutants for both combustion turbines and diesel powered recip-rocating engines. Table 52 lists these emission factors and corresponding emission estimates for the five 6.5 MW combustion turbine generators and Table 53 contains emission estimates for the four 1.5 MW reciprocating engine generators.
Since the generators are powered by diesel fuel, emissions of volatile organic com-pounds (VOCs) will occur. The emissions occur during tank filling and from breath-ing losses due to temperature changes. These emissions can be estimated using the EPA’s TANKS storage tank emissions calculation software. TANKS allows users to enter specific information about a storage tank (dimensions, construction, paint condition, etc.), the liquid contents (chemical components and liquid temperature), and the location of the tank (nearest city, ambient temperature, etc.), and generate an air emissions report.

82 ERDC/CERL TR-04-23
Table 52. Non-criteria emission estimates for five 6.5 MW combustion turbine generators (lbs/year).
Operating hours/year
Pollutant Emission Factor
(lbs/MMBTU) 120 200 350 500 8760 TOC 4.00E-03 180.96 301.6 527.8 754 13210.08 1,3-Butadiene 1.60E-05 0.72384 1.2064 2.1112 3.016 52.84032 Benzene 5.50E-05 2.4882 4.147 7.25725 10.3675 181.6386 Formaldehyde 2.80E-04 12.6672 21.112 36.946 52.78 924.7056 Naphthalene 3.50E-05 1.5834 2.639 4.61825 6.5975 115.5882 PAH 4.00E-05 1.8096 3.016 5.278 7.54 132.1008 Arsenic 1.10E-05 0.49764 0.8294 1.45145 2.0735 36.32772 Beryllium 3.10E-07 0.0140244 0.023374 0.040905 0.058435 1.023781Cadmium 4.80E-06 0.217152 0.36192 0.63336 0.9048 15.8521 Chromium 1.10E-05 0.49764 0.8294 1.45145 2.0735 36.32772 Lead 1.40E-05 0.63336 1.0556 1.8473 2.639 46.23528 Manganese 7.90E-04 35.7396 59.566 104.2405 148.915 2608.991 Mercury 1.20E-06 0.054288 0.09048 0.15834 0.2262 3.963024Nickel 4.60E-06 0.208104 0.34684 0.60697 0.8671 15.19159 Selenium 2.50E-05 1.131 1.885 3.29875 4.7125 82.563
Table 53. Non-criteria emission estimates for four 1.5MW and two 0.15 MW reciprocating engine generators (lbs/year).
Operating Hours/Year
Pollutant Emission Factor
(lbs/MMBTU) 120 200 350 500 8760 Benzene 7.76E-04 4.98825216 8.3137536 14.54907 20.78438 364.1424 Toluene 2.81E-04 1.80631296 3.0105216 5.268413 7.526304 131.8608 Xylenes 1.93E-04 1.24063488 2.0677248 3.618518 5.169312 90.56635 Propylene 2.79E-03 17.9345664 29.890944 52.30915 74.72736 1309.223 Formaldehyde 7.89E-05 0.50718182 0.845303 1.47928 2.113258 37.02427 Acetaldehyde 2.52E-05 0.16198963 0.2699827 0.47247 0.674957 11.82524 Total HAPs Sum of above 26.6389379 44.39823 77.6969 110.9956 1944.642 Acrolein 7.88E-06 0.0506539 0.0844232 0.147741 0.211058 3.697735 Naphthalene 1.30E-04 0.8356608 1.392768 2.437344 3.48192 61.00324 Acenaphthylene 9.23E-06 0.05933192 0.0988865 0.173051 0.247216 4.33123 Acenaphthene 4.68E-06 0.03008379 0.0501396 0.087744 0.125349 2.196117 Fluorene 1.28E-05 0.08228045 0.1371341 0.239985 0.342835 6.006473 Phenanthrene 4.08E-05 0.26226893 0.4371149 0.764951 1.092787 19.14563 Anthracene 1.23E-06 0.00790664 0.0131777 0.023061 0.032944 0.577184 Fluoranthene 4.03E-06 0.02590548 0.0431758 0.075558 0.10794 1.8911 Pyrene 3.71E-06 0.02384847 0.0397475 0.069558 0.099369 1.740939 Benz(a)anthracene 6.22E-07 0.00399832 0.0066639 0.011662 0.01666 0.291877 Chrysene 1.53E-06 0.00983508 0.0163918 0.028686 0.04098 0.717961 Benzo(b)fluoranthene 1.11E-06 0.00713526 0.0118921 0.020811 0.02973 0.520874

ERDC/CERL TR-04-23 83
Operating Hours/Year
Pollutant Emission Factor
(lbs/MMBTU) 120 200 350 500 8760 Benzo(k)fluoranthene 2.18E-07 0.00140134 0.0023356 0.004087 0.005839 0.102298 Benzo(a)pyrene 2.57E-07 0.00165204 0.0027534 0.004818 0.006883 0.120599 Indeno(1,2,3-cd)pyrene 4.14E-07 0.00266126 0.0044354 0.007762 0.011089 0.194272 Dibenz(a,h)anthracene 3.46E-07 0.00222414 0.0037069 0.006487 0.009267 0.162362 Benzo(g,h,l)perylene 5.56E-07 0.00357406 0.0059568 0.010424 0.014892 0.260906 TOTAL PAH 2.12E-04 1.36276992 2.2712832 3.974746 5.678208 99.4822
Figures 17 and 18 show screen captures of the tanks’ physical characteristics and emission report outputs for the combustion turbine generators’ fuel tank and the reciprocating engine generators’ fuel tank. Both tanks were assumed to be above-ground and that the entire tank contents would be replaced every year. The throughput assumptions are very conservative since, during most years, the genera-tors would only be operated for maintenance purposes and the fuel tanks are sized to provide a full week of fuel. The TANKS program did not include fuel properties for arctic diesel fuel so jet kerosene was selected instead. This again is a conserva-tive assumption since jet kerosene is more volatile than arctic diesel.
The fuel for the combustion turbines would be supplied by a single tank as specified in Figure 17 while the fuel for the reciprocating engines will be supplied by two of the fuel tanks specified in Figure 18. So the total annual VOC emissions would be:
28.27 lbs + 2 * 7.76 lbs = 44 lbs/yr
These emissions are much smaller than the combustion emissions from the opera-tion of the generators and therefore their impacts are of much less concern.
Since the new generators could be a source that causes FWA to exceed the NOx threshold, FWA may need to evaluate emission control technologies for the backup power generation equipment (e.g., diesel engine and combustion turbine generators) to proactively avoid PSD permitting. The most likely control technology for NOx would be selective catalytic reduction (SCR). SCR controls NOx emissions by inject-ing ammonia (NH3) into the exhaust gas stream upstream of a catalyst. Nitrogen oxides, NH3, and O2 react on the surface of the catalyst to form N2 and H2O.

84 ERDC/CERL TR-04-23
Figure 17. Tank assumptions and emissions from fuel tank for combustion turbines.
The exhaust gas must contain a minimum amount of O2 and be within a particular temperature range (typically 450 to 850 °F) for the SCR system to operate properly. SCR has been applied to both diesel-powered reciprocating engines and combustion turbines. Note—these applications are normally not for backup power generation, but for a more continuous use of these combustion sources. The emission control analysis would need to include costs to purchase the equipment, supply an ammonia source, replace the catalyst as it is consumed, monitor the process as specified in a compliance assurance monitoring plan (CAMPLAN), and provide maintenance.

ERDC/CERL TR-04-23 85
Figure 18. Tank assumptions and emissions from fuel tank for reciprocating engine generators.
The application of SCR to generators that are operated on such a limited basis would not be as cost effective on a $/(mass of NOx removed) basis as the application of SCR to sources that are operated more frequently. The amount of catalyst re-quired and the dimensions of the reaction chamber are sized by the flow rate from the combustion process. This is to allow the correct amount of reaction time and contact between the flue gas and the catalyst. Therefore, even though these sources would be operated infrequently, they would require the same amount of catalyst and the same size of reaction chamber as a source with the same flow rate operated on a continuous basis. Some cost savings would occur from infrequent operation for catalyst replacement and purchase of NH3 containing reagent. However, if NOx control is ever required at FWA it may be more cost effective to apply the control technology at a more continuously operated source.
Noise Impacts
Noise impacts from operation of the proposed generators needs to be addressed. Need data from vendors or existing facilities at FWA.

86 ERDC/CERL TR-04-23
Stormwater Runoff Management During Construction and Operation
This should be minor to negligible and mitigable.
Odors
The exhaust gases produces during operation and fuel filling and storage will pro-duce minor short duration odors.
Flood Hazards and Encroachment on Wetlands
The facility site is located in a flood plain, but is protected by the Chena River Lakes flood control project, activated in March 1984. These facilities are subject to flooding under certain conditions. However, the mission dictates that these are lo-cated as proposed. The facilities will be designed and sited to minimize adverse ef-fects on flood heights and damages to the structure or contents resulting from floods.
Protection of Historic Properties
This project will not include any new structures that will encroach upon the Ladd Air Force Base Historic District (or Ladd Field National Historic District centered on runways). Therefore, no historic Properties at Fort Wainwright are affected.
This project has been evaluated for impact on historic and archeological property and complies with the National Historic Preservation Act (PL 89-665), as amended, and EO 11593. Figure 19 shows the location of the Ladd Field National Historic District by a dashed green line that surrounds the Ladd Field air field and some buildings in the southwest corner.
Summary/Conclusion
The CHPP conversion to a CHP will result in environmental impacts from changes at the CHPP and from the installation of new substations and backup power gen-erators. The largest environmental impacts from this project will be related to air pollution emission from the CHP and new backup power generators. After the CHPP is converted to a CHP, air pollution emissions will initially drop, but will re-cover to near pre-CHP levels by 2010 — due to the large expected increase in heat-ing load at FWA as new missions such as the Stryker Brigade come online at FWA.

ERDC/CERL TR-04-23 87
Figure 19. LADD AFB, Fort Wainwright, AK.
However, the emission levels at the CHPP will be much larger in 2010 without the conversion to a CHP since the plant must still burn coal to produce electricity. An estimate of the emissions in 2010 can be calculated by adding the drop in emissions from 2002 to 2003 to the values shown in 2010 (cf. Table 44). Tables 52 and 53 show new emissions from the backup electrical generators for various operating hours. Since the proposed electrical backup capability is so large, these generators will produce large emissions even with a modest number of operating hours. Fig-ures 17 and 18 show estimated VOC emissions from the large fuel tanks required for the generators. These emissions are quite small when compared with the com-bustion emissions.
The environmental costs for converting the CHPP to a CHP will include permit preparation, new recordkeeping, emission fees, and possibly new emission control technology. Without a PSD permit review, permitting activity could include: • preparation of a construction permit for the new generators • modification of the Title V operating permit • modification of FWA’s CAM plan • preparation of an Environmental Assessment (EA) for the conversion project • performance of a conformity analysis • modification of FWA’s emergency response plan • modification of FWA’s spill prevention plan • modification of FWA’s storm water pollution prevention plan.

88 ERDC/CERL TR-04-23
In addition, mitigation costs might be incurred while converting the plant to a CHP for asbestos, lead-based paint, and equipment containing PCBs. The exact cost of this extra work is difficult to estimate and some of it would be performed by FWA staff. However, the costs will certainly be several hundreds of thousands of dollars.
If PSD permit review were triggered, the costs would be significantly higher. With the exception of the conformity analysis, all the costs listed above would again be incurred. PSD review requirements would include the following items: • atmospheric monitoring • dispersion modeling studies (local pollutant concentrations and regional
haze) • Best Available Control Technology (BACT) analysis • permit preparation.
FWA has already undertaken an atmospheric monitoring project that should meet the requirements for PSD. The other aspects of the PSD preparation would cost on the order of $300,000. However, the conditions of the PSD permit are likely to add more cost than the permit preparation. A BACT determination by ADEC could re-sult in the requirement to add air pollution control. The most likely NOx control technology would be SCR. Purchase and installation of SCR would add several mil-lions of dollars to the purchase price of the generators and significant recurring costs would be incurred for catalyst replacement, makeup reagent, SCR system maintenance, and recordkeeping. ADEC could also require the installation of con-tinuous emission monitors (CEM) for NOx, which would add cost for purchase, certi-fication, maintenance, and recordkeeping.
From the viewpoint of costs incurred due to environmental regulations, continued operation of the plant in its current configuration is the lowest cost option. This is because changes in emissions from increased throughput in a process do not count towards NSR levels of significance. However, if a future physical or operational change is made at the CHPP that can be linked to an emission increase then a PSD permit review for NOx is likely. All the requirements discussed in the paragraph above would then apply to the CHPP. Since the threshold for NOx is relatively small at FWA, a careful PSD applicability analysis must be performed for any new potential source of NOx at FWA.

ERDC/CERL TR-04-23 89
11 Anti-Terrorism/Force Protection Meetings were held with installation physical security personnel and as a result, the following measures were incorporated into the CHP project.
Location of New Infrastructure
The new substations and structures housing the backup generators are to be located so that the remaining tree lines and existing facilities will impair the line of sight to the new construction to obscure from snipers outside the installation perimeter.
New Electrical Substations
The substations will be surrounded with a fence of a height equal to the height of the highest portion of the substation transformers and not less than a height of 6 ft. The fence will consist of a woven wire fencing material that includes a fill material that will provide a visual obstruction into the substation from the outside of the fencing. The fence will have general-purpose barbed tape/concertina wire installed at the top of the fence and at both inside and outside of the bottom of the fence. The fence will include ¾-in. aircraft cable placed around the perimeter at a height of 30 and 36 in. anchored to deadmen located at each corner of the fence. The fence will be located such that it is a minimum of 10 m from any equipment located within the fence. On the exterior of the fence, there will not be any structures or substantial vegetation within 10 m. There will be an improved road outside the fence to allow for a security patrol.
Access to the substation though the fence will be provided through a rolling gate that contains a swing arm cable (Delta Scientific TT212 or equal).
The interior of the substation will be illuminated to a lighting level greater than or equal to 1.0 foot-candle/sq ft. The exterior of the substation to a distance of 10 me-ters will be illuminated to level greater than or equal to 1.0 foot-candle/sq ft. All lighting will be controlled through a photocell and also have a 60 minute timer switch for manual operation located inside the fenced area.

90 ERDC/CERL TR-04-23
CCTV cameras will be installed inside the fenced area and placed in such a manner as to cover the entire clear zone inside the fence. Exterior sensors will be provided to cover the areas seen by the CCTVs. The location on the installation that will monitor the CCTVs and the sensors will be determined at a later time. Specifica-tions for the sensors will be provided at a later time.
The road to the substations will be designed so that a sharp right or left turn will be required immediately prior to the gate entrance. This is intended to inhibit the ability for a vehicle to gain significant speed for crashing through the gate.
Backup Generator Housing
The building(s) that will contain the backup generators will be designed and con-structed in accordance with the building conventions of the installation. The new building(s) will not have any windows. Personnel access doors will be a hollow metal type consisting of a metal rated at a minimum of 16 gage. The doors will have deadbolt with a throw of no less than 1.0 in. and an IDS sensor. Vehi-cle/equipment access doors will be a metal type consisting of a metal rated at a minimum of 16 gage.
The generator building(s) will be surrounded with a fence of a height equal to the height of the building walls and not less than a height of 6 ft. The fence will consist of a woven wire fencing material. The fence will have general-purpose barbed tape/concertina wire installed at the top of the fence and at both inside and outside of the bottom of the fence. The fence will include ¾-in. aircraft cable placed around the perimeter at a height of 30 and 36-in. anchored to deadmen located at each cor-ner of the fence. The fence will be located such that it is a minimum of 10 meters from any equipment located within the fence. On the exterior of the fence, there will not be any structures or substantial vegetation within 10 meters. There will be an improved road outside the fence to allow for a security patrol.
CCTV cameras will be installed inside the fenced area and placed in such a manner as to cover the entire clear zone inside the fence. Exterior sensors will be provided to cover the areas seen by the CCTVs. The location on the installation that will monitor the CCTVs and the sensors will be determined at a later time. Specifica-tions for the sensors will be provided at a later time.
The road to the generator buildings will be designed so that a sharp right or left turn will be required immediately prior to the gate entrance. This is meant to in-hibit vehicles from gaining speed sufficient to crash through the gate.

ERDC/CERL TR-04-23 91
12 Summary and Recommendations This project assessed the condition of the Fort Wainwright Central Heat and Power Plant, analyzed alternatives to the current system, and recommended that the in-stallation: (1) convert the CHPP to heating only, (2) purchase all electricity from the local electric utility, GVEA, and (3) install backup generation on the Installa-tion. The following sections outline specific system requirements that must be ad-dressed to adopt the “heating-only” option, and the recommended option (from op-tions detailed in this report) that best meet that requirement.
Control System
Requirement
Reconfigure or replace system so that it controls the CHP (eliminate control points and functions associated with operation of the steam turbine generators).
Option Selected
Option 3 was selected because it provides needed improvements at a reasonable cost. The open architecture of the system facilitates future upgrades without lock-ing-in specific vendors/products. This will also enable easy down loading of archived and performance data to CD-ROM, which is not possible with the current system. The work will consist of the upgrade of the existing system to an Emerson-Westinghouse Ovation system. This requires replacement of distributed processing units and existing WESNET cabling with Ethernet cabling. The distributed control cabinets and control sensors will be retained. The estimated downtime for the con-version is 3 days. The total estimated cost is $3.9 M.
Steam System Modifications
Requirement
Reduce steam pressure from 400 psig-650 °F to 100 psig-470 F for the Utilidor load, 50 psig for CHP miscellaneous heating, and 10 psig for deaerator heating.

92 ERDC/CERL TR-04-23
Option Selected
Option 2—(N+1) design strategy—was selected to increase reliability for this critical function. The work will consist of 4 PRVs and desuperheaters for the 100 psig steam, 2 PRVs and desuperheaters for the 50 psig steam, and 2 PRVs and desuper-heaters for the 10 psig steam. These are to be located in the boiler building at the platform below the mudroom. If existing isolation valves do not hold, a shutdown of CHP for 1 day may be required. Estimated Cost: $15.5M.
Mothball Steam Turbines
Requirement
Since the steam turbines will no longer be required, the options are to abandon them or to preserve them so that they may be used again at a future time.
Option Selected
Option 1—to abandon the turbines in place—was selected due to the age and rela-tive inefficiency of low-pressure turbine operation dictates any future upgrades con-sider higher pressures and new technologies. Existing turbines have no commercial value. The estimated cost is $0.2M
Electrical Switchgear
Requirement
Upgrade or replace switchgear to serve the CHP.
Option Selected
Option 2—to convert to a 4,160 volt service—was selected since it improves the reli-ability by eliminating single points of failure. The estimated cost is $1.6M.
Electrical Substations
Requirement
Upgrade capacity to meet projected 32.5 MW load, include SCADA monitoring ca-pability to bring up to current standards.

ERDC/CERL TR-04-23 93
Option Selected
Option 2—to incorporate an N+1 design strategy through three substations—was selected since it is a lower cost option and will provide a higher level of reliability and better accommodate the anticipated electrical loads due to new facilities. The estimated cost is $22.0 M.
Heat Plant Backup and Electrical Generation
Requirement
Meet the projected 4.2 MW power requirement for CHP startup and operation in the event of power loss and provide 7 days of fuel storage capacity.
Option Selected
Option 2—to install four dedicated 1,500 kW diesel engine generators—was selected to include the N+1 design strategy for this critical facility. Fuel storage will consist of two tanks with a combined storage capacity of 55,000 gal of diesel fuel. The total estimated cost is $4.3 M.
Installation Critical Electrical Loads
Requirement
Meet the projected critical loads of the installation (not including the CHP).
Option Selected
Option 1—to provide backup of the total installation less the CHP electrical loads—was selected because it the lower cost option, simplest to implement, simplest to op-erate and most reliable option. This project will meet the total requirements of the installation – 28.3 MW by installing six 6.5 MW diesel fueled combustion turbines (N+1 units), and 2 small diesel engine generators, for combustion turbine start-up. Estimated Cost - $30.0 M

94 ERDC/CERL TR-04-23
Appendix A: Project Implementation Tasks
Listed below are the tasks required for the conversion of the FWA CHPP to heating only. It was developed as a planning guide and could eventually be converted into a schedule and/or project diagram.
Initiate heating only study to assess requirements for redundancy and reliability for heat and power. The study would include the following: 1. Determine installation-wide heat and power potential failure points 2. Determine various possible backup power options to meet existing and future
power loads, to include: a. 100 percent Backup Power b. Critical building and mission support loads, centralized location c. Critical building and mission support loads, decentralized location
3. Determine potential power failure points for each backup power option (Requires a load flow, fault current and protective device coordination study of the installa-tion’s entire distribution system)
4. Determine amount of time needed to remain self-sufficient if backup power is needed as a primary power source
5. Develop capital cost estimates and life-cycle costs for each backup power option 6. Determine requirements and provide options to bring all power (reliably) into
installation, with some redundancy 7. Develop capital cost estimates and life-cycle costs for each power option 8. Assess power supply impact on local community 9. Assess requirements and costs for CHPP reconfiguration to heating only, to in-
clude: a. Control system b. Steam system modifications c. Steam turbines d. Switchgear e. Staffing levels
10. Assess air pollution emission impacts from CHPP and backup generators 11. Investigate future permitting requirements and potential for new air pollution
control technology 12. Seek Congressional language to provide authorization for one new MCA project
with the following headings: (1) Back-up power generation (2) Electrical substa-tions and (3) CHPP conversion to heating only.

ERDC/CERL TR-04-23 95
13. Select backup power option in #12 above 14. Select size and locations of substations in #12 above 15. Select plant conversion options in #12 above 16. Initiate design of new projects 17. Begin negotiations with Alaska DEC regarding applicability and requirements
under the New Source Review program 18. Depending on the outcome of #17 above, develop and submit required permit ap-
plications and analyses to Alaska DEC 19. Complete design of new projects 20. Submit request for modifying FWA’s Title V operating permit to Alaska DEC 21. Execute construction projects 22. Develop emergency power response plan 23. Commission new back-up power system 24. Decommission any unnecessary boiler systems 25. Decommission all steam turbine generators 26. Purchase all electrical power from local utility. 27. Either through an MCA project or through a capital investment by the local util-
ity, complete sub-station upgrade to accommodate the higher electrical loads 28. Determine who will operate and maintain new substations 29. Begin negotiation with local utilities for purchase of power at 138 kV transmis-
sion rate 30. Modify FWA RPMA Utilities (J) account to account for increase to energy charges
for purchase of all power 31. Negotiate for contract changes to allow purchase up to 32 MW 32. Other environmental and safety issues. 33. Investigate cooling pond closure:
a. Wetland Issues b. Draining c. Clean-up d. Filling
34. Determine heating only asbestos abatement needs 35. Initiate a study of the long-term (25 yrs) heating and power requirements. The
study would include: a. Private sector heating for new housing b. Standalone heating for new facilities c. Private sector options, third party plant on/near installation d. Partnering with DOE for new plant technology (research into using an al-
ready proven technology)

REPORT DOCUMENTATION PAGE Form Approved OMB No. 0704-0188
Public reporting burden for this collection of information is estimated to average 1 hour per response, including the time for reviewing instructions, searching existing data sources, gathering and maintaining the data needed, and completing and reviewing this collection of information. Send comments regarding this burden estimate or any other aspect of this collection of information, including suggestions for reducing this burden to Department of Defense, Washington Headquarters Services, Directorate for Information Operations and Reports (0704-0188), 1215 Jefferson Davis Highway, Suite 1204, Arlington, VA 22202-4302. Respondents should be aware that notwithstanding any other provision of law, no person shall be subject to any penalty for failing to comply with a collection of information if it does not display a currently valid OMB control number. PLEASE DO NOT RETURN YOUR FORM TO THE ABOVE ADDRESS. 1. REPORT DATE (DD-MM-YYYY)
11-2004 2. REPORT TYPE
Final3. DATES COVERED (From - To) 12-2002 to 04-2003
5a. CONTRACT NUMBER 5b. GRANT NUMBER
4. TITLE AND SUBTITLE Central Heating and Power Plant Conversion at Fort Wainwright, AK: Heating Only with Backup Generation Option
5c. PROGRAM ELEMENT NUMBER 5d. PROJECT NUMBER MIPR 5e. TASK NUMBER
6. AUTHOR(S) John L. Vavrin, Noel L. Potts, John Westerman, Robert Lorand, Charles Schmidt, Raymond Heintel, and Michael R. Kemme
5f. WORK UNIT NUMBER 8. PERFORMING ORGANIZATION REPORT
NUMBER 7. PERFORMING ORGANIZATION NAME(S) AND ADDRESS(ES) U.S. Army Engineer Research and Development Center (ERDC) Construction Engineering Research Laboratory (CERL) PO Box 9005 Champaign, IL 61826-9005
ERDC/CERL TR-04-23
9. SPONSORING / MONITORING AGENCY NAME(S) AND ADDRESS(ES) 10. SPONSOR/MONITOR’S ACRONYM(S) DAIM-FDF-U Assistant Chief of Staff for Installation Management (ACSIM)
7701 Telegraph Road Alexandria, VA 22315-3800
11. SPONSOR/MONITOR’S REPORT NUMBER(S)
12. DISTRIBUTION / AVAILABILITY STATEMENT Approved for public release; distribution is unlimited.
13. SUPPLEMENTARY NOTES Copies are available from the National Technical Information Service, 5285 Port Royal Road, Springfield, VA 22161.
14. ABSTRACT
The Fort Wainwright (FWA) military community has a critical need to establish its power and heating requirements to successfully complete a series of planned capital improvements. The CHPP upgrade coincides with an expansion of FWA’s mission within the next 5 years. To help the installation successfully complete these changes within the specified time frame, the Construction Engineering Research Laboratory (CERL) conducted an independent technical assessment of the FWA CHPP. This follow-on study, which was completed in April 2003, expanded on the recommendation of the previous work to convert the installation CHPP to heating only, and to purchase all electricity from the local electric utility.
15. SUBJECT TERMS CHPP Ft. Wainwright, AK central heating plant heat distribution system 16. SECURITY CLASSIFICATION OF: 17. LIMITATION
OF ABSTRACT 18. NUMBER
OF PAGES 19a. NAME OF RESPONSIBLE PERSON
John L. Vavrin a. REPORT
Unclassified b. ABSTRACT
Unclassified c. THIS PAGE
Unclassified
SAR
112 19b. TELEPHONE NUMBER (in-
clude area code) (217) 352-6511, X-2032
NSN 7540-01-280-5500 Standard Form 298 (Rev. 8-98) Prescribed by ANSI Std. 239.18


![Energy Conversion and Management · 2016. 1. 21. · waste cooling water in pre-heating the plant’s feed water. Ebra-himi et al. [3] ... 136 A. Carbó et al./Energy Conversion and](https://img.dokumen.tips/doc/110x75/60b67b73a50e5623af762df8/energy-conversion-and-management-2016-1-21-waste-cooling-water-in-pre-heating.jpg)