Embed Size (px)
Citation preview

A N N U A L R E P O R T 2 0 0 0
CENTRAL GLASS_AR 01.6.7 9:27 AM ページ 2

1 Financial Highlights
2 President’s Message
4 Review of Operations
6 Research & Development Activities
8 Management’s Discussion & Analysis
10 Consolidated Balance Sheets
12 Consolidated Statements of Operations
13 Consolidated Statements of Shareholders’ Equity
14 Consolidated Statement of Cash Flows
15 Notes to Consolidated Financial Statements
20 Report of Independent Certified Public Accountants
21 Board of Directors & Auditors
Corporate Data
PR O F I L E
Founded in 1936, Central Glass Co., Ltd. began as a manufacturer of soda ash and caustic soda and expanded
its field of operations to include fertilizers, flat glass, fiberglass and vinyl chloride.
We contribute widely to daily living through such diverse products as flat glass, fabricated glass, safety glass
for automobiles and other vehicles, various chemical products, fertilizers and fiberglass.
While expanding existing businesses, Central Glass is conducting aggressive research and development
and capital investment in new businesses, including fine glass for the electronics materials field and such
organic and inorganic fine chemicals as fluorine.
CO N T E N T S
CENTRAL GLASS_AR 01.6.7 9:27 AM ページ 3

1Central Glass Co., Ltd.
F I N A N C I A L HI G H L I G H T SYears ended March 31
Proportion of Sales (Year ended March 31, 2000)
63.0%37.0%
Chemica ls Div is ion
Glass Div is ion
Soda, chlorine, organic and
inorganic fluorides, fertilizers,
high-purity gas, solvents, med-
ical and agricultural products
and other chemical products;
fiberglass products; vinyl chlo-
ride and other synthetic resins
Architectural glass, automo-
tive safety glass and industrial
fabricated glass and other
glass-related products
2000 1999 1998 1997 1996 2000
Thousands ofMillions of yen U.S. dollars (Note)
Net Sales ¥175,283 ¥173,782 ¥192,753 ¥194,939 ¥183,028 $1,651,276
Operating Income 11,391 6,784 10,888 8,672 684 107,310
Net Income (Loss) (521) (266) 2,654 3,125 4,388 (4,908)
Total Assets 223,065 212,812 224,693 224,000 232,925 2,101,413
Total Shareholders’ Equity 58,103 57,169 59,328 57,377 54,249 547,367
%
Shareholders’ Equity Ratio 26.05 26.86 26.40 25.61 23.29
Yen U.S. dollars (Note)
Amounts per Share:
Net Income (Loss) ¥ (2.39) ¥ (1.20) ¥ 11.96 ¥ 14.08 ¥ 19.77 $(0.023)
Shareholders’ Equity 270.40 261.72 267.32 258.53 244.44 2.547
Cash Dividends 5 5 5 3 — 0.047
Note: U.S. dollar amounts have been translated from Japanese yen, for convenience, at the rate of ¥106.15=US$1.00, the approximate exchange rate prevailing
on March 31, 2000.
CENTRAL GLASS_AR 01.6.7 9:27 AM ページ 1

2Central Glass Co., Ltd.
P e r f o r m a n c e
In fiscal 2000, ended March 31, 2000, an
overall harsh operating environment con-
tinued amid a delayed recovery in
private-sector demand, despite signs of a
gradual recovery in the Japanese economy
from the effects of economic stimulus mea-
sures and a recovery in Asian economies.
In response, Central Glass Co.,Ltd.
aggressively advanced marketing activities
to achieve a 0.9% increase in sales to
¥175,283 million (US$1,651 million). Higher
sales of value-added products, such as fine
chemicals, and increased efficiency and
streamlined operations resulted in a 67.9%
increase in operating income to ¥11,391
million (US$107 million).
However, the Company recorded a prior
service cost recognized as liability of ¥8,024
million (US$76 million) to compensate for
unfunded pension liabilities in accordance
with a change in accounting methods.
Consequently, despite a ¥4,069 million
(US$38 million) deferred income tax benefit
in line with the introduction of tax-effect
accounting, a net loss of ¥521 million
(US$5 million) was recorded after deducting
other expenses and taxes.
Net cash provided by operating activities
was ¥15,587 mill ion (US$147 mill ion)
owing to such non-cash expenses as depre-
ciation and amortization expenses and the
provision for allowance for retirement bene-
fits, despite a nominal decline in income
before income taxes.
Net cash used in investing activities
reached ¥6,205 million (US$58 million),
mainly owing to increased capital invest-
ment centered on the Fine Chemicals Sector.
Net cash used in financing activities was
¥6,197 million (US$58 million) reflecting
the repayment of loans and the repurchase
and retirement of 3,556 thousand shares of
treasury stock.
As a result, cash and cash equivalents at
fiscal year-end increased ¥3,089 million
(US$29 million) to ¥21,305 million (US$201
million).
D i v i d e n d s
T he Company’s basic policy is to dis-
tribute stable dividends that reflect
business results while taking a long-
term perspective in accounting for the
operating environment and ensuring suffi-
cient internal reserves for reinvestment.
Based on this policy, management main-
tained cash dividends of ¥5.0 (US$0.047)
per share during fiscal 2000.
M a n a g e m e n t P h i l o s o p h y
Our fundamental policy is to maxi-
mize shareholder value by
expanding corporate value through
higher profitability and a stronger financial
position. Specifically, we aim to build a sta-
ble foundation in our core Glass and
Chemicals Divisions and expand sales of
such highly functional and value-added
products as fine chemicals and fine glass.
Urgent management issues include
strengthening our position in the
Architectural Glass Sector, maintaining
profitability of established products in the
Chemicals Division and accelerating expan-
sion in the growth field of fine chemicals.
We have made progress in these matters.
Furthermore, we will focus on maintaining
profitability in the Automotive Safety Glass
Sector amid global restructuring of the
automotive industry.
Vigorous efforts in the Glass and
Chemicals Divisions to refine operations
and reduce cost are showing results.
Further progress, however, will require a
thorough reform of our production, distrib-
ution and marketing structures. We have
already begun to consider such measures to
raise the profitability of the Glass Division,
and we plan to review conditions at the
Chemicals Division in fiscal 2001, ending
March 31, 2001.
Our long-term prosperity depends on
expanding sales of fine chemicals and
other high-value-added products, and we
are carrying out an active research and
PR E S I D E N T ’ S ME S S AG E
CENTRAL GLASS_AR 01.6.7 9:27 AM ページ 2

3Central Glass Co., Ltd.
Sadayoshi Nakamura, President
development (R&D) program and making
solid investments in new product develop-
ment to support rapid commercialization.
Based on these measures, we will secure
stable earnings from our base in the materi-
als sectors of glass and chemicals, while
boosting profitability by expanding fine
chemicals and other value-added products.
We aim to regularly achieve return on
equity (ROE) of 10%.
O u t l o o k
W hile the economy is entering
a steady recovery, such “old
economy” sectors as the
housing, automotive and chemical indus-
tries are expected to experience prolonged
harsh operating environments. The already
severe environment for our established
business areas, especially in the Glass
Division, is expected to continue in fiscal
2001. We anticipate a shakeout in the
industry amid increasing domestic and over-
seas competition. Central Glass will work to
improve performance by reinforcing its pro-
duction and marketing structures to
address various needs, and promote
increased efficiency and cost reduction at
all levels of operations.
Given the importance of developing our
fine chemicals operations, in April 1999 we
established the Fine Chemical Business
Development Department. Through this
and other measures, we aim to build a solid
base in fine chemicals and improve our abil-
ity to develop and commercialize new
business areas.
For fiscal 2001, management forecasts
sales of ¥177,000 million (US$1,667 mil-
lion) and net income of ¥4,000 million
(US$38 million).
With the conclusion of the 86th Annual
General Shareholders’ Meeting, I succeeded
Hirotaro Okazaki as president of Central
Glass Co., Ltd. While continuing the various
corporate reforms implemented by Mr.
Okazaki, including Groupwide restructuring
measures and a management philosophy
focused on shareholder return, I plan to
carry out more extensive operational and
management reforms.
Thank you for your continued support.
Sadayoshi Nakamura
President
CENTRAL GLASS_AR 01.6.7 9:27 AM ページ 3
4Central Glass Co., Ltd.
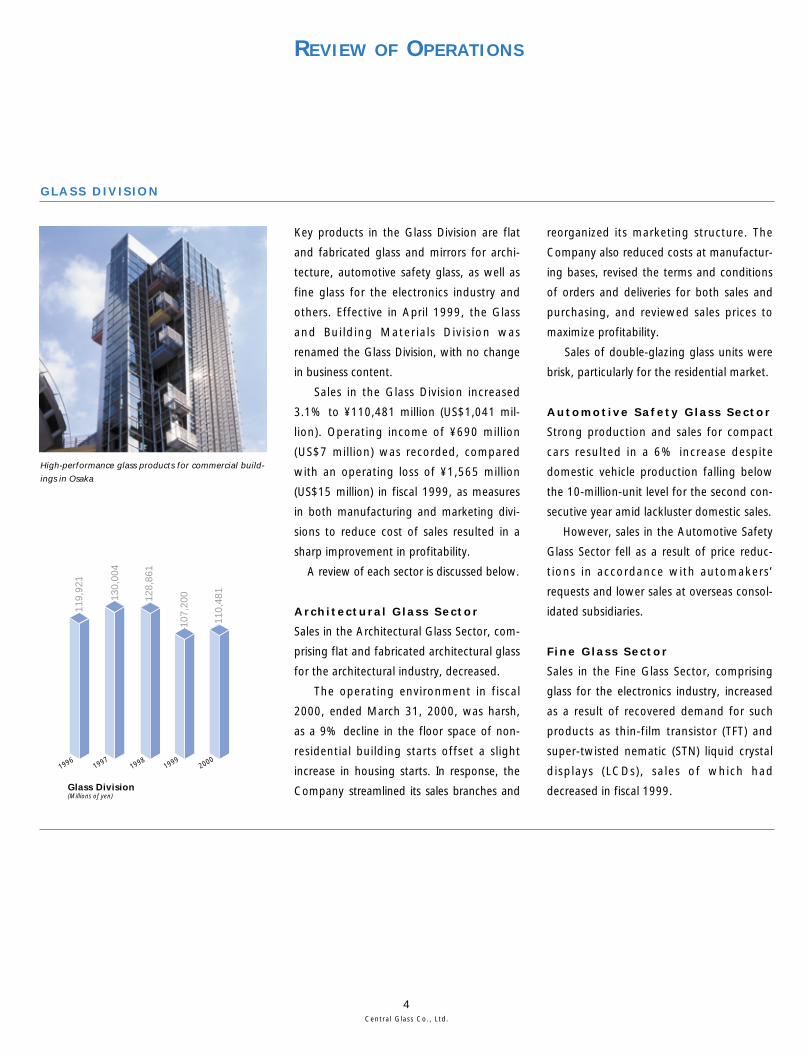
G L A S S D I V I S I O N
Key products in the Glass Division are flat
and fabricated glass and mirrors for archi-
tecture, automotive safety glass, as well as
fine glass for the electronics industry and
others. Effective in April 1999, the Glass
and Building Materials Division was
renamed the Glass Division, with no change
in business content.
Sales in the Glass Division increased
3.1% to ¥110,481 million (US$1,041 mil-
lion). Operating income of ¥690 million
(US$7 million) was recorded, compared
with an operating loss of ¥1,565 million
(US$15 million) in fiscal 1999, as measures
in both manufacturing and marketing divi-
sions to reduce cost of sales resulted in a
sharp improvement in profitability.
A review of each sector is discussed below.
A r c h i t e c t u r a l G l a s s S e c t o r
Sales in the Architectural Glass Sector, com-
prising flat and fabricated architectural glass
for the architectural industry, decreased.
The operating environment in fiscal
2000, ended March 31, 2000, was harsh,
as a 9% decline in the floor space of non-
residential building starts offset a slight
increase in housing starts. In response, the
Company streamlined its sales branches and
reorganized its marketing structure. The
Company also reduced costs at manufactur-
ing bases, revised the terms and conditions
of orders and deliveries for both sales and
purchasing, and reviewed sales prices to
maximize profitability.
Sales of double-glazing glass units were
brisk, particularly for the residential market.
A u t o m o t i v e S a f e t y G l a s s S e c t o r
Strong production and sales for compact
cars resulted in a 6% increase despite
domestic vehicle production falling below
the 10-million-unit level for the second con-
secutive year amid lackluster domestic sales.
However, sales in the Automotive Safety
Glass Sector fell as a result of price reduc-
tions in accordance with automakers’
requests and lower sales at overseas consol-
idated subsidiaries.
F i n e G l a s s S e c t o r
Sales in the Fine Glass Sector, comprising
glass for the electronics industry, increased
as a result of recovered demand for such
products as thin-film transistor (TFT) and
super-twisted nematic (STN) liquid crystal
displays (LCDs), sales of which had
decreased in fiscal 1999.
RE V I E W O F OP E R AT I O N S
119,
921
19961997
19981999
2000
130,
004
128,
861
107,
200
110,
481
Glass Division (Millions of yen)
High-performance glass products for commercial build-
ings in Osaka
CENTRAL GLASS_AR 01.6.7 9:27 AM ページ 4

5Central Glass Co., Ltd.
Core products in the Chemicals Division
include fine chemicals, fiberglass products,
fertilizers, soda products, chlorine products
and fluorine products.
Sales in the Chemicals Division edged
down 2.7% to ¥64,802 million (US$610
million), and operating income increased
28.2% to ¥10,702 million (US$101 million)
as a result of increased sales of fine chemi-
cal products.
F i n e C h e m i c a l s S e c t o r
Sales in the Fine Chemicals Sector rose on
the back of sales growth in special gas
products such as nitrogen trifluoride (NF3)
used in the cleaning processes of semicon-
ductor and LCD manufacturing and such
medical products as pharmaceutical precur-
sors for general anesthesia.
Aggressive and efficient fine chemical
operations, a growing business field, repre-
sent a key management priority for the
Company. The Company believes increased
production capacity for these highly prof-
itable products will contribute to profit
growth in future periods, although increased
depreciation expenses owing to large-scale
capital investment for NF3 and pharmaceuti-
cal precursors products are anticipated.
F i b e r g l a s s S e c t o r
The Fiberglass Sector recorded an increase
in sales owing to higher demand from such
key clients as manufacturers of wastewater
treatment tanks and bathtubs for residential
use. Brisk demand for computer and other
electronic equipment, as well as a recovery
in exports to Southeast Asia also con-
tributed to sales growth.
F e r t i l i z e r S e c t o r
Sales in the Fertilizer Sector decreased as a
result of lower sales prices and weak
demand for rice-field fertilizers arising from
increased imports and reduced use of fer-
tilizers.
63,1
06
19961997
19981999
2000
64,9
39
63,8
91
66,5
82
64,8
02
Chemicals Division (Millions of yen)
C H E M I C A L S D I V I S I O N
Central Glass aims to achieve further growth through
aggressive investment of management resources in the
Fine Chemicals Sector.
CENTRAL GLASS_AR 01.6.7 9:28 AM ページ 5

6Central Glass Co., Ltd.
RE S E A R C H & DE V E L O P M E N T AC T I V I T I E S
coating, heat treatment and glass processing.
With a focus on a variety of glass installation
technologies, we are striving to improve the
quality of our technological services by
developing and providing a variety of soft-
ware technology for structural, optical and
thermal analysis.
A u t o m o t i v e S a f e t y G l a s s
In automotive safety glass, we are continu-
ing to make developments in improving
efficiency of production facilities and low-
cost production and environmental
technologies by utilizing a variety of basic
technologies to address automobile manu-
facturers’ basic demands for safety, comfort
and lighter weight glass. We are also devel-
oping and commercializing such products
and technologies as water-repellant glass,
thermal insulating glass, glass with a multi-
purpose antenna system, and thinner
tempered and laminated safety glass.
F i n e G l a s s
In fine glass, we are selectively focusing
efforts on developing and commercializing
thin glass substrates for use in flat-panel
displays, as well as the necessary thin-film
coating and fine patterning technologies to
accompany such products.
C H E M I C A L S D I V I S I O N
C o m m o d i t y C h e m i c a l s
In commodity chemicals, while pursuing
Research and Development (R&D) at
Central Glass (the Company and consoli-
dated subsidiaries) is based on a fundamental
policy of developing innovative products in
response to diversifying market needs amid
social and environmental change. We make
concerted efforts to create core products
for new businesses while expanding and
strengthening existing businesses.
During fiscal 2000, Central Glass con-
ducted R&D activities with the cooperation
of each division through a three-pronged
organization comprising the Glass Research
Center and the Glass Technical Center in the
Glass Division and the Chemical Research
Center in the Chemicals Division. The
Company also raised efficiency by concen-
trating on core research themes, following a
careful review, and reallocating research staff.
G L A S S D I V I S I O N
A r c h i t e c t u r a l G l a s s
In architectural glass, we are responding to
market demand by developing products
with environmental and next-generation
energy conservation features while continu-
ing to advance flat glass research and
development of such functional glass
products as thermal insulation and shield-
ing glass, ultraviolet-ray-shielding and
electromagnetic-wave-shielding glass,
hydrophilic glass, photocatalytic glass and
fire-resistant glass based on such basic
technologies as thin-film and thick-film
R&D Expenses (Millions of yen/U.S. dollars)
¥2,222(US$21)
¥2,308(US$22)
Total ¥4,530 (US$43) million
Glass DivisionChemicals Division
Float Glass Manufactur ing
Central Glass is developing new technologies for reduc-
ing costs, improving facility efficiency and advancing
environmental preservation in order to maximize profits.
CENTRAL GLASS_AR 01.6.7 9:28 AM ページ 6

7Central Glass Co., Ltd.
production research for HFC-245fa as a
substitute for HCFC-141b, we are partici-
pating in the Research Institute of
Innovative Technology for the Earth’s
“Development of New Refrigerants,
Blowing Agents and Cleaning Solvents for
the Effective Use of Energy,” and carrying
out aggressive technological development
of next-generation substances.
F i n e C h e m i c a l s
In fine chemicals, we are advancing prod-
uct development in line with market needs
based on production and application tech-
nology for fluoride-containing compounds.
Namely, in the environmental field, we
have developed proprietary production
methods for non-ozone-depleting cyclic
HFC-type solvents and etching gases with a
minimal global warming potential.
Concurrently, we are enhancing organic
fluorinated intermediates in the medical
and agricultural fields and developing
inorganic fluorinated gases for use in
semiconductor production processes in the
semiconductor field. Central Glass also
focused efforts on the research and devel-
opment of fluorine-containing electrolyte
compounds for batteries in the energy field
as well as precision processing and high-
purity inorganic fluorinated compounds in
the optical materials field, an integral field
in the optical communications area of the
information field.
F l u o r o c a r b o n R e s i n
In fluorocarbon resin, we are enhancing
and expanding the types of high perfor-
mance products and water-soluble
products and carrying out commercializa-
tion while conducting research and
development for optical and electrical
materials that employ the special features
of fluorine.
F e r t i l i z e r
In fertilizer, a new controlled release fertil-
izer “CERACOAT-R” that enables precise
control of effective fertilizer periods is on
stream. We are making earnest efforts to
further improve the biodegradability of its
coating agent.
B i o l o g i c a l - R e l a t e d F i e l d s
In biological-related fields, we are widening
the application range of our “BIOKEEPER”
wettable powder, a microbiological plant
protection agent, to several plants, such as
cabbage and onions. Development of new
micro-organic materials is also being
advanced, including the development
and registration of “MOMIGENKI” wet-
table powder, an agricultural chemical for
rice plant seed disinfection treatment using
microorganism formulation technology.
Through these activities, Central Glass is
working to establish new business fields for
the Chemicals Division.
Central Glass is pursuing R&D activities to expand and
reinforce its high-value-added product lineup and to
develop products that will form the core of new busi-
nesses.
Chemical Research Center in Tokyo
Central Glass is developing new products to meet new
needs, including organic and inorganic fine chemicals,
fluorine resins and biological-related products at its
Chemical Research Centers in Tokyo and Ube.
CENTRAL GLASS_AR 01.6.7 9:28 AM ページ 7

8Central Glass Co., Ltd.
MA N AG E M E N T ’S DI S C U S S I O N & AN A LYS I S
B u s i n e s s R e s u l t s
During fiscal 2000, ended March 31, 2000,
consolidated net sales edged up 0.9% com-
pared with the previous fiscal year to
¥175,283 million (US$1,651 million). Sales
of the Glass Division rose 3.1% to
¥110,481 million (US$1,041 million) on the
back of a rebound in demand for fine glass.
However, sales of the Chemicals Division
slipped 2.7% to ¥64,802 million (US$610
million) due to weak demand for fertilizers.
Despite the strong yen, overseas sales
climbed 21.3% to ¥25,240 million (US$238
million), accounting for 14.4% of consoli-
dated net sales, an increase of 2.4
percentage points. Sales in North America
advanced 15.7% to ¥12,892 mil l ion
(US$121 million), and sales in Europe rose
11.3% to ¥7,315 million (US$69 million).
Sales in other areas increased 62.5% to
¥5,033 million (US$47 million).
I n c o m e
Gross profit increased 6.0% to ¥49,216
mill ion (US$464 mil l ion), owing to a
decrease in the cost of sales ratio of 1.4
percentage points to 71.9% due to efforts
to reduce expenses. Selling, general and
administrative (SG&A) expenses were down
4.6% to ¥37,825 million (US$356 million).
As a result, operating income soared
67.9% to ¥11,391 million (US$107 million).
Other expenses, net increased 124.0%
to ¥11,023 million (US$104 million), as
prior service cost recognized as liability of
¥8,024 million (US$76 million) was posted
as an extraordinary expense. The applica-
tion of new tax-effect accounting from the
term under review resulted in the recording
of deferred tax assets of ¥4,069 million
(US$38 million). However, a net loss of
¥521 million (US$5 million) was recorded.
I n v e s t m e n t
Capital expenditures advanced 15.6% to
¥9,865 million (US$93 million) compared
with the previous fiscal year. By division,
capital expenditures in the Glass Division
were ¥2,438 million (US$23 million), and
those in the Chemicals Division amounted
to ¥7,427 million (US$70 million).
Research and development expenditures
were ¥4,530 million (US$43 million).
C a s h F l o w s
In accordance with a new accounting stan-
dard for statements of cash flows, which
became effective the year ended March 31,
2000, the Company has prepared the
accompanying consolidated statement of
cash flows for the first time. Comparisons
to previous fiscal years are not provided, as
consolidated statements of cash flows for
previous fiscal years were not required.
183,
028
19961997
19981999
2000
194,
939
192,
753
173,
782
175,
283
Net Sales (Millions of yen)
4,38
8
19961997
19981999
2000
3,12
5
2,65
4
(266
)
(521
)
Net Income (Loss) (Millions of yen)
54,2
49
19961997
19981999
2000
57,3
77
59,3
28
57,1
69
58,1
03
Shareholders’ Equity (Millions of yen)
CENTRAL GLASS_AR 01.6.7 9:28 AM ページ 8

9Central Glass Co., Ltd.
Net cash provided by operating activities
was ¥15,587 million (US$147 million)
owing to such non-cash expenses as depre-
ciation and amortization expenses and the
prior service cost recognized as liability,
despite a nominal decline in income before
income taxes.
Net cash used in investing activities
reached ¥6,205 million (US$58 million),
mainly owing to increased capital invest-
ment centered on the Fine Chemicals
Sector.
Net cash used in financing activities was
¥6,197 million (US$58 million) reflecting
the repayment of loans and the repurchase
and retirement of 3,556 thousand shares of
treasury stock.
As a result, cash and cash equivalents at
end of year increased ¥3,089 mil l ion
(US$29 million) to ¥21,305 million (US$201
million).
F i n a n c i a l P o s i t i o n
Total assets at the end of the fiscal year
increased 4.8% to ¥223,065 mil l ion
(US$2,101 million). Turnover of total assets
was 0.8. Total current assets increased
7.4% to ¥101,309 million (US$954 million).
Total current liabilities advanced 19.4% to
¥119,658 mil l ion (US$1,127 mil l ion).
Shareholders’ equity rose 1.6% to ¥58,103
million (US$547 million) due to an increase
2,93
4
19961997
19981999
2000
3,17
2
3,45
3
3,30
0
4,53
0
Research & Development Expenditures(Millions of yen)
8,80
1
19961997
19981999
2000
10,1
09
10,9
91
8,53
3
9,86
5
Capital Expenditures (Millions of yen)
in retained earnings. The net worth ratio
decreased 0.5 percentage point to 31.3%.
Shareholders’ equity per share was
¥270.40 (US$2.547), an increase of ¥8.68
(US$0.082) from the previous year-end.
C h a n g e i n A c c o u n t i n g S t a n d a r d s
In the current fiscal year, the Company will
adopt new accounting standards for retire-
ment benefits, and in fiscal 2000, ended
March 31, 2000, the Company changed its
accounting standards for the allowance for
retirement benefits to increase the
allowance. As a result, as of April 1, 2000,
unfunded retirement liabilities amounted to
¥1,400 million (US$13 million), which the
Company plans to write off to promote a
sounder financial structure.
CENTRAL GLASS_AR 01.6.7 9:28 AM ページ 9

10Central Glass Co., Ltd.
CO N S O L I DAT E D BA L A N C E SH E E T SCentral Glass Co. , Ltd. and Consol idated Subsidiar ies
March 31, 2000 and 1999
March 31,
2000 1999 2000
Thousands ofMillions of yen U.S. dollars (Note 2)
ASSETS
Current assets :
Cash and bank deposits ¥ 21,983 ¥ 18,696 $ 207,094
Marketable securities (Note 13) 4,656 5,363 43,862
Trade notes and accounts receivable 50,309 44,896 473,943
Less: Allowance for doubtful accounts (433) (444) (4,079)
Inventories 21,872 23,969 206,048
Deferred taxes (Note 6) 930 — 8,761
Prepaid expenses and other current assets 1,992 1,826 18,766
Total current assets 101,309 94,306 954,395
Property, plant and equipment, at cost (Note 4) :
Land 23,954 24,246 225,662
Buildings and structures 73,942 73,232 696,580
Machinery and equipment 190,014 191,169 1,790,052
Construction in progress 4,356 2,806 41,036
292,266 291,453 2,753,330
Less: Accumulated depreciation (201,253) (198,017) (1,895,930)
Property, plant and equipment, net 91,013 93,436 857,400
Investments and other assets :
Investment securities (Notes 4 and 13) 16,808 16,934 158,342
Long-term loans receivable 1,055 1,237 9,939
Deferred taxes (Note 6) 6,322 — 59,557
Other assets 5,576 6,175 52,528
Allowance for doubtful accounts (960) (881) (9,043)
Total investments and other assets 28,801 23,465 271,323
Translat ion adjustments 1,942 1,605 18,295
Total assets ¥223,065 ¥212,812 $2,101,413
See accompanying notes to consolidated financial statements.
CENTRAL GLASS_AR 01.6.7 9:28 AM ページ 10

11Central Glass Co., Ltd.
March 31,
2000 1999 2000
Thousands ofMillions of yen U.S. dollars (Note 2)
LIABILITIES AND SHAREHOLDERS ’ EQUITY
Current l iabi l i t ies :
Short-term borrowings (Notes 3 and 4) ¥ 59,014 ¥ 56,475 $ 555,950
Current portion of long-term debt (Note 4) 15,000 4,501 141,309
Trade notes and accounts payable 24,907 22,589 234,640
Income taxes payable 3,876 1,958 36,514
Accrued expenses and other current liabilities 16,861 14,721 158,841
Total current liabilities 119,658 100,244 1,127,254
Long-term l iabi l i t ies :
Long-term debt (Note 4) 17,467 35,591 164,550
Allowance for retirement benefits 18,310 10,939 172,492
Allowance for rebuilding furnaces 8,686 7,659 81,828
Other long-term liabilities 183 18 1,723
Total long-term liabilities 44,646 54,207 420,593
Total liabilities 164,304 154,451 1,547,847
Minority interests 658 1,192 6,199
Commitments and contingent l iabi l i t ies (Note 10)
Shareholders ’ equity (Notes 5 and 12) :
Common stock, ¥50 par value:
Authorized—871,500,000 shares;
Issued—214,879,975 shares 18,168 18,168 171,154
Additional paid-in capital 8,117 8,877 76,467
Retained earnings 31,818 30,124 299,746
58,103 57,169 547,367
Treasury stock, at cost:
470,000 shares in 2000 and 254,000 shares in 1999 0 0 0
Total shareholders’ equity, net 58,103 57,169 547,367
Total l iabi l i t ies and shareholders ’ equity ¥223,065 ¥212,812 $2,101,413
CENTRAL GLASS_AR 01.6.7 9:28 AM ページ 11

12Central Glass Co., Ltd.
CO N S O L I DAT E D STAT E M E N T S O F OP E R AT I O N SCentral Glass Co. , Ltd. and Consol idated Subsidiar ies
For years ended March 31, 2000 and 1999
Years ended March 31,
2000 1999 2000
Thousands ofMillions of yen U.S. dollars (Note 2)
Net sales ¥175,283 ¥173,782 $1,651,276
Cost of sales 126,067 127,334 1,187,630
Gross profit 49,216 46,448 463,646
Sel l ing, general and administrat ive expenses 37,825 39,664 356,336
Operating income 11,391 6,784 107,310
Other income (expenses) :
Interest and dividend income 406 579 3,825
Interest expense (2,041) (2,419) (19,228)
Lease revenue 204 238 1,922
Equity in earnings of affiliates 365 313 3,438
Gain on sale of property, plant and equipment 361 79 3,401
Loss on liquidation of subsidiaries and affiliates (43) (676) (405)
Write-off of bad debts (369) (1,498) (3,476)
Prior service cost recognized as liability (8,024) — (75,591)
Other, net (1,882) (1,538) (17,730)
(11,023) (4,922) (103,844)
Income before income taxes and minority interests 368 1,862 3,466
Income taxes (Note 6) :
Current 4,953 2,134 46,660
Deferred (4,069) — (38,333)
884 2,134 8,327
Minority interests (5) 6 (47)
Net loss ¥ (521) ¥ (266) $ (4,908)
See accompanying notes to consolidated financial statements.
CENTRAL GLASS_AR 01.6.7 9:28 AM ページ 12

13Central Glass Co., Ltd.
CO N S O L I DAT E D STAT E M E N T S O F SH A R E H O L D E R S ’ EQ U I T YCentral Glass Co. , Ltd. and Consol idated Subsidiar ies
For years ended March 31, 2000 and 1999
Years ended March 31,
2000 1999 2000
Thousands ofMillions of yen U.S. dollars (Note 2)
Common stock
Balance at beginning of year
(2000—218,435,975 shares;
1999—221,935,975 shares) ¥18,168 ¥18,168 $171,154
Balance at end of year
(2000—214,879,975 shares;
1999—218,435,975 shares) ¥18,168 ¥18,168 $171,154
Addit ional paid- in capital
Balance at beginning of year ¥ 8,877 ¥ 9,607 $ 83,627
Retirement of shares (760) (730) (7,160)
Balance at end of year ¥ 8,117 ¥ 8,877 $ 76,467
Retained earnings (Note 12)
Balance at beginning of year ¥30,124 ¥31,552 $283,787
Cumulative effect of initial adoption of tax-effect accounting 3,308 — 31,164
Increase resulting from changes in consolidated subsidiaries — 8 —
Net loss (521) (266) (4,908)
Cash dividends paid (1,093) (1,109) (10,297)
Bonuses to directors and corporate auditors — (61) —
Balance at end of year ¥31,818 ¥30,124 $299,746
See accompanying notes to consolidated financial statements.
CENTRAL GLASS_AR 01.6.7 9:28 AM ページ 13

14Central Glass Co., Ltd.
CO N S O L I DAT E D STAT E M E N T O F CA S H FL OW SCentral Glass Co. , Ltd. and Consol idated Subsidiar ies
For year ended March 31, 2000 and 1999
Year ended March 31,
2000 2000Thousands of
Millions of yen U.S. dollars (Note 2)
Operat ing act iv it ies
Income before income taxes and minority interests ¥ 368 $ 3,466
Depreciation and amortization 10,140 95,525
Provision for allowance for retirement benefits 7,371 69,439
Provision for reserve for rebuilding furnaces 1,026 9,665
Interest and dividend income (406) (3,825)
Interest expense 2,041 19,228
Foreign currency exchange loss 242 2,280
Equity in earnings of affiliates (365) (3,438)
Loss on revaluation of marketable securities 133 1,253
Gain on sale of property, plant and equipment 426 4,013
Changes in operating assets and liabilities:
Increase in trade notes and accounts receivable (5,367) (50,561)
Decrease in inventories 2,001 18,851
Increase in trade notes and accounts payable 2,128 20,047
Increase in accrued expenses 361 3,401
Other, net 149 1,404
Subtotal 20,248 190,748
Interest and dividends received 406 3,825
Interest paid (2,067) (19,472)
Income taxes paid (3,000) (28,262)
Net cash provided by operating activities 15,587 146,839
Invest ing act iv it ies
Payments to time deposits (773) (7,282)
Proceeds from time deposits 665 6,265
Proceeds from sale of marketable securities 528 4,974
Purchases of property, plant and equipment (7,757) (73,076)
Proceeds from sale of property, plant and equipment 895 8,431
Purchases of investment securities (380) (3,580)
Proceeds from sale of investment securities 482 4,541
Other 135 1,272
Net cash used in investing activities (6,205) (58,455)
Financing act iv it ies
Decrease in short-term borrowings (813) (7,659)
Proceeds from long-term debt borrowings 1,163 10,956
Repayment of long-term debt (4,695) (44,230)
Retirement of treasury stock (760) (7,160)
Cash dividends paid (1,092) (10,287)
Net cash used in financing activities (6,197) (58,380)
Effect of exchange rate changes on cash and cash equivalents (95) (904)
Net increase in cash and cash equivalents 3,089 29,100
Cash and cash equivalents at beginning of the year (Notes 1 (d) and 9) 18,126 170,758
Increase in cash and cash equivalents due to change in scope of consolidation 90 849
Cash and cash equivalents at end of the year (Notes 1 (d) and 9) ¥21,305 $200,707
See accompanying notes to consolidated financial statements.
CENTRAL GLASS_AR 01.6.7 9:28 AM ページ 14

15Central Glass Co., Ltd.
NOT E S TO CO N S O L I DAT E D F I N A N C I A L STAT E M E N T SCentral Glass Co. , Ltd. and Consol idated Subsidiar ies
1. Summary of S ignif icant Accounting Pol ic ies(a) Basis of presentat ionCentral Glass Co., Ltd. (the “Company”) and its domestic subsidiaries maintain theiraccounting records and prepare their financial statements in accordance with account-ing principles and practices generally accepted and applied in Japan, and its foreignsubsidiaries maintain their books of account in conformity with those of their countriesof domicile. The accompanying consolidated financial statements have been preparedfrom the financial statements filed with the Ministry of Finance as required by theSecurities and Exchange Law of Japan. Accordingly, the accompanying financial state-ments may differ in certain significant respects in order to present the consolidatedfinancial position, results of operations and cash flows in accordance with accountingprinciples and practices generally accepted in countries and jurisdictions other thanJapan. For the purposes of this document, certain reclassifications have been made topresent the accompanying consolidated financial statements in a format which is famil-iar to readers outside Japan.
In March 1998, the Business Accounting Deliberation Council of Japan (the“BADC”) issued a new accounting standard for statements of cash flows, whichbecame effective the year ended March 31, 2000. The Company and its consolidatedsubsidiaries have adopted the new accounting standard for consolidation effective theyear ended March 31, 2000, and the accompanying consolidated statement of cashflows for the year ended March 31, 2000 only has been prepared in accordance withthis standard.
(b) Basis of consolidation and accounting for investments in affiliatesIn accordance with the revised accounting standard for consolidation issued by the BADC,effective April 1, 1999, the accompanying consolidated financial statements include theaccounts of the Company and all its subsidiaries over which substantial control is exertedthrough either majority ownership of voting stock and/or by other means. All significantintercompany balances and transactions have been eliminated in consolidation.
Certain subsidiaries are consolidated on the basis of fiscal periods which differ fromthat of the Company or on the basis of the fiscal period ending March 31 as a tentativeclosing date; however, the necessary adjustments have been made if the effect of thedifference is material.
Investments in unconsolidated subsidiaries are stated at cost because their impacton the consolidated financial statements was immaterial.
Investments in affiliates (companies over which the Company has the ability to exer-cise significant influence) are stated at cost plus equity in their undistributed earnings orlosses. Consolidated net income includes the Company’s equity in the current net incomeor loss of such companies, after the elimination of unrealized intercompany profits.
All assets and liabilities of the subsidiaries are revaluated on acquisition, if applica-ble, and the excess of cost over underlying net assets at the date of acquisition isamortized over a period of five years on a straight-line basis.
Before the adoption of the new accounting standard, subsidiaries and affiliatesincluded only companies in which the Company and its group companies held themajority ownership and companies owned 20% to 50% by the Company and its groupcompanies, respectively.
(c ) Foreign currency translat ionThe revenue and expense accounts of the foreign subsidiaries are translated into yen atthe average rates of exchange in effect during the year. The balance sheet accounts,except for the components of shareholders’ equity, are translated into yen at the ratesof exchange in effect at the balance sheet date. The components of shareholders’ equityare translated at their historical exchange rates.
Current assets and liabilities of the Company and its domestic subsidiaries denomi-nated in foreign currencies are translated at the current exchange rates in effect at eachbalance sheet date when not hedged by forward foreign exchange contracts, or at thecontracted rates of exchange when hedged by forward foreign exchange contracts.Other noncurrent assets and liabilities of the Company and its domestic subsidiariesdenominated in foreign currencies are translated into yen at the historical rates ofexchange in effect at the dates of the respective transactions.
(d) Cash equivalentsAll highly liquid investments, generally with a maturity of three months or less whenpurchased, which are readily convertible into known amounts of cash and are so nearmaturity that they represent only an insignificant risk of any change in value attributableto changes in interest rates, are considered cash equivalents.
Under the new accounting standard for statements of cash flows, the definition ofcash and cash equivalents in the statement of cash flows and cash and bank deposits inthe balance sheets differs in certain components. A reconciliation between the cashdefinitions above is presented in Note 9.
(e) Marketable secur it ies and investment secur it iesMarketable securities and investment securities listed on stock exchanges are mainlystated at the lower of cost or market, cost determined by the moving average method.Under the lower of cost or market method, marketable securities are valued to recog-nize both upward and downward changes in value.
Other securities not listed on stock exchanges are mainly stated at cost determinedby the moving average method.
( f ) InventoriesInventories are mainly stated at cost determined by the average method.
(g) Depreciat ion and amort izat ionDepreciation of property, plant and equipment is calculated by the declining-balancemethod at the rates prescribed in the Corporation Tax Law of Japan. However, build-ings (excluding leasehold improvements) acquired after April 1, 1998 by the Companyand its domestic subsidiaries are depreciated by the straight-line method over the peri-ods prescribed in the Corporation Tax Law.
Intangible assets are amortized by the straight-line method at the rates prescribed inthe Corporation Tax Law. Software costs capitalized are amortized by the straight-linemethod over a period of 5 years.
(h) LeasesNoncancelable leases are accounted for as operating leases regardless of whether suchleases are classified as operating or finance leases, except that lease agreements whichstipulate the transfer of ownership of the leased assets to the lessee are accounted foras finance leases.
( i ) Al lowance for doubtful accountsThe allowance for doubtful accounts is provided at an amount sufficient to cover possi-ble losses on the collection of receivables. The amount of the allowance is determinedmainly based on an estimation of the collectibility of individual receivables based on thefinancial position of the debtors.
( j ) Al lowance for ret i rement benefitsEmployees whose services with the Company and its domestic consolidated subsidiariesare terminated are usually entitled to lump-sum retirement benefits determined by ref-erence to their current basic salary, length of service and the conditions under which thetermination occurs. A portion of the liability for employees’ retirement benefits is fundedby the Company and its domestic consolidated subsidiaries in a pension fund adminis-tered by an independent trustee.
The liability for retirement benefits is provided at the amount which would berequired if all employees terminated voluntarily as of the relevant balance sheet date,less the amount of the plan assets at fair value.
The foreign consolidated subsidiaries do not provide for such a liability because theyhave no such retirement benefit plan.
Formerly the allowance for retirement benefits was stated at 40% of the amountwhich would be required to be paid if all employees covered by the plan voluntarily ter-minated their employment as of the balance sheet date.
Effective April 1, 1999, the Company and its domestic consolidated subsidiarieschanged their accounting policy for retirement benefits for employees. This change wasimplemented in order to achieve a better matching of expenses and related revenues as
CENTRAL GLASS_AR 01.6.7 9:28 AM ページ 15
16Central Glass Co., Ltd.
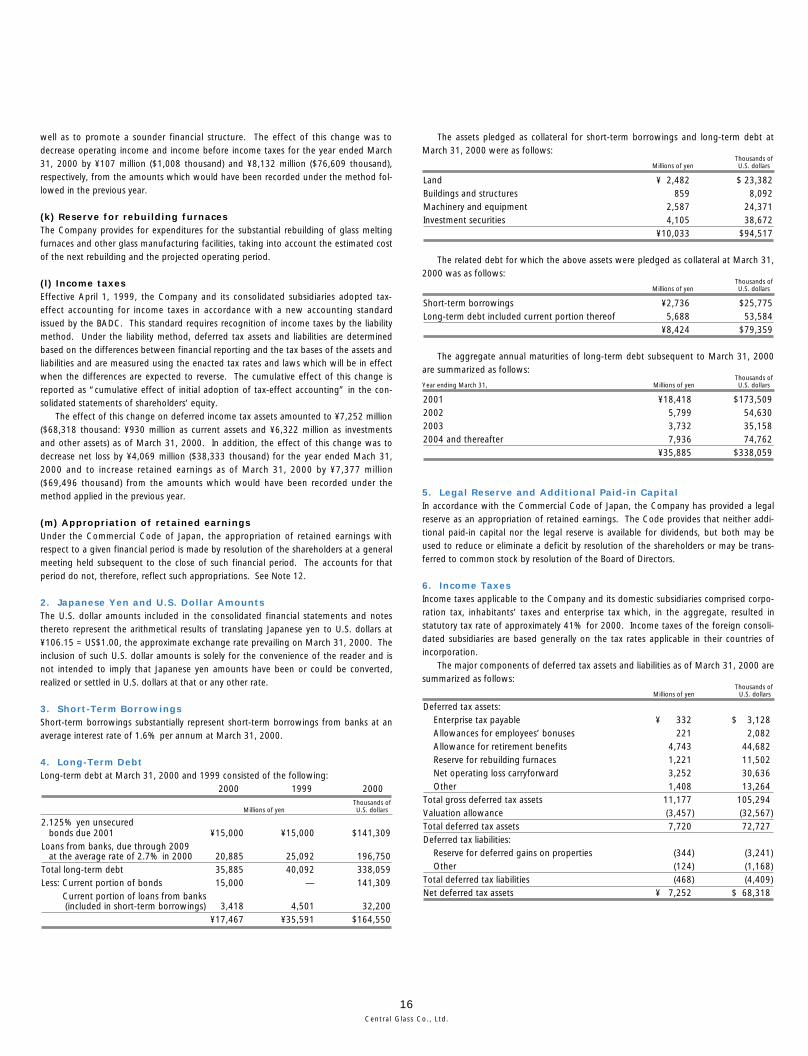
well as to promote a sounder financial structure. The effect of this change was todecrease operating income and income before income taxes for the year ended March31, 2000 by ¥107 million ($1,008 thousand) and ¥8,132 million ($76,609 thousand),respectively, from the amounts which would have been recorded under the method fol-lowed in the previous year.
(k) Reserve for rebui lding furnacesThe Company provides for expenditures for the substantial rebuilding of glass meltingfurnaces and other glass manufacturing facilities, taking into account the estimated costof the next rebuilding and the projected operating period.
( l ) Income taxesEffective April 1, 1999, the Company and its consolidated subsidiaries adopted tax-effect accounting for income taxes in accordance with a new accounting standardissued by the BADC. This standard requires recognition of income taxes by the liabilitymethod. Under the liability method, deferred tax assets and liabilities are determinedbased on the differences between financial reporting and the tax bases of the assets andliabilities and are measured using the enacted tax rates and laws which will be in effectwhen the differences are expected to reverse. The cumulative effect of this change isreported as “cumulative effect of initial adoption of tax-effect accounting” in the con-solidated statements of shareholders’ equity.
The effect of this change on deferred income tax assets amounted to ¥7,252 million($68,318 thousand: ¥930 million as current assets and ¥6,322 million as investmentsand other assets) as of March 31, 2000. In addition, the effect of this change was todecrease net loss by ¥4,069 million ($38,333 thousand) for the year ended Mach 31,2000 and to increase retained earnings as of March 31, 2000 by ¥7,377 million($69,496 thousand) from the amounts which would have been recorded under themethod applied in the previous year.
(m) Appropriat ion of retained earningsUnder the Commercial Code of Japan, the appropriation of retained earnings withrespect to a given financial period is made by resolution of the shareholders at a generalmeeting held subsequent to the close of such financial period. The accounts for thatperiod do not, therefore, reflect such appropriations. See Note 12.
2. Japanese Yen and U.S. Dol lar AmountsThe U.S. dollar amounts included in the consolidated financial statements and notesthereto represent the arithmetical results of translating Japanese yen to U.S. dollars at¥106.15 = US$1.00, the approximate exchange rate prevailing on March 31, 2000. Theinclusion of such U.S. dollar amounts is solely for the convenience of the reader and isnot intended to imply that Japanese yen amounts have been or could be converted,realized or settled in U.S. dollars at that or any other rate.
3. Short-Term BorrowingsShort-term borrowings substantially represent short-term borrowings from banks at anaverage interest rate of 1.6% per annum at March 31, 2000.
4. Long-Term DebtLong-term debt at March 31, 2000 and 1999 consisted of the following:
2000 1999 2000Thousands of
Millions of yen U.S. dollars
2.125% yen unsecuredbonds due 2001 ¥15,000 ¥15,000 $141,309
Loans from banks, due through 2009 at the average rate of 2.7% in 2000 20,885 25,092 196,750
Total long-term debt 35,885 40,092 338,059Less: Current portion of bonds 15,000 — 141,309
Current portion of loans from banks(included in short-term borrowings) 3,418 4,501 32,200
¥17,467 ¥35,591 $164,550
The assets pledged as collateral for short-term borrowings and long-term debt atMarch 31, 2000 were as follows:
Thousands of Millions of yen U.S. dollars
Land ¥ 2,482 $ 23,382Buildings and structures 859 8,092Machinery and equipment 2,587 24,371Investment securities 4,105 38,672
¥10,033 $94,517
The related debt for which the above assets were pledged as collateral at March 31,2000 was as follows:
Thousands ofMillions of yen U.S. dollars
Short-term borrowings ¥2,736 $25,775Long-term debt included current portion thereof 5,688 53,584
¥8,424 $79,359
The aggregate annual maturities of long-term debt subsequent to March 31, 2000are summarized as follows:
Thousands ofYear ending March 31, Millions of yen U.S. dollars
2001 ¥18,418 $173,5092002 5,799 54,6302003 3,732 35,1582004 and thereafter 7,936 74,762
¥35,885 $338,059
5. Legal Reserve and Addit ional Paid- in CapitalIn accordance with the Commercial Code of Japan, the Company has provided a legalreserve as an appropriation of retained earnings. The Code provides that neither addi-tional paid-in capital nor the legal reserve is available for dividends, but both may beused to reduce or eliminate a deficit by resolution of the shareholders or may be trans-ferred to common stock by resolution of the Board of Directors.
6. Income TaxesIncome taxes applicable to the Company and its domestic subsidiaries comprised corpo-ration tax, inhabitants’ taxes and enterprise tax which, in the aggregate, resulted instatutory tax rate of approximately 41% for 2000. Income taxes of the foreign consoli-dated subsidiaries are based generally on the tax rates applicable in their countries ofincorporation.
The major components of deferred tax assets and liabilities as of March 31, 2000 aresummarized as follows:
Thousands ofMillions of yen U.S. dollars
Deferred tax assets:Enterprise tax payable ¥ 332 $ 3,128Allowances for employees’ bonuses 221 2,082Allowance for retirement benefits 4,743 44,682Reserve for rebuilding furnaces 1,221 11,502Net operating loss carryforward 3,252 30,636Other 1,408 13,264
Total gross deferred tax assets 11,177 105,294Valuation allowance (3,457) (32,567)Total deferred tax assets 7,720 72,727Deferred tax liabilities:
Reserve for deferred gains on properties (344) (3,241)Other (124) (1,168)
Total deferred tax liabilities (468) (4,409)Net deferred tax assets ¥ 7,252 $ 68,318
CENTRAL GLASS_AR 01.6.7 9:28 AM ページ 16

17Central Glass Co., Ltd.
A reconciliation between the statutory rate and the effective tax rate as a percent-age of income before income taxes for the year ended March 31, 2000 is summarizedas follows:
2000
Statutory income tax rate 41.0%Reconciliation:
Non-recognized deferred tax assets 200.2Non-deductible expenses for income tax purposes 25.2Inhabitants’ per capita taxes 15.6Equity in earnings of affiliates (39.7)Other (2.2)
Effective income tax rate 240.1%
7. Leases(a) Lessees ’ accountingThe following pro forma amounts represent the acquisition costs, accumulated deprecia-tion and net book value of the leased assets as of March 31, 2000 and 1999, whichwould have been reflected in the balance sheets if lease accounting had been applied tofinance leases currently accounted for as operating leases.
Year ended March 31, 2000
OtherMachinery (property, plant Intangible
and vehicles and equipment) assets Total
Millions of yen
Acquisition costs ¥980 ¥1,413 ¥368 ¥2,761Accumulated
depreciation 696 1,138 245 2,079Book value ¥284 ¥ 275 ¥123 ¥ 682
Year ended March 31, 2000
OtherMachinery (property, plant Intangible
and vehicles and equipment) assets Total
Thousands of U.S. dollars
Acquisition costs $9,232 $13,311 $3,467 $26,010Accumulated
depreciation 6,557 10,720 2,308 19,585Book value $2,675 $ 2,591 $1,159 $ 6,425
Year ended March 31, 1999
OtherMachinery (property, plant Intangible
and vehicles and equipment) assets Total
Millions of yen
Acquisition costs ¥1,061 ¥1,360 ¥474 ¥2,895Accumulated
depreciation 652 757 306 1,715Book value ¥ 409 ¥ 603 ¥168 ¥1,180
Lease payments relating to finance leases accounted for as operating leases in theaccompanying consolidated financial statements amounted to ¥481 million ($4,531thousand) for the year ended March 31, 2000 which was equal to the pro formaamount of depreciation for the year ended March 31, 2000 if lease accounting hadbeen applied to finance leases currently accounted for as operating leases.
Future minimum lease payments (including the interest portion thereon) subsequentto March 31, 2000 for finance lease transactions accounted for as operating leases,except for lease agreements which stipulate the transfer of ownership of the leasedproperty to the Company and its subsidiaries, are summarized as follows:
Thousands ofMillions of yen U.S. dollars
Due within one year or less ¥ 692 $ 6,519Due subsequent to one year 918 8,648Total ¥1,610 $15,167
(b) Lessors ’ accountingSublease income subsequent to March 31, 2000 for finance leases accounted for asoperating leases is summarized as follows:
Thousands ofYear ending March 31, Millions of yen U.S. dollars
2000 ¥364 $3,4292001 and thereafter 630 5,935Total ¥994 $9,364
8. Amounts per ShareAmounts per share of net loss and net assets, as presented below, are based on theweighted average number of shares of common stock outstanding during each year andthe number of shares outstanding at each balance sheet date, respectively.
Year ended March 31,
2000 1999 2000Yen U.S. dollars
Net loss ¥ (2.39) ¥ (1.20) $(0.02)Net assets 270.40 261.72 2.55
Per share amounts assuming full dilution have not been presented because no com-mon stock equivalents remained outstanding as of March 31, 2000 and 1999.
9. Supplementary Cash F low InformationThe following table represents a reconciliation of cash and cash equivalents as of March31, 2000:
Year ended March 31,
2000 2000Thousands of
Millions of yen U.S. dollars
Cash and bank deposits ¥21,983 $207,094Time deposits with a maturity
of more than three months (678) (6,387)Cash and cash equivalents ¥21,305 $200,707
10. Commitments and Contingent L iabi l i t iesContingent liabilities for trade notes receivable discounted and endorsed, loans guaran-teed and joint indebtedness as of March 31, 2000 were as follows:
Year ended March 31,
2000 2000Thousands of
Millions of yen U.S. dollars
Trade notes receivable discountedand endorsed ¥1,739 $16,382
Joint indebtedness for bank loans of companies other than consolidated subsidiaries 796 7,499
In addition, the Company and its consolidated subsidiaries had commitments atMarch 31, 2000 to guarantee bank borrowings of companies other than consolidatedsubsidiaries of ¥873 million ($8,224 thousand) in the aggregate. These guarantees canbe activated at any time by the respective banks on behalf of those companies.
11. Segment InformationThe business and geographical segment information and overseas sales for the Companyand its consolidated subsidiaries for the years ended March 31, 2000 and 1999 are out-lined as follows:
CENTRAL GLASS_AR 01.6.7 9:28 AM ページ 17

18Central Glass Co., Ltd.
Business segmentsYear ended March 31, 2000
Eliminations or unallocated
Glass Chemicals Total amounts Consolidated
Millions of yen
I. Sales and operating incomeSales to external customers ¥110,481 ¥64,802 ¥175,283 ¥ — ¥175,283Intersegment sales or transfers 1,423 1,756 3,179 (3,179) —Total sales 111,904 66,558 178,462 (3,179) 175,283Operating expenses 111,214 55,856 167,070 (3,178) 163,892Operating income ¥ 690 ¥10,702 ¥ 11,392 ¥ (1) ¥ 11,391
II. Total assets, depreciation and capital expendituresTotal assets ¥132,469 ¥90,864 ¥223,333 ¥ (268) ¥223,065Depreciation 5,318 4,878 10,196 — 10,196Capital expenditures 2,438 7,427 9,865 — 9,865
Year ended March 31, 2000
Eliminations or unallocated
Glass Chemicals Total amounts Consolidated
Thousands of U.S. dollars
I. Sales and operating incomeSales to external customers $1,040,801 $610,475 $1,651,276 $ — $1,651,276Intersegment sales or transfers 13,405 16,543 29,948 (29,948) —Total sales 1,054,206 627,018 1,681,224 (29,948) 1,651,276Operating expenses 1,047,707 526,198 1,573,905 (29,939) 1,543,966Operating income $ 6,499 $100,820 $ 107,319 $ (9) $ 107,310
II. Total assets, depreciation and capital expendituresTotal assets $1,247,942 $855,996 $2,103,938 $ (2,525) $2,101,413Depreciation 50,099 45,954 96,053 — 96,053Capital expenditures 22,967 69,968 92,935 — 92,935
Year ended March 31, 1999
Glass and Eliminations building or unallocatedmaterials Chemicals Total amounts Consolidated
Millions of yen
I. Sales and operating incomeSales to external customers ¥107,200 ¥66,582 ¥173,782 ¥ — ¥173,782Intersegment sales or transfers 1,581 2,093 3,674 (3,674) —Total sales 108,781 68,675 177,456 (3,674) 173,782Operating expenses 110,346 60,328 170,674 (3,676) 166,998Operating income (loss) ¥ (1,565) ¥ 8,347 ¥ 6,782 ¥ 2 ¥ 6,784
II. Total assets, depreciation and capital expendituresTotal assets ¥129,020 ¥83,951 ¥212,971 ¥ (159) ¥212,812Depreciation 5,899 5,271 11,170 — 11,170Capital expenditures 3,228 5,305 8,533 — 8,533
Notes:a) Basis of segmentation
(1) Business segments are divided into the Glass Division and the ChemicalsDivision based on the nature of the manufacturing process and sales market.
Effective April 1999, only the name of the Glass and Building MaterialsDivision has been changed to the Glass Division.
(2) Major products in each business segment:Glass—flat architectural glass, fabricated glass products for automobiles, fabri-
cated glass products for industries, etc.Chemicals—soda, chlorine products, fine chemical products, fiberglass prod-
ucts, fertilizer , etc.b) No unallocated operating expenses were included in eliminations or unallocated
amounts for the years ended March 31, 2000 and 1999.c) No total assets were included in eliminations or unallocated amounts as of March 31,
2000 and 1999.d) Amortization of and additions to long-term prepaid expenses have been included in
depreciation and capital expenditures.
Geographical segmentsAs permitted, the information on geographical segments for the years ended March 31,2000 and 1999, has been omitted because the Japanese segment constituted morethan 90% of total consolidated sales, assets and operating income.
Overseas salesYear ended March 31, 2000
North America Europe Other areas Total
Millions of yen
Overseas salesOverseas sales ¥12,892 ¥7,315 ¥5,033 ¥ 25,240Consolidated net sales ¥175,283% of consolidated
net sales 7.4% 4.2% 2.8% 14.4%
CENTRAL GLASS_AR 01.6.7 9:28 AM ページ 18

19Central Glass Co., Ltd.
Year ended March 31, 2000
North America Europe Other areas Total
Thousands of U.S. dollars
Overseas salesOverseas sales $121,451 $68,912 $47,414 $ 237,777Consolidated net sales $1,651,276% of consolidated
net sales 7.4% 4.2% 2.8% 14.4%
Year ended March 31, 1999
North America Europe Other areas Total
Millions of yen
Overseas salesOverseas sales ¥11,141 ¥6,570 ¥3,098 ¥ 20,809Consolidated net sales ¥173,782% of consolidated
net sales 6.4% 3.8% 1.8% 12.0%
Notes:a) Geographical areas are divided into categories based on their geographical proximity.b) Major nations or regions included in each geographical area:
(1) North America—U.S.A., Canada(2) Europe—Netherlands, England, Germany, France, Belgium, etc.(3) Other areas—Taiwan, Korea, China, Singapore, Philippines, Australia, etc.
c) Overseas sales are sales of the Company and its consolidated subsidiaries in foreigncountries.
12. Subsequent EventThe following appropriations of retained earnings of the Company, which have not beenreflected in the consolidated financial statements for the year ended March 31, 2000,were approved at a shareholders’ meeting held on June 29, 2000:
Thousands ofMillions of yen U.S. dollars
Cash dividends (¥5 = U.S.$0.047 per share) ¥1,074 $10,118
13. Marketable Securit ies and Investment Securit iesInformation with respect to the book and fair value of marketable securities and invest-ment securities for which market prices are available is summarized as follows:
March 31, 2000
Book Fair Unrealizedvalue value gain
Millions of yen
Marketable securities:Equity securities ¥ 4,656 ¥11,512 ¥ 6,856Debt securities — — —Other — — —
4,656 11,512 6,856Investment securities:Equity securities 8,571 15,274 6,703
8,571 15,274 6,703Total ¥13,227 ¥26,786 ¥13,559
Thousands of U.S. dollars
Marketable securities:Equity securities $ 43,862 $108,450 $ 64,588Debt securities — — —Other — — —
43,862 108,450 64,588Investment securities:Equity securities 80,745 143,891 63,146
80,745 143,891 63,146Total $124,607 $252,341 $127,734
The fair value of listed securities is based primarily on the closing prices on the TokyoStock Exchange. The fair value of securities traded over-the-counter (OTC) are the pricesissued by the Japan Securities Dealers’ Association.
The following items have been excluded from the above table and were carried atthe respective amounts in the balance sheet as of March 31, 2000:
Thousands ofMillions of yen U.S. dollars
Non-current assets:Unlisted equity securities
(except for OTC equity securities) ¥6,687 $62,996Unlisted debt securities 1,550 14,602Investments in affilaites 6,385 60,151
14. Der ivat ive and Hedging Act iv it iesWith respect to the Company and its consolidated subsidiaries, only the Company hasdealings in derivatives and conducts hedging activities. The contents of the dealings areinterest rate swaps and currency swaps. The Company primarily utilizes them todecrease the charge of loan interest and to hedge their exposure to foreign exchangefluctuations arising from trade receivable in the normal course of business. These trans-actions effectively offset each risk on assets and liabilities in the balance sheet. TheCompany is exposed to the risk of credit loss in the event of nonperformance by thecounterparties to the interest rate and currency derivatives; however, the Company doesnot anticipate nonperformance by any of these counterparties, all of whom are financialinstitutions with high credit ratings.
The derivatives are conducted by the Finance Section and controlled by theAccounting Section under the director in charge of such transactions. Management ofthe Company believes that risks inherent to the derivatives could be avoided by theCompany’s internal control system which includes monitoring activities of the FinanceSection and Accounting Section each other.
Information with respect to the contract amount, fair value, and unrealized gain orloss on derivatives is summarized as follows:
Interest-related swapsMarch 31, 2000
Contract amount
Non-current Fair UnrealizedTotal portion value gain (loss)
Millions of yen
Interest rate swaps:Receive/fixed and pay/floating ¥3,050 ¥2,500 ¥100 ¥100Receive/floating and pay/fixed 2,500 2,500 (15) (15)Receive/floating and pay/floating 550 — (2) (2)
¥6,100 ¥5,000 ¥ 83 ¥ 83Thousands of U.S. dollars
Interest rate swaps:Receive/fixed and pay/floating $28,732 $23,551 $942 $942Receive/floating and pay/fixed 23,551 23,552 (141) (141)Receive/floating and pay/floating 5,183 — (19) (19)
$57,466 $47,103 $782 $782
Note: Fair value is based on the respective prices quoted by the counterparty financialinstitutions.
CENTRAL GLASS_AR 01.6.7 9:28 AM ページ 19

The Board of Directors of
Central Glass Co., Ltd.
We have audited the accompanying consolidated balance sheets of Central Glass Co., Ltd. and consolidated subsidiaries as of March 31, 2000
and 1999, and the related consolidated statements of operations and shareholders’ equity for the years then ended, all expressed in yen. We
have also audited the statement of cash flows for the year ended March 31, 2000. Our audits were made in accordance with auditing stan-
dards, procedures and practices generally accepted and applied in Japan and, accordingly, included such tests of the accounting records and
such other auditing procedures as we considered necessary in the circumstances.
In our opinion, the consolidated financial statements, expressed in yen, present fairly the consolidated financial position of Central Glass Co.,
Ltd. and consolidated subsidiaries at March 31, 2000 and 1999, and the consolidated results of their operations for the years then ended in
conformity with accounting principles and practices generally accepted in Japan applied on a consistent basis. The financial statements also
present fairly the consolidated results of their cash flows for the year ended March 31, 2000, in conformity with accounting principles and
practices generally accepted in Japan.
As described in Note 1 to the consolidated financial statements, Central Glass Co., Ltd. and consolidated subsidiaries have adopted new
accounting standards for research and development expenses and tax-effect accounting in the preparation of their consolidated financial state-
ments for the year ended March 31, 2000.
The U.S. dollar amounts in the accompanying consolidated financial statements with respect to the year ended March 31, 2000 are presented
solely for convenience. Our audit also included the translation of yen amounts into U.S. dollar amounts and, in our opinion, such translation
has been made on the basis described in Note 2 to the consolidated financial statements.
Shinsuke Kawai Tsutomu Nakano
Certified Public Accountant Certified Public Accountant
Tokyo, Japan
June 29, 2000
20Central Glass Co., Ltd.
RE P O RT O F IN D E P E N D E N T CE RT I F I E D PU B L I C AC C O U N TA N T S
CENTRAL GLASS_AR 01.6.7 9:28 AM ページ 20

BOA R D O F DI R E C TO R S
& AU D I TO R S(As of June 29, 2000)
M E M B E R S O F T H E B O A R DPresidentSadayoshi Nakamura
Executive Senior Managing DirectorsAtsushi IchikawaYo Kawakami
Managing DirectorsAkira NegishiNorihisa YamamotoKazuyuki TsurumiHirohiko SakaiTadashi SasakiArao Abe
DirectorsShousuke FukueMasataka TsuboiKunihiko UmesakiSeiichi MitsumotoTakashi Tamura
Corporate AuditorsSakuichi UenoShigeo MaruyamaShigeharu NegishiSeiichi Yada
H E A D O F F I C EKowa-Hitotsubashi Building 7-1, Kanda-Nishikicho 3-chomeChiyoda-ku, Tokyo 101-0054, JapanTel: 81-3-3259-7111 Fax: 81-3-3259-7883
E S T A B L I S H E DOctober 10, 1936
P A I D - I N C A P I T A L¥18,168 million
C O M M O N S H A R E SAuthorized: 871,500,000Issued: 214,879,975
B U S I N E S S A C T I V I T I E SManufacture and sales of flat glass, fabricatedglass and other glass products; soda, chlorine,organic and inorganic fluorides, fertilizers, high-purity gas, solvents, medical and agriculturalproducts and other chemical products; fiberglassproducts; vinyl chloride and other synthetic resins.
D O M E S T I C O F F I C E S A N D P L A N T SSales OfficesSapporo BranchSendai BranchNagoya BranchOsaka BranchFukuoka Branch
PlantsMatsusaka PlantSakai PlantUbe Plant
S U B S I D I A R I E S A N D A F F I L I A T E SPrincipal Domestic SubsidiariesCentral Chemical Co., Ltd.Central Kasei Chemical Co., Ltd.Central Glass Fiber Co., Ltd.Mie Glass Industry Co., Ltd.Central Glass Wool Co., Ltd.
Principal Overseas Subsidiaries andAffiliatesU . S . A .Carlex Glass Company77 Excellence WayVonore, TN 37885, U.S.A.Tel: 1-423-884-1111
Central Glass International Inc.(New York)50 Main Street, 8th FloorWhite Plains, NY 10606, U.S.A.Tel: 1-914-683-3868 (Detroit)1330 Fieldway DriveBloomfield Hills, MI 48302, U.S.A.Tel: 1-248-745-0740
Northwestern Industries Inc.2500 West Jameson StreetSeattle, WA 98199, U.S.A.Tel: 1-206-285-3140
T A I W A NYue Sheng Industrial Co., Ltd.40-5 Po-Kung Keng, Hsi-Hu TsunSannyi Hsiang, Miaoli Hsien 36705Taiwan, R.O.C.Tel: 886-37-871-815
Taiwan Central Glass Co., Ltd.40-17 Po-Kung Keng, Hsi-Hu Tsun Sannyi Hsiang, Miaoli Hsien 36705Taiwan, R.O.C.Tel: 886-37-872-795
T H A I L A N DCentral Glass Co., Ltd. Thailand Representative OfficeMetro Building, 180-184 Rajawongse RoadBangkok 10100, ThailandTel: 66-2-221-8893
Thai Central Chemical Public Co., Ltd.Metro Building, 180-184 Rajawongse RoadBangkok 10100, ThailandTel: 66-2-221-8893
PMK-Central Glass Co., Ltd.41 Moo 12 Petchkasem Road Omnoi Krathumban Samutsakorn 74130ThailandTel: 66-2-813-7277
V I E T N A MJapan Vietnam Fertilizer Company118 Nguyen Dinh Chiew Street District 1, Ho Chi Minh CityVietnamTel: 84-8-829-8482
C H I N ABeijing Sanchong Mirror Co., Ltd.East Xisanqi Dewai Haidian DistrictBeijing 100096, ChinaTel: 86-10-8291-3827
CO R P O R AT E DATA(As of June 29, 2000)
Head Office21
Central Glass Co., Ltd.
CENTRAL GLASS_AR 01.6.7 9:28 AM ページ 21

Kowa-Hitotsubashi Building
7-1, Kanda-Nishikicho 3-chome
Chiyoda-ku, Tokyo 101-0054, Japan Printed in Japan
CENTRAL GLASS_AR 01.6.7 9:27 AM ページ 1