Embed Size (px)
Citation preview

University of Central Florida University of Central Florida
STARS STARS
Electronic Theses and Dissertations, 2004-2019
2012
Central Florida Educational Leaders' Professional Opinions Of The Central Florida Educational Leaders' Professional Opinions Of The
Race To The Top Grant Components Concerning Teacher Race To The Top Grant Components Concerning Teacher
Evaluation And Compensation Prior To Implementation Evaluation And Compensation Prior To Implementation
Daniel Windish University of Central Florida
Part of the Educational Leadership Commons
Find similar works at: https://stars.library.ucf.edu/etd
University of Central Florida Libraries http://library.ucf.edu
This Doctoral Dissertation (Open Access) is brought to you for free and open access by STARS. It has been accepted
for inclusion in Electronic Theses and Dissertations, 2004-2019 by an authorized administrator of STARS. For more
information, please contact [email protected].
STARS Citation STARS Citation Windish, Daniel, "Central Florida Educational Leaders' Professional Opinions Of The Race To The Top Grant Components Concerning Teacher Evaluation And Compensation Prior To Implementation" (2012). Electronic Theses and Dissertations, 2004-2019. 2298. https://stars.library.ucf.edu/etd/2298

CENTRAL FLORIDA EDUCATIONAL LEADERS’ PROFESSIONAL OPINIONS
OF THE RACE TO THE TOP GRANT COMPONENTS CONCERNING
TEACHER EVALUATION AND COMPENSATION PRIOR TO IMPLEMENTATION
by
DANIEL H. WINDISH
B.S. University of Central Florida, 1997
M.Ed. University of Central Florida, 2002
A dissertation submitted in partial fulfillment of the requirements
for the degree of Doctor of Education
in the School of Teaching, Learning, and Leadership
in the College of Education
at the University of Central Florida
Orlando, Florida
Summer Term
2012
Major Professor: Rosemarye Taylor

ii
© 2012 Daniel H. Windish

iii
ABSTRACT
This mixed-methods study was conducted to explore the professional opinions of
educational leaders regarding selected components in the Race to the Top (RTTT) grant
concerning teacher evaluation and compensation and the potential impact on student
achievement. A target university was selected that had students who were professionals
in the field of education in either instructional or administrative jobs and were pursuing
their doctorates in both Education and Educational Leadership. A researcher created
survey and follow-up interview were utilized to gather both quantitative and qualitative
data for analysis.
Quantitative findings revealed that statistically significant differences in the
opinions of educational leaders about the potential impact of the RTTT grant teacher
evaluation and compensation components on student achievement existed between two
types of professional classification (instructional or administrative). No statistically
significant relationship was found between self-reported knowledge of the RTTT and
opinions of the fairness of the RTTT teacher evaluation and compensation components.
Also, no statistically significant difference was found in the professional opinions about
the potential impact of the RTTT grant teacher evaluation and compensation components
on student achievement when self-reported school poverty percentage was considered.
From qualitative findings, themes emerged surrounding the uncertainty and lack of
understanding about the RTTT grant’s implementation. Though this study provided
baseline data on the opinions of educational leaders on the RTTT teacher evaluation and
compensation components, there is still much to be learned about the RTTT grant.

iv
Accomplishments like this are only significant if you have loved ones to share them with.
My inspiration to persevere was the following:
My family--the knowledgeable Dad, the caring Mom, and the cool Katie;
My children--the determined Leeana, the easy-going Lauryn, and the Brave little Sadie;
And my wife--the beautiful, loving, and incredible Shana.
I love you!

v
ACKNOWLEDGMENTS
Accomplishments like this also do not come without the assistance of others.
How do you acknowledge the people that have meant so much to your professional,
academic, and personal life? I am not really sure, but I will start by saying, “Thank
You.”
Thank you to my Dissertation Chair, Dr. Rosemarye Taylor. She kept me from
quitting and kept me on track with thought-provoking feedback and knowledgeable
suggestions. Thank you to the rest of my committee. Dr. George Pawlas has known me
for more than a decade and is one of my educational heroes. I am glad that I finished up
under his watch. Dr. Walter Doherty has given great feedback and has kept me smiling.
Dr. Thomas Vitale’s presence was invaluable on this committee. I also would like to
thank Dr. William Bozeman for challenging me during my pursuit of this doctorate. In
addition, I would like to thank Dr. Mary Ann Lynn who has served in the role of editor.
She is amazing with the edits, but her “dissertation mentorship” meant the most.
Thank you to my Leadership 2010 Cohort. I may be one of the last to finish, but I
may be the most proud to have been part of the group. I hope to keep in touch with all of
them. I would also like to acknowledge my mini-cohort Janet Kearney and Michelle
Robinson. It is their turn now.
Thank you to the students I have ever had the privilege of teaching. Because of
them, I keep hopping and I keep moving forward. Thank you to the principals and
supervisors that have made a difference in my professional life. They include: Dr. Norma

vi
Masterson who believed in me, Nancy Schroeder who believed in second chances, and
Debbie Warner who believed in making a difference.
My eternal thanks, appreciation, and admiration go to Dr. Dianne Lebruto. She
taught me what it takes to persevere through professional and personal challenges and
still laugh. Because of her, I have seen a great leader in action. More importantly,
because of her, I have seen a great friend in my life.
Finally, I would like to acknowledge my family one last time. In hindsight,
getting married, having a child, and buying a handyman special of house, were all things
that should wait until after one writes a dissertation. My family found out that life does
not stop for a dissertation. In July of 2011, my daughter Sadie was diagnosed with Type
I Diabetes. She was three. Now, almost a year later, she is used to the blood checks and
insulin shots each day, but her dad is not. Sadie is so Brave and is my inspiration. If she
can manage all that being diabetic entails, I can write a dissertation. Thank you to my
mom and dad for their continued support. Thank you to Leeana and Lauryn for being
great girls and amazing big sisters. Finally, thank you to the woman who does so much
and means so much to us all. I love you Shana. I could not have done this without you.

vii
TABLE OF CONTENTS
LIST OF TABLES .............................................................................................................. x
CHAPTER 1 THE PROBLEM AND ITS CLARIFYING COMPONENTS .................. 11
Introduction ........................................................................................................... 11 Purpose of the Study ............................................................................................. 13 Statement of the Problem ...................................................................................... 14 Definition of Terms............................................................................................... 15 Conceptual Framework ......................................................................................... 21
Teacher Compensation and Evaluation .................................................... 21
Reform Initiatives ..................................................................................... 21 High-Poverty Schools ............................................................................... 23
Need for Student Achievement at High Poverty/Title I Schools .............. 25 Research Questions ............................................................................................... 26 Methodology ......................................................................................................... 27
Population and Sample ......................................................................................... 27 Instrumentation ..................................................................................................... 28
Data Collection ..................................................................................................... 28 Data Analysis ........................................................................................................ 29 Delimitations ......................................................................................................... 29
Significance of the Study ...................................................................................... 31
Summary ............................................................................................................... 31
CHAPTER 2 REVIEW OF LITERATURE .................................................................... 33 Introduction ........................................................................................................... 33
Improving Student Achievement .......................................................................... 34 Achievement and Socioeconomic Status .................................................. 35
Teacher Quality ......................................................................................... 43 Major Federal Reforms to Public Education ........................................................ 46
Title I ......................................................................................................... 47 No Child Left Behind................................................................................ 51 Race to the Top (RTTT) ........................................................................... 52 Florida’s Race to the Top .......................................................................... 57
Teacher Evaluation and Compensation ................................................................ 60
The Evolution of Teacher Evaluation ....................................................... 60 Purposes and Perceptions of Teacher Evaluation ..................................... 62
The Evolution of Teacher Compensation ................................................. 65 Purposes and Perceptions of Teacher Compensation ............................... 69 Recent Reforms to Teacher Evaluation and Compensation ..................... 72
Summary ............................................................................................................... 85

viii
CHAPTER 3 METHODOLOGY .................................................................................... 86 Introduction ........................................................................................................... 86 Sample................................................................................................................... 88 Instrumentation ..................................................................................................... 89
Survey of the Implementation and Impact of Teacher Evaluation and
Compensation Components from the Race to the Top Grant (STECC-
RTTT) ....................................................................................................... 89 Follow-up Telephone Interviews .............................................................. 94
Data Collection Procedures ................................................................................... 94
Collection of Quantitative Data ................................................................ 94 Collection of Qualitative Data .................................................................. 95
Data Analysis ........................................................................................................ 97 Analysis of Quantitative Data ................................................................... 97 Analysis of Qualitative Data ..................................................................... 99
Summary ............................................................................................................. 102
CHAPTER 4 RESULTS ................................................................................................ 103 Introduction ......................................................................................................... 103
Descriptive Statistics ........................................................................................... 103 Categorical Variables .............................................................................. 104 Continuous Variables .............................................................................. 104
Data Analysis for Research Question 1 .............................................................. 109 Quantitative Analysis for Research Question 1 ...................................... 109
Qualitative Analysis for Research Question 1 ........................................ 110 Data Analysis for Research Question 2 .............................................................. 112
Quantitative Analysis for Research Question 2 ...................................... 112 Qualitative Analysis for Research Question 2 ........................................ 117
Data Analysis for Research Question 3 .............................................................. 120 Quantitative Analysis for Research Question 3 ...................................... 120
Qualitative Analysis for Research Question 3 ........................................ 123 Data Analysis for Research Question 4 .............................................................. 126
Quantitative Analysis for Research Question 4 ...................................... 126 Qualitative Analysis for Research Question 4 ........................................ 128 Additional Analyses ................................................................................ 130
Summary ............................................................................................................. 135
CHAPTER 5 SUMMARY, IMPLICATIONS, AND RECOMMENDATIONS .......... 137
Introduction ......................................................................................................... 137 Purpose of the Study ........................................................................................... 137 Population, Research Design, and Instrumentation ............................................ 137 Summary and Discussion of the Findings .......................................................... 138
Research Question 1 ............................................................................... 139 Research Question 2 ............................................................................... 140

ix
Research Question 3 ............................................................................... 143 Research Question 4 ............................................................................... 145
Implications for Policy and Practice ................................................................... 146 Recommendations for Further Research ............................................................. 149
Limitations of the Study...................................................................................... 151 Conclusion .......................................................................................................... 151
APPENDIX A ELECTRONIC SURVEY OF THE IMPLEMENTATION AND
IMPACT OF TEACHER EVALUATION AND COMPENSATION ELEMENTS
FROM THE RACE TO THE TOP GRANT .................................................................. 153
APPENDIX B COLLEGE OF EDUCATION PERMISSION TO CONDUCT
RESEARCH .................................................................................................................... 159
APPENDIX C INSTITUTIONAL REVIEW BOARD APPROVAL ......................... 162
APPENDIX D INFORMED CONSENT..................................................................... 164
APPENDIX E INTERVIEW PROTOCOL ................................................................. 168
APPENDIX F ANALYSIS OF QUALITATIVE DATA .............................................. 175
LIST OF REFERENCES ................................................................................................ 180
x
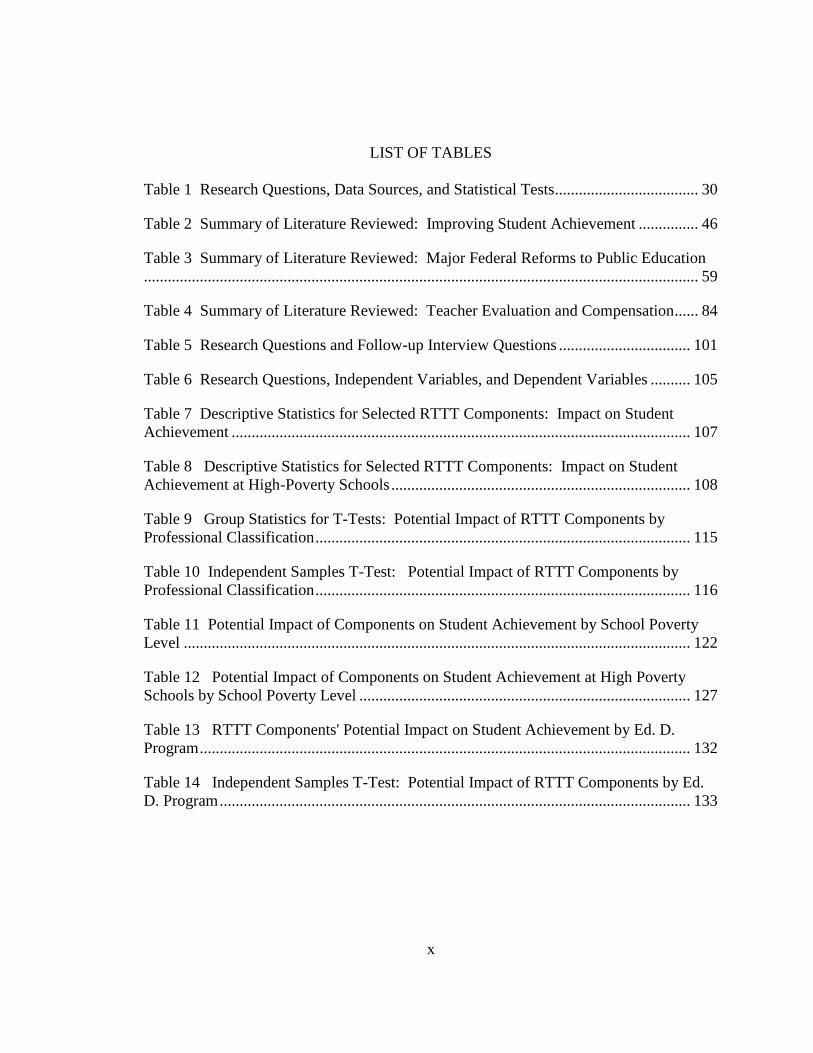
LIST OF TABLES
Table 1 Research Questions, Data Sources, and Statistical Tests .................................... 30
Table 2 Summary of Literature Reviewed: Improving Student Achievement ............... 46
Table 3 Summary of Literature Reviewed: Major Federal Reforms to Public Education
........................................................................................................................................... 59
Table 4 Summary of Literature Reviewed: Teacher Evaluation and Compensation ...... 84
Table 5 Research Questions and Follow-up Interview Questions ................................. 101
Table 6 Research Questions, Independent Variables, and Dependent Variables .......... 105
Table 7 Descriptive Statistics for Selected RTTT Components: Impact on Student
Achievement ................................................................................................................... 107
Table 8 Descriptive Statistics for Selected RTTT Components: Impact on Student
Achievement at High-Poverty Schools ........................................................................... 108
Table 9 Group Statistics for T-Tests: Potential Impact of RTTT Components by
Professional Classification .............................................................................................. 115
Table 10 Independent Samples T-Test: Potential Impact of RTTT Components by
Professional Classification .............................................................................................. 116
Table 11 Potential Impact of Components on Student Achievement by School Poverty
Level ............................................................................................................................... 122
Table 12 Potential Impact of Components on Student Achievement at High Poverty
Schools by School Poverty Level ................................................................................... 127
Table 13 RTTT Components' Potential Impact on Student Achievement by Ed. D.
Program ........................................................................................................................... 132
Table 14 Independent Samples T-Test: Potential Impact of RTTT Components by Ed.
D. Program ...................................................................................................................... 133
11
CHAPTER 1
THE PROBLEM AND ITS CLARIFYING COMPONENTS
Introduction
To the National Urban League and to the nation, President Obama said:
“So, even as we applaud teachers for their hard work, we’ve got to make sure
we’re seeing results in the classroom. If we’re not seeing results in the classroom,
then let’s work with teachers to help them become more effective. If that doesn’t
work, let’s find the right teacher for that classroom” (Obama, 2010).
School reform can come from many sources, such as legislators and politicians.
When these groups initiate reform, it can be met with a very mixed reception as
evidenced in the 2010 proposed legislation, Senate Bill 6 (SB 6), in the Florida
legislature. Senate Bill 6 brought merit pay and the elimination of teacher tenure into the
consciousness of educators across the state and garnered tremendous opposition
(Sampson & Silva, 2010).
The veto of the SB 6 by then Governor Charlie Crist would have ended this
debate if Florida had not secured $700 million in the federal Race to the Top (RTTT)
grant competition. In part, the funds were to be used to develop merit-pay plans and
other elements that would tie teacher evaluations to test scores (Postal, 2010).
In addition, under the provisions of RTTT, participating schools were required to
design and implement new performance evaluation systems for teachers and to utilize the
evaluations to determine compensation, promotion and retention of teachers. Student
achievement and growth data needed to account for 50% of the combined teacher
evaluation. In addition, school districts were to include in the evaluation principals’

12
observations of the teachers’ use of effective practices as well as one additional metric of
the school district’s choosing (Florida Department of Education, 2010b). Through the
requirements of this grant, school districts would link student achievement and student
growth data along with effectiveness demonstrated by annual evaluations to salaries.
Also, school districts would offer differentiated pay based on job performance difficulties
such as working in high-poverty, high minority, or persistently lowest-achieving schools
according to the Florida Department of Education’s list of schools. (Florida Department
of Education, 2010a).
All school reform, including legislation like SB 6 and federal grants like RTTT,
had the improvement of student learning and achievement at their core. Evaluation and
compensation reforms may have a different impact on teachers in Title I schools (schools
which have a high percentage of students who are economically disadvantaged). This
emphasis is due to extensive research related to the catastrophic results that being
economically disadvantaged may have on a student’s educational achievement and life
choices (Berliner, 2006; Sirin, 2005).
Because of the relationship between economic status and student achievement, a
moral obligation exists to address the needs of students from poverty (Fullan, 2006). The
field of education has recognized the plight of high-poverty/Title I schools for decades
(Berliner, 2006; Borman, 2003; Caldas & Bankston, 1997; Sirin, 2005). Schools with
higher percentages of economically disadvantaged students are eligible to receive
additional funding from the federal government (Borman, 2003). If teacher evaluation
and compensation are to be based on student achievement scores, a concern of
educational leaders, both administrative and instructional, could be staffing highly
13
effective teachers at schools that have these higher percentages of economically
disadvantaged students.
How new policies developed to improve student achievement by changing
compensation for teachers will affect consistent student growth is yet to be determined.
Compensating teachers in alternative ways to the commonly used scale based on years of
experience and educational degrees has been common practice (Buddin, McCaffrey,
Kirby, & Xia, 2007; Goldhaber, DeArmond, Player, & Choi, 2008; Odden, 2000).
However, more study is needed on how the changes to evaluation and compensation
would affect the continuity of instruction of students at schools with higher percentages
of economically deprived students.
Purpose of the Study
The purpose of this study was to explore the professional opinions of educational
leaders (instructional and administrative) regarding selected components in the Race to
the Top grant concerning teacher evaluation and compensation and the performance of
students at schools with a percentage of economically disadvantaged students of 75% or
higher. Opinions of central Florida school leaders pursuing advanced degrees were
sought as to whether the changes anticipated to be implemented as a part of the RTTT
grant would help in improving the learning or academic growth of students at schools.
The professional opinions of educators at different types of schools were sought to help
understand the different challenges the new elements found in the RTTT grant would
have in helping to improve student achievement. By conducting this study, the
researcher intended to add to the field of knowledge concerning the types of policy and

14
reform that can lead to increased student learning at all schools, and in particular, high-
poverty schools.
Statement of the Problem
The effects of being economically disadvantaged on student achievement are well
documented (Berliner, 2006; Borman, 2003; Sirin, 2005). With quality instruction from
teachers, students from schools with higher percentages of economically disadvantaged
students can reach higher levels of academic success and achievement gaps can be closed
(Borman, 2003). The increasing demands of accountability to improve teaching and to
turnaround the lowest performing schools found in the Florida’s RTTT grant created the
need to understand the professional opinions related to the required components of
teacher evaluation and teacher compensation.
Because Florida educators are responsible for both increased accountability in
student achievement and evaluating teachers, their input into how reform elements found
in the changes required by the RTTT grant were perceived to affect instruction is
important. More research was needed to learn of educators’ professional opinions on
policy components that they believed would truly impact student learning positively.
Comparing and contrasting the opinions of both instructional and administrative
educational leaders from schools with different poverty rates regarding the RTTT
components was intended to provide much needed insight for the direction of educational
reform policy in the future.

15
Definition of Terms
The following terms and phrases were defined for the purposes of this research
and to aid in conducting the study.
Administrative. For purposes of this study, administrative pertains to non-
instructional positions such as principal, assistant principal, director, and district-level
administrator.
Compensation. For purposes of this study, compensation refers to the teacher pay
and the benefits.
Common set of K-12 standards. “A set of content standards that define what
students must know and be able to do and that are substantially identical across all States
in a consortium. A State may supplement the common standards with additional
standards, provided that the additional standards do not exceed 15 percent of the State's
total standards for that content area” (Florida Department of Education, n.d.).
Economically disadvantaged students. “All students eligible for free or reduced
price lunch prior to testing are considered to be economically disadvantaged” (Florida
Department of Education, 2010c).
Effective principal. “A principal whose students, overall and for each subgroup,
achieve acceptable rates (e.g., at least one grade level in an academic year) of student
growth (as defined in this notice). States, LEAs, or schools must include multiple
measures, provided that principal effectiveness is evaluated, in significant part, by student
growth (as defined in this notice). Supplemental measures may include, for example,
high school graduation rates and college enrollment rates, as well as evidence of
providing supportive teaching and learning conditions, strong instructional leadership,

16
and positive family and community engagement” (Florida Department of Education,
n.d.).
Effective teacher. “A teacher whose students achieve acceptable rates (e.g., at
least one grade level in an academic year) of student growth (as defined in this notice).
States, LEAs, or schools must include multiple measures, provided that teacher
effectiveness is evaluated, in significant part, by student growth (as defined in this
notice). Supplemental measures may include, for example, multiple observation-based
assessments of teacher performance” (Florida Department of Education, n.d.)
Evaluation. For purposes of meeting state requirements for evaluation systems,
“evaluation means an assessment of an individual’s performance over a period of time
based on evidence from multiple measures that reflect the performance level of the
individual’s work on student learning, practice, and job responsibilities” (Florida
Department of Education, 2012).
Formative assessment. “Assessment questions, tools, and processes that are
embedded in instruction and are used by teachers and students to provide timely feedback
for purposes of adjusting instruction to improve learning” (Florida Department of
Education, n.d.).
Highly effective principal. “A principal whose students, overall and for each
subgroup, achieve high rates (e.g., one and one-half grade levels in an academic year) of
student growth (as defined in this notice). States, LEAs, or schools must include multiple
measures, provided that principal effectiveness is evaluated, in significant part, by student
growth (as defined in this notice). Supplemental measures may include, for example,
high school graduation rates; college enrollment rates; evidence of providing supportive
17
teaching and learning conditions, strong instructional leadership, and positive family and
community engagement; or evidence of attracting, developing, and retaining high
numbers of effective teachers” (Florida Department of Education, n.d.).
Highly effective teacher. “A teacher whose students achieve high rates (e.g., one
and one-half grade levels in an academic year) of student growth (as defined in this
notice). States, LEAs, or schools must include multiple measures, provided that teacher
effectiveness is evaluated, in significant part, by student growth (as defined in this
notice). Supplemental measures may include, for example, multiple observation-based
assessments of teacher performance or evidence of leadership roles (which may include
mentoring or leading professional learning communities) that increase the effectiveness
of other teachers in the school or LEA” (Florida Department of Education, n.d.).
High-need students. “Students at risk of educational failure or otherwise in need
of special assistance and support, such as students who are living in poverty, who attend
high-minority schools (as defined in this notice), who are far below grade level, who have
left school before receiving a regular high school diploma, who are at risk of not
graduating with a diploma on time, who are homeless, who are in foster care, who have
been incarcerated, who have disabilities, or who are English language learners” (Florida
Department of Education, n.d.).
High-poverty school. “Consistent with section 1111(h)(1)(C)(viii) of the ESEA, a
school in the highest quartile of schools in the State with respect to poverty level, using a
measure of poverty determined by the State” (Florida Department of Education, n.d.). For
this study, a high-poverty school was defined as a school with a percentage of
economically disadvantaged students of 75% or more.
18
High-quality assessment. “An assessment designed to measure a student’s
knowledge, understanding of, and ability to apply, critical concepts through the use of a
variety of item types and formats (e.g., open-ended responses, performance-based tasks).
Such assessments should enable measurement of student achievement (as defined in this
notice) and student growth (as defined in this notice); be of high technical quality (e.g.,
be valid, reliable, fair, and aligned to standards); incorporate technology where
appropriate; include the assessment of students with disabilities and English language
learners; and to the extent feasible, use universal design principles (as defined in section
3 of the Assistive Technology Act of 1998, as amended, 29 U.S.C. 3002) in development
and administration” (Florida Department of Education, n.d.).
Instructional. For purposes of this study, this term refers to any teacher, academic
coach, resource, or other non-administrative position.
Instructional improvement systems. “Technology-based tools and other strategies
that provide teachers, principals, and administrators with meaningful support and
actionable data to systemically manage continuous instructional improvement, including
such activities as: instructional planning; gathering information (e.g., through formative
assessments (as defined in this notice), interim assessments (as defined in this notice),
summative assessments, and looking at student work and other student data); analyzing
information with the support of rapid-time (as defined in this notice) reporting; using this
information to inform decisions on appropriate next instructional steps; and evaluating
the effectiveness of the actions taken. Such systems promote collaborative problem-
solving and action planning; they may also integrate instructional data with student-level
data such as attendance, discipline, grades, credit accumulation, and student survey
19
results to provide early warning indicators of a student’s risk of educational failure”
(Florida Department of Education, n.d.).
Performance levels. For purposes of meeting state requirements for evaluation
systems, “performance levels means the summative ratings of performance over the
evaluation period based on accumulated evidence of proficiency in each of the criteria of
the evaluation system. There are four performance levels: highly effective; effective;
needs improvement, or, for teachers in the first three years of employment, developing;
and unsatisfactory” (Florida Department of Education, 2012).
Persistently lowest-achieving schools. As determined by the State: (i) Any Title
I school in improvement, corrective action, or restructuring that (a) Is among the lowest-
achieving five percent of Title I schools in improvement, corrective action, or
restructuring or the lowest-achieving five Title I schools in improvement, corrective
action, or restructuring in the State, whichever number of schools is greater; or (b) Is a
high school that has had a graduation rate as defined in 34 CFR 200.19(b) that is less than
60 percent over a number of years; and (ii) Any secondary school that is eligible for, but
does not receive, Title I funds that (a) Is among the lowest-achieving five percent of
secondary schools or the lowest-achieving five secondary schools in the State that are
eligible for, but do not receive, Title I funds, whichever number of schools is greater; or
(b) Is a high school that has had a graduation rate as defined in 34 CFR 200.19(b) that is
less than 60 percent over a number of years. To identify the lowest-achieving schools, a
State must take into account both (i) The academic achievement of the “all students”
group in a school in terms of proficiency on the State’s assessments under section
1111(b)(3) of the ESEA in reading/language arts and mathematics combined; and (ii) The

20
school’s lack of progress on those assessments over a number of years in the ‘all
students’ group” (Florida Department of Education, n.d.).
Professional Classification. For this study, participants self-reported their
classification as either instructional or administrative. An instructional position is one
that has no evaluation duties and can include academic and subject area coaches.
Student achievement. “(a) For tested grades and subjects: (1) a student’s score
on the State’s assessments under the ESEA; and, as appropriate, (2) other measures of
student learning, such as those described in paragraph (b) of this definition, provided they
are rigorous and comparable across classrooms. (b) For non-tested grades and subjects:
alternative measures of student learning and performance such as student scores on pre-
tests and end-of-course tests; student performance on English language proficiency
assessments; and other measures of student achievement that are rigorous and
comparable across classrooms” (Florida Department of Education, n.d.).
Student growth. “The change in student achievement (as defined in this notice)
for an individual student between two or more points in time. A State may also include
other measures that are rigorous and comparable across classrooms” (Florida Department
of Education, n.d.).
Student proficiency. Students that score a level 3 or higher in reading or
mathematics on the Florida Comprehensive Assessment Test in reading are considered
proficient (Florida Department of Education, 2012).

21
Conceptual Framework
Teacher Compensation and Evaluation
Teachers’ pay, unlike pay in other professions, is not necessarily tied to
performance. Buddin et al. (2007) wrote, “Traditionally, teachers have been paid using a
fixed salary schedule that takes into account years of experience and education—a system
that has come under frequent attack” (p. 1).
Often coupled with teacher pay is the concept informally known as tenure which
grants teachers property rights to their jobs after a fixed amount of time. Hess and
Maranto (2000) defined this in the following way:
Tenure, seniority-based pay scales, strict working conditions regulations, and
similar restrictions are a central part of the nation’s public school systems,
designed to protect teachers from the whims of their superiors and political
influence. In most school systems, once teachers serve two or three school years,
they are, within certain parameters, largely assured of lifetime employment (p.
51).
Alternatives, or reforms, to this seniority and degree-based compensation system exist
and will be described in the next section.
Reform Initiatives
Compensating teachers differently based on student performance and teacher
evaluations has been experimented with, but not often used by many school districts.
Goldhaber et al. (2008) found two possible reasons for the lack of consistent use. The

22
first possibility was that many believe teaching is not conducive for rewarding due to the
subjective nature of what constitutes performance. Another possibility is that there is too
much political cost as many teacher unions hold political power. Unions have been very
much opposed to the idea, and policy makers have not often been willing to risk the
political fall-out from supporting the idea (Goldhaber et al., 2008).
Much of the existing research conducted on performance pay scales takes place at
school district levels. State level policies are even more of a rarity. In fact, Florida had
been the only state to attempt state policies as recently as 2007 (Buddin et al., 2007).
Buddin et al. wrote,
Because Florida is the only state to implement a state-wide pay for performance
plan, it offers a unique opportunity to examine both theoretical and practical
issues related to design, implementation, and eventual impacts of such a system
on teacher performance, recruitment, retention, and distribution across different
types of schools and districts (pp. 2-3).
Odden (2000), argued that it was time to change salary schedules. His work with
the Teacher Compensation Group of the Consortium for Policy Research Education
(CPRE) at the University of Wisconsin-Madison resulted in recommendations that
changes should be made with care. Odden (2000) reported that his organization’s
research has moved “beyond the rhetorical criticism made by people who are
ideologically opposed to such programs, as well as beyond the notion that just dangling
any incentive in front of teachers will improve performance” (p. 366).
Teachers have often traded comparatively low pay for the job security that tenure
provides. However, tenure has been challenged along with the conventional pay scales as

23
protecting ineffective teachers. One example occurred when then Governor Barnes of
Georgia enacted the A+ Education Reform Act of 2000 that eliminated tenure throughout
that state. Grubbs (2005) found that Barnes did not justify his policy and that this
ultimately led to his defeat in the next election and the eventual restoration of tenure
throughout the state in 2004. Turning potential teacher evaluation and compensation
reform initiatives that cover large districts, regions, and states into policy has proven
difficult. There are many reasons these types of reforms have proven difficult.
Goldhaber (2010) wrote, “Still, major hurdles to implementing pay reforms remain,
including significant union opposition, the dynamic of local school district politics, and
the institutional inertia of public school systems” (pp. 2-3).
High-Poverty Schools
Studies and analyses have displayed the catastrophic effects of poverty on student
achievement (Berliner, 2006; Sirin, 2005). Sirin reported in his meta-analysis that the
definitions used in research of low-socioeconomic status or poverty can differ from study
to study. There is more to poverty than family income. There are neighborhood
characteristics, education level, and parents’ occupations, minority status, and location of
the schools (Sirin, 2005).
Within the U.S. Department of Education’s Planning and Evaluation Service
(2001), researchers also examined national level assessments in order to evaluate
progress of students from poverty. The researchers studied the National Assessment of
Educational Progress (NAEP) and reported that “In contrast to the recent state assessment
data, longer-term trends in NAEP scores depict widening achievement gap between high-

24
and low-poverty schools from the late 1980s to 1999” (p. 17). This achievement gap was
found to be the equivalent of several grade levels.
Economically disadvantaged students are defined by federal guidelines from the
Department of Agriculture. Free and reduced price lunches are given to students based
on the comparison of the household income and household size to the Federal Poverty
Guidelines. Those making an annual income of less than 30% more than the set Federal
Poverty Guidelines are eligible for free lunch, while those making an annual income of
31% to 85% more than the Federal Poverty Guidelines qualify for reduced price lunch
(U.S. Department of Agriculture, 2011).
According to Sirin (2005), “Socioeconomic status (SES) is probably the most
widely used contextual variable in education research” (p. 417). He reported that school
poverty rates are often calculated using the number of students on free/reduced price
lunch programs because it is easiest to obtain. Despite the availability and easy access,
“the use of participation in school lunch programs as a measure of SES, though common,
is conceptually problematic” (p. 444). It does not include information on the other
characteristics, such as parents’ occupation, neighborhood conditions, and physical
location of the school.
Although flawed, identifying poverty stricken or economically disadvantaged
students through the participation in free and reduced price school lunch programs has
been a practice that dates back to the original Title I found in the Elementary and
Secondary Education Act of 1965 (ESEA). Title I of the ESEA provided funding for
local and state education agencies for programs that would benefit students from
disadvantaged backgrounds. The ESEA has been reauthorized over the decades and so

25
has Title I. For a period, Title I became Chapter I. In the mid-1990s, it was reauthorized
in the Improving America’s Schools Act of 1994 as Title I and again in the No Child Left
Behind Act (NCLB) of 2001. Title I funding was also configured within the American
Recovery and Reinvestment Act (ARRA) of 2009. With these acts, the government
recognized a need for quality education as a life-line out of poverty for economically
disadvantaged students and their families.
Need for Student Achievement at High Poverty/Title I Schools
There are examples of teachers, schools, and school districts that have found ways
to beat the odds and record some impressive results in regards to the achievement of their
economically disadvantaged students (Borman, 2003). Economically disadvantaged
students do have a chance to close the achievement gap. Borman found examples of Title
I funds making a difference for economically disadvantaged students. “Whenever an
inner-city or poor rural school produces an exemplary program that helps their students
achieve notable results, Title I funding almost invariably made it possible” (p. 50).
Closing the achievement gap between affluent and economically disadvantaged students
is the clear goal of much of the reform movements and initiatives from legislative and
governmental agencies (Walsh & Tracy, 2004). In order to close the achievement gap,
one must improve the quality of instruction (Darling-Hammond, 2000; Wagner, 2005).
Student achievement has been positively correlated with the effectiveness of the
teacher- the more effective the teacher, the greater the student achievement. Sanders and
Rivers (1996) found in their study that teacher effectiveness was the factor with the
greatest impact on student achievement. The researchers also found that as teacher

26
effectiveness increases, the lowest achieving students gain the most. Unfortunately, the
impact of students having ineffective teachers can lead to years of struggle which can be
compounded over time (Sanders and Rivers).
Good teachers do make a difference. Darling-Hammond (2000) found both
quantitative and qualitative evidence that improvements in student achievement can be
related to policy investments in the quality of teachers. According to Darling-Hammond
(2000), advanced teacher preparation and rigorous certification were found to increase
student achievement in the subjects of reading and mathematics.
Research Questions
The following research questions were used to guide the study:
1. To what extent, if any, is there a relationship between the self-reported
knowledge of the RTTT grant and the perceived fairness of the RTTT grant
concerning teacher evaluation and compensation?
2. To what extent, if any, is there a difference between the two professional
classification groups’ opinions about the perceived potential impact of the
RTTT teacher evaluation and compensation components on student
achievement/growth?
3. To what extent, if any, is there a difference in the opinions of educational
leaders who have different self-reported school poverty percentages about the
perceived potential impact of RTTT teacher evaluation and compensation
components on student achievement/growth?

27
4. To what extent, if any, is there a difference in the opinions of educational
leaders who have different self-reported school poverty percentages about the
perceived potential impact of RTTT teacher evaluation and compensation
components on student achievement/growth at high-poverty schools?
Methodology
A mixed-methods study was conducted to analyze the professional opinions of
educational leaders in central Florida in regards to RTTT grant components regarding
ease of implementation and effectiveness on student achievement. An examination of
both descriptive statistics and inferential statistics was completed to define and describe
similarities and differences of opinions through the use of a researcher-created electronic
survey. A follow-up interview was conducted with selected survey participants which
generated qualitative data for further analysis.
Population and Sample
The population for this study consisted of educational leaders (instructional and
administrative) in central Florida. This population included teacher leaders as well as
school and district administrators. A sample made up of educational leaders pursuing
advanced degrees at a target university was selected to represent the population in this
study. The sample was comprised of 29 teacher leaders, 19 school administrators, and
six school district administrators.

28
Instrumentation
An electronic survey entitled Survey of the Potential Implementation and Impact
of Teacher Evaluation and Compensation Elements from the Race to the Top grant was
created by the researcher to determine professional opinions of educational leaders of
RTTT teacher evaluation and compensation components (Appendix A). Content validity
was determined by knowledgeable leadership professors at the target university. The
professors had an extensive understanding of the surveys and a comprehensive
knowledge of the RTTT grant. Reliability tests were conducted on different parts of the
instrument. School and district demographic data were gathered that included self-
reporting by participants of the free/reduced lunch percentages of their schools.
Participants’ professional and graduate program demographic data were also gathered.
Data Collection
Permission was sought from the target university’s professors to survey
educational leaders pursuing advanced degrees in Educational Leadership and Education
(Appendix B) and subsequently to the target university’s Institutional Review Board
(Appendix C). After obtaining informed consent (Appendix D), the survey was
electronically submitted to those educational leaders at the target university who
volunteered to participate in the study. A follow-up interview to gather qualitative data
was also conducted with selected survey participants that indicated that they would be
open to the interview. An interview protocol was developed by the researcher and
reviewed by knowledgeable university professors who determined content validity for the
protocol (Appendix E).

29
Data Analysis
Appropriate statistical analysis such as descriptive statistics and analysis of
variance were used to answer the research questions. Data were inputted into the
Statistical Package for Social Sciences (SPSS), and appropriate statistical tests were
completed to determine significance of the findings. Table 1 outlines the Research
Questions, the sources of data, and the statistical tests used in the analysis of each
question.
Delimitations
This study was restricted to examining the relationship of professional opinions of
educational doctoral students at the target university in regard to selected components of
the Race to the Top grant. Although the students included in the sample came from
several districts and institutions, most were employees at school districts and institutions
in the Central Florida area.
The selected components of the Race to the Top grant deal only with teacher
evaluation and compensation. This study was particularly focused on how these
components would affect student achievement at high-poverty schools.
In addition, the responses to the survey were gathered during the summer term of
2011. This was before the full implementation of RTTT and the components concerning
teacher evaluation and compensation.

30
Table 1
Research Questions, Data Sources, and Statistical Tests
Research Questions Data Sources Statistical Tests
1. To what extent, if any, is there a
relationship between the self-
reported knowledge of the RTTT
grant and the perceived fairness of
the RTTT grant concerning teacher
evaluation and compensation?
Survey items from
Part B of Survey
Pearson Product-Moment
Correlation
Independent variable: self-
reported knowledge score
Dependent variable:
perceived fairness score
2. To what extent, if any, is there a
difference between the two
professional classification groups’
opinions about the perceived
potential impact of the RTTT teacher
evaluation and compensation
components on student
achievement/growth?
Survey items from
Part C of Survey
and reported
classification from
Part A
Independent samples t-tests
Independent variable:
reported professional
classification
Dependent variable:
perceived potential impact
score
3. To what extent, if any, is there a
difference in the opinions of
educational leaders who have
different self-reported school poverty
percentages about the perceived
potential impact of RTTT teacher
evaluation and compensation
components on student
achievement/growth?
Survey items from
Part C of Survey
and reported
poverty
percentage from
Part A
One-way analysis of
variance (ANOVA)
Independent variable: self-
reported school poverty
percentage
Dependent variable:
perceived potential impact
total score
4. To what extent, if any, is there a
difference in the opinions of
educational leaders who have
different self-reported school poverty
percentages about the perceived
potential impact of RTTT teacher
evaluation and compensation
components on student
achievement/growth at high-poverty
schools?
Survey Items from
Part D of Survey
and Reported
Poverty
Percentage from
Part A
One-way analysis of
variance (ANOVA)
Independent variable: self-
reported school poverty
percentage
Dependent variable:
perceived potential impact
on high poverty schools
total score

31
Significance of the Study
By conducting this study, it was the researcher’s intent to add to the field of
knowledge on teacher evaluation and compensation. The research was specifically
focused on reforms initiated by the U.S. Department of Education and their potential
effect on the student achievement of students at all schools and in particular, high-poverty
schools. At the time of this study, the components selected by the researcher were under
development in Florida districts. Knowledge found through exploring the professional
opinions of educational leaders concerning RTTT components could aid in the future
development of the technical aspects of the implementation of the components.
Summary
This study was conducted to add to the field of knowledge that exists for policy-
making practices for improving student achievement and students in poverty. Studying
the professional opinions of educational leaders (instructional and administrative) on
RTTT teacher evaluation and compensation components can then lead to
recommendations for policy-makers for future implementations.
An overview of the problem and its clarifying components has been presented in
this chapter. The purpose of the study, the conceptual framework, the population and
sample and the methodology have been introduced. Also discussed were data collection
and analysis procedures, limitations and delimitations, and significance of the study.
Chapter 2 contains a review of the literature and research related to the problem. Chapter
3 details the methods and procedures used in conducting the study. The results are

32
presented in Chapter 4. Concluding the dissertation is Chapter 5 in which implications
and recommendations for practice and future research are offered.
33
CHAPTER 2
REVIEW OF LITERATURE
Introduction
Accountability measures of the last decade have put an emphasis on increasing
student achievement for all students. For decades, educational researchers have studied
factors that impact student achievement such as socioeconomics, school climate, student
engagement, and teacher effectiveness (Berliner, 2006; Borman, 2003; Caldas &
Bankston, 1997; Darling-Hammond, 2000; Fullan, 2006; Lane, Behrstock-Sheratt &
Lasagna, 2011; Marzano, Frontier, & Livingston, 2011; National Commission on
Excellence in Education, 1983; Office of Education, 1969; Sanders & Rivers, 1996).
Federal reform measures have resulted in actions increasing student achievement in
different ways. Federal reforms ranged from Title I of the Elementary and Secondary
Education Act of 1965 which increased funding for schools with larger numbers of
economically disadvantaged students, to the No Child Left Behind (NCLB) legislation.
NCLB required schools to show “adequate yearly progress” in increasing the percentages
of all groups of students at proficiency on a year-to-year to basis. The most recent
initiative, Race to the Top (RTTT), was a federal grant that was part of the American
Recovery and Reinvestment Act of 2009 (H.R. 111th
Congress, 2009) that required states
to apply to receive funding to put into effect common core standards and teacher
evaluation and compensation changes that utilize student achievement as a primary
factor. Other changes to teacher evaluation and compensation have been implemented in
varying degrees.
34
In this chapter, a foundation for studying the professional opinions of professional
educators on the teacher evaluation and compensation components of the RTTT grant
will be presented. Since a significant portion of the grant was intended to impact the way
in which teachers are evaluated and compensated, this study was conducted to add to the
body of research on how teacher evaluation and compensation reforms impact student
achievement of all students by examining the opinions of educational leaders. It is the
educational leaders, both administrative and instructional, who have been charged with
implementing the components of the RTTT grant.
This review of literature includes relevant and pertinent information regarding the
improvement of student achievement, the major federal reforms to public school
education, and, finally, teacher evaluation and compensation. Teacher evaluation and
compensation history and purposes were examined along with recent reform components
studied and discussed in the literature. Empirical research, journal articles, dissertations,
government reports, foundation reports and other contemporary and relevant literature
were sought and found through online searches of databases and research at a university
library. The research was noted as empirical and non-empirical literature and organized
into sections based upon content. More specifically, this review of literature has been
organized into three major sections: (a) improving student achievement, (b) major
federal reforms to public education, and (c) teacher evaluation and compensation.
Improving Student Achievement
Student achievement, and the measure of student achievement, has been the focus
of many reform policies in education. Since 1983, when A Nation at Risk: The

35
Imperative for Education Reform (National Commission on Excellence in Education,
1983) was published, the education profession in the United States has been in the
business of getting students to not just learn but achieve in order to fight “the rising tide
of mediocrity” (p. 1).
Achievement has generally been defined as that which educators are held
accountable in terms of accomplishment. Because of this, it is important to note the
difference between accountability and the assessment of students. The Rennie Center
(2008) spelled out the difference: “Assessments such as statewide standardized tests are
often considered to be synonymous with accountability systems. While student
assessments are part of most accountability systems, they are only one component in a
comprehensive system” (p. 2).
This section of the review of literature was used to establish a basis for further
investigation of improvement of student achievement through compensation and
evaluation reform. Literature related to educational achievement for low socioeconomic
students and the improvement of teacher quality was reviewed.
Achievement and Socioeconomic Status
In reviewing the literature, it was evident that researchers have documented the
connection between poverty and student achievement. Sirin (2005), in his review of the
impact of socioeconomic status (SES), reported the effects of low SES on student
achievement:
As the main finding of this review shows, school success is greatly influenced by
students’ family SES. This finding indicates that our society may be failing in

36
one of the greatest commitments of every modern society, that is the
responsibility to provide educational opportunities for each student regardless of
social and economic background. Unfortunately, many poor students come to
schools without the social and economic benefits held by many middle- to high-
SES students (p. 445).
For educators, poverty is difficult opponent to overcome. Okpala’s (2002)
research of public schools was to find the factors that were most prominent in the
achievement outcomes of students. The researcher looked at many factors including, but
not limited to, the educational level of teachers, teaching experience of the staff, and
school spending. The results can be summed up as follows:
The results from this paper do show that some of the major factors that are
theoretically under the control of a school, such as educational level and teaching
experience of staff, and school spending , have little if anything to do with student
performance. Family socioeconomic factors prevailing in schools appear to
contribute significantly to students’ achievement. (Okpala, 2002, p. 907)
Schools that have higher percentages of economically disadvantaged lunch
students can be classified and protected under Title I of the Elementary and Secondary
Education Act which was reauthorized in 1994. Research on Title I has yielded insight
into the state of student achievement for students with low socioeconomic status and will
be discussed further in a later section in this review.
In January of 2001, the Department of Education Planning and Evaluation Service
released “High Standards for All Students: A Report from the National Assessment of
Title I on Progress and Challenges since the 1994 Reauthorization.” Researchers

37
conducting this study considered, among other things, both state and national trends of
students who attended high-poverty schools. They found contradictions in state reported
data and student performance nationally. At the time of that study, only nine states were
able to show trend data for their state assessments. From these assessments, the
researchers concluded, “Three-year trends reported by nine states show progress in the
percentage of students in the highest-poverty schools meeting state standards for
proficiency in reading and mathematics” (U.S. Department of Education Planning and
Evaluation Service, 2001, p. 15).
The researchers then looked at national level assessments in order to evaluate
progress of Title I students. Results from the National Assessment of Educational
Progress (NAEP) showed that “In contrast to the recent state assessment data, longer-
term trends in NAEP scores depict widening achievement gap between high- and low-
poverty schools from the late 1980’s to 1999” (p. 17). This achievement gap was found
to be the equivalent of several grade levels.
This contradiction on the achievement of students in poverty revealed the
following inconsistent findings and raised concerns about the use of data from multiple
sources:
Student achievement on national tests (NAEP) has shown little academic progress
for children in high-poverty schools. Student scores have remained flat in reading
but are slightly improved in mathematics. In addition, the increased gap between
students in high- and low-poverty schools is troubling. These findings are
perplexing in that states are reporting significantly more progress in student
achievement as measured by state assessments. These inconsistent findings raise

38
questions about the rigor of the content and performance standards and
assessments that states have adopted. Perhaps an independent body such as the
National Academy of Sciences should examine how we can best interpret these
data from multiple sources (Department of Education Planning and Evaluation
Service, 2001, p. 52).
In 2006, the Thomas B. Fordham Foundation examined the results of the NAEP.
Each state was considered in this report for student achievement, achievement trends, and
reform efforts. Although each state was studied separately, national trends and anomalies
were found. It was found that, overall, not much progress had been made with
historically disadvantaged students, i.e., those who live in high-poverty situations. The
following is an excerpt from the 2006 Fordham report:
No state made ‘widespread’ progress over the past decade and a half, but 31 states
have made some progress and eight- California, Delaware, Florida,
Massachusetts, New Jersey, and New York, Texas, and Washington- showed
moderate gains during that time for poor and minority students. Their diversity is
striking: big and small, urban and rural, red and blue, and geographically
dispersed. Seventeen states made limited progress and another six states made
minimal progress. However, thirteen states made no significant progress with
these populations. Five of them- Illinois, Iowa, Nebraska, Oklahoma, and
Wisconsin- are also found in the bottom half of achievement rankings, meaning
that their lack of progress is all the more disappointing (p. 14).
Other factors that have generally been regarded by researchers to have an effect
on student achievement have proven to be related to the combined elements of being
39
economically disadvantaged. Wright (1999) examined student mobility. Mobility was
initially found to affect more negatively students who moved in district or region than
those who moved out of region or state. A comparison of mobility with the lunch
program found that “no mobility or mobility into or out of the district was associated with
higher economic status, whereas mobility within the district was associated with lower
economic status” (Wright, 1999, p. 350).
It appeared that mobility was not as significant a factor in student achievement as
was SES. Wright (1999) explained this in discussing the results of his study:
The results also provide an explanation for the somewhat counterintuitive
observation that lower achievement often precedes mobility rather than following
it; lower achievement is associated with other more powerful predictors than
temporal mobility. Students who are likely to become mobile, especially within
the school district, do show preexisting achievement deficits. Location mobility,
although a significant predictor of achievement, is confounded with other,
stronger predictors and adds little incremental power to prediction. The broad
conclusion that may be drawn from the results is that student mobility is
subordinate in its effects on achievement to the risk factors for ethnic minority
status and low family income (p. 351).
Other researchers have also conducted studies on how other factors associated
with being economically disadvantaged impacted student achievement. For example,
Caldas and Bankston (1997) investigated how student SES makeup of the entire school
impacted the achievement of students in poverty. These researchers posed a question as
to whether it matters if a poor student attends a school with many other poor students or a

40
school with many students who have family backgrounds of higher socioeconomic status.
Their results suggested:
. . .that if a young person is from a disadvantaged socioeconomic background, has
parents with low social status, and belongs to a minority race, then diversity
would be an advantage. The students would benefit from the resources that the
more advantaged students would bring to the social context of the school. On the
other hand, our findings indicate that if a young person comes from a relatively
privileged background, then diversity could be a disadvantage, at least in terms of
academic achievement. The issue, in other words, may not be one so much of
diversity versus homogeneity, but rather of the contributions of student
backgrounds to a social environment that exists independently of any individual
student background (p. 275).
There is little doubt that student poverty affects student achievement and success
at school. Berliner (2006) compared poverty to the “600-pound gorilla in the room” that
is being ignored by many of the reform movements but is seriously affecting American
education. In his analysis, Berliner (2006) found the data from studies to support five
points about poverty and student achievement which have been paraphrased as follows:
1. Poverty in the United States is greater and of longer duration than in other rich
nations.
2. Poverty, especially among minorities from urban areas, can be associated with
academic performance well below international means on many assessments.
3. Poverty restricts the amount that genetic talent can be used to overcome
disadvantages and achieve academically.

41
4. Poverty increases the effect of health problems on students which affects life
chances and achievement.
5. Reductions, even small reductions, in family poverty lead to better academic
achievement for students.
Berliner believed that his research has clarified the next steps for educators. He
indicated that there is a need for schools to strive for better teachers and curriculum and
that communities should also be held accountable for helping families reduce poverty.
“Reducing poverty to improve schooling is evidenced based. . . ” (Berliner, 2006, p. 986).
His research findings suggest that there should be a two-sided system of
accountability.
The obligation that we educators have accepted to be accountable to our
communities must become reciprocal. Our communities must also be accountable
to those of us who work in the schools, and they can do this by creating social
conditions for our nation that allow us to do our jobs well. Accountability is a
two-way process; it requires a principal and an agent. For too long schools have
thought of themselves only as agents who must meet the demands of the principal,
often the local community, state, or federal government. It is time for principals
(and other school leaders) to become principals. That is, school people need to
see communities as agents as well as principals and hold communities to
standards that ensure all our children are accorded the opportunities necessary for
growing well (Berliner, 2006, p. 988).
To find the types of instruction that work best with high-poverty students,
researchers have compared the practices of teachers of both low SES and higher SES

42
schools. Ralph, Frase, Crouse and Thompson (1998) used data from the National Center
for Educational Statistics to analyze the achievement of top and bottom schools.
If the top schools have higher achievement than the bottom schools only because
they have more privileged educational and economic inputs, and not because the
top schools are “better” than the bottom ones, then the wide achievement
differences between top and bottom schools reflect educational and economic
differences in students’ backgrounds even before the end of the first grade. (p. 2)
Solomon, Battistich, and Hom (1996) studied the attitudes, beliefs, perceptions,
and classroom practices of teachers in both settings. In their study of 24 urban and
suburban elementary schools, they found that “students in poor communities generally
receive less engaging kinds of education (such as cooperative learning) and that teachers
in such schools see the school climate as less positive and stimulating and themselves as
having less influence” (p. 340). Essentially, students in low SES schools were lacking in
the type of instruction that would benefit them the most.
Strong instruction and the right sequence of good teachers is the best chance
students in high-poverty situations have of achieving. Rivkin, Hanushek, and Kain
(2005) conducted extensive empirical research of the Texas data system to determine
correlations between teacher effectiveness and student achievement. They summarized
their results in the following way: “The results revealed large differences among teachers
in their impacts on achievement and show that high quality instruction throughout
primary school could substantially offset disadvantages associated with low
socioeconomic background” (p. 419). Understanding the importance of high quality
instruction, it was important to consider in the following section of the literature review

43
the literature on teacher quality and the factors that lead to instructional excellence in the
classroom.
Teacher Quality
It has generally been assumed that teachers can make a difference in the lives of
individual students. Laine, Behrstock-Sherratt, and Lasagna (2011) wrote that, “There is
consensus among researchers and education leaders at every level of the education
system that teachers are the most important school-level factor affecting student
achievement” (p. 3). Goldhaber (2010) wrote, “Education research convincingly shows
that teacher quality is the most important schooling factor influencing student
achievement” (p. 1).
Study has been done on the types of characteristics teachers possess that make
them successful in influencing student achievement. Swanson-Gehrke (2005) reviewed
research on successful teachers and reported that there were three characteristics that
these teachers had in common that appeared to relate to being successful with all students
including those of low socioeconomic status. According to Swanson-Gehrke (2005),
“These characteristics are: knowing themselves, knowing the environment in which they
teach, and maintaining high expectations” (p. 15).
In their report, Walsh and Tracy (2004) empirically researched attributes that
could affect teacher quality to help inform better policies. These authors looked at seven
components: master’s degrees, experience, education courses, traditional certification,
teacher’s race, subject area knowledge, teacher’s level of literacy, selectivity of college,
and soft attributes. Of those attributes, the ones that were found to have the most impact

44
on teacher effectiveness were (a) subject area knowledge, (b) level of the teacher’s
literacy, (c) college selectivity, and (d) soft attributes. Soft attributes are explained as the
intangibles needed like work ethic, determination, and perseverance. Advanced degrees,
education courses, and traditional certification were not determined to be advantageous,
and teachers’ years of experience made a difference only in the first few years.
Traditional certification and coursework as attributes that affect student
achievement have also been found to have little to no impact (Walsh & Tracy, 2004;
Rivkin et al., 2005). Walsh and Tracy elaborated: “Although tests and transcripts offer
useful tools with which to begin a careful consideration of a candidate, none of these
tools will ever outweigh the critical but largely subjective judgments that can only be
formed at a personal level” (p. 11).
The intangibles that define a good teacher are often difficult to identify on
resumes and, therefore, make human resource practices from hiring through retirement of
teachers all the more important. “Rather the substantial differences in quality among
those with similar observable backgrounds highlight the importance of effective hiring,
firing, mentoring, and promotion practices” (Rivkin et al., 2005, p. 450).
Qualities of negative or ineffective teachers have also been studied. Collins
(2001), found five qualities of the low-performing teacher. Those qualities included (a)
poor quality of instruction of students, (b) lack of content knowledge, (c) poor classroom
management, (d) lack of caring for the students, and (e) poor organization and planning.
Poor performing teachers can have a consequential effect on students of all levels.
That is why, according to Rivkin et al., (2005),

45
It is clear that school policy can be an important tool for raising the achievement
of low income students and that a succession of good teachers could, by our
estimates, go a long way toward closing existing achievement gaps across income
groups. (p. 449)
Sanders and Rivers (1996), in their statistical analysis, found effective teachers
benefit those students who struggle the most to achieve. “As the teacher effectiveness
quintile increased, lower achieving students were first to benefit, followed by average
students and, lastly, by students considerably above average” (p. 7).
Quality instruction and teacher quality will continue to be a part of the discussion
on how to improve schools. There are some advocates who believe the better the human
resource policies, the better the chance becomes of improving the quality of instruction.
“Not only would improved personnel policies likely raise the performance level of
existing teachers, there is strong reason to believe that a closer link between rewards and
performance would improve the stock of teachers” (Rivkin et al., 2005, p. 451).
The literature regarding some of the major federal reforms to education and an
examination of literature concerning teacher evaluation and compensation practices may
provide further insight into whether the types of policies mandated in the RTTT grant can
affect teacher quality and help bolster student achievement. Laine et al. (2011)
summarized the debate on teacher quality,
It appears, then, that teacher quality may remain at the forefront of ongoing
national policy conversations not because education leaders have been unable to
pinpoint a solution, but because they identified too many uncoordinated solutions,
each with the most passionate of advocates backing it as the most important

46
solution. The result is a confused and incoherent policy agenda, along with
conflict at the expense of collaboration in moving teacher quality policies; hence
the quality of education that children receive suffers (pp. 6-7).
Table 2 presents a summary of the literature reviewed related to the improvement
of student achievement. The table contains a summary of the literature related to each of
the subsections and the related authors and researchers.
Table 2
Summary of Literature Reviewed: Improving Student Achievement
Subsection Summary of Findings Authors
Achievement and Socioeconomic Status.
Socioeconomics plays a strong role in student
achievement. However, high quality instruction
and teachers can make an impact on the
achievement of economically disadvantaged
students.
Sirin (2005); Okpala (2002); U.S. Department
of Education Planning and Evaluation Service
(2001); Fordham Foundation (2006); Wright
(1999); Caldas & Bankston (1997); Berliner
(2006); Solomon, Battistich, & Hom (1996);
Rivkin, Hanushek, & Kain (2005)
Teacher Quality. Teacher quality impacts
student achievement. Certification and years of
experience beyond three do not make a
difference in teacher quality. Policies on
improving teacher quality are needed.
Goldhaber (2010); Walsh & Tracy (2004);
Rivkin et al. (2005); Sanders and Rivers
(1996); Laine et al. (2011);
Major Federal Reforms to Public Education
Race to the Top (RTTP) is the latest in a series of educational reform initiatives
that have been implemented from the federal level in order to improve student
achievement for all students. It represents a three-part shift in the reform policies of the

47
federal government: (a) aid and financial assistance, (b) sanctions and penalties, and (c)
competition for financial assistance to the states.
In reviewing the literature concerning both Title I and No Child Left Behind
initiatives, one learns that federal reform initiatives have had mixed results in making a
difference in student achievement. This section of the review has been structured to start
with information about the earliest of these federal reform initiatives- Title I, then
progress to provide information concerning the No Child Left Behind act and conclude
with the most recent federal reform initiative, the Race to the Top grant.
Title I
The Elementary and Secondary Education Act of 1965 (ESEA) was a first step in
providing federal funding or financial assistance to states from the national level for the
purposes of increasing the student achievement of all students and, in particular, students
with low socioeconomic status. As stated by Murray and Murray (2007), the ESEA was
noteworthy in that this represents the first time the federal government provided
direct funding to the states to support educational programs for certain defined
groups of children. The purpose of the act was to ensure that improved
educational services were available for disadvantaged students including some
students with disabilities. (p. 167)
Title I of the ESEA provided funding for local and state education agencies for
programs that would benefit students from disadvantaged backgrounds including those
students from poverty-stricken homes. The ESEA has been reauthorized over the
decades, and so has Title I. For a period, Title I became Chapter I. In the early 1990s, it

48
was reauthorized in the Improving America’s Schools Act of 1994 as Title I and again in
the No Child Left Behind Act (NCLB) of 2001. Title I funding was also made a piece of
the American Recovery and Reinvestment Act (ARRA) of 2009.
According to the U.S. Department of Education Funding (2009), Title I Part A of
the ESEA distributed $656,225,294 to local educational agencies (LEA) in Florida for the
fiscal year of 2008. The same source lists a grand total of $1,014,802,213 of authorized
funds that include the Title I Part A allocation grants of $656,225,294 and other,
additional grants that were up for application for programs such as: (a) School
Improvement, (b) Title I Early Childhood grants, (c) Reading First grants, (d) Even Start,
and (e) State Agency Programs. Almost $400 million was up to individual LEA
application in 2008.
Further examination of U.S. Department of Education Funding (2009) state
funding tables showed that in addition to the $14 billion dollars assigned nationally for
distribution through Title I for the fiscal 2009 year, the ARRA also included an additional
$10 billion for distribution. In Florida, the expected initial allocation was for
$674,793,892 allocated using the standard allocation formula for Title I plus an additional
$490,575,352 from the ARRA. The grand totals for the Title I contribution were close to
$1.7 billion in funds for Florida with over $400 million available for individual LEA
application for special programs such as those listed above.
With these large amounts of federal dollars used for educational funding, the
effectiveness of Title I programs have been the subject of many broad-based federal and
academic studies over the years. A 1969 report by the then U.S. Office of Education was
conducted on the history of Title I programs. Programs were found to have a positive

49
impact. However, it was reported that Title I programs needed to be planned and
carefully designed in order to achieve the greatest impact on the children that need the
most help.
Kiesling (1972) investigated how Title I funds affected the reading gains of
students on the Stanford Reading test. He found evidence to support the claim that the
amount of instruction given by trained reading specialists contributed to gains on the
standardized test. Kiesling also found evidence that additional planning time and
additional personnel were related to student gains. Kiesling (1972) followed up the initial
report with continued evidence to support that increasing the number of trained personnel
and instructional time at schools can increase the reading achievement of students in Title
I schools.
The earlier investigations of Title I effectiveness revolved around cost analysis.
After the 1994 Improving America’s Schools Act, the focus of Title I effectiveness
shifted toward the following of procedures and the development or adjustments of state
standards. Wang, Wong, and Kim (1999a, 1999b), noted in their series of reports on
Title I programs that the new law had developed a new trend called procedural
accountability. Federal governments and state governments were now focused on
making sure students were meeting a set of criteria.
Anderson and Welsh (2000) took this shift one step further by researching state
administrators who were responsible for federal funds. They wanted to determine if state
administrators had developed new procedures for distributing funds to LEAs and if their
actions and state guidelines for distributing funds changed due to the new focus on
standards. These researchers found that the collective group was not fully ready to

50
embrace the standards. There was evidence found, however, to support a movement
towards standards-based, data-driven reform by the state administrators (Anderson &
Welsh, 2000).
More recently, a shift in Title I effectiveness studies has coincided with the
NCLB’s emphasis on holding schools accountable for the performance of all groups of
students. Borman (2003) provided examples of Title I schools making a difference for
students in poverty and narrowing the achievement gap and explained, “Whenever an
inner-city or poor rural school produces an exemplary program that helps their students
achieve notable results, Title I funding almost invariably made it possible” (p. 50).
Borman (2003) discerned that four elements were critical for Title I to make a
difference. Those elements were (a) early intervention by starting students off to school
earlier, (b) extending school learning into the summer, (c) accelerating school-year
learning by decreasing class size, and (d) revitalizing the school with comprehensive or
whole-school reform models.
The National Center for Educational Evaluation and Regional Assistance (2007)
released a report on its assessment of Title I since the reauthorization from NCLB. In
this report, several significant findings were cited. Over the past decade, the number of
students participating in Title I programs tripled to 20 million participants. Title I at the
time of this report accounted for $12.8 billion in funding. Most of these funds were used
to support instruction such as additional staffing. A total of 27% of the funds were
utilized for other instructional supports and program administration.
51
No Child Left Behind
The No Child Left Behind Act of 2001 (NCLB) represented a shift in federal
educational policy reforms. Schools were mandated to meet student achievement
requirements for all groups of students or face penalties and sanctions that could have
resulted in the loss of funding.
The No Child Left Behind Act (NCLB). . . continues to expand the role of the
federal government in the education of all students. All students, including
students with disabilities, are included within the requirements of NCLB. NCLB
requirements affect every public school in America. The primary purpose of the
act is to ensure that every public school student achieve proficiency on identified
academic standards and to close achievement gaps that exist between various sub-
groups of students. Further, all students are to be educated in safe learning
environments by well-qualified teachers (Murray & Murray, 2007, pp. 170-171).
With annual measurable objectives (AMOs), states were required to show that
schools were meeting adequate yearly progress (AYP). Schools that met those goals
were either rewarded depending on the states or, at least, not penalized. Schools that did
not make those objectives, however, were given many different sanctions which may
have resulted in the loss of some funding.
NCLB also had a provision that attempted to address teacher quality, by
controlling the quality of those entering the teaching profession.
In 2001, a minimum standard for what constituted a “highly qualified teacher”
was established through the No Child Left Behind Act. According to this
legislation, all teachers hired had to meet the minimum standards set forth in the

52
law: hold a bachelor’s degree, have full state certification and demonstrate
knowledge of the content they would be teaching. (Education Commission of the
States, 2007, p. 1)
Race to the Top (RTTT)
A new shift in federal educational reform policy occurred with the passage of the
American Recovery and Reinvestment Act (ARRA). “Included within the ARRA's
nearly $800 billion in spending was the largest competitive grant program in U.S.
Department of Education history, the $4.35 billion Race to the Top” (Smarick, 2011, p.
60).
RTTT can be considered a major shift away from many of the policies of the last
decade. “In many ways, RTT is an attempt to circumvent the perceived failings of No
Child Left Behind (NCLB) and in particular the law’s reliance on coercive federal
mandates and the compliance culture it fostered at the state level” (McGuinn, 2010a, p.
2).
Phase one of RTTT concluded with Tennessee and Delaware declared the winners
in March of 2010. “In July, eighteen states along with D.C. were chosen as round-two
finalists, and in August ten states were announced as winners: Florida, Georgia, Hawaii,
Maryland, Massachusetts, New York, North Carolina, Ohio, and Rhode Island, along
with Washington, D.C.” (McGuinn, 2010a, p.5).
McGuinn (2010a) agreed that
While the Elementary and Secondary Education Act (ESEA) and other traditional
federal formula grant programs direct funds on the basis of demographics or
53
educational need without regard to reform or achievement, RTT supports only
those states that have strong track records and plans for innovation and can
demonstrate key stakeholder commitment to reform. (p. 1)
RTTT also provided states in need of additional funding for education some
“cover” for policies and reforms that may not have been able to navigate through the
politics involved. According to McGuinn (2010a), “The program is fundamentally about
two things: creating political cover for state education reformers to innovate and helping
states construct the administrative capacity to implement these innovations effectively”
(p. 1).
In some ways, RTTT has spurred changes to teacher evaluation and compensation
by providing political cover to those states wishing to enact major reforms. However,
Teacher evaluation thus demonstrates both the potential and the limitations of
using a competitive grant program to drive state reform. Even on an issue that
was widely seen as in need of major overhaul—and received both the most points
in the competition and probably the greatest media coverage—RTT was unable to
push the majority of states to enact reform. (McGuinn, 2010a, p. 11)
McGuinn continued,
The Obama administration is, most significantly, leveraging the $4.4
billion “Race to the Top” Fund to spur improvements in state teacher data
collection and evaluation systems teacher effectiveness policies constitute the
single biggest category of possible points, or 28 percent, in the competitive grant
process. (McGuinn, 2010b, p. 28)

54
The strategy on increasing teacher quality also represents a change from past
policies. “RTT also contains a significant shift in focus from “highly qualified” to
“highly effective” teachers in federal education policy and proposes the first-ever federal
definition of teacher effectiveness” (McGuinn, 2010b, p. 28.)
Smarick (2011) reported on RTTT’s focus on teacher evaluation and
compensation:
It asks states to measure student growth and to tie these results to individual
teachers. It also asks states to develop annual teacher evaluations and include
student growth as a component of each teacher's official assessment. Finally, it
asks them to use these evaluations to inform a number of personnel decisions,
such as tenure, removal, and compensation. (p. 61)
The granting of Title I funds to states and LEAs has been the most influential
method that the Federal government has had in affecting school policies and reforms.
The intention of RTTT was to encourage changes and reforms not through mandates but
by creating motivation to receive funding for creating the opportunity for reforms (Kolbe
& King Rice, 2012; Smarick, 2011).
The winning states’ plans were diverse in many ways starting with the amount of
money that each winner received.
In the end, across two rounds of competition, 11 states and the District of
Columbia were awarded federal RTT grants ranging between US$75 and US$700
million. Over a 4-year period, awardees will spend US$4.35 billion in federal
funds on reform initiatives outlined in their grant proposals (Kolbe & Rice King,
2012, p. 191).

55
Nicholson-Crotty and Staley (2012) found that states applied for political
motivations as opposed to monetary need or improvement of student achievement.
States that needed the money most, either because they were not producing high
performing kids or because they struggled to fund education, were not
consistently more likely to seek and secure federal funding. This raises the
possibility that the states where a competitive grant for education reform might do
the most good are not necessarily the ones that will receive money from that
program (Nicholson-Crotty & Staley, 2012, p. 181).
Nicolson-Crotty and Staley (2012) further concluded that states with weaker
teacher unions were more likely to receive the aid from RTTT, meaning those states with
the weaker unions were more likely ready and willing to make reforms. They stated, in
this regard: “Instead, our results suggest that the money will flow to states where
constituents have high demand for education and where teachers’ unions are weak” (p.
181).
Kolbe and King Rice (2012) completed a study that analyzed the applications of
the states that were awarded Race to the Top funds in both Phase 1 and Phase 2 to
determine how the money was being spent.
Looking across states, projects related to ‘improving teacher and principal
effectiveness based on performance’ were a top priority for investing RTT grant
funds. In three states—Georgia, New York, and Rhode Island—about one quarter
of all state-level spending from the federal RTT grant will be dedicated to
establishing approaches to measuring student growth, designing and
implementing new teacher and principal evaluation systems, reforming teacher

56
compensation systems, and using teacher evaluations to inform teacher retention,
promotion, and retention decisions (pp. 196-197).
The RTTT grant funds have been judged to be of great importance in building the
capacity to sustain a reformed teacher evaluation and compensation fund.
To some extent states’ relative emphasis on improving teacher and leader
evaluation systems, which is at the heart of the federal approach to improving
teacher and leader effectiveness, makes sense. For most states, establishing such
systems is a new priority that will require considerable investment of new
resources to build the capacity necessary to implement these reforms (Kolbe &
King Rice, 2012, p. 198).
Compensation reforms varied across the winning states as did the budgeted
amounts to make these reforms happen using RTTT funds. Many of the projects for
RTTT were to be paid for with the RTTT awards.
Teacher compensation reforms, however, pose an important exception. Some
state plans include new initiatives for teacher performance pay as well as
recruitment and retention bonuses for teachers in difficult-to-staff schools and
subject areas. Such reforms will require a sustained and, in some cases, sizable
financial commitment on the part of states and localities post-RTT (Kolbe & King
Rice, 2012, p. 204).
All in all, RTTT included many items that will require a lot of work and revenue long
after the grant awards have been spent, and much of the burden will fall to local school
districts to maintain.

57
RTT grantees will make sizable investments in developing and implementing new
standards and assessments, longitudinal data systems, teacher evaluation systems
and professional development, and turning around struggling schools. But if RTT
succeeds, states and localities will be left with a new education program and
infrastructure that will require an ongoing maintenance of effort on their parts
(Kolbe & King Rice, 2012, p. 207).
Florida’s Race to the Top
Florida’s RTTT plans include significant differences from those of the other
winning states. Florida’s grant application, for example, suggests that 18 FTE (full-time
equivalent) employees will be employed by the state to implement and administer its
RTTT grant. However, the application also suggests that “the state will largely rely on
independent contractors to assist with implementing its reform plans” (Kolbe & King
Rice, 2012, p. 201).
Florida’s plans on compensation emphasized a shift for the entire state. “Notably,
Florida required all LEAs (local educational agencies) participating in the state's
application to make student achievement growth the most significant component of
compensation, ahead of years of experience and academic degrees” (Smarick, 2011, p.
62). This difference probably highlights why political and union support from the state
of Florida has been extremely low. “In Florida and Arizona, 8 and 21 percent of local
teachers unions’, respectively, supported the state's plan” (Smarick, 2011, p. 63).
Aside from teacher evaluation and compensation, Florida expressed its intent to
utilize a large portion of its funds for standards and assessments. This may be explained

58
by the significant emphasis placed on utilizing student achievement as a large percentage
of teacher evaluations.
Florida allocated a substantially larger share of its state-level RTT budget to
improving the state’s standards and assessments. The state plans to spend nearly
US$82 million to develop and implement new formative assessments in reading
and math and interim assessments in all core content areas (and Spanish) to
support instruction and measure student and teacher progress in all Florida
schools. Another US $46 million was budgeted for developing new curricular
tools to implement the Common Core, including a new Instructional Tools
database and a textbook demand study of common core and science textbooks.
(Kolbe & King Rice, 2012, pp. 198-199)
McGuinn (2012) concluded his report on RTTT with this warning,
However, we should remain realistic in our expectations of what RTTT can
accomplish; although the program’s approach may be different from that of
earlier federal education programs, many of the political and institutional
obstacles to sustaining meaningful reform at the federal and state levels remain
largely the same (p. 153).
Table 3 presents a summary of the literature reviewed related to major federal
reforms to public education. Included are the titles of major legislation, a summary of
important facts regarding the legislation and major authors and researchers associated
with the literature.

59
Table 3
Summary of Literature Reviewed: Major Federal Reforms to Public Education
Subsection Summary of Findings Authors
Title I. Title I studies initially focused on cost analysis then
transitioned to procedural accountability in the 1990’s. More recently,
the shift has moved towards studying the impact of Title I on student
achievement. Some improvement has been found in the literature, but
there is still much to be done in bridging the gap between the
economically disadvantaged and their peers.
Murray & Murray (2007); U.S. Department of Education Funding
(2009); U.S. Office of Education (1969); Kiesling (1972); Wang,
Wong, & Kim (1999a/b); Anderson Welsh (2000); Borman (2003);
National Center for Educational Evaluation and Regional Assistance
(2007);
No Child Left Behind. Overlap in the studies between Title I and
NCLB; NCLB’s provision on teacher quality was to mandate that
teachers teaching at Title I schools be highly qualified.
Murray & Murray (2007); Education Commission of the States
(2007)
Race to the Top (RTTT). RTTT has four focal points: 1. Adopting
standards; 2. Data systems development; 3. Teacher and principal
effectiveness; 4. Turnaround of low-performing schools. A focus of
RTTT is a shift from highly qualified to highly effective. It has
provided political cover for reforms to teacher evaluation and
compensation.
Smarick (2011); McGuinn, (2010a/b);
Kolbe & King Rice (2012); Nicholson-Crotty & Staley (2012);
Florida’s RTTT. Florida spending majority of money on independent
contractors. Also, a large percentage on testing. Union support low
in Florida.
Smarick (2011); Kolbe & King Rice (2012); McGuinn (2012);

60
Teacher Evaluation and Compensation
A major component of Race to the Top consists of teacher evaluation and
compensation reform. The premise is that teachers who are evaluated and compensated
correctly will be more effective in raising student achievement. Donaldson (2009) wrote
that ,“Meanwhile, researchers have noted that a well-designed and implemented teacher
evaluation system may be the most effective way to raise student achievement” (p. 1).
To understand these components of RTTT and to set the basis for the present
research study, it was important to review current and traditional teacher evaluation and
compensation methods, the purposes and perceptions of both evaluation and
compensation, and to examine reforms that have taken place to teacher evaluation and
compensation. These reforms have been the focus of many studies in recent years and
will help to establish a purpose for studying the professional opinions of current
educational leaders concerning the teacher evaluation and compensation reforms required
in the RTTT grant. Odden and Kelley (2002) wrote that, “Because teacher compensation
is the largest portion of the education budget, how teachers are paid is key to effective
use of educational resources” (p. 2).
The Evolution of Teacher Evaluation
Early teacher evaluation relied primarily on religious leaders and clergy for
direction. The purpose was to determine compensation and to make retention and firing
decisions. Around the turn of the 20th
century, a period of supervision occurred that had
its foundation in the scientific management (Marzano, Frontier & Livingston, 2011).

61
This approach was common until World War II when the emphasis shifted to
developing the individual teacher. Clinical supervision was the basis for the next shift in
evaluation during which observations and discussions drove teacher evaluation.
Developmental and reflective models were then used to evaluate teachers. These models
were much less prescriptive (Marzano et al., 2011).
A Nation at Risk and the Rand Corporation study in the 1980s helped to shape
evaluation models that resembled those currently used. These models have placed the
emphasis on classroom teaching and all the dynamics involved (Marzano et al., 2011).
Despite this, in tough economic times the focus is placed elsewhere. As Donaldson
(2009) stated, “However, when the economy contracted and lay-offs occurred in many
schools, seniority, rather than evaluation results, general drove decisions about who
would receive pink slips” (p. 4).
Considered with teacher evaluation, tenure is a concept that has received much
attention over the years. Baratz-Snowden (2009) reported that “State laws enunciate
processes both for granting tenure and revoking it. Tenure laws are designed to do two
things: (1) assure a high quality veteran teaching force; and (2) protect that force from
arbitrary dismissal” (p. 7).
As the 21st century began and interest in standards based achievement grew,
evaluation practices have come under increasing scrutiny (Marzano et al., 2011). This
scrutiny has continued with the emphasis that the RTTT grants have put in place to
address evaluation.
62
Purposes and Perceptions of Teacher Evaluation
In addition to understanding the historical context of teacher evaluation, it is
important to understand the purposes of teacher evaluation and various stakeholders’
perceptions of these systems. Purposes of teacher evaluation range from selecting,
hiring, retaining and dismissing teachers to setting a basis for compensating them.
Bent (1993) found that teachers, principals, superintendents, and school board
members all believed that teacher professional development was a major purpose of
teacher evaluation. Bent (1993) also found that teachers as a group tended to believe the
evaluation process was adversarial and that principals were not competent to fairly
evaluate their teaching. On the other hand, principals believed there was not enough time
to complete the evaluations in a way that met their intended purpose (Bent, 1993).
Donaldson (2009) found that approaches to the teacher evaluation process such as
observation, performance-based assessments, portfolios, and value-added analysis all had
strengths and weaknesses. The best approach would combine these systems in a way that
would emphasize the strengths of each. Donaldson (2009) noted that all teachers
generally receive satisfactory summative evaluations and dubbed this “the Lake
Wobegon effect.” According to Donaldson, many instruments used for evaluation do not
accurately reflect the intricacies of teaching. External and internal constraints affect the
differentiation of evaluations and lead to the Lake Wobegon effect. Without specific
feedback, evaluations do not improve instruction at schools. In addition, evaluation has
few consequences, positive or negative on student achievement.
Donaldson (2009) noted signs that a change in teacher evaluation was coming.
Public pressure, union backing, changes in attitudes of teachers, generational changes,
63
increased knowledge of good instruction, and data collection to track student
performance, in her view, all contributed to the changes that may eventually occur. A
good evaluation system, as envisioned by Donaldson, must have an extended
development phase, use valid, reliable instruments, multiple measures, robust
professional development, accountability and incentives, and integration into the human
capital systems.
Greene, Huerta, and Richards (2007) also found implications for teacher
evaluation in their study.
This research also suggests that personnel evaluation must become more relevant
to improving teacher performance by using multiple indicators such as reflective
portfolios, student performance data, and perhaps stakeholder satisfaction surveys
to enhance the value of the employee appraisal process (p. 64).
The public perception of bad practices can be attributed to so few teachers being
terminated each year. The Schools and Staffing Survey (SASS) from the National Center
for Education Statistics analyzed school district data from around the country in 2007-
2008. The average district had 211.4 teachers. The average number of teacher dismissals
for each district was 4.4. The average district only dismissed 1.4 teachers who had tenure
and three without tenure (Aritomi & Coopersmith, 2009).
Robinson (2009) reported that Texas principals’ perceptions of the purpose of
formal appraisal or evaluation could be summed up with four themes: (a) ensure quality
teaching, (b) ensure the curriculum to be taught, (c) provide support or professional
development to teachers, and (d) quality control to eradicate poor teaching. Of the four,
quality control was mentioned less than 1% of the time.

64
Wise, Darling-Hammond, McLaughlin, and Bernstein (1984) reached five
conclusions about effective teacher evaluation: (a) teacher evaluation must suit the
education goals, style, conceptions and values of the school district; (b) commitment and
resources outweigh checklists and procedures; (c) match the process to the purpose; (d)
stakeholders must believe in its utility; and (e) include teachers in involvement and
responsibility.
Bastarache (2000) studied the perceptions of teachers and principals in three
urban districts in Massachusetts with regard to the purposes of teacher evaluation. He
found that there was a significant difference between the two groups. Teachers tended to
be much more negative than were principals in regard to evaluation being able to help
improve their instruction.
Mobley (2002) studied principal perceptions concerning the state model for
teacher evaluation in Tennessee called the Tennessee Model for Local Evaluation. She
found that principals believed in the purpose of the model. However, the principals’
perceptions of the utilization of the model were found to be negative as the process was
deemed too time consuming.
The public has been found to be negative in thinking about teacher evaluation,
especially when concerning tenure. In fact, the general public has reported opposed the
idea of tenure by a margin of two to one. (Howell, Peterson, & West, 2011)
As generational changes take place in the workplace, teacher evaluation changes
typically reflect those changes. Generational differences account for differences in
perceptions among teachers.

65
As Baby Boomers exit, members of Generation X and the Millennial Generation
will form a larger portion of the teacher workforce. These people expect to be
assessed based on their performance and receive rewards, if they perform well, or
sanctions, if they do not (Donaldson, 2009, p. 15).
In order to reach all students, including students with low socioeconomic status,
teacher evaluation reform may be the best way to ensure that all students receive quality
instruction. “If we are committed to expanding learning and increasing achievement,
especially for low-income children and those who are under-performing, we must
improve teachers’ instruction. Teacher evaluation holds great promise for achieving this
aim” (Donaldson, 2009, p. 21).
The literature reviewed generally indicated that a strong evaluation process will
enable many school systems to improve the quality of instruction. And, with the
improvement of quality of instruction, the improvement of student achievement will
occur. Donaldson (2009) suggested that a strong evaluation system has the following
components: (a) an extended development phase; (b) valid, reliable instruments; (c)
multiple measures; (d) robust professional development for evaluators and teachers; (e)
accountability, incentives, and support for evaluators; and (f) integration within a human
capital system. Incentives, and therefore compensation, leads to the clear connection
between compensation and evaluation.
The Evolution of Teacher Compensation
In order to better understand the reforms to teacher compensation, one needs to
understand its history. Protsik (1995) studied teacher pay and incentive reforms. His

66
report was a rich resource in documenting changes in compensation for teachers over the
years. The compensation of teachers can be documented by many major shifts starting
from the boarding ‘round system of the 1800s which matched the agrarian society of that
time period. Teachers negotiated their salaries on an individual level. The societal shifts
of the industrial revolution eventually brought about graded schools, and salaries became
more uniform with minimum salaries established. Ranges for compensation were set for
different grade levels and teachers’ gender and race. Where teachers were placed in the
salary range depended on experience and administrator discretion.
Beginning in the 1920s, single salary schedules were introduced and by the 1950s,
97% of all schools had adopted the single salary schedule. This system paid teachers’
salaries based on their education level and years of teaching experience. A national call
for improving teacher performance through compensation came about in the 1980s after
the report, A Nation at Risk (National Commission on Excellence in Education (1983)
was released. Experiments with merit pay, career ladders, and other incentive programs
have been implemented across the nation. Most of these have been abandoned or deemed
unsuccessful (Protsik, 1995).

67
Glazerman (2004) also completed a study on teacher compensation. He reported,
Since the early part of the 20th
century, most public school teachers have been
paid according to a uniform salary schedule, a district formula that takes into
account only the number of years teaching and the highest degree or certificate
received. (p. 9)
According to the Schools and Staffing Survey (SASS) from the National Center
of Education Statistics in 2007-2008, 92.4% of the school districts in the U.S. had salary
schedules. The average starting base salary in the U.S. was $33,600. After 10 years, the
average salary in the U.S. was $43,000. A master’s degree increased the salary figures to
$36,700 base and $47,500 after 10 years of experience. The average highest step on the
salary schedule was $62,200. City and suburban school districts averages were slightly
above the overall averages while town and rural school district averages were slightly
below those averages (Aritomi & Coopersmith, 2009).
In a similar examination of incentive programs in 1984-1985, Bobbitt (1989)
found that 38% of all schools had some type of incentive program. That represented an
increase from the 1983-1984 school year when only 18% of schools had a teacher
incentive program of some type. One can speculate that this was in response to the 1983
report, A Nation at Risk (National Commission on Excellence in Education).
In some instances, school systems have attempted to change some of the details of
their compensation programs but have kept the same basic structure. “On occasion,
school districts have used signing bonuses, scholarships, and loan repayment to lure
teachers to schools or subject areas experiencing shortages. Otherwise differential pay
has been rare in the last 50 years” (Glazerman, 2004, p. 9).

68
Goldhaber (2010) explained that some traditional compensation have not been
effective because the fact that some teaching positions are more difficult and some pay
plans do not “admit that some schools and classrooms will be tougher to staff because of
the nature of the particular teaching job” (p. 4).
The general public has been generally receptive in the early 21st century to the
suggestion that it is the time for change in both evaluation and compensation. A survey
of the public found that although approximately 25% of respondents opposed the idea of
basing teacher evaluation on student scores on tests, almost half (49%) were supportive
(Howell et al., 2011).
Reform to the traditional salary schedule is not necessarily new. In fact, “The
recent history of teacher pay reform can be divided into two periods, a reform wave in the
1980s and more recent round of reform” (Glazerman, 2004, p. 9). Ellerson (2009)
reported that the focus on salaries has shifted to what’s best for the students and not
necessarily for the adults. She explains,
Coming into the 21st century, the shift in public thinking around teacher salaries
has kept in line with a broader paradigm shift towards focusing on what happens
to children. In this instance, it means that rather than adjusting pay schedules to
compensate for inequalities among adults, current dialogue focuses on how the
pay model impacts children (p. 4).
Given that, in the opinion of researchers, a shift has taken place in the views of
many educational stakeholders in public education in regards to compensation strategies
for educators, it is appropriate to give further attention to the purposes behind some of the
strategies and perceptions of stakeholders.
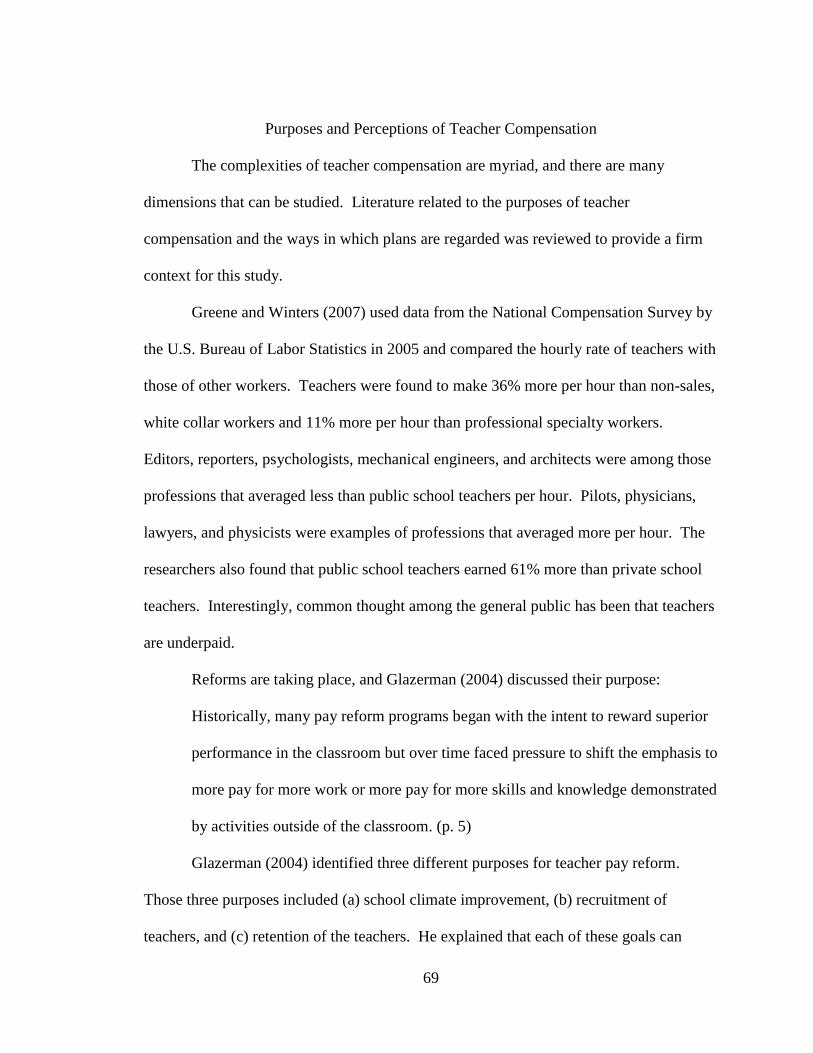
69
Purposes and Perceptions of Teacher Compensation
The complexities of teacher compensation are myriad, and there are many
dimensions that can be studied. Literature related to the purposes of teacher
compensation and the ways in which plans are regarded was reviewed to provide a firm
context for this study.
Greene and Winters (2007) used data from the National Compensation Survey by
the U.S. Bureau of Labor Statistics in 2005 and compared the hourly rate of teachers with
those of other workers. Teachers were found to make 36% more per hour than non-sales,
white collar workers and 11% more per hour than professional specialty workers.
Editors, reporters, psychologists, mechanical engineers, and architects were among those
professions that averaged less than public school teachers per hour. Pilots, physicians,
lawyers, and physicists were examples of professions that averaged more per hour. The
researchers also found that public school teachers earned 61% more than private school
teachers. Interestingly, common thought among the general public has been that teachers
are underpaid.
Reforms are taking place, and Glazerman (2004) discussed their purpose:
Historically, many pay reform programs began with the intent to reward superior
performance in the classroom but over time faced pressure to shift the emphasis to
more pay for more work or more pay for more skills and knowledge demonstrated
by activities outside of the classroom. (p. 5)
Glazerman (2004) identified three different purposes for teacher pay reform.
Those three purposes included (a) school climate improvement, (b) recruitment of
teachers, and (c) retention of the teachers. He explained that each of these goals can

70
contribute to the overall teaching performance and that, “Increasing performance can be
defined in terms of raising student achievement but also perhaps in terms of improving
other student outcomes (related to attendance, dropout rates, and disciplinary incidents,
for example) or parent satisfaction” (p. 4).
Goldhaber (2010) explains that merit pay or paying for performance helps to lead
the push to reform.
The desire to link teacher pay to performance is but one argument for moving
away from the predominant structure of compensation in teaching: the single-
salary schedule whereby a teacher’s salary is determined by his or her degree and
experience level alone (p. 3).
Goldhaber further explained,
In the absence of pay adjustments for differences in job amenities or difficulty, to
the extent that they are able, teachers will gravitate toward positions that are more
desirable. Teachers with more labor market bargaining power—those who are
highly experienced, credentialed, or judged to be better—will therefore tend to be
teaching in nicer settings with lighter workloads (p. 11).
Because the traditional compensation system does not include any link to student
performance, many researchers have suggested there should be that link. In their study
on resources, Greene et al. (2007) found that “An implication of this study is that
employee compensation should be more directly tied to the correlates of improved
student performance, if not to the improved performance itself” (p. 4).
One component of the traditional system is rewarding for additional education.
Walsh and Tracy (2004) found that “In fact, the evidence strongly suggests that
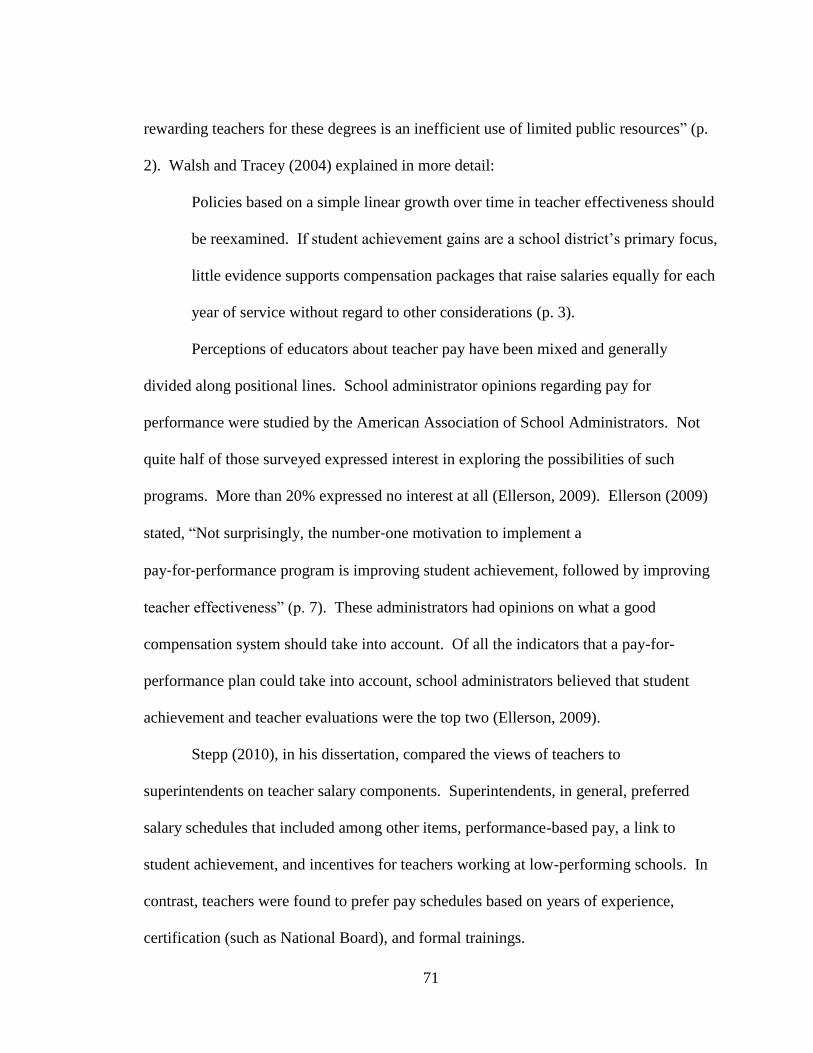
71
rewarding teachers for these degrees is an inefficient use of limited public resources” (p.
2). Walsh and Tracey (2004) explained in more detail:
Policies based on a simple linear growth over time in teacher effectiveness should
be reexamined. If student achievement gains are a school district’s primary focus,
little evidence supports compensation packages that raise salaries equally for each
year of service without regard to other considerations (p. 3).
Perceptions of educators about teacher pay have been mixed and generally
divided along positional lines. School administrator opinions regarding pay for
performance were studied by the American Association of School Administrators. Not
quite half of those surveyed expressed interest in exploring the possibilities of such
programs. More than 20% expressed no interest at all (Ellerson, 2009). Ellerson (2009)
stated, “Not surprisingly, the number‐one motivation to implement a
pay‐for‐performance program is improving student achievement, followed by improving
teacher effectiveness” (p. 7). These administrators had opinions on what a good
compensation system should take into account. Of all the indicators that a pay-for-
performance plan could take into account, school administrators believed that student
achievement and teacher evaluations were the top two (Ellerson, 2009).
Stepp (2010), in his dissertation, compared the views of teachers to
superintendents on teacher salary components. Superintendents, in general, preferred
salary schedules that included among other items, performance-based pay, a link to
student achievement, and incentives for teachers working at low-performing schools. In
contrast, teachers were found to prefer pay schedules based on years of experience,
certification (such as National Board), and formal trainings.

72
Glazerman (2004) researched the types of reforms that were being used in teacher
compensation plans. He cited four different types of pay reforms: extra work, skills or
knowledge, filling a need, and measured teacher performance.
Mathematica Policy Research Inc. (2006) revised Glazerman’s (2004) categories.
The researchers combined extra work with extra skills or knowledge. Thus, the different
types of reform discussed in the next subsection dealing with pay reform can be classified
into three categories: (a) pay for performance, (b) pay for knowledge, skills and (c) extra
work, and filling a need.
Recent Reforms to Teacher Evaluation and Compensation
President Barack Obama and Secretary of Education Arne Duncan adopted pay
for performance or merit pay as one component to improving public schools. “Support
for this initiative is based on the conviction that we must improve teaching and this can
be done in part by rewarding excellence” (Hayes, 2010, p. 79). The literature on teacher
evaluation and compensation reforms, however, predate Obama and Duncan. In 2002,
Odden and Kelley wrote about significant advances in standards, assessment, evaluation
technology, performance knowledge, and a willingness to explore new ideas, stating,
“For the first time in over 50 years, there is a window of opportunity for meaningful and
lasting compensation reform” (p. 38).
A report based on data obtained from the Schools and Staffing Survey (SASS)
(Aritomi & Coopersmith, 2009) indicated that districts in the U.S. used pay incentives for
teachers for the following four reasons: (a) National Board Certification; (b) excellence
in teaching; (c) recruitment or retention of teachers in a less desirable location;

73
recruitment or retention of teachers in fields of shortage. Almost one quarter (24.5%) of
school districts paid for National Board Certification, but only 10.2% of districts
rewarded excellence in teaching. A higher percentage of districts use financial incentives
in field shortage areas than use financial incentives for less desirable locations (15.4% to
5.7%).
City or urban school districts were more likely to reward excellence in teaching
than were suburban, town, or rural districts. In 2007-2008, 35.3% of city school districts
had financial incentives for rewarding excellence in teaching. The percentages of other
types of districts that rewarded for that same reason were far less and not more than 7.5%
(Aritomi & Coopersmith, 2009).
One key element too many of the evaluation and compensation reforms are the
value-added models initiated at the University of Tennessee as the Tennessee Value-
Added Assessment System.
This method requires three key components: a testing process which produces
scales that have a strong relationship to the curriculum and which produces
measurement that extends above and below grade level; the construction and
ongoing expansion of a longitudinal data base; and a statistical process that
enables a multivariate, longitudinal analysis to produce unbiased and efficient
estimates of the desired effects. (Sanders & Rivers, 1996, p. 1)
One outcome of studying teachers with value-added analysis was finding the
statistical impact on students assigned to either good teachers or poor-performing
teachers. “Groups of students with comparable abilities and initial achievement levels

74
may have vastly different academic outcomes as a result of the sequence of teachers to
which they are assigned” (Sanders & Rivers, 1996, p. 6).
Value-added models (VAMs) have detractors as well. Wainer (2011), “Value-
added assessment may yet help us in this task, but there are many challenges yet to
overcome before these models are likely to help us with the very difficult questions VAM
was formulated to answer” (p. 136).
Finding the right elements and giving them the correct weight was found to be
key in creating evaluation and compensation reform. Ellerson (2009) explained that
Successful implementation of pay‐for‐performance models will require an
ongoing dialogue that involves all members of the education community to
answer tough questions, covering everything from who is involved and what the
model will look like to how the model will be evaluated and sustained (p. 3).
The federal government has also experimented with reform to teacher compensation. One
program, the Teacher Incentive Fund (TIF) was reported on by Smarick (2011), “Since
2006, the federal government has funded a small program to support differentiated
compensation, the Teacher Incentive Fund” (p. 59). Smarick (2011) went on to report
that, “TIF provides funding on a competitive basis to states and districts that implement
performance-pay programs for teachers and/or principals in high-need schools” (p. 59).
These reforms to traditional compensation seem to have support across the
political spectrum. Rather than cutting this Bush-era program, President Obama included
it in the Teacher and Leader Innovation Fund. Smarick (2011) reported on this as
follows:

75
Though differentiated pay would be a core component of the program, TLIF
would also support efforts to increase the number of effective teachers, more
fairly distribute high-quality teachers among differently resourced schools,
improve educator-preparation programs, develop additional professional
opportunities for effective teachers, strengthen evaluation systems, remove
ineffective teachers from the classroom, improve professional development, and
support school turnaround efforts (p. 60).
Five TIF grants were awarded to an organization called New Leaders for New
Schools (NLNS) to implement a reform program entitled Effective Practice Incentive
Community (EPIC). NLNS implemented EPIC in Memphis City Schools, District of
Columbia Public Schools, Denver Public Schools, Prince Georges County Public
Schools, and a consortium of charter schools (Chaplin et al., 2009).
There was variation in the types of awards given through EPIC, the criteria for
receiving awards, and the amount of the awards. Most awards were given to entire
schools although there were plans to give individual teacher awards as well. Some used a
Value-Added Model to determine student achievement while others used different
measures. NLNS contracted an organization entitled Mathematica Policy Research, Inc.
(2006) to evaluate the EPIC program (Chaplin et al., 2009). The evaluation indicated that
in regard to compensation of teachers,
Far less than half [of the principals studied] are satisfied with the current system,
and most principals in all three partners convey support for linking a portion of
teacher compensation, in some fashion, to principals’ evaluations of teachers and
to student scores from state assessments (p. 108).

76
In the same evaluation, the researchers found that most survey respondents
favored school awards rather than individual awards. The reasoning for this was not very
complex. “This orientation toward an emphasis on school-level awards is consistent
within principals’ perceptions that awarding selected teachers within schools leads to
counterproductive teacher competition” (Chaplin et al., 2009, p. 108). Principals want to
encourage a community of cooperation at their schools as opposed to having adversarial
relationships.
Springer and Winters (2009) conducted a preliminary investigation of an
incentive program in the New York City public schools.
The School-Wide Performance Bonus Program (SPBP) was implemented midway
into the 2007–08 school year and was designed to provide financial rewards to
educators in schools serving disadvantaged students. The SPBP sets expected
incentive payments as a fixed performance standard, meaning that schools
participating in the program are not competing against one another for a fixed
sum of money (p. 2).
Overall, their results were similar to the results of many studies on merit pay, “We found
that the SPBP had no discernible effect on overall student achievement in mathematics
during the first year of the program’s implementation” (p. 3).
The Education Commission of the States (2010) identified four current merit pay
systems that have been the subject of study. These four were the Iowa Pay for
Performance Pilot, the Governor’s Education Excellence Grants in Texas, the Teacher
Advancement Program (TAP) in Chicago, and the Professional Compensation for
Teachers (ProgComp) in Denver. To summarize in regards to effectiveness of the

77
programs, “Each of the studies of the four pay-for-performance systems found no
conclusive evidence to link the new merit pay system with higher student achievement”
(p. 3).
There were five plausible; potential reasons as to why there was no link to higher
student achievement in the merit pay plans studied by the Education Commission of the
States (2010). First, the programs were new at the time of the evaluation. Secondly,
implementation of the programs was limited. Also, funding levels may be insufficient,
making the awards too small to encourage changes in practice. Finally, these programs
may not improve student achievement “because these programs failed to positively
impact the way that students learn” (p. 3).
Goldhaber (2010) wrote,
Today, there are a number of major school systems, among them Denver and
Houston, and states, such as Florida, Idaho, Minnesota, Mississippi, and Texas, all
of which are either currently experimenting with a merit pay program, or about to
launch one (p. 13).
Changes in evaluation systems do not seem to be publicized as much as changes
to compensation. Nonetheless, there have been reforms. Amendt (2004) found that a
majority of teachers believe that teacher evaluation has improved with the passage of the
teacher quality law in Iowa. However, that researcher found that only a little more than
one-third of Iowa administrators surveyed believed it would improve student
achievement. Goldhaber (2010) noted the state level may be the best option for making
these reforms. “From a practical standpoint, it is much more likely that the state will
have the capacity to develop data and analysis systems that can credibly be used to assess

78
significant areas of shortage, track teacher performance, and/or administer a
differentiated pay system” (p. 34).
Glazerman (2004) has reviewed the programs that have received much publicity.
He continues, “Merit pay programs that have received a great deal of attention include
the Cincinnati Teacher Evaluation and Compensation System, the Douglas County,
Colorado, and Denver Pay for Performance Programs, and the Teacher Advancement
Program, which was developed by the Milken Foundation and implemented in many
settings around the country” (p. 14). However, “The impact of any differential pay
strategy on student achievement remains largely unknown” (p. 18).
Mathematica Policy Research Inc. (2006), extensively looked all over the country
to find examples of pay reform to find “the seven most promising candidates from our list
of 20 so as to glean important insights into the effectiveness of teacher pay reform” (p. 4).
The seven that Mathematic Policy Research Inc. found represented each of the three
types of pay reform: pay for performance, pay for knowledge, skills or extra work, and
pay for filling a need.
Mathematica Policy Research Inc.(2006) chose the following programs
representing the pay for performance type of reform: Teacher Advancement Program
(TAP), Charlotte-Mecklenburg Performance Based Pay Plan, and California’s
Certificated Staff Performance Incentive Award Program. The Cincinnati Teacher
Evaluation and Compensation System and the Missouri Career Ladder Program were
chosen to represent the Pay for Knowledge, Skills, or Extra Work types of reform.
Finally, the Arkansas High Priority District Bonus Program and the Palm Beach County
Title I Sign-on Bonus Program were chosen to illustrate paying for filling a need.

79
Earlier research on TAP was found to be promising. The authors at Mathematica
Policy Research Inc. (2006) wrote,
Both studies found that the majority of TAP schools posted significantly greater
student achievement gains than their matched comparison schools. The studies
also found that the majority of teachers in TAP schools supported most aspects of
TAP. Support for the performance pay element tended to be low; however, the
authors noted that the lack of endorsement for this principle did not appear to
diminish the sense of collegiality and teamwork among teachers. (p.10)
Mathematica Policy Research Inc. (2006) found no evaluations of the Charlotte-
Mecklenburg Performance Based Pay Plan. Further research was conducted by Ngoma
(2011) who concluded, “Based on the literature that has been reviewed and teachers’
surveys, it appears that a pay for performance is not necessarily the ultimate solution to
improving teacher effectiveness and student learning” (p. 68).
The research on California’s Certificated Staff Performance Incentive Award
Program of Bacolod, DiNardo, and Jacobson (2009) resulted in the following
observations: “Despite the increase, we found little measurable improvement in standard
metrics of achievement, such as exam performance, for those schools that received the
award compared to those schools that did not receive the award” (p. 34).
Milanowski (2004) found a small to moderate association between differences in
test score results and the teacher evaluations developed for the Cincinnati Teacher
Evaluation and Compensation System. Although this did not mean that the new
evaluation and compensation system led to higher student achievement results, it did
establish the reliability of the evaluation instrument. The Cincinnati model included

80
similar reforms to evaluation and to compensation as being implemented under the RTTT
grant.
Kellor (2005) studied The Vaughn Next Century Learning Center, a conversion
charter school in Los Angeles, that piloted a new evaluation system that used (loosely)
Danielson’s Framework for Teaching and included a value-added model of student
achievement which provided the researcher with six years of information. The finding
was positive for those on the side of reform to current teacher evaluation and
compensation.
The evidence of the predictive ability of its teacher evaluation system on student
achievement (that the higher the evaluation score, the higher the learning gains
produced in that teacher’s classroom) is exciting and the fact that the standards
based evaluation system was introduced to meet the needs of the knowledge and
skill-based pay program lends credence to the recommendation to aligning
internal systems and resources so they support the same goals. (Kellor, 2005, p.
20)
Teacher evaluation and compensation has also received the backing of private
funders. “The Bill and Melinda Gates Foundation also recently announced that it is
distributing $335 million of its own money to fund experiments in tenure, evaluation,
compensation, training, and mentoring in three large school systems and some charter
school groups” (McGuinn, 2010b, p. 28).
The privately funded programs have been found to have some of the same
elements and some of the same results of similar publicly financed projects. “These
proposals have generally sought to do one or more of the following: lengthen the

81
probation period for new teachers, strengthen the teacher evaluation process, streamline
the teacher dismissal process, or “end tenure” by moving to renewable contracts”
(McGuinn, 2010b, p. 1).
Attempts at reforming and changing the element of tenure which is so closely tied
to evaluation and compensation have been controversial at best. McGuinn (2010b) cited
case studies in California, Florida, Georgia, Wisconsin, New York, Ohio, and
Washington D.C. All original reforms to tenure were defeated, watered down, or
repealed in a short period of time. For example, Georgia’s then Governor Barnes, a
Democrat, eliminated tenure for new hires in 2000. This provision failed to earn him the
endorsement of the Georgia Association of Educators. He lost his bid for re-election in
2002, and his successor restored tenure shortly after his election.
In 2008, a high-profile attempt to replace and reform tenure occurred in
Washington, D.C. Mayor Adrian Felty appointed Michelle Rhee to take over the school
system in that city.
Rhee proposed a two-tier system for compensating teachers in the 2008
Washington Teacher’s Union contract negotiations. New teachers' and existing
teachers who voluntarily opt in would give up tenure protections in exchange for
significantly higher, but performance-based, pay. Rhee’s proposed contract
would establish two different pay tiers red and green for D.C. teachers (McGuinn,
2010b, p. 28).
This proposal met with much controversy, and in a short period of time, both Felty and
Rhee were both no longer in their positions.

82
In their review of teacher performance pay literature, Podgursky and Springer
(2007) examined the case for performance pay in economic terms.
While the literature is not sufficiently robust to prescribe how systems should be
designed—for example, optimal size of bonuses, mix of individual versus group
incentives—it is sufficiently positive to suggest that further experiments and pilot
programs by districts and states are very much in order (p. 943).
Greene and Forster (2008) reviewed studies concerning merit pay. Of note, they
discounted school-wide incentive programs which were not truly merit pay programs.
They found,
The evidence that is available. . . provides some grounds for moderate optimism
about merit pay. But it also suggests that when teachers are evaluated based on
subjective judgment rather than on objective test scores, this invites systematic
problems of bias that we could expect to undermine the incentives that merit pay
is supposed to provide (p. 4).
Since merit pay has become such a large part of educational reform debate,
Adams, Heywood, and Rothstein (2009) studied the private sector to determine any
correlations that might be beneficial to considering and developing pay in the educational
field. One misconception about the private sector that was clarified in their study was
related to the private sector work force: “The suggestion that large shares of the private
sector workforce have a tight formulaic relationship between earnings and performance is
wrong” (p. 57).
Adams et al., (2009) addressed the use of quantitative evaluations.

83
In education, most policy makers who now promote performance incentives and
accountability, and scholars who analyze them, seem mostly oblivious to the
extensive literature in economics and management theory documenting the
inevitable corruption of quantitative indicators and the perverse consequences of
performance incentives that rely on such indicators (p. 97).
They also suggested that there were several questions that were not being posed
regarding the benefits of the use of quantitative measures such as value-added models.
How much gain in reading and math scores is necessary to offset the goal
distortion—less art, music, physical education, science, history, character
building— that inevitably results from rewarding teachers or schools for score
gains only in math and reading? Will the gain in teacher quality from a
performance incentive system be sufficient to justify the loss to the profession of
intrinsic motivation as a driving force? How much misidentification of high- or
low-performing teachers or schools is tolerable in order to improve the average
performance of teachers or schools? (p. 98).
Table 4 contains a summary of the literature reviewed related to teacher
evaluation and compensation. The table displays the literature related to each of the
subsections discussed in this chapter along with the major authors and researchers
associated with each topic.

84
Table 4
Summary of Literature Reviewed: Teacher Evaluation and Compensation
Subsection Summary of Findings Authors
Evolution of Teacher Evaluation. Despite a shift towards
evaluation models focused on all the dynamics of teaching,
years of experience trumps evaluation for lay-off decisions.
Marzano, Frontier, & Livingston (2011); Donaldson (2009); Baratz-Snowden
(2009)
Purposes and Perceptions of Teacher Evaluation.
Professional development is a shared purpose, but teachers
are more cynical. Younger teachers more receptive to
changes. Observation, performance-based assessments,
portfolios, and VAM should be combined for best approach.
Bent (1993); Donaldson (2009); Greene, Huerta, & Richards (2007); Aritomi
& Coopersmith (2009); Robinson (2009); Wise, Darling-Hammond,
McLaughlin, & Bernstein (1984); Bastarache (2000); Mobley (2002); Howell,
Peterson, & West (2011);
Evolution of Teacher Compensation. Some experiments
with incentives and signing bonuses; but most districts have
similar pay scales. Public thinking has moved to what is
best for students, not the adults.
Protsik (1995); Aritomi & Coopersmith (2009); Glazerman (2004); National
Commision on Excellence in Education (1983); Bobbitt (1989); Goldhaber
(2010); Howell et al. (2011);
Purposes and Perceptions of Teacher Compensation. Push
to reform due to change in perceptions to correlate pay to
improved student achievement. Administrator opinions
different than teacher opinions. Three types of reform exist:
pay for performance; pay for knowledge/skills; extra work.
Greene & Winters (2007); Glazerman (2004); Goldhaber (2010); Walsh &
Tracey (2004); Ellerson (2009); Stepp (2010); Mathematica Policy Research
Inc. (2006);
Recent Reforms to Teacher Evaluation and Compensation.
Reforms found to have limited success, if any, on student
achievement. Earlier research not enough to make sound
policy research.
Hayes (2010); Odden & Kelley (2002); Aritomi & Coopersmith (2009);
Sanders & Rivers (1996); Wainer (2011); Ellerson (2009); Smarick (2011);
Chaplin et al. (2009); Spring & Winters (2009); Golhaber (2010); Glazerman
(2004); Mathematica (2006); Bacolod, DiNardo, & Jacobson (2009);
Milanowski (2004): Kellor (2005); McGuinn (2010a/b); Podgursky & Springer
(2007);Adams et al. (2009);

85
Summary
The literature reviewed for this study has established a basis for further study.
Springer and Winters (2009) cautioned that preliminary research was not enough to make
sound policy decisions.
Furthermore, readers should not lose sight of the fact that additional experimental
and quasi-experimental evaluations of various forms of teacher compensation
reform are needed. Pay-for-performance programs can exhibit various design
components, including the unit of accountability, performance measurement,
incentive structure, and bonus distribution (p. 30).
At the time of the present study, RTTT was very new and not fully implemented.
New policies were being created on a regular basis that affected educational leaders.
Because an emphasis has been placed on reforming the teacher evaluation system and
traditional compensation, it was important, and will continue to be so, to elicit views and
opinions of educational leaders who will implement these new reforms. A better
understanding of these perceptions could make a difference in creating policies that will
truly impact student achievement in a positive way. It was this rationale on which the
present study was based.
In the upcoming chapters, the methodology for a mixed-methods study is
presented, the results of the study shared, and the results of the study are discussed. This
study will add to research and literature concerning the RTTT grant, and in particular, the
teacher evaluation and compensation components that the RTTT grant will require.
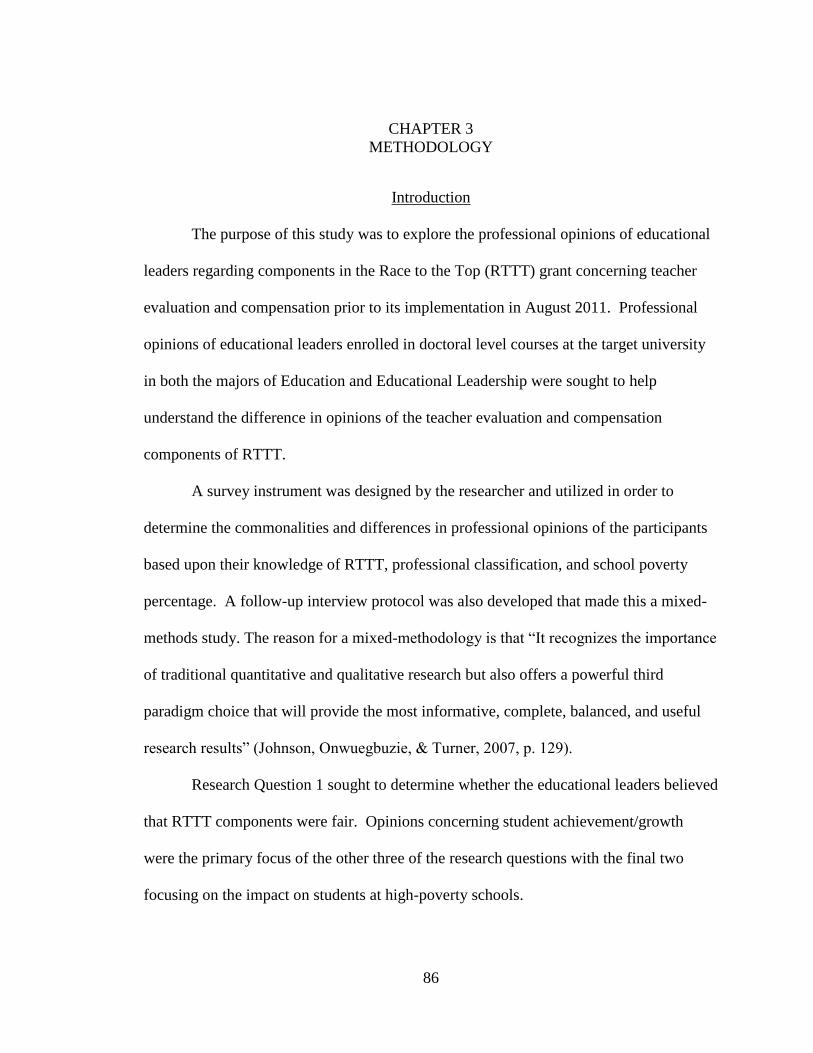
86
CHAPTER 3
METHODOLOGY
Introduction
The purpose of this study was to explore the professional opinions of educational
leaders regarding components in the Race to the Top (RTTT) grant concerning teacher
evaluation and compensation prior to its implementation in August 2011. Professional
opinions of educational leaders enrolled in doctoral level courses at the target university
in both the majors of Education and Educational Leadership were sought to help
understand the difference in opinions of the teacher evaluation and compensation
components of RTTT.
A survey instrument was designed by the researcher and utilized in order to
determine the commonalities and differences in professional opinions of the participants
based upon their knowledge of RTTT, professional classification, and school poverty
percentage. A follow-up interview protocol was also developed that made this a mixed-
methods study. The reason for a mixed-methodology is that “It recognizes the importance
of traditional quantitative and qualitative research but also offers a powerful third
paradigm choice that will provide the most informative, complete, balanced, and useful
research results” (Johnson, Onwuegbuzie, & Turner, 2007, p. 129).
Research Question 1 sought to determine whether the educational leaders believed
that RTTT components were fair. Opinions concerning student achievement/growth
were the primary focus of the other three of the research questions with the final two
focusing on the impact on students at high-poverty schools.

87
By conducting this study, the researcher added to the field of knowledge
concerning the types of teacher evaluation and compensation reform that can lead to
increased student learning at all schools and, in particular, high-poverty schools. The
methodology that was used in this study is described in this chapter. It has been
organized using the following four sections: selection of participants, instrumentation,
data collection, and data analysis.
Population
The population for this study was comprised of administrative and instructional
educational leaders in central Florida. Because this research was conducted to gain
understanding of the professional opinions of educational leaders in central Florida about
the RTTT components concerning teacher evaluation and compensation, it was important
to find access to leaders who would be representative of the region as a whole.
Access to a variety of educational leaders in central Florida was found through a
target university’s Doctor of Education programs in both Education and Educational
Leadership. Students in these programs represented professionals in the field of
education who wished to advance their understanding of their chosen field. Students in
the Ed. D. in Education program were experienced practicing educators who wish to hold
positions of influence and gain advanced skills that would benefit their field. These
students were described as focusing on analyzing and evaluating program effectiveness,
reviewing current research, and leading change that is evidenced-based. Students
enrolled in the Ed. D. Educational Leadership program were described in the university
catalog as professionals who wish to advance their leadership opportunities who were
currently working as administrators or teachers in elementary and secondary schools as

88
well as other organizations or agencies. This program was described as appropriate for
those who wish to advance their leadership opportunities. As indicated in their
responses, participants in both programs were found to be educational leaders that were
representative of different professional classifications, i.e., administrative and
instructional, and of different central Florida districts (2012).
Sample
The students enrolled in the target university’s Ed. D. in Education and Ed. D. in
Educational Leadership programs comprised a convenience sample of the larger
population of educational leaders. Initial estimates from the professors involved in this
study indicated that the number of enrolled students in the two programs would be
approximately 136 (80 in Ed. D. in Education and 56 in Ed. D. in Educational
Leadership). In an effort to identify all students enrolled in the two programs, an email
was sent to the Advanced Graduate Coordinator in the College of Education requesting
the number of actively enrolled students in both the Ed. D. in Educational Leadership and
the Ed. D. in Education with a total of 158 students being the response (54 Ed. D. in
Education and 104 Ed. D. in Educational Leadership). These 158 students comprised the
sample in this study.

89
Instrumentation
Survey of the Implementation and Impact of Teacher Evaluation and Compensation
Components from the Race to the Top Grant (STECC-RTTT)
At the time of this study (April-June 2011) Race to the Top (RTTT) was still in
the early stages of implementation and there was no existing instrument found by this
researcher that would measure the professional opinions of educational leaders or anyone
on the potential impact certain components of the RTTT would have on student growth.
Therefore, the Electronic Survey of the Implementation and Impact of Teacher
Evaluation and Compensation Components from the Race to the Top Grant (STECC-
RTTT) was developed by the researcher of this study to determine the professional
opinions of educational leaders about the teacher evaluation and compensation
components of the RTTT grant in regard to its potential effect on student growth. The
survey was developed in Microsoft Word format, adapted, and inputted into the survey
response software at www.surveymonkey.com.
It was important that the survey enable the researcher to (a) categorize the
respondents, (b) determine participant knowledge about the RTTT, (c) elicit participant
perceptions about RTTT in regard to student achievement/growth, and (d) provide
participants with opportunities to respond to the components in an open-ended fashion.
To accomplish this, the STECC-RTTT had five parts: Part A, Demographic Information;
Part B, RTTT Background Information; Part C, RTTT Teacher Evaluation and
Compensation Components Improvement of Student Achievement; Part D, RTTT
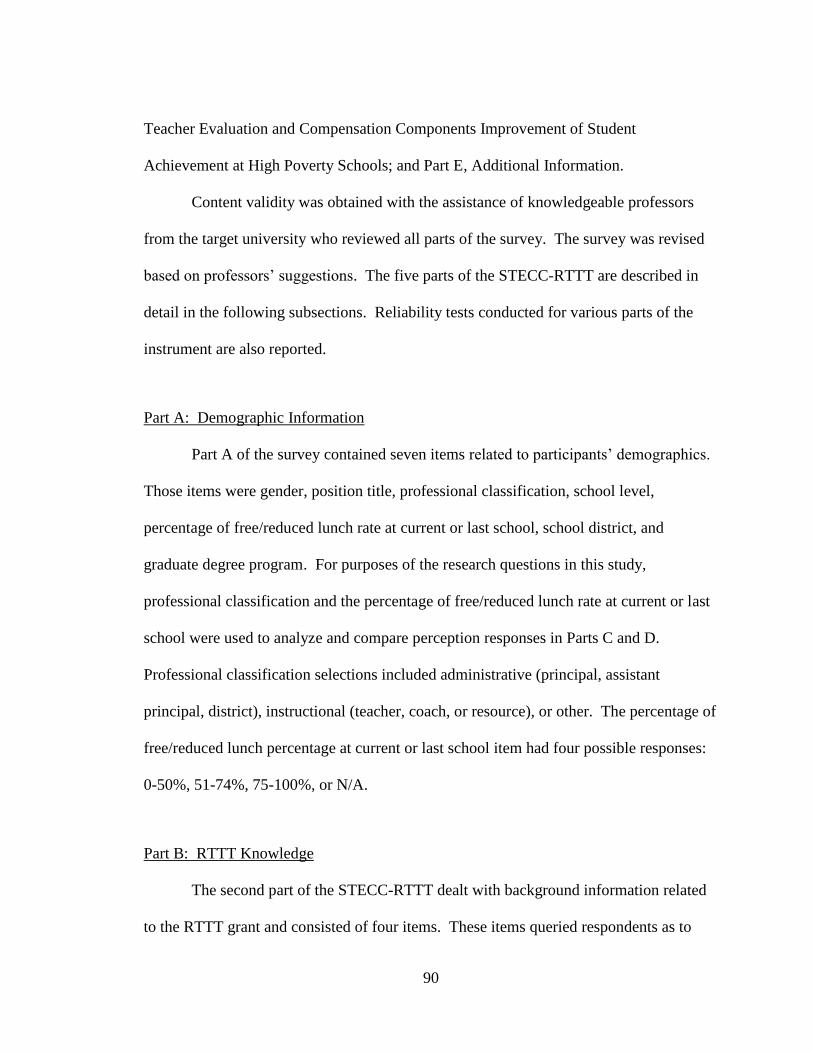
90
Teacher Evaluation and Compensation Components Improvement of Student
Achievement at High Poverty Schools; and Part E, Additional Information.
Content validity was obtained with the assistance of knowledgeable professors
from the target university who reviewed all parts of the survey. The survey was revised
based on professors’ suggestions. The five parts of the STECC-RTTT are described in
detail in the following subsections. Reliability tests conducted for various parts of the
instrument are also reported.
Part A: Demographic Information
Part A of the survey contained seven items related to participants’ demographics.
Those items were gender, position title, professional classification, school level,
percentage of free/reduced lunch rate at current or last school, school district, and
graduate degree program. For purposes of the research questions in this study,
professional classification and the percentage of free/reduced lunch rate at current or last
school were used to analyze and compare perception responses in Parts C and D.
Professional classification selections included administrative (principal, assistant
principal, district), instructional (teacher, coach, or resource), or other. The percentage of
free/reduced lunch percentage at current or last school item had four possible responses:
0-50%, 51-74%, 75-100%, or N/A.
Part B: RTTT Knowledge
The second part of the STECC-RTTT dealt with background information related
to the RTTT grant and consisted of four items. These items queried respondents as to
91
their knowledge about the RTTT grant. Respondents’ overall opinions of the fairness of
RTTT components concerning teacher evaluation and teacher compensation were sought.
The first item asked participants, “Where have you received your information on
the Race to the Top Grant?” Participants were able to select all that applied from a list of
sources. These sources included: district officials, district presentation, colleagues,
graduate classes, guest speakers, state conferences, state conference calls, FEA (or local
union) publications, media/news, education journals/publications, FL DOE website, U.S.
DOE website, email communication from RTTT grant officials, or other.
Participants were then asked to rate their knowledge of the RTTT grant using a
scale from 1-5 where 5 = Expert Knowledge, 4 = Great Knowledge, 3 = Moderate
Knowledge, 2 = Little knowledge, and 1 =No Knowledge. To further assist, two
clarifiers were used:. Under the response of 1 = No Knowledge, the clarifier, “Have not
heard of the Race to the Top Grant” and under the response of 5 = Expert Knowledge, the
clarifier, “Can facilitate a seminar on the Race to the Top Grant” were placed.
The other two items in Part B included a chance for participants to rate, using
their knowledge, the fairness of the RTTT grant concerning teacher evaluation and
teacher compensation. The scale for these items included Extremely Fair, Fair, Neutral,
Unfair, Extremely Unfair, and Not Enough Information to Rate ranging from 5 =
Extremely Fair to 1 = Extremely Unfair. These values were used to add a numerical
value to the professional opinions of the educational leaders for analysis.
In addition, the numerical values also enabled Chronbach’s Alpha reliability test
to be run on the two items. The value of .88 suggested very strong internal consistency.
Since there were only two items using this scale, the inter-item correlation value was also

92
analyzed. The mean of .79 suggested that there was a strong correlation between the two
items.
Part C: Impact of RTTT on Student Achievement/Growth,
In this part of the STECC-RTTT participants were asked to rate the potential
impact of five teacher evaluation and compensation components on the improvement of
student achievement. The five components to be rated were (a) The first 50% of Teacher
Evaluation/Appraisal will be based on student performance on a Statewide Assessment
Program, (b) The first 50% of Teacher Evaluation/Appraisal of those who teach a subject
or level in which students are not tested will be based on school-wide or team
performance, (c) the second 50% of Teacher Evaluation/Appraisal will be based on
administrator observation of core effective practices and one additional metric, (d)
current teachers will be able to optionally participate in a separate performance pay scale
(Merit Pay), and (e) teachers at the lowest performing schools will be given a separate
pay scale. The rating scale ranged from 1 to 5 where 5 = Strong Positive Impact, 4 =
Positive Impact, 3 = No Impact, 2 = Negative Impact, 1 = Strong Negative Impact, and 0
= Not enough information.
The numerical values allowed for statistical analysis including Chronbach’s
Alpha test of reliability. In this case, the value of .88 suggests a strong internal
consistency. Also, analysis was done on inter-item correlation. The mean inter-item
correlation value of .60 also suggested a strong relationship among the items and
reliability.
93
Part D: Impact of RTTT--Student Achievement/Growth at High Poverty Schools
Part D of the STECC-RTTT was identical to the Part C section and scale with one
major exception. This section focused on participants perceptions of the impact of the
five components on student achievement at high-poverty schools. The STECC-RTTT
defined high poverty schools for participants as schools with a poverty rate of 75% or
more.
The numerical values of the responses enabled statistical analysis that included
Cronbach’s Alpha test of reliability. A value of .90 suggested strong internal
consistency. In addition, analysis was performed to determine the inter-item correlation
value. The mean was .66, suggesting a strong relationship among the items.
When Parts C and Part D were combined for further analysis of reliability,
Cronbach’s Alpha test determined a value of .95. This value suggested even greater
reliability and internal consistency. In addition, the inter-item correlation mean of .66
was suggestive of a strong relationship among the items.
Part E: Open-ended Response Section
Part E of the STECC-RTTT contained one open-ended item and a single question.
Respondents were afforded the opportunity to express themselves in response to the
following statement: “Please share anything else you believe would be helpful for
understanding the potential impact of RTTT or assist with implementation.”
Respondents were also queried as to their interest in participating in a follow-up
interview. If they responded positively, they were instructed to include their contact
information.

94
Follow-up Telephone Interviews
This study also included a qualitative component which allowed for more detailed
information to be acquired from a small number of participants. The survey instrument
included a chance for participants to volunteer to submit to a follow-up interview that
yielded information for the qualitative data for the study. Four participants were selected
for follow-up interviews and comprised another convenience sample of the population.
A protocol was developed for use in the four telephone interviews. This protocol
included four open-ended questions that related to the four research questions for this
study. Interviews were conducted using a semi-structured approach in order to allow
flexibility in probing interviewees for detailed information regarding their perceptions of
the potential impact of the RTTT grant on student achievement. The interviewees had no
prior knowledge of the questions ahead of time.
Data Collection Procedures
This was a mixed-methods study that utilized both qualitative and quantitative
data. Data for this study were collected during April, May, and June of 2011. Following
is a description of the data collection procedures employed in collecting quantitative and
qualitative data.
Collection of Quantitative Data
In April of 2011, professors in both programs assisted in the data collection by
sending the 158 enrolled students email invitations that included a link to the survey
using Survey Monkey ® and explained the informed consent that they acknowledged by

95
taking part in survey. Two follow-up reminders were sent to non-responders on May 18
and again on June 21 of 2011 in attempts to increase the participation rate. The research
was also publicized by professors in their doctoral level classes. The professors used
internal sources to generate the distribution list of potential participants in the study.
A total of 54 participants (34.2%) responded by completing the survey. Because
the target university professors were not able to track the exact number of students who
received the email, the response rate may actually have been higher than the 34.2%
calculated. Of the 54 respondents, 22 respondents represented the Ed. D. in Education
program, and 31 represented the Ed. D. in Educational Leadership program. There was
one respondent who did not report his major. This respondent did not finish the entire
survey and left most items blank. The response was not used in any statistical analysis.
Participants were found to represents several different positions in the field of
education. Instructional positions reported included teacher, coach, counselor,
consultant, speech language pathologist (SLP), school psychologists, and resource.
Administrative positions reported included principal, assistant principal, administrative
dean, and district-level administrator.
Collection of Qualitative Data
Although the number of respondents was smaller than expected, the quantitative
data obtained through the survey were supplemented by qualitative data gained in follow-
up telephone interviews with participants. Telephone interviews were conducted on June
30, July 1, 7, and 8 of 2011. Participants were selected and contacted using data from
their responses to Part E of the STECC-RTTT. Initially, 14 participants had responded

96
that they would be willing to participate. The protocol for the follow-up phone interview
established a choice for the participant to hold the interview at first contact or arrange for
a better date and time. In eight instances, prospective participants did not respond to the
three messages or emails used to contact them. The method of contact depended on the
information reported in the response on the STECC-RTTT. In two cases, the follow-up
phone interview was completed on the first call. The other two participants set a
preferable time during the following week. Data gathered during the interviews, which
were approximately 15 minutes in length, were adequate to gain necessary information
for a mixed-methods study. The four participants were all females. One represented the
Ed. D program in Education and the three others represented the Ed. D program in
Educational Leadership. Two of the four were school-based administrators (one
elementary principal and one high school assistant principal). One participant was a
district level administrator and the other participant was an educational consultant with a
focus on academic coaching. Participation was sufficient to permit the researcher to
make generalizations to the population of students enrolled in the target university’s Ed.
D. programs.
Thus, of the 14 respondents who indicated a willingness to participate in follow-
up telephone interviews, only four respondents were able to be contacted using the
information provided in their returned survey responses. These four participants were
contacted by telephone and were asked for their professional opinions regarding the
RTTT grant’s impact on student achievement. Using the interview protocol (Appendix
E), four questions were asked that related to the four research questions of this study.
Because the researcher utilized a semi-structured interview format, additional follow-up

97
questions leading to further clarification of the interviewees’ responses were asked.
Notes of the participants’ answers were maintained, and some responses were written
verbatim. These notes were typed and used in the analysis of data.
Data Analysis
A mixed methods approach was utilized in analyzing the data for this study. It
included both quantitative and qualitative methodology.
Analysis of Quantitative Data
Responses from the STECC-RTTT were entered into SPSS Version 17.0 utilizing
the numerical values assigned to the item response categories. Selected demographic
responses were also entered as required to respond to the research questions.
Research Question 1
To determine to what extent, if any, there was a difference in relationship between
the self-reported knowledge of the RTTT grant and the perceived fairness of the RTTT
grant concerning teacher evaluation and compensation, a Pearson product-moment
correlation coefficient was performed. This statistical analysis was used to determine the
relationship, if any, to self-reported knowledge of the RTTT grant and the perceived
fairness of the RTTT grant concerning teacher evaluation. The same statistical analysis
was used to determine the relationship, if any, to self-reported knowledge of the RTTT
grant and the perceived fairness of the grant concerning teacher compensation. The

98
scores of each respondent on the perceived fairness of the RTTT grant concerning teacher
evaluation and concerning teacher compensation were combined for an overall fairness
score. This score was then analyzed with the self-reported knowledge score using a
Pearson product-moment correlation coefficient to determine to what extent, if any, a
relationship existed between the two.
Research Question 2
Independent-samples t-tests were performed to determine to what extent, if any,
there was a difference in the perceived potential impact on student achievement of the
RTTT grant teacher evaluation and compensation components of educational leaders
classified as instructional or administrative. Each of the five components was analyzed
individually as the dependent variable using the classification as the independent
variable.
The participants’ scores from the five components in Part C of the STECC-RTTT
were combined to determine an overall potential impact score. This score was analyzed
using an independent-samples t-test to determine if overall differences were found
between instructional and administrative respondents.
Research Question 3
Three categorical groups of participants were established based on the percentage
of free/reduced price lunch students at their current or previous schools. This was the
independent variable. Utilizing data from Part A and Part C of the STECC-RTTT, a one-
way analysis of variance (ANOVA) was utilized to determine if a difference existed

99
between the self-reported school poverty percentage groups and their perceptions of the
potential impact of RTTT teacher evaluation and compensation components on student
achievement.
After the five components were analyzed individually, participants’ scores on the
five components were combined to create an overall impact on student achievement
score. An ANOVA was performed using the three poverty percentage groups as the
categorical independent variable and the overall impact on student achievement score.
Research Question 4
The process used to analyze the data in Research Question 3 was repeated using
data for high poverty schools collected from Part D of the STECC-RTTT. This permitted
the determination of any difference between the self-reported school poverty percentage
groups and their perceptions of the potential impact of RTTT teacher evaluation and
compensation components on student achievement at high poverty schools. The
participants’ scores on the five components were combined to create an overall impact on
student achievement at high poverty schools score. An ANOVA was performed for each
of the components individually and for the combined impact on student achievement at
high poverty schools score.
Analysis of Qualitative Data
Qualitative data for this study consisted of information from the follow-up
telephone conversations with the four participants who agreed to be interviewed. Each
interview consisted of four questions which were directly related to the four research

100
questions that were used to guide the study. The purpose of including qualitative data in
this study was to add additional insight into the quantitative data. “One apparently
common purpose for combining qualitative and quantitative methods is to use the results
from one method to elaborate, enhance, or illustrate the results from the other” (Greene,
Carracelli, & Graham, 1989, p. 266).
Table 2 lists the four research questions with the corresponding questions from
the follow-up interview. Notes from these interviews were typed into a format that
permitted the researcher to organize the data for further analysis.
In order to maintain their anonymity, participants were identified as Participant 1,
2, 3, and 4. After all telephone interviews were conducted and the researcher’s typed
notes were reviewed, the responses from each of the participants were organized so that
the four responses for a single research question could be reviewed using a tabular
display. Categories and themes were determined by reading the multiple responses,
highlighting repeating or similar phrases from the four participants for each question.
The researcher then used the identified categories and themes and summarized
them in a column in a second table (Appendix F). Common phrases and important details
were highlighted as seen in the table. The data in this second table, established for each
of the four questions, were analyzed to add to the existing quantitative data and to
determine if generalizations could be made in regard to each of the four research
questions.

101
Table 5
Research Questions and Follow-up Interview Questions
Research Questions Follow-up Interview Questions
1. To what extent, if any, is there a
relationship between the self-reported
knowledge of the RTTT grant and the
perceived fairness of the RTTT grant
concerning teacher evaluation and
compensation?
Has your professional opinion changed about
the fairness of the Race to the Top grant as
you have learned more about it?
2. To what extent, if any, is there a
difference between the two professional
classification groups’ opinions about the
perceived potential impact of the RTTT
teacher evaluation and compensation
components on student
achievement/growth?
Do you think professional position
(instructional or administrative) would affect
opinions on the success of the Race to the
Top grant’s impact on student achievement
or growth?
3. To what extent, if any, is there a
difference in the opinions of educational
leaders who have different self-reported
school poverty percentages about the
perceived potential impact of RTTT
teacher evaluation and compensation
components on student
achievement/growth?
Do you think opinions of the following
components differ depending on the schools’
percentage of free/reduced lunch students:
basing 50% of a teacher’s evaluation on
student performance on an assessment
program, basing the other 50% of a teacher’s
evaluation on administrator observations,
being able to optionally participate in a
separate performance pay scale, and having a
separate pay scale for teachers at the lower
performing schools?
4. To what extent, if any, is there a
difference in the opinions of educational
leaders who have different self-reported
school poverty percentages about the
perceived potential impact of RTTT
teacher evaluation and compensation
components on student
achievement/growth at high-poverty
schools?
Do you personally think that the teacher
evaluation and compensation process can be
used as a tool to help improve achievement
at high-poverty schools?

102
Summary
The methods and procedures used to conduct this research study have been
detailed in this chapter. The population was described along with the procedures used to
arrive at the sample. The quantitative and qualitative measures used to respond to the
four research question were also described. To gather quantitative data, a researcher-
designed electronic survey, Survey of the Implementation and Impact of Teacher
Evaluation and Compensation Components from the Race to the Top Grant (STECC-
RTTT), was employed, and its validity and reliability were explained. Follow-up
telephone interviews were conducted with selected participants to gather further
qualitative data, and the protocol used in these interviews was discussed. Data collection
and analysis procedures were described for both the quantitative and qualitative data
collected in this study. This included the statistical tests used and the process used in
analyzing the interview responses. The results of the data analysis are included in
Chapter 4 and include quantitative results followed up by appropriate qualitative data for
additional depth.

103
CHAPTER 4
RESULTS
Introduction
The intended purpose of this study was to explore the professional opinions of
educational leaders (instructional and administrative) in central Florida regarding the
selected teacher evaluation and compensation components of the Race to the Top grant
(RTTT). Analysis was completed using a mixed-methods approach. By including data
from the researcher designed survey (STECC-RTTT) and follow-up interviews, sufficient
quantitative and qualitative data were found for analysis. This chapter is a presentation
of the results of the data analysis for the four research questions of this study.
The data analysis included descriptive statistics of the variables used from the
STECC-RTTT as well as a comprehensive description of the variables. In addition, each
of the four research questions were analyzed using the previously designated statistical
techniques for quantitative data complemented by qualitative data gathered in follow-up
interviews to clarify and enhance the results. A comprehensive display of the results of
the analysis of qualitative data is contained in Appendix F.
Descriptive Statistics
The STECC-RTTT had the potential for numerous categorical and continuous
variables. Only those variables used in the analysis of the four research questions are
discussed in this section. The demographic variables made up the categorical data for
this study and included professional classification of the participants and the self-reported
school poverty percentage. Opinion variables made up the continuous data and included

104
(a) the self-reported knowledge of the RTTT grant, (b) the fairness of the RTTT
components concerning teacher evaluation, (c) the fairness of the RTTT components
concerning teacher compensation, (d) the potential impact on student achievement of the
five selected components, and (e) the potential impact on student achievement at high-
poverty schools of the five selected components. Analysis of the descriptive statistics
found for these variables follows.
Categorical Variables
The frequencies of the categorical variables of position classification and school
poverty percentage were determined. Of the 54 respondents, 27 reported the professional
classification of instructional and 27 reported the classification of administrative. Eight
respondents determined that the school poverty percentage was non-applicable to their
demographic information. Of the 46 participants who did share their school poverty
percentages, 24 indicated 0-50%, 12 reported a percentage of 51-74%, and 10 reported a
percentage of 75-100%.
Continuous Variables
The continuous variables utilized in the study included both self-reported values
and values assigned to opinions of the RTTT grant components concerning teacher
evaluation and compensation as defined in the STECC-RTTT. The continuous variables,
along with the categorical variables, are displayed in Table 3.

105
Table 6
Research Questions, Independent Variables, and Dependent Variables
Research
Question
Independent Variable Dependent Variables
1 Self-reported knowledge of RTTT Perceived fairness of the grant
concerning teacher evaluation;
perceived fairness of the grant
concerning teacher compensation;
combined perceived fairness
score.
2 Position classification (categorical) Perceived impact on student
achievement of each of five
selected RTTT components; total
perceived impact on student
achievement.
3 School poverty percentage (categorical) Perceived impact on student
achievement of each of five
selected RTTT components; total
perceived impact on student
achievement.
4 School poverty percentage (categorical) Perceived impact on the student
achievement of each of five
selected RTTT components at
high poverty schools; total
perceived impact on student
achievement at high poverty
schools.
Of the 54 participants, 53 self-reported their knowledge of the RTTT grant. No
participant reported having “Expert” knowledge of the RTTT grant. The mean had the
numerical value of 2.81 which would fall between “Little” and “Moderate” knowledge of
the RTTT grant on the scale created for the STECC-RTTT.
A total of 46 participants reported an opinion of the overall fairness of the RTTT
grant concerning teacher evaluation. Of those, the mean for the group was 3.02 which
106
would was only slightly above “Neutral” on the scale presented in the STECC-RTTT.
There were 41 participants that indicated their opinion of the overall fairness of the RTTT
grant concerning teacher compensation. Of those, the mean for the group was 2.56 which
would fall between “Neutral” and “Unfair” on the scale presented in the STECC-RTTT.
The five selected components of the RTTT grant concerning teacher evaluation
and compensation and the pertinent descriptive statistics concerning the opinions of the
participants are presented in Table 4. The component that had the highest mean score
(3.79) was the component requiring 50% of a teacher’s evaluation to be based on
observations of core effective practices. The component with the lowest mean score
(2.88) was the component requiring 50% of the evaluation of a teacher who does not
teach a tested subject to be based on the results of the entire school or team. The
component that had the highest number of “Not Enough Information to Rate” was the
RTTT component requiring a separate pay scale for teachers working at the lowest
performing schools.

107
Table 7
Descriptive Statistics for Selected RTTT Components: Impact on Student Achievement
Race to the Top (RTTT)
Selected Component N
Minimu
m Maximum
Mean
Score
Standard
Deviation
1st 50% of evaluation
based on student
performance
52 1 5 3.02 1.291
1st 50% of evaluation for
non-tested based on
school/team performance
52 1 5 2.88 1.278
2nd 50% of evaluation
based on administrative
observations of core
effective practices
48 1 5 3.79 1.010
Current teachers
participating in a
performance pay scale
46 1 5 3.15 1.192
A separate pay scale for
lowest performing schools
43 1 5 2.93 1.316
In the STECC-RTTT, participants were asked to rate the potential impact on
student achievement at high-poverty schools of the same five RTTT components. The
pertinent descriptive statistics are displayed in Table 5. Similar to the impact on student
achievement in general, the component having the highest mean score (3.49) for potential
impact on student achievement at high-poverty schools was the component requiring
50% of a teacher’s evaluation to be based on observations of core effective practices.
The component with the lowest mean score (2.79) was the component requiring that 50%
of the evaluation of teachers not teaching a test subject be based upon the results of the
entire school or team.

108
Table 8
Descriptive Statistics for Selected RTTT Components: Impact on Student Achievement at
High-Poverty Schools
Race to the Top (RTTT)
Selected Component N Minimum Maximum
Mean
Score
Standard
Deviation
1st 50% of evaluation
based on student
performance
53 1 5 2.83 1.297
1st 50% of evaluation for
non-tested based on
school/team performance
53 1 5 2.79 1.230
2nd 50% of evaluation
based on administrative
observations of core
effective practices
49 1 5 3.49 1.120
Current teachers
participating in a
performance pay scale
47 1 5 3.00 1.142
A separate pay scale for
lowest performing schools
45 1 5 3.07 1.405

109
Data Analysis for Research Question 1
Research Question 1: To what extent, if any, is there a relationship between the
self-reported knowledge of the RTTT grant and the perceived fairness of the RTTT grant
concerning teacher evaluation and compensation?
Quantitative Analysis for Research Question 1
To answer Research Question 1, three Pearson product-moment correlation
coefficients were performed to determine if any relationships existed. No statistically
significant relationship was found in any of three Pearson product-moment correlations
that were performed. The lack of relationship was emphasized by the qualitative data
from the follow-up interviews.
The first correlation was performed to determine if any relationship existed
between the self-reported knowledge of the RTTT grant and the perceived fairness of the
RTTT grant components concerning teacher evaluation. A small correlation was found
between the two variables, r = .12, n = 46. However, no statistical significance was
found as p > .05.
A second correlation was conducted to determine if any relationships existed
between the self-reported knowledge of the RTTT grant and the perceived fairness of the
RTTT grant components concerning teacher compensation. Virtually no correlation was
found between the two variables, r = .4, n = 41. Again, no statistical significance was
found as p >.05.
The final correlation to analyze this research question was performed to determine
if any relationships existed between the self-reported knowledge of the RTTT grant and
the total perceived fairness of the RTTT grant components concerning teacher evaluation

110
and compensation. Again, no correlation was found between the two variables, r = .06, n
= 46. No statistical significance was found for this correlation as p > .05.
Qualitative Analysis for Research Question 1
Qualitative data were used to supplement quantitative data in answering this
question by asking participants in the follow-up interview, “Has your professional
opinion changed about the fairness of the Race to the Top grant as you have learned more
about it?” The participants’ responses were put in a tabular display and repeated phrases
were highlighted. This table can be found in Appendix F.
The qualitative data gathered in follow-up interviews supported the lack of
relationship between knowledge of the RTTT grant and the opinion on the fairness of it.
Participants in the follow-up interviews were asked, “Has your professional opinion
changed about the fairness of the Race to the Top grant as you have learned more about
it?” All interviewees indicated they had not changed their opinions of the fairness of the
RTTT Grant as they learned more about it. The participants were then asked to explain
why their opinions had not changed, and three themes emerged: (a) a lack of
understanding or information about the RTTT grant, (b) not enough detail about the
implementation of the grant, and (c) the political nature of the RTTT grant.
Lack of Understanding
For the first theme as to insufficient detail, all four of the follow-up interview
participants believed that there was not enough information provided to them to change

111
their initial opinions. Participant 1 expressed this thought by saying, “My initial thoughts
were that there wasn’t a lot of information to make a judgment on the fairness.”
Participant 2 expressed frustration at the types of influence educators have. She
also stated, “We need to learn about it before we can debate it.” That supported the
overall theme that there was not enough information yet given to make a determination
about fairness.
Another participant, Participant 3, believed it was too early to change her initial
opinion. She responded, “I’ll be better at giving an opinion of fairness later in the
process of implementation.” Participant 4 expressed a similar view, stating, “I haven’t
really made a judgment yet on all of it.”
Not Enough Detail
In regard to the second theme, the lack of detail about implementation,
Participants 1 and 3 indicated they needed details about the implementation before a
better judgment could be made about the fairness. Participant 3 explained, “We haven’t
enacted a lot of the changes for the RTTT grant yet. There are many components that the
fairness of will depend on how they are enacted.” Although Participant 3 spoke in
generalities, Participant 1 expressed concerns about the implementation of specific
components. “I still believe there is not enough information on how performance pay
will be organized to make a determination on how fair it will be . . . I am curious about
what the value-added formula will look like.”

112
The Political Nature of RTTT
The third theme was related to frustration over the political nature of the RTTT
grant. Participants 2 and 4 acknowledged the political nature of the RTTT grant and
believed this played a part in their lack of opinion change. Participant 2 said, “It is what
it is.” When asked to expand on this response, she replied, “It’s government. We don’t
have a whole lot of influence on it.” Participant 4 went further by calling the RTTT grant
part of a political agenda. She expressed these sentiments, “There is a clear political
agenda that accompanies these changes.”
Data Analysis for Research Question 2
Research Question 2: To what extent, if any, is there a difference between the
two professional classification groups’ opinions about the perceived potential impact of
the RTTT teacher evaluation and compensation components on student
achievement/growth?
Quantitative Analysis for Research Question 2
To answer Research Question 2, six independent sample t-tests were performed to
compare the mean scores associated with opinions about the potential impact of the
RTTT teacher evaluation and compensation components on student achievement of
participants classified as instructional or administrative. The results of the analyses are
presented in Tables 6 and 7.
Statistical significance was found in the difference between instructional and
administrative participants’ mean scores associated with opinions of the RTTT
components and the potential impact on student achievement on three out of the five
selected components. A significant difference was found for the component that requires

113
the first 50% of teachers’ evaluations to be based on student performance on a statewide
assessment program. The difference between the responses of instructional (M = 2.28,
SD = 1.06) and administrative (M = 3.70, SD = 1.10); t(50) = -4.74, p < .05 (two tailed)
participants was found to have a magnitude of the difference in means (mean difference =
-1.42, 95% CI: -2.03 to -0.82) that was very large (eta squared = .290).
Another RTTT component that had a significant difference was that the first 50%
of evaluations of teachers of non-tested subjects be based on school-wide or team
performance on a statewide assessment program. The difference between instructional
(M = 2.32, SD = 1.18) and administrative (M = 3.41, SD = 1.15); t(50)= -3.36, p <
.05(two tailed) participants’ responses displayed a magnitude of the difference in means
(mean difference = -1.09, 95% CI: -1.74 to -.44) that was large (eta squared = .184).
The third RTTT component for which a significant difference was found was a
separate pay scale for teachers at the lowest performing schools. The difference between
instructional (M = 2.47, SD = 1.22) and administrative (M = 3.29, SD = 1.30); t(41) = -
2.10, p< .05 (two tailed) respondents was had a magnitude of the difference in means
(mean difference = .82, 95% CI: -1.60 to -.03) that was large (eta squared = .125).
There were two of the selected RTTT components that were found to have no
statistical significance in regard to the difference between the instructional and
administrative participants’ mean scores associated with the opinions on the potential
impact on student achievement. No significant difference was found for the RTTT
component of the second 50% of teachers’ evaluations being based on observation of
core effective practices by administrators between the means for instructional (M = 3.52,
SD = 1.12) and for administrative (M = 4.04, SD = .84); t(46) = -1.82, p > .05 (two

114
tailed). The magnitude of the difference in means (mean difference = .52, 95% CI: -1.10
to .06) was moderate (eta squared = .07).
The RTTT component of giving an option for current teachers to participate in a
performance pay scale was also found to have no significant difference between the
means for instructional (M = 2.86, SD = 1.25) and those of administrative (M= 3.40, SD
= 1.12); t(44)= -1.56, p > .05 (two tailed) respondents. The magnitude of the difference
in means (mean difference = -.54, 95% CI: -1.24 to .16) was small (eta squared = .05).
Statistical significance was found in the difference between instructional and
administrative participants’ mean scores combining the scores that were associated with
opinions of the RTTT components and the potential impact on student achievement.
Participants who indicated their classification as instructional had a lower mean score
than did participants who indicated their classification as administrative. The difference
between instructional (M = 11.65, SD = 5.12) and administrative (M = 16.93, SD = 4.73);
t(51) = -3.90, p < .05 (two tailed) was found to have a magnitude of the difference in
means (mean difference= -5.27, 95% CI: -8.00 to -2.55) that was quite large (eta
squared= .23).
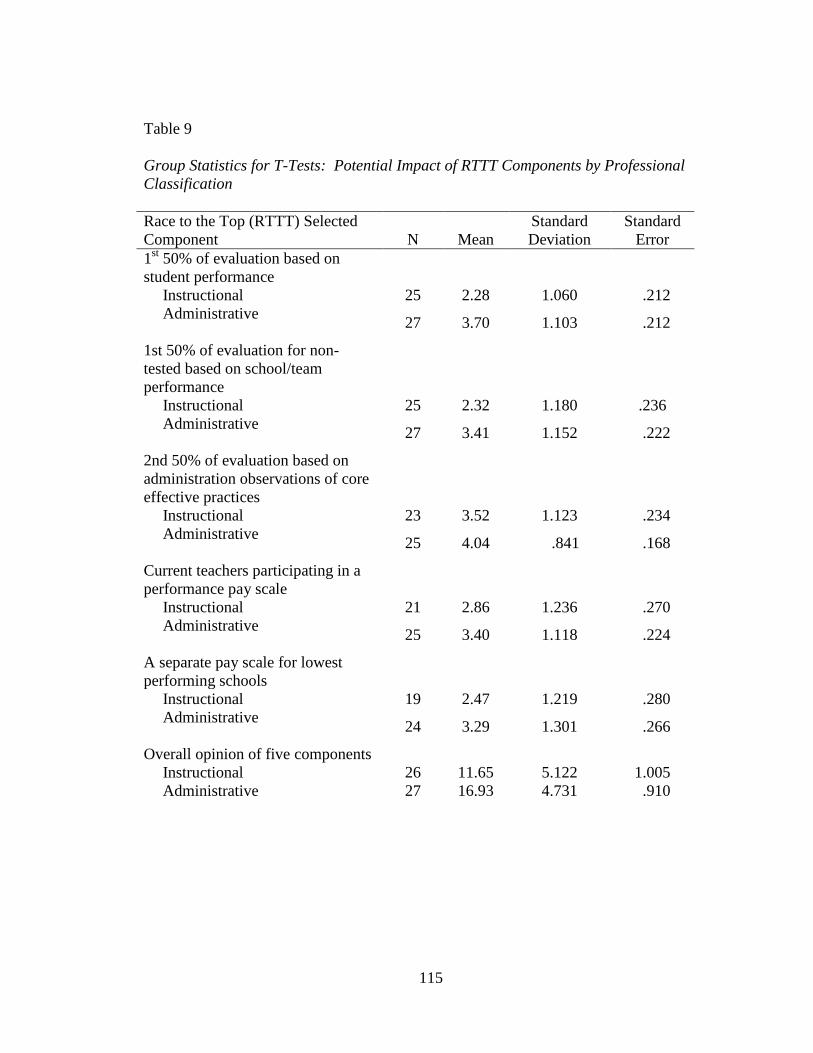
115
Table 9
Group Statistics for T-Tests: Potential Impact of RTTT Components by Professional
Classification
Race to the Top (RTTT) Selected
Component N Mean
Standard
Deviation
Standard
Error
1st 50% of evaluation based on
student performance
Instructional 25 2.28 1.060 .212
Administrative
27 3.70 1.103 .212
1st 50% of evaluation for non-
tested based on school/team
performance
Instructional 25 2.32 1.180 .236
Administrative
27 3.41 1.152 .222
2nd 50% of evaluation based on
administration observations of core
effective practices
Instructional 23 3.52 1.123 .234
Administrative
25 4.04 .841 .168
Current teachers participating in a
performance pay scale
Instructional 21 2.86 1.236 .270
Administrative
25 3.40 1.118 .224
A separate pay scale for lowest
performing schools
Instructional 19 2.47 1.219 .280
Administrative
24 3.29 1.301 .266
Overall opinion of five components
Instructional 26 11.65 5.122 1.005
Administrative 27 16.93 4.731 .910
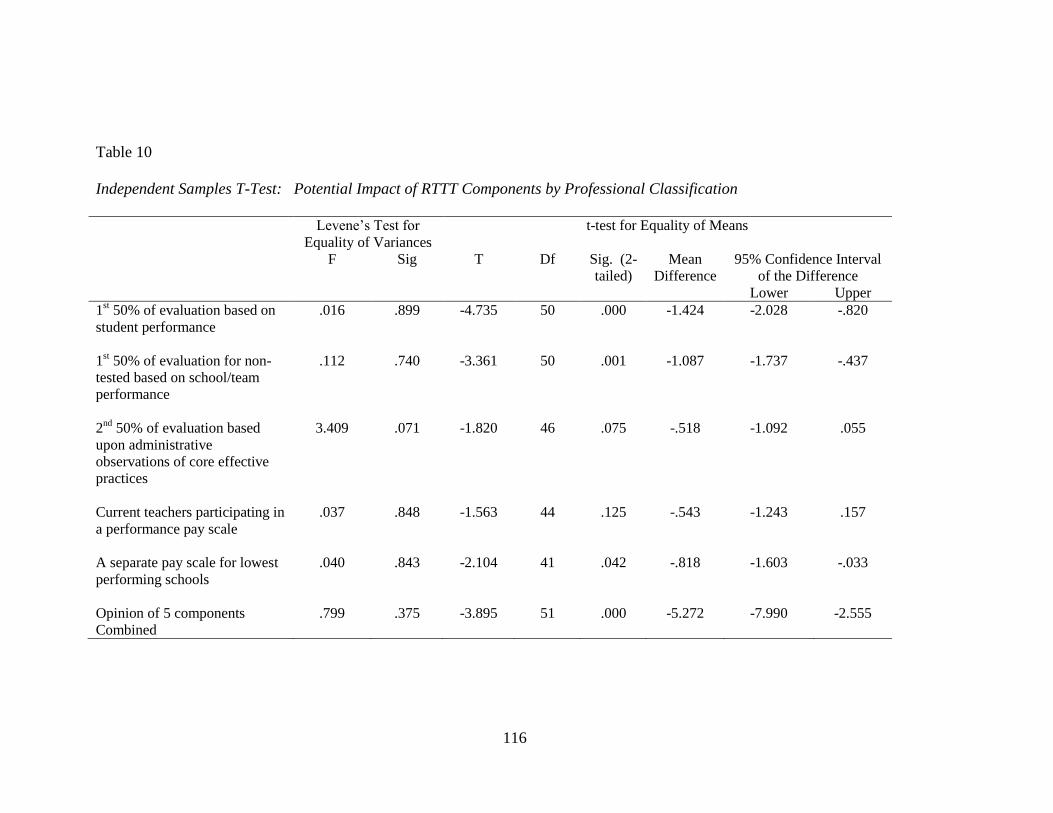
116
Table 10
Independent Samples T-Test: Potential Impact of RTTT Components by Professional Classification
Levene’s Test for
Equality of Variances
t-test for Equality of Means
F Sig T Df Sig. (2-
tailed)
Mean
Difference
95% Confidence Interval
of the Difference
Lower Upper
1st 50% of evaluation based on
student performance
.016 .899 -4.735 50 .000 -1.424 -2.028 -.820
1st 50% of evaluation for non-
tested based on school/team
performance
.112 .740 -3.361 50 .001 -1.087 -1.737 -.437
2nd
50% of evaluation based
upon administrative
observations of core effective
practices
3.409 .071 -1.820 46 .075 -.518 -1.092 .055
Current teachers participating in
a performance pay scale
.037 .848 -1.563 44 .125 -.543 -1.243 .157
A separate pay scale for lowest
performing schools
.040 .843 -2.104 41 .042 -.818 -1.603 -.033
Opinion of 5 components
Combined
.799 .375 -3.895 51 .000 -5.272 -7.990 -2.555

117
Qualitative Analysis for Research Question 2
In addition, qualitative data gathered from the responses of participants in follow-
up interviews were analyzed to further clarify and expand on the t-test data. Interviewees
were asked, “Do you think professional position (instructional or administrative) would
affect opinions on the success of the Race to the Top Grant’s impact on student
achievement or growth?” The participants’ responses were put in a tabular display and
repeated phrases were highlighted. This table can be found in Appendix F.
The qualitative data gathered in follow-up interviews supported the statistically
significant differences found regarding position classification and the opinions of the
participants of the potential impact to student achievement of the RTTT teacher
evaluation and compensation components. Three of the four follow-up interview
participants believed that position classification would affect their opinions. When
participants were asked to justify their initial responses, five themes emerged. Those
themes were: (a) teachers would have a more difficult time with these types of changes,
(b) administrators were more likely to be in favor of these types of reforms, (c) educators
would see this process through different lenses, (d) administrators would be more likely
to wait for results to make judgments, and (e) interpretations of those in charge of
implementing these changes have the potential to slant teachers and administrators in
opposite directions.

118
Change Difficult for Teachers
Three participants expressed that teachers would probably be against these types
of evaluation and compensation reforms or have a difficult time with them. Participant 1
expressed this by saying, “In my experience, teachers aren’t necessarily open to change.”
She specifically talked about the types of evaluation and compensation changes by
saying, “These types of changes, teachers will not be receptive to them.” Participant 3
continued, “It will be harder to get them (teachers) on board.”
Participant 4 believed teachers would be more negative about these types of
changes. “Many teachers will be against most of these changes.” She continued, “They
will see it as an attack on what they do. Other teachers might see it as just another thing
they will have to wait out. Referring to fads in education.”
Positive Administrator Attitudes
Participants 1 and 2 believed administrators would be more positive towards these
reforms. Participant 1 explained, “Administrators, on the other hand, have pretty much
bought into doing the things necessary to doing well academically. They will be more
willing to try methods to achieve that.” Participant 2 concisely expressed similar
thoughts, “Administrators will think these types of reforms are a good thing.”
Different Lenses
Three participants made reference to teachers and administrators having different
opinions due to the different lenses through which they would view these reforms.
Participant 2 did not believe that professional classification would affect opinions. She
119
believed that the lenses would come from the individual’s work ethic. She responded,
“Not really. I could see people having a difference of opinion, but it won’t have to
necessarily do with the classification of their jobs.” Participant 2 was asked to expand
further and responded, “Some, teachers will perceive that it is something new, but tying
compensation and evaluation to student achievement should be done. Good teachers
should want the accountability.” As for the other teachers, she said, “I think it has the
potential for being more motivational to some underperforming teachers, while other
teachers that do their best all the time will not be affected.” Participants 3 and 4 also
addressed the idea of different lenses. Participant 3 said, “This question is all about
perception. People have different lenses as to how they see things.” Participant 4
expressed a similar sentiment, “Although it shouldn’t be different, people see things
through the lens of how it affects them.”
Judging the Results
Another theme was voiced by Participant 4 who believed that administrators
would wait for results before making judgments on the impact on student achievement.
In talking about the differences between teachers and administrators, she explained,
“Administrators won’t necessarily see it that way. They will see all of this as potentially,
a lot more work. Generally, they’ll want to know how all of this will get done and what
kind of results it will bring about. Will the results come quickly?”

120
Grant-writing Concerns
Participant 3 voiced concern over the people who wrote the grant and people
sharing information about the grant and how their particular opinions would affect others.
“A key factor will be the people providing the information. Are they putting a slant on
it?” She expanded, “Information trickles down and misinformation and
misinterpretations are made.” This participant also talked about the writers of the RTTT
grant. “Another point will be ‘Who wrote the application?’. Were they slanted one way
or another on these issues?’”
Data Analysis for Research Question 3
Research Question 3: To what extent, if any, is there a difference in the opinions
of educational leaders who have different self-reported school poverty percentages about
the perceived potential impact of RTTT teacher evaluation and compensation
components on student achievement/growth?
Quantitative Analysis for Research Question 3
To answer Research Question 3, a series of six one-way analyses of the variance
(ANOVA) were performed. These were run to compare the mean scores that
corresponded to the opinions on the five RTTT components’ potential impact on student
achievement and the mean overall score on the potential impact on student achievement
of the five components combined. The participants were grouped according to one of
three different levels of school poverty percentage (0-50%, 51-74%, and 75-100%) as
indicated by their response on the STECC-RTTT.
As indicated in Table 8, in the ANOVAs performed for this analysis, no
statistically significant difference (p < .05) was found for any of the five RTTT teacher

121
evaluation and compensation components as to their potential impact on student
achievement. Similarly, no statistically significant difference was found overall for the
combined components. Therefore, no further analyses, i.e., post-hoc comparisons, were
justified between the means of the three groups.

122
Table 11
Potential Impact of Components on Student Achievement by School Poverty Level
Race to the Top (RTTT)
Selected Component
Sum of
Squares
df Mean
Square
F Sig.
1st 50% of evaluation based on
student performance
Between groups .325 2 .162 .096 .908
Within groups 70.875 42 1.688
Total
71.200 44
1st 50% of evaluation for non-
tested on school/team
performance
Between groups 2.775 2 1.287 .883 .421
Within groups 66.025 42 1.572
Total
68.800 44
2nd
50% of evaluation based
upon administrative observations
of core effective practices
Between groups .502 2 .251 .279 .758
Within groups 35.117 39 .900
Total
35.619 41
Current teachers participating in
a performance pay scale
Between groups 3.887 2 1.943 1.386 .263
Within groups 50.472 36 1.402
Total
54.359 38
A separate pay scale for lowest
performing schools
Between groups 3.837 2 1.918 1.105 .342
Within groups 62.522 36 1.737
Total
66.359 38
Opinion of five components
combined
Between groups 112.960 2 56.480 1.817 .175
Within groups 1336.975 43 31.092
Total 1449.935 45

123
Qualitative Analysis for Research Question 3
In addition, qualitative data were analyzed to supplement the information gained
from the quantitative data. Qualitative data were gathered during follow-up interviews in
response to the question, “Do you think opinions of the following components differ
depending on the schools’ percentage of free/reduced lunch students: basing 50% of a
teacher’s evaluation on student performance on an assessment program, basing the other
50% of a teacher’s evaluation on administrator observations, being able to optionally
participate in a separate performance pay scale, and having a separate pay scale for
teachers at the lower performing schools?” The participants’ responses were put in a
tabular display and repeated phrases were highlighted. This table can be found in
Appendix F.
The qualitative data for this research question indicated that the four follow-up
interview participants had similar opinions when answering the question posed. All four
participants responded that they did believe that opinions would differ depending on the
schools’ percentage of free/reduced lunch students. Four themes emerged from the
analysis of the participants responses: (a) teachers at schools with large number of
economically disadvantaged students will be nervous or worried about these types of
reform, (b) teachers at schools with large number of economically disadvantaged will see
these reform components as punitive, (c) teachers at schools that are typically high
performing may be more receptive to these changes, and (d) teachers at schools with
large numbers of economically disadvantaged students have a harder job which may go
unrecognized in this system.

124
The Concerns of High-Poverty Schools
Each of the four participants believed that teachers at high-poverty schools would
be more worried or fearful about these types of reform components. Participant 1
expressed it by saying, “Teachers in the lower-performing schools may feel differently as
they may be scared of a new system.”
Participant 2, a district administrator, had never worked at school with high
numbers of economically disadvantaged students, but had worked with those schools in
her position. She elaborated, “My answer is based on what I know now. I don’t know
how all the formulas for value-added will work. So, the lack of information is probably
scaring teachers at lower SES schools.” She also said, “I think teachers at these schools
will worry about how free/reduced status will be factored. . . It’s definitely worrisome.”
Perceptions of Punitive Reforms
Three participants also expressed that teachers at high-poverty schools would
likely feel like they were being unfairly punished or that these reforms were punitive in
nature to teachers at those schools. Participant 1 expressed, “Those teachers in the lower
performing schools may feel penalized by their choice to work at a school that may have
them being paid less or evaluated wrongfully.” Participant 2 concurred, saying “Teachers
at these schools will worry about their results being the same and being penalized.”
Participant Four adamantly warned that punitive measures do not work as effective
reform. “Punitive measures haven’t worked in changing the culture of the school.”

125
The Concerns of High-Performing Schools
Only one participant expressed a sentiment about teachers at low-poverty schools
or what she termed “high-performing.” Participant 1 believed that teachers at high-
performing schools would be more receptive to these types of reforms. “Teachers in
high-performing schools will be more agreeable to these types of changes. Those
teachers may already feel they are doing a good job and will not have a problem with a
different evaluation and pay scale that reflects that.”
The Concerns for Recognition
The final theme that emerged in analyzing this research question was a concern
over teachers whose worth and work may not be recognized. All four participants hinted
that they believed the job of a teacher at a school with larger numbers of economically
disadvantaged students was more difficult than that of a teacher with low numbers of
economically disadvantaged students. Participant 3 expressed it clearly by saying, “The
hardest thing to reconcile is at high-poverty schools there are other concerns than
academics.” In regard to hard work going unrecognized, she said, “It will be difficult to
justify a system like this to teachers at high-poverty schools without knowing how gains
will be shown or measured.” Participant 4 had previously gained experience at schools
with large percentages of economically disadvantaged students. A summary statement of
hers was, “Teachers at high-poverty schools are mostly tired of being trampled on for
their good-faith efforts to educate the students at their school.”
126
Data Analysis for Research Question 4
Research Question 4: To what extent, if any, is there a difference in the opinions
of educational leaders who have different self-reported school poverty percentages about
the perceived potential impact of RTTT teacher evaluation and compensation
components on student achievement/growth at high-poverty schools?
Quantitative Analysis for Research Question 4
To answer Research Question 4, a series of six one-way analyses of the variance
(ANOVA) were performed. These were run to compare the mean scores that
corresponded to the opinions of participants on the five RTTT components’ potential
impact to student achievement at high-poverty schools and the mean overall score on the
potential impact to student achievement at high-poverty schools of all five components
combined. As with Research Question 3, participants were grouped according to one of
the three different levels of school poverty percentage (0-50%, 51-74%, and 75-100%) as
indicated by their response to the STECC-RTTT.
As indicated in Table 9, in the ANOVAs performed for these analyses, no
statistically significant difference (p < .05) was found for any of the five RTTT teacher
evaluation and compensation components as to their potential impact on student
achievement/growth at high poverty schools. Similarly, no statistically significant
difference was found overall for the combined components. Therefore, no further
analyses, i.e., post-hoc comparisons, were justified between the means of the three
groups.

127
Table 12
Potential Impact of Components on Student Achievement at High Poverty Schools by
School Poverty Level
Race to the Top (RTTT)
Selected Component
Sum of
Squares
df Mean
Square
F Sig.
1st 50% of evaluation based on
student performance
Between groups 2.912 2 1.456 .893 .417
Within groups 70.067 43 1.629
Total
72.978 45
1st 50% of evaluation for non-
tested on school/team
performance
Between groups 1.029 2 .515 .327 .723
Within groups 67.775 43 1.576
Total
68.804 45
2nd
50% of evaluation based
upon administrative observations
of core effective practices
Between groups .423 2 .211 .206 .815
Within groups 41.019 40 1.025
Total
41.442 42
Current teachers participating in
a performance pay scale
Between groups 1.521 2 .760 .555 .579
Within groups 52.089 38 1.371
Total
53.610 40
A separate pay scale for lowest
performing schools
Between groups 1.819 2 .909 .443 .646
Within groups 78.084 38 2.055
Total
79.902 40
Opinion of five components
combined
Between groups 58.109 2 29.054 .906 .412
Within groups 1378.500 43 32.058
Total 1436.609 45
128
Qualitative Analysis for Research Question 4
Qualitative data were analyzed to supplement the information gained from the
quantitative data. This qualitative data was collected during follow-up interviews in
response to the question, “Do you personally think that the teacher evaluation and
compensation process can be used as a tool to help improve achievement at high-poverty
schools?” The participants’ responses were put in a tabular display and repeated phrases
were highlighted. This table can be found in Appendix F.
All four participants responded positively to this question, and three themes
emerged to enhance the results of the quantitative analyses for this research question.
Those themes were: (a) teacher evaluation and compensation reform can be used to
improve achievement at high-poverty schools if the implementation is done correctly, (b)
teacher evaluation and compensation reform can be used to improve achievement at high-
poverty schools if it used along with other known successful reforms, and (c) an opinion
exists that teachers at high-poverty schools should be paid more.
The Need for Careful Implementation
Three of the participants (Participants 1, 3, and 4) responded with hesitation to
this question and used qualifiers to explain why they had responded the way they had.
Participant 1’s answer was dependent on the effectiveness of the implementation of the
RTTT grant components concerning teacher evaluation and compensation. In her
opinion, proper implementation would have to be ensured by administrators. “If
administrators provide the support, the professional development, and show the follow-
through of inspecting what they expect, then these reforms can make a difference.”

129
Participant 1 warned, “Without giving professional development and without
regular observations and feedback, these types of reforms won’t help anywhere.” She
continued, “Mistakes will happen if critical steps in the change process are skipped.”
Reform Supplemented by Other Effective Practices
Participants 3 and 4 believed that teacher evaluation and compensation reform
could be used along with other known effective practices to raise achievement at high-
poverty schools. Participant 3 said referring to teacher evaluation and compensation
reform, “It only has a chance of helping if the system is diagnostic of both student and
teacher needs and then puts systems in place to help meet the needs.” She explained,
“Will gaps in teacher performance and student learning be filled? That’s the important
question. Figure out the needs, work to meet them, then the system will be successful.”
Participant 4 also responded with a qualifier. “I say ‘Yes’ with the understanding that
evaluation is only one piece of the puzzle. It won’t work alone.” She explained what
some of those other components are. “Capturing the attention of the community and
coordinating resources to help families of those schools is just as, if not more, important
than teacher evaluation. There are many other pieces such as leadership, transforming
the climate and culture, and curriculum improvements that will be required to help lower
SES schools.”
Compensation at High-Poverty Schools
Participant 2 was the only participant who made direct reference to the teacher
compensation components. This participant expressed that teachers at high-poverty

130
schools should be paid more than other teachers for the additional work and challenge
that their job presented as long as there was accountability. “These teachers should be
paid more as long as there is a tie to student achievement. This will ensure that better
results and a challenging job are being rewarded properly.”
Additional Analyses
As an additional statistical analysis, the researcher compared the responses of the
two groups of doctoral students, Education (non-administrative preparation) and
Educational Leadership (executive leadership preparation). These analyses were done as
a natural follow-up to this study even though the research questions did not ask about the
differences between the two groups of doctoral students. T-tests were performed to
compare the mean scores of Education students with those of Educational Leadership
students on each of the five RTTT components’ potential impact on student achievement
at high-poverty schools and the overall mean score on the potential impact on student
achievement at high-poverty schools when all five components were combined.
As indicated in Tables 10 and Table 11, there was a difference in scores for all six
comparisons between educators pursuing a doctorate in education (non-administrative
preparation) and educators who were pursuing a doctorate in educational leadership
(executive leadership preparation). This difference was found at a significant level (p <
.05). Equal variances were assumed in all of the RTTT teacher evaluation and
compensation components for this analysis with exception of the component of the
second 50% of the teachers’ evaluations being based on administrative observation of

131
core effective practices (Levene’s Sig. = .007). As similar mean scores were found, the
results for these t-tests mirrored the results for Research Question 2.
Statistical significance was found in the difference between the mean scores of
participants enrolled in the Ed. D. in Education and the Ed. D in Educational Leadership
programs as to their opinions of the RTTT components and the potential impact on
student achievement at high-poverty schools for all five of the selected components. A
significant difference was found for the component requiring the first 50% of teachers’
evaluations to be based on student performance on a statewide assessment program. The
difference between the responses of the two groups, the Ed. D. in Education (M = 2.18,
SD = 1.10) and the Ed. D. in Educational Leadership (M = 3.29, SD = 1.24); t(51)= -3.35,
p < .05 (two tailed), was found to have a magnitude of the difference in means (mean
difference = -1.11, 95% CI: -1.77 to -0.45) that was large (eta squared = .18).
The next RTTT component for which there was a significant difference was that
the first 50% of evaluations for teachers who taught non-tested subjects be based on
school-wide or team performance on a statewide assessment program. The difference
between the responses of the two groups, Ed. D. in Education (M = 2.23, SD = 1.10) and
the Ed. D. in Educational Leadership (M = 3.19, SD = 1.17); t(51) = -3.03, p < .05 (two
tailed), was found to have a magnitude of the difference in means (mean difference = -
0.97, 95% CI: -1.60 to -0.33) that was large (eta squared = .15).

132
Table 13
RTTT Components' Potential Impact on Student Achievement by Ed. D. Program
Race to the Top (RTTT) Selected
Component N Mean
Standard
Deviation
Standard
Error
1st 50% of evaluation based on
student performance
Education (non-administrators) 22 2.18 1.097 .234
Educational Leadership
(administrators)
31 3.29 1.243 .223
1st 50% of evaluation for non-
tested based on school/team
performance
Education (non-administrators) 22 2.23 1.110 .237
Educational Leadership
(administrators)
31 3.19 1.167 .210
2nd 50% of evaluation based on
administration observations of core
effective practices
Education (non-administrators) 19 2.89 1.243 .285
Educational Leadership
(administrators)
30 3.87 .860 .157
Current teachers participating in a
performance pay scale
Education (non-administrators) 19 2.58 1.121 .257
Educational Leadership
(administrators)
28 3.29 1.084 .205
A separate pay scale for lowest
performing schools
Education (non-administrators) 17 2.53 1.419 .344
Educational Leadership
(administrators)
28 3.39 1.315 .248
Overall opinion of five components
Education (non-administrators) 22 11.09 5.300 1.130
Educational Leadership
(administrators) 31 16.26 5.285 .949

133
Table 14
Independent Samples T-Test: Potential Impact of RTTT Components by Ed. D. Program
Race to the Top (RTTT)
Selected Component
Levene’s Test for
Equality of Variances
t-test for Equality of Means
F Sig T Df Sig. (2-
tailed)
Mean
Difference
95% Confidence Interval
of the Difference
Lower Upper
1st 50% of evaluation based on
student performance
2.326 .133 3.355 51 .002 -1.109 -1.772 -.445
1st 50% of evaluation for non-
tested based on school/team
performance
.436 .512 -3.031 51 .004 -.966 -1.606 -.326
2nd
50% of evaluation based
upon administrative
observations of core effective
practices
8.041 .007 -2.986 28.936 .006 -.972 -1.638 -.306
Current teachers participating in
a performance pay scale
.104 .748 -2.164 45 .036 -.707 -1.365 -.049
A separate pay scale for lowest
performing schools
.250 .620 -2.073 43 .044 -.863 -1.703 -.023
Opinion of 5 components
Combined
.162 .689 -3.503 51 .001 -5.167 -8.128 -2.206

134
The third RTTT component that was found to have a significant difference was
the second 50% of teachers’ evaluations based on administrative observation of core
effective practices. The difference between the responses of the two groups, the Ed. D. in
Education (M = 2.89, SD = 1.24) and the Ed. D. in Educational Leadership (M = 3.87,
SD = .86); t(29) = -2.99, p < .05 (two tailed), was found to have a magnitude of the
difference in means (mean difference = -0.97, 95% CI: -1.64 to -0.31) that was large (eta
squared = .16).
The fourth RTTT component for which a significant difference was found was in
giving an option for current teachers to participate in a performance pay scale. The
difference between the responses of the two groups, the Ed. D in Education (M = 2.58,
SD = 1.12) and the Ed. D. in Educational Leadership (M = 3.29, SD = 1.08); t(45)= -2.16,
p < .05 (two tailed), was found to have a magnitude of the difference in means (mean
difference = -0.71, 95% CI: -1.37 to -0.05) that was moderate (eta squared = .09).
The fifth RTTT component for which a significant difference was found was
related to a separate pay scale for teachers at the lowest performing schools. The
difference between the responses of the two groups, the Ed. D. in Education (M = 2.53,
SD = 1.42) and the Ed. D. in Educational Leadership (M = 3.39, SD = 1.32); t(43)= -2.07,
p < .05 (two tailed), was found to have a magnitude of the difference in means (mean
difference = -0.86, 95% CI: -1.70 to -0.02) that was moderate (eta squared = .09).
For the RTTT component of giving an option for current teachers to participate in
a performance pay scale, no significant difference was found between the means of the
two groups, the Ed. D. in Education (M = 2.86, SD = 1.25) and the Ed. D. in Educational
Leadership (M = 3.40, SD = 1.12); t(44)= -1.56, p > .05 (two tailed). The magnitude of

135
the difference in means (mean difference = -.54, 95% CI: -1.24 to .16) was small (eta
squared = .05).
Statistical significance was found in the difference between Education and
Educational Leadership doctoral students’ overall mean scores that combined the scores
associated with opinions of the RTTT components and the potential impact on student
achievement at high-poverty schools. Participants who indicated that they were enrolled
in the Ed. D. in Education program had a mean score that was lower than did participants
who were enrolled in the Ed. D. in Educational Leadership program. The difference
between the Ed. D in Education group (M = 11.09, SD = 5.30) and the Ed. D. in
Educational Leadership group (M = 16.26, SD = 5.29); t(51) = -3.50, p < .05 (two tailed)
was found to have a magnitude of the difference in means (mean difference = -5.17, 95%
CI: -8.13 to -2.21) that was large (eta squared= .19).
Summary
In this chapter, the mixed-methods procedures that yielded the results for the
analysis of both quantitative and qualitative data were described. This was followed by
the presentation of the descriptive statistics for both categorical and continuous variables.
The variables discussed were the variables used in the quantitative analysis of the
research questions. The analysis of qualitative data served to enhance and supplement
the quantitative analyses. Additional analyses were conducted to examine differences, if
any, in the two groups for which data were analyzed.

136
Chapter 5 contains a summary and discussion of the findings of the study. The
implications of this mixed-methods study and recommendations for future research are
also discussed.

137
CHAPTER 5
SUMMARY, IMPLICATIONS, AND RECOMMENDATIONS
Introduction
This chapter contains a restatement of the purpose of the study and a brief review
of the research design, the population, and the instrumentation used to conduct the study.
The remainder of the chapter is devoted to a summary and discussion of the findings
organized around the four research questions, implications for policy and practice, and
recommendations for future research.
Purpose of the Study
The purpose of this study was to explore the professional opinions of educational
leaders (both instructional and administrative) regarding selected components in the Race
to the Top (RTTT) grant concerning teacher evaluation and compensation and the
performance of students at schools with a percentage of economically disadvantaged
students of 75% or higher. The professional opinions of educational leaders at different
types of schools were sought to help understand the different challenges the new
elements found in the RTTT grant would have in improving student achievement.
Population, Research Design, and Instrumentation
For this study, a target university was selected that had Ed. D. students who were
professionals in the field who were pursuing their doctorates in either Education (non-
administrative) or Educational Leadership (administrative). The desire to achieve an
advanced degree and to grow academically made them an ideal group of educational
138
leaders for study of their opinions. Using this population, a mixed-methods study
involving the collection of quantitative and qualitative data was conducted to analyze the
professional opinions of educational leaders in central Florida in regard to RTTT grant
components.
The researcher designed a survey, the Electronic Survey of the Implementation
and Impact of Teacher Evaluation and Compensation Components from the Race to the
Top Grant (STECC-RTTT) which yielded the quantitative data used in the analysis. The
instrument was administered to 54 participants, 27 of whom reported their professional
classification as instructional. The remaining 27 participants indicated their professional
classification as administrative. Of those doctoral students participating, 22 represented
the Ed. D. in Education (non-administrative) program, and 31 represented the Ed. D. in
Educational Leadership (administrative) program. To gather qualitative information, the
researcher interviewed four participants concerning RTTT teacher evaluation and
compensation components. Interview questions were designed to elicit additional
information to enhance the quantitative data collection regarding the four research
questions.
Summary and Discussion of the Findings
The findings for each of the four research questions of this mixed-methods study
are discussed in this section. Quantitative results and qualitative themes that emerged are
discussed, and the agreement, or lack thereof, of the findings of this study with those of
other authors and researchers are noted.
139
Research Question 1
To what extent, if any, is there a relationship between the self-reported knowledge
of the RTTT grant and the perceived fairness of the RTTT grant concerning teacher
evaluation and compensation?
The quantitative findings from a series of three Pearson product-moment
correlation coefficients suggested that a statistically significant relationship did not exist
between the self-reported knowledge and the fairness of the RTTT grant concerning
teacher evaluation and compensation. The qualitative findings of the follow-up
interviews also supported that knowledge of the RTTT grant did not influence opinions
of participants about the RTTT grant components concerning teacher evaluation and
compensation. Three themes emerged from the qualitative findings.
The first theme was a lack of understanding or information about the RTTT grant.
This theme’s emergence suggested that in the summer of 2011, there was not enough
information for opinions on fairness of the RTTT grant concerning teacher evaluation and
compensation to be related to the knowledge of the RTTT grant.
Similar to the first theme, the second theme indicated the details provided about
the implementation of the grant were inadequate. The emergence of this theme suggested
that the implementation of the RTTT grant and the details about it had either not yet been
created or had suffered from insufficient communication. Without this critical
information, perceptions of fairness of the RTTT grant components concerning teacher
evaluation and compensation and knowledge of the RTTT grant could not be established.
The third theme that emerged from the qualitative analysis for this research
question was the political nature of the RTTT grant. This theme’s emergence suggested

140
that because of the politics involved with the RTTT grants, perceptions of the fairness of
the grant components concerning teacher evaluation and compensation may have already
been established regardless of knowledge of the RTTT grant. The emergence of this
theme supports some of the contentions made by Nicholson-Crotty and Staley (2012)
about the political nature of the RTTT grant. Their contention was that states applied for
the RTTT grant due to political motivations rather than to satisfy monetary needs or
improve student achievement.
It should be noted that these findings may be limited by the nature of the sample
size and the lower response rate than expected. In addition, the STECC-RTTT and the
follow-up interview were both conducted in summer of 2011, at which time there had
been limited implementation work on the RTTT grants by school districts and the state
department of education. Thus, participants may not have had sufficient time to
adequately form their opinions.
Research Question 2
Research Question 2: To what extent, if any, is there a difference between the two
professional classification groups’ opinions about the perceived potential impact of the
RTTT teacher evaluation and compensation components on student achievement/growth?
The quantitative findings from a series of six independent sample t-tests
suggested that a significant difference existed between the opinions of participants whose
professional classification was instructional and administrative about three of the RTTT
components involving teacher evaluation and compensation. A significant difference
was not found in the opinions of two of the components of the RTTT grant concerning
teacher evaluation and compensation reform. Overall, however, a significant difference
141
was found between the opinions of instructional and administrative participants’ as
evidence by mean combined scores of the selected RTTT components. From qualitative
data analysis, five different themes emerged which added further support for the
quantitative results.
In the quantitative analysis, a significant difference was found between
instructional and administrative participants for the component requiring that the first
50% of teachers’ evaluations be based on student performance on a statewide assessment
program. Instructional educators believed that this type of reform would have a negative
impact on student achievement. In contrast, administrator’s opinions were that this type
of reform would impact student achievement in a positive way.
Similarly, a significant difference was found in the quantitative analysis for the
component that requires the first 50% of evaluations of teachers of non-tested subjects be
based on school-wide or team performance on a statewide assessment program.
Instructionally based professionals believed that requiring the evaluation of teachers who
do not teach tested subjects to have half of their evaluation based on school-wide or team
performance on a statewide assessment program would have a negative impact on student
achievement. However, administrative based professionals took an opposite position,
believing this type of reform would have a positive impact on student achievement.
The third component for which a statistically significant difference was found in
the quantitative analysis was the component that requires a separate pay scale for teachers
at the lowest performing schools. The findings suggested that instructionally based
educational leaders believed this would more likely have a negative impact on student

142
achievement, but administrators believed this would more likely have a positive impact
on a student achievement.
There was no statistically significant difference between the opinions of
instructional participants and administrative participants for two of the RTTT
components: (a) the second 50% of teachers’ evaluations being based on observation of
core effective practices by administrators and (b) the component that gives an option for
current teachers to participate in a performance pay scale. Prior to RTTT reforms,
teacher evaluations were based upon administrator observations. Similar prior
experiences of both instructional and administrative leaders could account, in part, for
this non-significance. Also, the performance pay scale’s implementation was still a
couple of years in the future at the time of this study, and the lack of information and
detail about performance pay could have influenced opinions.
A statistically significant difference was found between the two groups when their
scores associated with their opinions for each of the five RTTT components were
combined. This suggested that, overall; non-instructional administrators were more
receptive and positive to these types of reforms than were their instructional colleagues.
The qualitative results seem to support much of the quantitative findings. For
example, one of the themes that emerged from the qualitative analysis was that teachers
would have a difficult time with these types of changes. This implied that teachers were
more content with the status quo. In addition, the second theme that emerged was that
administrators would be more likely in favor of these types of reforms.
However, there was some indication, based on the qualitative analysis, that
results-oriented administrators might then to hold off opinions or judgments until more

143
definitive results were available. Another theme that supported the difference between
instructional and administrative professional opinions was the concept of lenses. Those
interviewed believed educators would see these changes through different lenses and
form different opinions on them. These lenses could be influenced by position as well as
other factors like work ethic. Finally, the dissemination of information and the writing of
the grant could play a factor in the lenses. Different slants could be put on the reforms
that could cause opinions of the grant to fall one way or another.
The quantitative and qualitative results both suggested that differences of opinions
exist between instructional and administrative educators on the RTTT components
concerning teacher evaluation and compensation. The opinions of instructional mirror
some of the perceptions found in Bent’s (1993) study and Chaplin et al.’s (2009) study.
It also adds to those studies by explaining the differences between instructional and
administrative personnel. These findings also mirror the results of Bastarache’s (2000)
study that found that teachers were more negative about the ability of evaluation to
improve instruction than principals.
Research Question 3
To what extent, if any, is there a difference in the opinions of educational leaders
who have different self-reported school poverty percentages about the perceived potential
impact of RTTT teacher evaluation and compensation components on student
achievement/growth?
The quantitative results from a series of six one-way analyses of the variance
(ANOVA) that were performed indicated that there was not a statistically significant
difference between the opinions of educational leaders who had different self-reported
144
school poverty percentages about the potential impact of RTTT teacher evaluation and
compensation components on student achievement. This suggested that educators at
different poverty level schools would not necessarily have a difference in opinion about
these types of reforms.
However, based on qualitative analysis from the follow-up interviews, themes
emerged that suggested the opposite. Those themes that emerged were: (a) teachers at
schools with large number of economically disadvantaged students will be nervous or
worried about these types of reform, (b) teachers at schools with large number of
economically disadvantaged will see these reform components as punitive, (c) teachers at
schools that are typically high performing may be more receptive to these changes, and
(d) teachers at schools with large numbers of economically disadvantaged students have a
harder job which may go unrecognized in this system.
The qualitative results suggested that results from the quantitative analysis may
need further examination. Coupled together, the quantitative and qualitative results
suggested that educational leaders at all types of poverty schools have similar opinions
about these components and their opinions have more to do with other lenses than school
poverty percentages.
Another possible reason for the conflict between the quantitative and qualitative
analysis could be the small sample size and the poverty levels of participants’ schools.
Also, the instrumentation (STECC-RTTT) used in the study called for three poverty-level
categories (0-50%, 51-74%, or 75-100%). Further categorization may have been helpful
in identifying potential differences.

145
Research Question 4
Research Question 4: To what extent, if any, is there a difference in the opinions
of educational leaders who have different self-reported school poverty percentages about
the perceived potential impact of RTTT teacher evaluation and compensation
components on student achievement/growth at high-poverty schools?
To answer Research Question 4, a series of six one-way analyses of variance
(ANOVA) were found. It was found that there was no difference in the opinions of
educational leaders who had different self-reported school poverty percentages about the
perceived potential impact of RTTT teacher evaluation and compensation components on
student achievement at high poverty schools. This suggested that educators at different
poverty-level schools would not necessarily have a difference in opinion about the types
of reforms and their potential impact on student achievement at high-poverty schools.
Based on the qualitative analysis of follow-up interviews, themes emerged that
suggested that it may be possible for these types of reforms to be used to help improve
student achievement at high-poverty schools. Those themes that emerged were: (a)
teacher evaluation and compensation reform can be used to improve achievement at high-
poverty schools if the implementation is executed correctly, (b) teacher evaluation and
compensation reform can be used to improve achievement at high-poverty schools if it is
used along with other known successful reforms, and (c) an opinion exists that teachers at
high-poverty schools should be paid more. These findings supplement the contentions of
Kolbe and Rice-King (2012) and Rivkin et al. (2005) that personnel policies and
compensation of teachers can be used as effective tools for improving the achievement of
economically disadvantaged students. In addition, these findings help to enhance the

146
findings of Donaldson (2009) who explained the best approaches to improve evaluation
of teachers. These included an extended development phase; valid, reliable instruments;
multiple measures; robust professional development for evaluators and teachers;
accountability, incentives, and support for evaluators; and integration within a human
capital system.
As the RTTT grant and the components concerning teacher evaluation and
compensation were still in the early stages of implementation at the time of this study,
details about these components were limited. This may have affected responses on the
STECC-RTTT and limited the ability to find a difference of opinion between educators at
different poverty leveled schools. However, the lack of a quantitative statistically
significant difference should not necessarily be interpreted as a rejection of these types of
reforms as a tool to increase student achievement at high-poverty schools. Nor should
the themes that emerged be a clear endorsement of using these types of components. The
themes that emerged from the qualitative analysis were clear that the implementation of
these types of reforms must be carried out with care and be a part of the overall reforms
that must be made to improve student achievement at high-poverty schools.
Implications for Policy and Practice
With the implementation of the RTTT grant, teacher evaluation and compensation
reform has officially been brought to the state of the Florida. Based on the findings of
this study, five basic implications that can apply to school-level educators, district-level
educators, and the state-level educators in charge of the implementation of the RTTT
147
grant are offered. Each of the five implications will be discussed as to how they might
apply to educational policy or practice.
1. More information and details about Race to the Top (RTTT) grants need to be
communicated. State-level educators in charge of the implementation of the
RTTT grant should realize that with these types of reforms, a high level of
communication must be maintained. Since details were found to be lacking at
the district and school levels, it may be advisable for state level officials to
employ various methods of getting those details concerning teacher evaluation
and compensation out to the districts. District-level school officials will need
to communicate these upcoming reforms on a regular basis and build the
capacity and structure for school-level personal to receive their
communication. School-level educators must be prepared with adequate
information and resources to find the information that they may be lacking.
Because the potential results of these components would be seen at the school
level, getting sufficient information to both instructional and administrative
educational leaders will be of the utmost importance.
2. The different lenses through which these reforms are viewed by instructional
educators and administrative educators should be considered. Knowing that
there are different lenses that educators will be using to process these reforms,
it will be important for state level and district level personnel associated with
the RTTT grant to become familiar with as many lenses as possible. Carefully
considering information and being proactive about the implementation of
these reforms will be well received by those responsible for implementation

148
and will go a long way in helping these reforms have a chance of improving
student achievement. These reforms are under way and school level educators
must be ready for them.
3. Teachers are nervous about how these reforms will potentially affect them.
Teachers are leery of these reforms. State, district, and school-based
administrators must do their best to ensure that these reforms are as
transparent as possible. Negative viewpoints of these types of measures exist
and must not be swept aside or ignored. Open question and answer sessions
could be made available to respond to negative and positive aspects of these
types of reforms. Showcasing benefits of these reforms may help in
alleviating some of the worry.
4. More information is needed on how fairness to teachers at high-poverty
schools will be achieved. Linking 50% of evaluation and eventually teacher
compensation to student performance on a state assessment system has the
potential to be troubling to many educators at high-poverty schools. These
concerns must be taken into account, and reassurance needs to be provided to
concerned teachers. In order for these reforms to be successful, fairness to all
teachers must be ensured. When creating or adopting a value-added formula,
state level officials must take into consideration the difficulty that
economically disadvantaged students have on state assessments.
5. Care must be taken in implementing these reforms along with other known
successful reforms to improve achievement at high-poverty schools. In this
study, it has been found that the reforms to teacher compensation and
149
evaluation are not enough. Implementation will have to include the proper
professional development, transparency, follow-through, and other
components not necessarily addressed in the RTTT grant. Successful
practices exist that improve student achievement at high poverty schools such
as standards-based data driven reform (Anderson & Welsh, 2000) and early
intervention and acceleration (Borman, 2003) Some of the effective practices
that could be considered are diagnostic intervention, coordinating resources in
the community, and making curriculum changes. Incorporating teacher
evaluation and compensation as a piece of those practices, and not the only
practice, will help improve chances of improving student achievement.
Recommendations for Further Research
The following recommendations for future research are offered in light of the
findings of the present study.
1. A qualitative case study could be conducted using one or more districts and
the implementation of the RTTT grant. This would help to generate data on
how implementation of these teacher evaluation and compensation
components could be successfully accomplished. In a few years, quantitative
data could be included to show which type of implementation strategies
yielded the best student achievement results.
2. The study could be replicated using a greater sample size. This would permit
a reconsideration of opinions of educational leaders on the RTTT components
based on different poverty leveled schools and might further explain the

150
contradiction between the quantitative and qualitative findings regarding these
differences. A study that determines the level of poverty as either high or low
instead of the STECC-RTTT’s use of three levels of school poverty might
yield different results and a significant difference.
3. Only three RTTT components were studied in this research. Opinions about
other components could be explored to determine how they might impact
student achievement.
4. This study could be replicated periodically throughout the implementation of
the RTTT grant and even post-grant. This could yield valuable information in
understanding teacher evaluation and compensation reform.
5. In order to increase the participation rate, a study could be conducted that did
not limit itself to the university setting and solicited help from the area school
districts. In addition, changes to data collection procedures could be made. A
researcher could potentially increase the participation rate by visiting doctoral
level classes and personally make the request for volunteer participation in
addition to the request via email distribution.
6. The qualitative portion of this mixed-methods designed study yielded some
results that could possibly be expanded upon. Further study could include a
larger pool of potential interviewees to gather greater amounts of qualitative
data.
7. Statistically significant differences were found in the opinions of instructional
and administrative leaders. These differences could be further investigated in
151
a quantitative, qualitative, or mixed-methods study to determine why specific
differences exist.
Limitations of the Study
There are several limitations which should be noted by those interpreting the
results of this research. Though the researcher was careful in the design of the research,
several limitations emerged during the course of the study. Inferences based on the
results of the research should be made only after considering the following:
The participation rate was less than expected in both the quantitative and
qualitative portions of the study. Though every attempt was made to increase the sample
size in the quantitative portion of the research, email software at the target university was
imprecise and made determining numbers of students contacted and final return rates
difficult. The participation in the qualitative portion was also low. Although 14
participants indicated that they would be willing to take part in the follow-up interview,
the researcher was only able to get in contact with four.
This study was limited to one target university and one region, and the survey
responses and follow-up interviews were generated prior to the implementation of the
RTTT grant in August 2011. At that time, limited information had been disseminated to
educational leaders.
Conclusion
In this study, the researcher expanded the initial research on the RTTT grant and
other previous research that explored teacher evaluation and compensation reform. This

152
study was conducted to address the impact of the teacher evaluation and compensation
reform on student achievement at high-poverty schools. To accomplish this, the opinions
of instructional and administrative educational leaders in central Florida were sought
using a researcher-created survey to gather quantitative data and a follow-up interview
protocol for qualitative information prior to implementation of the RTTT grant.
Though this study provided baseline data on the opinions of educational leaders
on the RTTT teacher evaluation and compensation components, there is still much to be
learned about the RTTT grant. The initial split opinions regarding RTTT along
professional classification lines have, in a sense, pitted teachers against administrators.
Questions remain: Will the grant continue to be divisive once results begin to be known?
Will the grant have the impact on student achievement, in particular student achievement
of economically disadvantaged students, that was intended? The opinions of educational
leaders (instructional and administrative) should continue to be sought in future research,
as the actions of these leaders could make RTTT a successful federal program. The care
with which these leaders implement teacher evaluation and compensation reforms will be
essential to the program’s success and should include other proven types of reforms in
order to improve student achievement at high-poverty schools.

153
APPENDIX A
ELECTRONIC SURVEY OF THE IMPLEMENTATION AND IMPACT OF
TEACHER EVALUATION AND COMPENSATION ELEMENTS
FROM THE RACE TO THE TOP GRANT

154
Electronic Survey of the Implementation and Impact of Teacher Evaluation and
Compensation Components from the Race to the Top Grant
Race to the Top (RTTT) is a competitive grant awarded to the state of Florida to reform schools. Your professional opinion is
needed to determine the potential effectiveness of these components on student growth and success which may influence
evaluation and compensation for educators.
Directions: Please fill in or select the appropriate response for each item.
Part A: Demographic Information
Gender: Female Male
Position Title:
Professional Classification: Administrative (principal, assistant principal, district Instructional (teacher, coach)
Other
School Level: Elementary Middle High District Other (please specify)
Percentage of Free/Reduced Lunch at Current or Last School:
0-50% 51-74% 75%-100% N/A
School District if Applicable:
Graduate Degree Program: (Drop-down selection): Ed. D. in ______, Executive Ed. D. in _______, Ed. S. in _______, M. Ed. in
_________, other

155
Part B: Race to the Top Background Information(5 Minutes)
Where have you received your information on the Race to the Top Grant? Select all that apply.
District Officials District Presentation Colleagues
Graduate Classes Guest Speakers State Conferences
State Conference Calls FEA (or local union) Publications Media/News
Educational Journals/Publications FL DOE Website U.S. DOE Website
Email Communication from Race to the Grant Officials Other (please specify)______________________
Rate Your Knowledge of the Race to the Top Grant using the following scale.
1 2 3 4 5
No Knowledge
(Have not heard of the
Race to the Top Grant)
Little Knowledge Moderate Knowledge Great Knowledge Expert Knowledge
(Can facilitate a seminar
on the Race to the Top
Grant)
Based on your knowledge of the Race to the Top Grant, rate the fairness of the grant concerning the following two items.
Teacher Evaluation Extremely Fair Fair Neutral Unfair Extremely
Unfair
Not Enough
Information to Rate
Teacher
Compensation
Extremely Fair Fair Neutral Unfair Extremely
Unfair
Not Enough
Information to Rate

156
Part C: Race to the Top Teacher Evaluation and Compensation Components Improvement
of Student Achievement (5 Minutes)
Rate the potential impact of the Race to the Top Grant components on student achievement.
Teacher Evaluation and Compensation
Components from the Race to the Top Grant
Strong
Positive
Impact
Positive
Impact
No
Impact
Negative
Impact
Strong
Negative
Impact
Not
Enough
Information
The first 50% of Teacher Evaluation/Appraisal
will be based on student performance on a
Statewide Assessment Program.
The first 50% of Teacher Evaluation/Appraisal of
those who teach a subject or level in which
students are not tested will be based on school-
wide or team performance
The second 50% of Teacher Evaluation/Appraisal
will be based on administrator observations of core
effective practices and one additional metric.
Teachers will be able to optionally participate in a
separate performance pay scale (Merit Pay).
Teachers at the lowest performing schools will be
given a separate pay scale.

157
Part D: Race to the Top Teacher Evaluation and Compensation Components Improvement of Student
Achievement at High Poverty Schools(5 Minutes)
Rate the potential impact of the Race to the Top Grant components on student achievement at schools with
poverty rates of 75% or more.
Teacher Evaluation and Compensation
Components from the Race to the Top Grant
Strong
Positive
Impact
Positive
Impact
No Impact Negative
Impact
Strong
Negative
Impact
Not Enough
Information
The first 50% of Teacher Evaluation/Appraisal
will be based on student performance on a
Statewide Assessment Program.
The first 50% of Teacher Evaluation/Appraisal of
those who teach a subject or level in which
students are not tested will be based on school-
wide or team performance
The second 50% of Teacher Evaluation/Appraisal
will be based on administrator observations of core
effective practices and one additional metric.
Teachers will be able to optionally participate in a
separate performance pay scale (Merit Pay).
Teachers at the lowest performing schools will be
given a separate pay scale.

158
Part E: Additional Information
Please share anything else you believe would be helpful for understanding the potential impact to RTTT or
assist with implementation?
Would you agree to a follow-up phone interview?
If yes, please include your contact information.
Name
Phone Number

159
APPENDIX B
COLLEGE OF EDUCATION PERMISSION TO CONDUCT RESEARCH

160
Dan,
All surveys of grad students have to have the approval from Dr. Culp
and he has approved yours.
When the proposal is approved, it would be good form to send him the
final proposal and survey for his records and thank him for the
approval.
Take care,
Rose
Dr. Taylor
The protocol for this project has my approval.
Best wishes for a successful project.
Rex
Rex E. Culp, PhD, JD
Associate Dean for Research and Graduate Studies
College of Education
P. O. Box 161250
University of Central Florida
Orlando, FL 32816-1250
TEL: 407-823-3906
FAX: 407-823-5135
"Florida has a very broad public records law. As a result, any
written communication created or received by the University of Central
Florida employees is subject to disclosure to the public and the media,
upon request, unless otherwise exempt. Under Florida law, e-mail
addresses are public records. If you do not want your email address
released in response to a public records request, do not send electronic
mail to this entity. Instead, contact this office
by phone or in writing.”
Dr. Rosemarye (Rose) Taylor
Associate Professor of Educational Leadership
University of Central Florida
http://education.ucf.edu/edleadership/

161
>>> Rosemarye Taylor 2/4/2011 6:10 AM >>>
Rex,
One of my students is going to survey doctoral, Ed. S. and maybe M. Ed. students on their perception of
components of Race to The Top. I've attached the draft survey for your
review. I don't think there is anything controversial or revealing in it. We will have the proposal meeting in
a few weeks.
After your review and approval and the committee's review he will
finalize it and submit to IRB.
Many thanks,
Rose
Dr. Rosemarye (Rose) Taylor
Associate Professor of Educational Leadership
University of Central Florida
http://education.ucf.edu/edleadership/
[Florida has a very broad Public Records Law. Virtually all written communications to or from School
District Personnel are public records available to the public and media upon request. E-mail sent or
received on the School District system will be considered public and will only be withheld from disclosure
if deemed confidential pursuant to State Law.]

162
APPENDIX C
INSTITUTIONAL REVIEW BOARD APPROVAL

163

164
APPENDIX D
INFORMED CONSENT

165
Date
Dear UCF Doctoral Student and Educational Leader:
You are invited to participate in a study of the professional opinions of educational leaders
in Central Florida. Your professional opinion is needed on the Race to the Top Grant
elements concerning teacher evaluation and compensation. This study will add to the field
of knowledge of how such components can possibly impact student achievement and
student growth.
Students participating in either Educational Leadership or Education graduate and doctoral
programs were selected to participate. Your Knights email address was acquired through
both programs. The link found in this email below will bring you to the actual electronic
survey found on Survey Monkey ®.
Although, asked for general demographic information, your responses will be kept
anonymous. The researcher is only interested in your honest professional opinions of the
Race to the Top Grant components.
I will be available explain this research study to you. Whether or not you take part is up to
you. You can agree to take part now and later change your mind. Whatever you decide it
will not be held against you. Viewing of any personally identifiable information will be
limited to me, the researcher. There are no anticipated risks or benefits to participating in
this study. Feel free to ask all the questions you want before you decide.
If you have any questions about this study, please contact me at
[email protected]. My faculty advisor, Dr. Rosemarye Taylor, may be
contacted by phone at (407) 823-1469 or by email at [email protected]. Research at the
University of Central Florida involving human participants is carried out under the
oversight of the Institutional Review Board (IRB). Questions or concerns about research
participants’ rights may be directed to the UCF Institutional Review Board Office at the
University of Central Florida, Office of Research and Commercialization, 12201 Research
Parkway, Suite 501, Orlando, FL 32826-3246. The phone numbers are (407) 823-2901 or
(407) 882-2276.
By clicking on the link to the survey you are giving your informed consent to participate in
the survey.
Thank you in advance for taking the time to participate.
Best Regards,
Daniel H. Windish
Doctoral Candidate, University of Central Florida
Assistant Principal at Pine Crest Elementary
Seminole County Public Schools
http://www.surveymonkey.com/s/KD5CBQL

166
May 18, 2011
Dear UCF Doctoral Student and Educational Leader:
A few weeks back you were invited to participate in a study of the professional opinions of
educational leaders in Central Florida. If you have already participated, thank you for your time.
The results will be analyzed shortly.
If you have not yet participated, you are still able to. As mentioned in the prior email,
whether or not you take part is entirely up to you.
Your professional opinion is needed on the Race to the Top Grant elements concerning
teacher evaluation and compensation. This study will add to the field of knowledge of how such
components can possibly impact student achievement and student growth.
Students participating in either Educational Leadership or Education graduate and
doctoral programs were selected to participate. The researcher is only interested in your honest
professional opinions of the Race to the Top Grant components. The link found in this email
below will bring you to the actual electronic survey found on Survey Monkey ®.
You can agree to take part now and later change your mind. Whatever you decide it will
not be held against you. Viewing of any personally identifiable information will be limited to me,
the researcher. There are no anticipated risks or benefits to participating in this study. Your
instructor will not have any way of determining which students have participated and which have
not.
If you have any questions about this study, please contact me at
[email protected]. My faculty advisor, Dr. Rosemarye Taylor, may be contacted by
phone at (407) 823-1469 or by email at [email protected]. Research at the University of
Central Florida involving human participants is carried out under the oversight of the Institutional
Review Board (IRB). Questions or concerns about research participants’ rights may be directed
to the UCF Institutional Review Board Office at the University of Central Florida, Office of
Research and Commercialization, 12201 Research Parkway, Suite 501, Orlando, FL 32826-3246.
The phone numbers are (407) 823-2901 or (407) 882-2276.
By clicking on the link to the survey you are giving your informed consent to participate in this
study. Thank you again for your time and consideration.
Best Regards,
Daniel H. Windish
Doctoral Candidate, University of Central Florida
Assistant Principal at Pine Crest Elementary
Seminole County Public Schools
https://www.surveymonkey.com/s/ProfessionalOpinionRTTT

167
June 21, 2011
Dear UCF Doctoral Student and Educational Leader:
You were recently invited to participate in a study of the professional opinions of
educational leaders in Central Florida. If you have already participated, thank you for your time.
The results will be analyzed shortly.
If you have not yet participated, you are still able to. As mentioned in the prior email,
whether or not you take part is entirely up to you.
Your professional opinion is needed on the Race to the Top Grant elements concerning
teacher evaluation and compensation. This study will add to the field of knowledge of how such
components can possibly impact student achievement and student growth.
Students participating in either Educational Leadership or Education graduate and
doctoral programs were selected to participate. The researcher is only interested in your honest
professional opinions of the Race to the Top Grant components. The link found in this email
below will bring you to the actual electronic survey found on Survey Monkey ®.
You can agree to take part now and later change your mind. Whatever you decide it will
not be held against you. Viewing of any personally identifiable information will be limited to me,
the researcher. There are no anticipated risks or benefits to participating in this study. Your
instructor will not have any way of determining which students have participated and which have
not.
If you have any questions about this study, please contact me at
[email protected]. My faculty advisor, Dr. Rosemarye Taylor, may be contacted by
phone at (407) 823-1469 or by email at [email protected]. Research at the University of
Central Florida involving human participants is carried out under the oversight of the Institutional
Review Board (IRB). Questions or concerns about research participants’ rights may be directed
to the UCF Institutional Review Board Office at the University of Central Florida, Office of
Research and Commercialization, 12201 Research Parkway, Suite 501, Orlando, FL 32826-3246.
The phone numbers are (407) 823-2901 or (407) 882-2276.
By clicking on the link to the survey you are giving your informed consent to participate in this
study.
Thank you again for your time and consideration.
Best Regards,
Daniel H. Windish
Doctoral Candidate, University of Central Florida
Assistant Principal at Pine Crest Elementary
Seminole County Public Schools
https://www.surveymonkey.com/s/ProfessionalOpinionRTTT

168
APPENDIX E
INTERVIEW PROTOCOL

169
Protocol for the Follow-up Interview to the Electronic Survey of the Implementation
and Impact of Teacher Evaluation and Compensation Components from the Race to
the Top Grant
Instructions and Overview: These questions are to be asked of the selected participants that indicated at the
conclusion of their Electronic Survey of the Implementation and Impact of Teacher
Evaluation and Compensation Components from the Race to the Top Grant
(SIITECCRTTT) that they would agree to a follow-up phone interview. The participants
will be told that their answers will be kept anonymous, but may be reported as qualitative
data for a dissertation on the professional opinions of educational leaders concerning the
Race to the Top grant (RTTT) components concerning teacher evaluation and
compensation. Participants were given the option of not participating or ending the
interview at any time.
The interviewer will ask the four initial questions in order and take detailed notes
of the responses. A table has been created for writing those notes and accompanies this
protocol. Each of the four questions involves follow-up questions depending on the
response to the initial questions. At any time, the interviewer may decide to probe the
participant further for more details or responses, but make note of those questions or
comments that were used for probing as well as the participants’ responses.
Information and a script is provided and the interviewer will avoid deviating from
the script unless noted for the probing for additional information or at points that are
irrelevant to the questions. Information will be written in bold. The script will be written
in italics and information about follow-up questions will be below each of the four initial
questions.

170
The interviewer will start by calling the phone number left by the participant as a
response to the item on the SIITECCRTTT.
Please say:
Hello. May I please speak with (name of participant)?
Once on the phone with the participant, please say:
My name is (name of interviewer) and I am conducting a follow-up interview to survey
that you have recently taken about the Race to the Top grant components concerning
teacher evaluation and compensation. In that survey, you indicated that you would be
willing to take part in a follow-up phone interview. Would this be a good time to ask you
four questions or can I arrange for another time that would be better? This interview will
take no longer than 5-10 minutes.
If the participant needs to schedule another time, please make note of that and call
back at that scheduled time.
Once at an agreed about time, please say:
Thank you for agreeing to participate. Before we begin, I would like to remind you of a
few things. If at any time you no longer wish to participate, you may end this interview
just by saying so.
Also, you should know that your responses will be kept anonymous. Notes will be taken
on your responses and qualitative data will be reported and analyzed as part of a
dissertation for the University of Central Florida. However, in no way will your
responses be attributed to you as you will only be identified as a participant. Do you have
any questions before we begin?
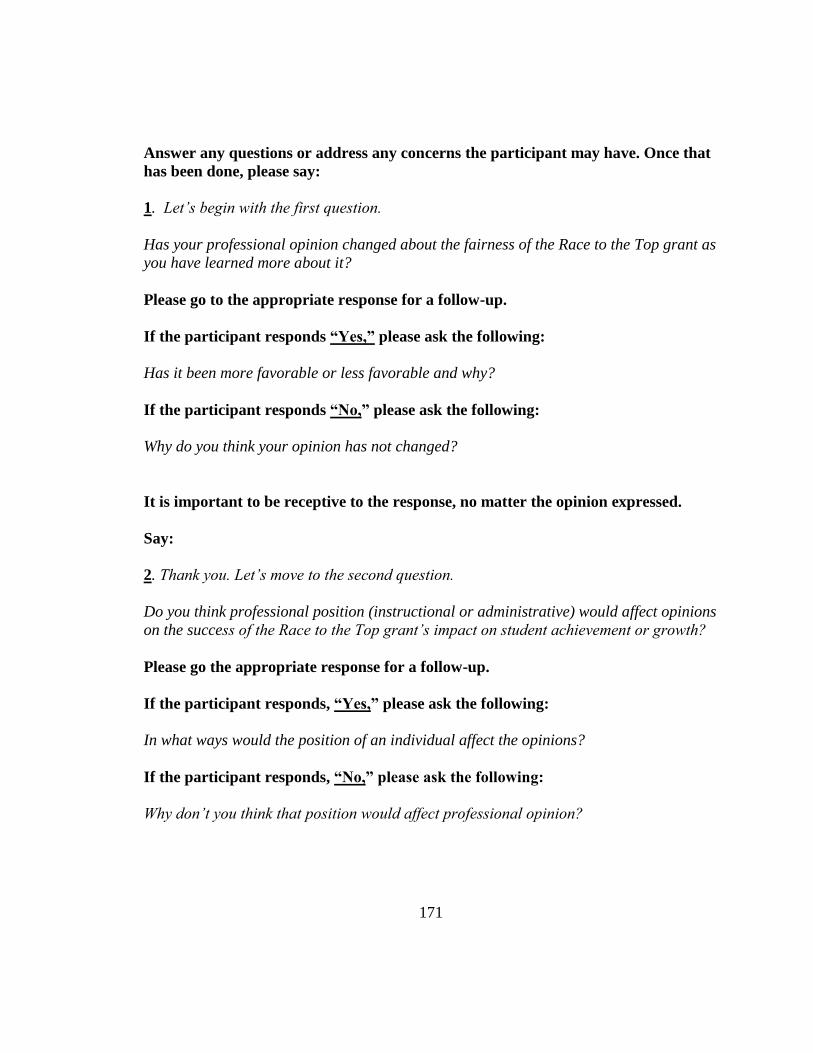
171
Answer any questions or address any concerns the participant may have. Once that
has been done, please say:
1. Let’s begin with the first question.
Has your professional opinion changed about the fairness of the Race to the Top grant as
you have learned more about it?
Please go to the appropriate response for a follow-up.
If the participant responds “Yes,” please ask the following:
Has it been more favorable or less favorable and why?
If the participant responds “No,” please ask the following:
Why do you think your opinion has not changed?
It is important to be receptive to the response, no matter the opinion expressed.
Say:
2. Thank you. Let’s move to the second question.
Do you think professional position (instructional or administrative) would affect opinions
on the success of the Race to the Top grant’s impact on student achievement or growth?
Please go the appropriate response for a follow-up.
If the participant responds, “Yes,” please ask the following:
In what ways would the position of an individual affect the opinions?
If the participant responds, “No,” please ask the following:
Why don’t you think that position would affect professional opinion?
172
Say:
3. Thank you. The third question is:
Do you think opinions of the following components differ depending on the schools’
percentage of free/reduced lunch students: basing 50% of a teacher’s evaluation on
student performance on an assessment program, basing the other 50% of a teacher’s
evaluation on administrator observations, being able to optionally participate in a
separate performance pay scale, and having a separate pay scale for teachers at the
lower performing schools?
Please go the appropriate response for a follow-up.
If the participant responds, “Yes,” please ask the following:
How so?
If the participant responds, “No,” please ask the following:
Why do you think that is?
Say:
4. Thank you. That brings us to the last question:
Do you personally think that the teacher evaluation and compensation process can be
used as a tool to help improve achievement at high-poverty schools?
If the participant responds, “Yes,” please ask the following:
How would those processes best be used and why?
If the participant responds, “No,” please ask the following:
What are some other means that would help improve achievement at high-poverty
schools?
At this time, the interview is over. Please conclude it by saying:
Thank you for your time. I appreciate your help. The information that you have provided
will be helpful in the continued study of the Race to the Top grant and teacher evaluation
and compensation reform.

173
Interview Response Notes
Participant
Number
Question Initial
Yes or No
Follow-up Notes
1
2

174
3
4

175
APPENDIX F
ANALYSIS OF QUALITATIVE DATA
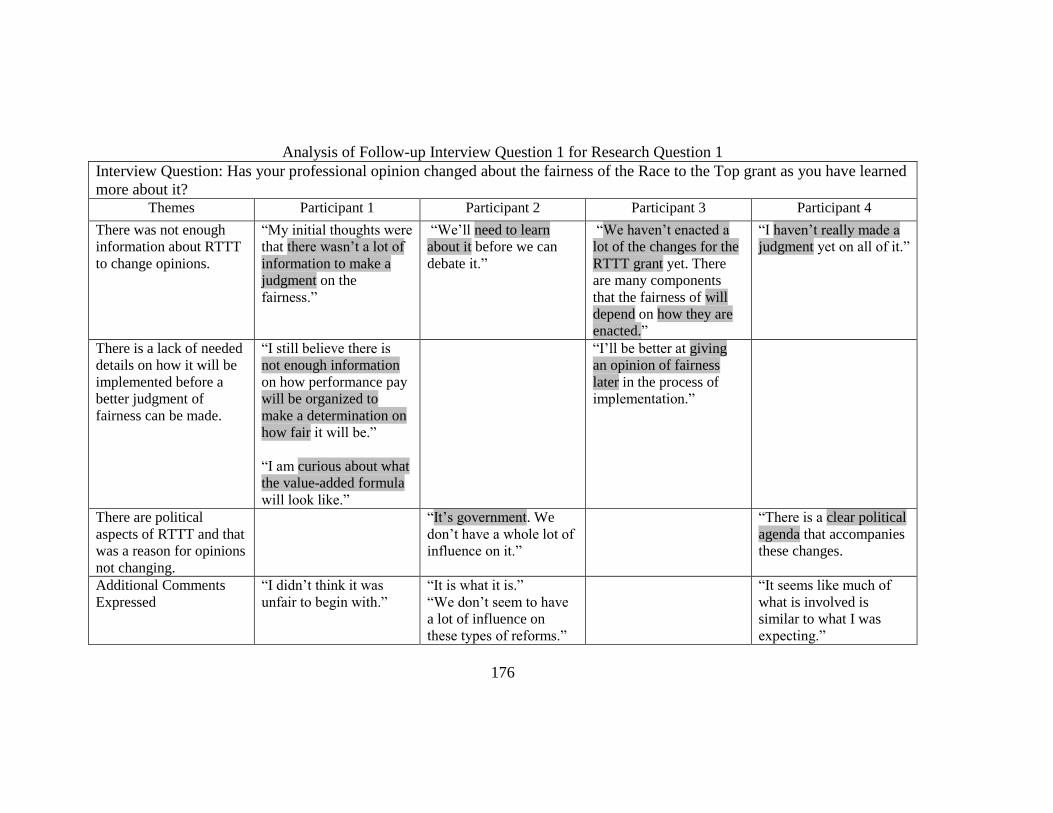
176
Analysis of Follow-up Interview Question 1 for Research Question 1
Interview Question: Has your professional opinion changed about the fairness of the Race to the Top grant as you have learned
more about it? Themes Participant 1 Participant 2 Participant 3 Participant 4
There was not enough
information about RTTT
to change opinions.
“My initial thoughts were
that there wasn’t a lot of
information to make a
judgment on the
fairness.”
“We’ll need to learn
about it before we can
debate it.”
“We haven’t enacted a
lot of the changes for the
RTTT grant yet. There
are many components
that the fairness of will
depend on how they are
enacted.”
“I haven’t really made a
judgment yet on all of it.”
There is a lack of needed
details on how it will be
implemented before a
better judgment of
fairness can be made.
“I still believe there is
not enough information
on how performance pay
will be organized to
make a determination on
how fair it will be.”
“I am curious about what
the value-added formula
will look like.”
“I’ll be better at giving
an opinion of fairness
later in the process of
implementation.”
There are political
aspects of RTTT and that
was a reason for opinions
not changing.
“It’s government. We
don’t have a whole lot of
influence on it.”
“There is a clear political
agenda that accompanies
these changes.
Additional Comments
Expressed
“I didn’t think it was
unfair to begin with.”
“It is what it is.”
“We don’t seem to have
a lot of influence on
these types of reforms.”
“It seems like much of
what is involved is
similar to what I was
expecting.”

177
Analysis of Follow-up Interview Question 2 for Research Question 2 Interview Question: Do you think professional position (instructional or administrative) would affect opinions on the success of the Race to the Top
grant’s impact on student achievement or growth?
Themes Participant 1 Participant 2 Participant 3 Participant 4
Teachers will have a
difficult time with reforms.
“In my experience, teachers aren’t
necessarily open to change. These types of changes, teachers will not
be receptive to them. It will be
harder to get them (teachers) on board.”
“Some, teachers will perceive that
it is something new, but tying compensation and evaluation to
student achievement should be
done. Good teachers should want the accountability.”
“Many teachers will be against
most of these changes. They will see it as an attack on what they do.
Other teachers might see it as just
another thing they will have to wait out. Referring to fads in
education.”
People see through different
lenses.
“This question is all about perception. People have different
lenses as to how they see things.”
“Although it shouldn’t be different, people see things through the lens
of how it affects them.”
Administrators would be
more receptive to these
changes when compared to
teachers.
“Administrators, on the other hand,
have pretty much bought into doing the things necessary to doing
well academically. They will be
more willing to try methods to achieve that.”
Administrators will think these
types of reforms are a good thing.”
Administrator judgments
may be reserved until
results are returned
“Administrators won’t necessarily
see it that way. They will see all of
this as potentially, a lot more work.
Generally, they’ll want to know
how all of this will get done and what kind of results it will bring
about. Will the results come
quickly?
Interpretations had the
potential to slant teachers
and administrators in
different directions.
“I think it has the potential for
being more motivational to some
underperforming teachers, while other teachers that do their best all
the time will not be affected.
“A key factor will be the people
providing the information. Are
they putting a slant on it? Information trickles down and
misinformation and
misinterpretations are made. Another point will be who wrote
the application. Were they slanted
one way or another on these
issues? All of this could slant
teachers one way and
administrators another way.”

178
Analysis of Follow-up Interview Question 3 for Research Question 3 Do you think opinions of the following components differ depending on the schools’ percentage of free/reduced lunch students: basing 50% of a
teachers’ evaluation on student performance on an assessment program, basing the other 50% of a teachers’ evaluation on administrator observations,
being able to optionally participate in a separate performance pay scale, and having a separate pay scale for teachers at the lower performing schools?
Themes Participant 1 Participant 2 Participant 3 Participant 4
Teachers at schools with
large economically
disadvantaged populations
will be nervous about
reforms that link their
evaluation and pay to
performance or
achievement.
“Teachers in the lower
performing schools may feel
differently as they may be
scared of a new system.”
My answer is based on what I
know now. I don’t know how
all the formulas for value-
added will work. So, the lack
of information is probably
scaring teachers at lower SES
schools. I think teachers at
these schools will worry about
how free/reduced status will be
factored.”
“Teachers at high-poverty
schools are nervous that hard
work won’t be recognized.”
Teachers at high-poverty
schools have a harder job
that may go unrecognized.
“The hardest thing to reconcile
is at high-poverty schools there
are other concerns than
academics. It will be difficult
to justify a system like this to
teachers at high-poverty
schools without knowing how
gains will be shown or
measured.”
“Teachers at high-poverty
schools are mostly tired of
being trampled on for their
good-faith efforts to educate
the students at their school.”
High performing school
teachers would feel
comfortable with these
changes.
“Teachers in high-performing
schools will be more agreeable
to these types of changes.
Those teachers may already
feel they are doing a good job
and will not have a problem
with a different evaluation and
pay scale that reflects that.”
There could be the feeling
of punishment that could
occur at high poverty
schools.
“Those teachers in the lower performing
schools may feel penalized by their
choice to work at a school that may
have them being paid less or evaluated
wrongfully.”
“Teachers at these schools will
worry about their results being
the same and being penalized.”
“Punitive measures haven’t
worked in changing the culture
of the school.”

179
Analysis of Follow-up Interview Question 4 for Research Question 4
Do you personally think that the teacher evaluation and compensation process can be used as a tool to help improve achievement at high-poverty
schools?
Themes Participant 1 Participant 2 Participant 3 Participant 4
Hesitation expressed on
how to answer this
question. Teacher
evaluation and
compensation components
impact at high-poverty
schools could be dependent
on the effectiveness of the
implementation and support
provided to the system.
Also teacher evaluation and
compensation reform could
be used in conjunction with
other known successful
reforms in a comprehensive
system.
I answered ‘yes’ depending on the administration of the school. If
administrators provide the support,
the professional development and
show the follow through of
inspecting what they expect, then
these reforms can make a difference. Without giving
professional development and
without regular observations and feedback, these types of reforms
won’t help anywhere. Mistakes
will happen if critical steps in the change process are skipped.”
“My answer to this is really
‘yes and no.’ It only has a
chance of helping if the system
is diagnostic of both student
and teacher needs and then
puts systems in place to help
meet the needs. Will gaps in
teacher performance and
student learning be filled?
That’s the important question.
Figure out the needs, work to
meet them, and then the system
will be successful. If the
system relies on punitive
measures, it won’t work. Of
course, I come from a coaching
viewpoint and not an
administrative one.”
“I say ‘Yes’ with the
understanding that evaluation
is only one piece of the puzzle.
It won’t work alone. Capturing
the attention of the community
and coordinating resources to
help families of those schools
is just as, if not, more
important than teacher
evaluation. There are many
other pieces, such as
leadership, transforming the
climate and culture, and
curriculum improvements that
will be required to help lower
SES schools.”
An opinion exists that
teachers at high-poverty
schools should be paid
more.
“All teachers should be held to
high standards. From my
experience, it is more
academically intense at high-
poverty schools. Teachers
there have further to take
students. These teachers should
be paid more as long as there is
a tie to student achievement.
This will ensure that better
results and a challenging job
are being rewarded properly.”
180
LIST OF REFERENCES
Adams, S. J., Heywood, J. S., & Rothstein, R. (2009).Teachers, performance pay, and
accountability: What education should learn from other sectors(ISBN: 1-932066-
38-1). Retrieved from Economic Policy Institute website: http://www.epi.org
Amendt, B. C. (2004). A study of administrator perceptions of state mandated teacher
evaluation: The student achievement and Iowa teacher quality law. (Doctoral
dissertation, Drake University).
Anderson, L.M., & Welsh, M. (2000). Making progress: An update on state
implementation of federal education laws enactd in 1994. U.S. Department of
Education, Planning and Evaluation Services. Washington D.C.
Aritomi, P. & Coopersmith, J. (2009). Characteristics of public school districts in the
United States: Results from the 2007-08 schools and staffing survey (NCES 2009-
320). National Center for Education Statistics, Institute of Education Sciences,
U.S. Department of Education. Washington, DC.
Bacolod, M., DiNardo, J., & Jacobson, M. (2009). Beyond incentives: Do schools use
accountability rewards productively. Cambridge, MA: National Bureau of
Economic Research. doi:14775.
Baratz-Snowden, J. (2009). Fixing tenure: A proposal for assuring teacher effectiveness
and due process. Washington, D.C.: Center for American Progress. Retrieved
from www.americanprogress.org
Bastarache, R. A. (2000). Purpose, methods and effectiveness of teacher evaluation:
Perceptions of urban elementary teachers and principals. (Doctoral dissertation,
University of Massachusetts), Available from UMI. (9962862).
Bent, A. J. (1993). The effect of role on perceptions of teachers, principals,
superintendents, and school board members in Massachusetts suburbs relating to
teacher evaluation and professional development. (Doctoral dissertation, Boston
College), Available from UMI. (No. 9329278).
Berliner, D. C. (2006). Our impoverished view of educational research. Teachers College
Record, 108(6), 949-995.

181
Bobbitt, S. A. (1989). U.S. Department of Education, Office of Educational Research and
Improvement. Teacher incentive programs in the public schools (ED309155).
Washington, DC: National Center for Education Statistics.
Borman, G. D. (2003). How can Title I improve achievement? Educational Leadership,
60 (4), 49-53.
Buddin, R., McCaffrey, D. F., Kirby, S. N., & Xia, N. (2007). Merit pay for Florida
teachers: Design and implementation issues. Working Paper, RAND Education.
Caldas, S. J., & Bankston III, C. (1997). Effect of School Population Socioeconomic
Status on Individual Academic Achievement. The Journal of Educational
Research , 90, 269-277.
Chaplin, D., Verghese, S., Chiang, H., Sonnenfeld, K., Sullivan, M., Kennen. . . Harris,
D. New Leaders for New Schools, (2009). 2008 principal/vice principal survey
results for evaluation of the effective practice incentive community (epic) (6325-
150). Retrieved from Mathematica Policy Research, Inc. website:
http://www.mathematica-mpr.com
Collins, G. S. (2001). What principals do to minimize the negative effects of the
incompetent teacher. (Doctoral dissertation, Georgia Southern University),
Available from UMI. (3029762).
Darling-Hammond, L. (2000). Teacher quality and student achievement: A review of
state policy evidence. Education Policy Analysis Archives, 8(1), 1-45.
Donaldson, M. L. (2009). So long, Lake Wobegon? Using teacher evaluation to rasie
teacher quality. Center for American Progress. Retrieved from
http://www.americanprogress.org/issues/2009/06/pdf/teacher_evaluation.pdf
Education Commission of the States (2007, October). Evaluating teacher effectiveness:
Assessing teacher quality and which teachers are most likely to improve student
achievement. The Progress of Education Reform, 8(4), 1-4. Retrieved from
http://www.ecs.org/per
Education Commission of the States (2010, June). Teacher merit pay: What do we know.
The Progress of Education Reform, 11(3), 1-4. Retrieved from
http://www.ecs.org/per
Elementary and Secondary Education Act of 1965, Pub. L. 89-10, 6301 et seq. 79 Stat. 27
(1965).

182
Ellerson, N. (2009). Exploring the possibility and potential for pay for performance in
America's public schools. Arlington, VA: American Association of School
Administrators. Retrieved from http://ww.aasa.org
Florida Department of Education (n.d.). U.S. Department of Education: Race to the top
definitions. Retrieved from http://www.fldoe.org/arra/pdf/usdef.pdf
Florida Department of Education (2010a). Florida’s race to the top phase 2 memorandum
of understanding. Retrieved from http://www.fldoe.org/arra/pdf/phase2mou.pdf
Florida Department of Education (2010b). Race to the top evaluation systems checklist.
Retrieved from http://info.fldoe.org/docushare/dsweb/Get/Document-5972/dps-
2010-230d.pdf
Florida Department of Education (2010c). 2010 guide to calculating adequate yearly
progress (AYP): Technical assistance paper. Retrieved from
http://schoolgrades.fldoe.org/pdf/0910/AYPTAP2010.pdf
Florida Department of Education (2012). Review and approval checklist for instructional
personnel and school administrator evaluation systems. DOE Form no. EQEVAL-
2012. Retrieved from http://www.fldoe.org/profdev/pa.asp
Fullan, M. (2006). Turnaround leadership. San Francisco, CA: Jossey-Bass.
Glazerman, S. (2004). Teacher compensation reform: Promising strategies and feasible
methods to rigorously study them. Mathematica Policy Research, Washington,
D.C.
Goldhaber, D. (2010). Teacher pay reforms: The political implications of recent
research. CEDR Working Paper 2010. University of Washington, Seattle WA.
Retrieved from http://www.cedr.us/papers/working/CEDR%20WP%202010-
4_Teacher%20Pay%20Reforms%20(8-23-10).pdf
Goldhaber, D., DeArmond, M., Player, D., & Choi, H. J. (2008). Why do so few public
school districts use merit pay? Journal of Education Finance, 33(3), 262-289.
Greene, G., Huerta, L., & Richards, C. (2007). Getting real: A different perspective on
the relationship between school resources and student outcomes. Journal of
Education Finance, 33(1), 49-68.

183
Greene, J.P., & Forster, G. (2008). Teacher incentives and merit pay. Center on
Innovation and Improvement. Retrieved from www.centerii.org
Greene, J., & Winters, M. (2007). How much are public school teachers paid?
Manhattan: Manhattan Institute. Retrieved from www.manhattan-
institute.org/html/cr_50.htm
Greene, J.C., Caracelli, V.J., & Graham, W.F. (1989). Toward a conceptual framework
for mixed-method evaluation designs. Education Evaluation and Policy Analysis,
11 (3), 255-274. Retrieved from
http://epa.sagepub.com/cgi/content/abstract/11/3/255
Grubbs, S. (2005). A Georgia case study: The elimination of teacher tenure in Georgia as
viewed through the policy formulation process model. Georgia Educational
Researcher Online Edition, 3 (1), 1-7.
Hayes, W. (2010). What's ahead in education? An analysis of the policies of the Obama
administration. Lanham, MD: Rowman & Littlefield Education.
Hess, F. M., & Maranto, R. A. (2000). Tenures tenuous tenure in public schools. The
Education Digest 65(5), 51-55.
Howell, W. G., Peterson, P. E., & West, M. R. (2011). Meeting of the minds. Education
Next, 11(1), 20-31. Retrieved from http://educationnext.org
H.R. 1—111th
Congress: American Recovery and Reinvestment Act of 2009. (2009). In
GovTrack.us (database of federal legislation). Retrieved from
http://www.govtrack.us/congress/bill.xpd?bill=h111-1
Johnson, R.B., Onwuegbuzie, A.J., & Turner, L.A. (2007). Toward a definition of mixed
methods research. 1(2), 112-133. Retrieved from
http://mmr.sagepub.com/cgi/content/abstract/1/2/112
Kellor, E. M. (2005). Catching up with the Vaughn express: Six years of standards-based
evaluation and performance pay. Education Policy Analysis Archives, 13(7), 1-27.
doi: ISSN 1068-2341Kiesling, H. J. (1971). Input and output in California
compensatory educational projects. Rand Corporation, Santa Monica, CA.
Kiesling, H. J. (1972). Some estimates for the cost effectiveness of educational inputs for
the reading performance of disadvantaged children in California title i projects.
Rand Corporation, Santa Monica, CA.
184
Kolbe, T., & King Rice, J. (2012). And they’re off: Tracking federal race to the top
investments from the starting gate. Educational Policy, 26(1), 185-209. doi:
10.1177/0895904811428975
Laine, S., Behrstock-Sherratt, E., & Lasagna, M. (2011). Improving teacher quality: A
guide for education leaders. San Francisco, CA: Jossey-Bass.
Marzano, R. J., Frontier, T., & Livingston, D. (2011). Effective supervision: Supporting
the art and science of teaching. Alexandria, VA: ASCD.
Mathematica Policy Research, Inc. (2006). Options for studying teacher pay reforms
using natural experiments. Washington, D.C.: Mathematica Policy Research, Inc.
Retrieved from http://mathematica-
mpr.org/publications/PDFs/teacherpayreform.pdf
McGuinn, P. (2010a). Creating cover and constructing capacity: Assessing the origins,
evolution, and impact of race to the top. Washington, DC: American Enterprise
Institute. Retrieved from http://www.aei.org/policy/
McGuinn, P. (2010b). Ringing the bell for teacher tenure reform. Washington, D.C.:
Center for American Progress. Retrieved from www.americanprogress.org
McGuinn, P. (2012). Stimulating reform: Race to the top, competitive grants, and the
obama education agenda. Educational Policy, 26(1), 136-159. doi:
10.1177/0895904811425911
Milanowski, A. (2004). The criterion-related validity of the performance assessment
system in Cincinnati. Peobody Journal of Education, 79(4), 33-53.
Mobley, J. D. (2002). Principals' perceptions of an evaluation system in Tennessee.
(Doctoral dissertation, University of Tennessee), Available from UMI. (3075557).
Murray, K. T., & Murray, B. A. (2007). School law for the Florida educator (3rd
ed.).
Merritt Island, FL: IntraCoastal Publishing.
National Center for Education Evaluation and Regional Assistance. (2007). Final report
on the national assessment of Title I: Summary of key findings. Washington, D.C.:
U.S. Department of Education, Institute of Education Sciences.
185
National Commission on Excellence in Education. (1983). A nation at risk: The
imperative for education reform. Washington, DC: United States Department of
Education.
Ngoma, S. (2011). Improving teacher effectiveness: An examination of a pay for
performance plan for boosting student academic achievement in Charlotte-
Mecklenberg Schools. Charlotte: Capella University.Retrieved April 20, 2012
from http://www.eric.ed.gov/PDFS/ED518815.pdf
Nicholson-Crotty, S., & Staley, T. (2012). Competitive federalism and race to the top
application decisions in the American states. Educational Policy, 26(1), 160-184.
doi: 10.1177/0895904811428974
No Child Left Behind (NCLB) Act of 2001, 20 U.S.C.A. § 6301 et seq. (West, 2002).
Stat,1425.
Obama, B. A. (July 29, 2010). Remarks by the president on educational reform.
Presented at the National Urban League Centennial Conference, Washington D.C.
Odden, A. (2000). New and better forms of teacher compensation are possible. Phi Delta
Kappan. 8 (5), 361-366.
Odden, A., & Kelley, C. (2002). Paying teachers for what they know and do: New and
smarter compensation strategies to improve schools. (2nd ed.). Thousand Oaks,
CA: Corwin Press, Inc.
Office of Education (1969). History of Title I ESEA. Washington D.C.
Okpala, C. O. (2002). Educational Resources, Student Demographics and Achievement
Scores. Journal of Education Finance , 27 (Winter 2002), 885-908.
Podgursky, M. J., & Springer, M. G. (2007). Teacher performance pay: A
review. Journal of Policy Analysis and Management, 26(4), 909-949. doi:
10.1002/pam.20292.
Postal, L. (2010, August 24). Florida one of 10 winners for race to the top grant. Orlando
Sentinel. Retrieved from http://articles.orlandosentinel.com/2010-08-24/news/os-
race-to-top-florida-20100824_1_to

186
Protsik, J. (1995). U.S. Department of Education, Office of Educational Research and
Improvement. History of teacher pay and incentive reforms (ED380894).
Retrieved from ERIC Document Reproduction Service website:
http://www.eric.ed.gov/PDFS/ED380894.pdf
Ralph, J., Frase, M., Crouse, J., & Thompson, W. (1998). U.S. Department of Education,
Office of Educational Reasearch and Improvement. Issue brief: First-graders
achievement in top and bottom schools. Retrieved from National Center for
Education Statistics website: http://www.ed.gov/NCES/pubs/
Rennie Center, Rennie Center for Education and Research and Policy. (2008). Post-eqa
accountability: A menu of policy options. Retrieved from Rennie Center for
Education Research and Policy website: http://renniecenter.org
Rivkin, S. G., Hanushek, E. A., & Kain, J. F. (2005). Teachers, schools, and academic
achievement. Econometrica, 73(2), 417-458.
Robinson, G.W. (2009). Principals’ perceptions regarding the role of the professional
development and appraisal system in teacher supervision in Texas. (Doctoral
dissertation, University of Houston).
Sampson, H., & Silva, C. (2010, April 15). Gov. Charlie Crist vetoes Florida teacher pay
bill. The Miami Herald. Retrieved from
http://www.miamiherald.com/2010/04/15/v-print/1581083/gov-charlie-crist-
vetoes-teacher.html
Sanders, W. L., & Rivers, J. C. (1996). Cumulative and residual effects of teachers on
futre student academic achievement. Knoxville, TN: University of Tennessee
Value-Added Research and Assessment Center.
Sirin, S. R. (2005). Socioeconomic status and academic achievement: A meta-analytic
review of research. Review of Educational Research , 75(3), 417-453.
Smarick, A. (2011, Winter). Diplomatic mission. Education Next, 11(1), 56-63.
Solomon, D., Battistich, V., & Hom, A. (1996). Teacher Beliefs and Practices in Schools
Serving Communities that Differ in Socieconomic Level. The Journal of
Experimental Education , 64, 327-347.

187
Springer, M. G., & Winters, M. A. Manhattan Institute, Center for Civic Innovation.
(2009). The NYC pay-for-performance program: Early evidence from a
randomized trial (No. 56). Retrieved from Manhattan Institute website:
http://www.manhattan-institute.org/cci
Stepp, R. S. (2010). A comparison of classroom teachers' and superintendents' views of
teacher salary schedule components. (Doctoral dissertation, Ashland University),
Available from ProQuest.
Swanson-Gehrke, R. (2005, Fall). Poor Schools- Poor Students- Successful Teachers.
Kappa Delta Pi Record , pp. 14-17.
Thomas B. Fordham Foundation. (2006). How Well Are Stats Educating Our Neediest
Children? The Fordham Report 2006. Thomas B. Fordham Foundation.
University of Central Florida. (2011, May). Graduate catalog 2011-2012. Retrieved from
http://www.graduatecatalog.ucf.edu/programs/index.aspx?Colleges=2&Levels=0
&Disciplines=all&Modes=all
U.S. Department of Agriculture. (2011). Child nutrition programs: Income eligibility
guidelines. Federal Register, 76(58), 16724-16725. Retrieved from
http://www.fns.usda.gov/cnd/governance/notices/iegs/IEGs11-12.pdf
U.S. Department of Education Funding (2009). Funds for State Formula-Allocated and
Selected Student Aid Programs [Data File]. Retrieved from
www.ed.gov/about/overview/budget/statetables/index.html/#update
U.S. Department of Education, Planning and Evaluation Service. (2001). High standards
for all students: A report from the national assessment of Title I on progress and
challenges since the 1994 reauthorization. Washington, DC: Education
Publications Center, U.S. Department of Education.
Wagner, T. (2005). Change leadership: A practical guide for transforming our schools.
San Francisco, CA: Jossey-Bass.
Wainer, H. (2011). Uneducated guesses: Using evidence to uncover misguided education
policies. Princeton, NJ: Princeton University Press.
Walsh, K., & Tracy, C.O. (2004). Increasing the odds: How good policies can yield better
teachers. Washington, D.C.: National Council on Teacher Quality. Retrieved from
http://www.nctq.org/p/publications/reports.jsp

188
Wang, M. C., Wong, K. K., & Kim, J. R. (1999a). A national study of title i school wide
programs: A synopsis of interim findings. Publication Series #2. Mid Atlantic Lab
for Student Success. Philadelphia, PA. Office of Education Research and
Improvement.
Wang, M. C., Wong, K. K., & Kim, J. R. (1999b). A national study of title i school wide
programs: A synopsis of interim findings. Publication Series #7. Mid Atlantic Lab
for Student Success. Philadelphia, PA. Office of Education Research and
Improvement.
Wise, A. E., Darling-Hammond, L., McLaughlin, M. W., & Bernstein, H. T. (1984).
Teacher evaluation: A study of effective practice. Santa Monica, CA: The Rand
Corporation.
Wright, D. (1999). Student Mobility: A Negligible and Confounded Influence on Student
Achievement. The Journal of Educational Research, 92(6), 347-353.