Embed Size (px)
Citation preview
Central Calif. Winegrowers and Calif. Assoc. of Winegrape
Growers 2007 Winegrape Symposium“Today, Tomorrow Today, Tomorrow
and Beyond”and Beyond”
November 28th and 29th, 2007Pardini’s, Fresno, California
SJV Grapegrowers and the Global Market Place
John CiattiManaging Partner, Ciatti Company
San Rafael, CA 415/458-5150 www.ciatti.com
24 Brokers WorldwideArgentina, Australia, Canada, Chile, France, Germany, South Africa, USA
10 within CaliforniaNorth Coast, Central Coast, Lodi, Central Valley & Foothills
Grapes, Juice, Bulk Wine, Case goods, Juice Concentrates, High Proof, Spirits, Storage & Processing
Brokers Committed to your Success
Points to Discuss
Sales / Shipment News
2007 Global Harvest Review
Export / Import Discussion
Future Outlook
Questions

Source: Gomberg Fredrickson Report
Wine Shipments YTD Wine Shipments YTD (Aug ‘07 )(Aug ‘07 )
Wine shipments +1.4% (bottled) 2.1% Overall YTD
GFA Premium Wine Index +5%Premium growth offset by losses in economy wines
Bulk Exports +11% YTD; Bottled +5% YTDPositive change, Exchange rate effects?
California
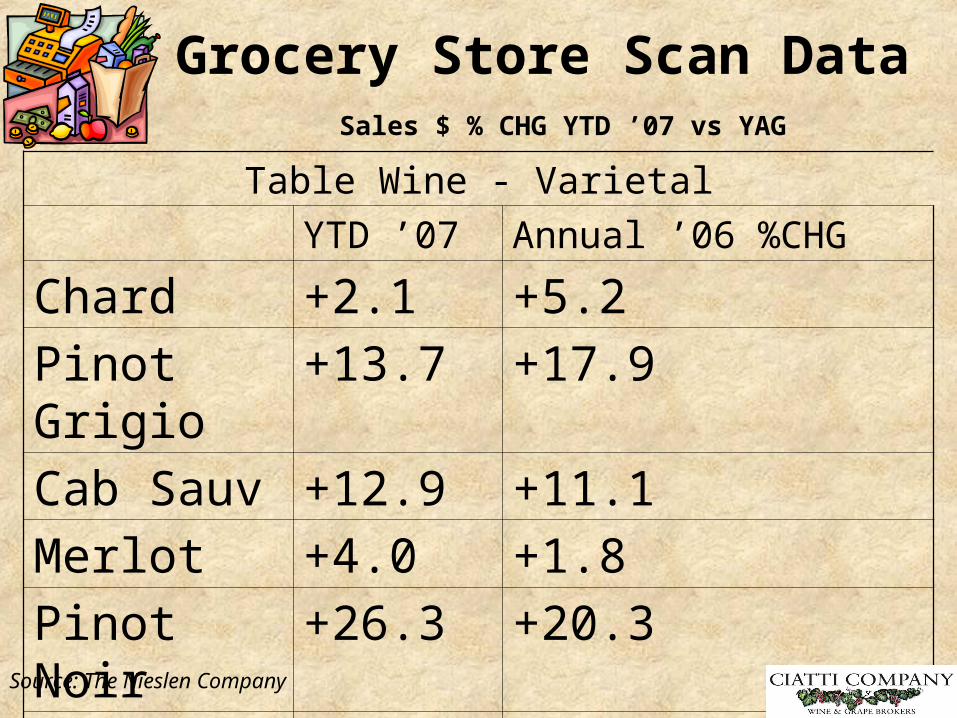
Table Wine - Varietal
YTD ’07 Annual ’06 %CHG
Chard +2.1 +5.2
Pinot Grigio +13.7 +17.9
Cab Sauv +12.9 +11.1
Merlot +4.0 +1.8
Pinot Noir +26.3 +20.3
Zinfandel +10.7 +11.6
Grocery Store Scan Data
Source: The Nieslen Company
Sales $ % CHG YTD ’07 vs YAG
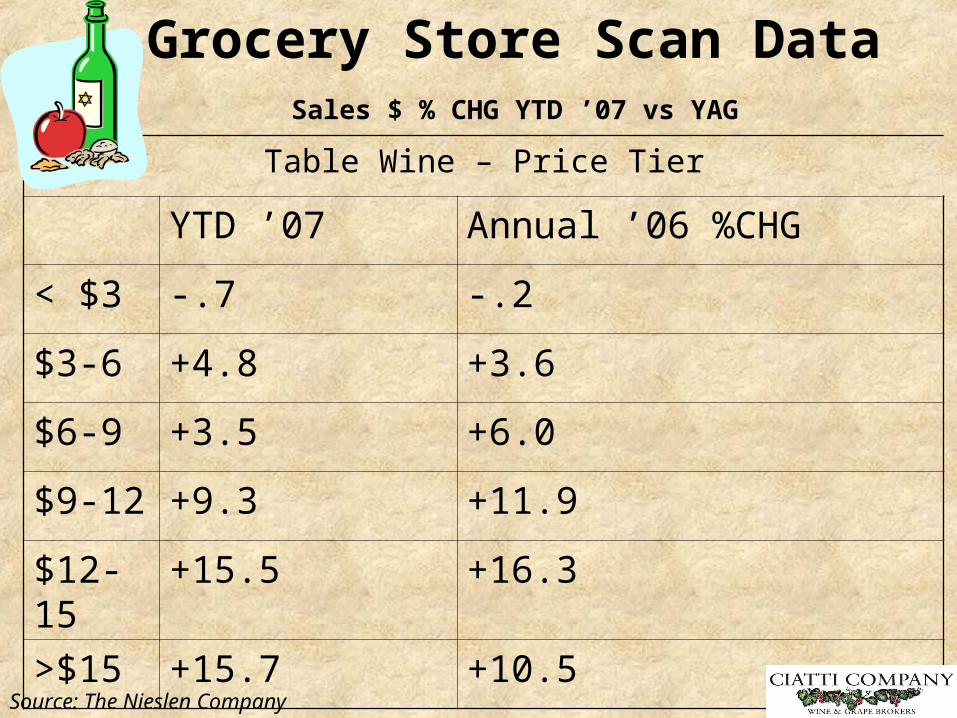
Table Wine – Price Tier
YTD ’07 Annual ’06 %CHG
< $3 -.7 -.2
$3-6 +4.8 +3.6
$6-9 +3.5 +6.0
$9-12 +9.3 +11.9
$12-15 +15.5 +16.3
>$15 +15.7 +10.5
Grocery Store Scan Data Sales $ % CHG YTD ’07 vs YAG
Source: The Nieslen Company
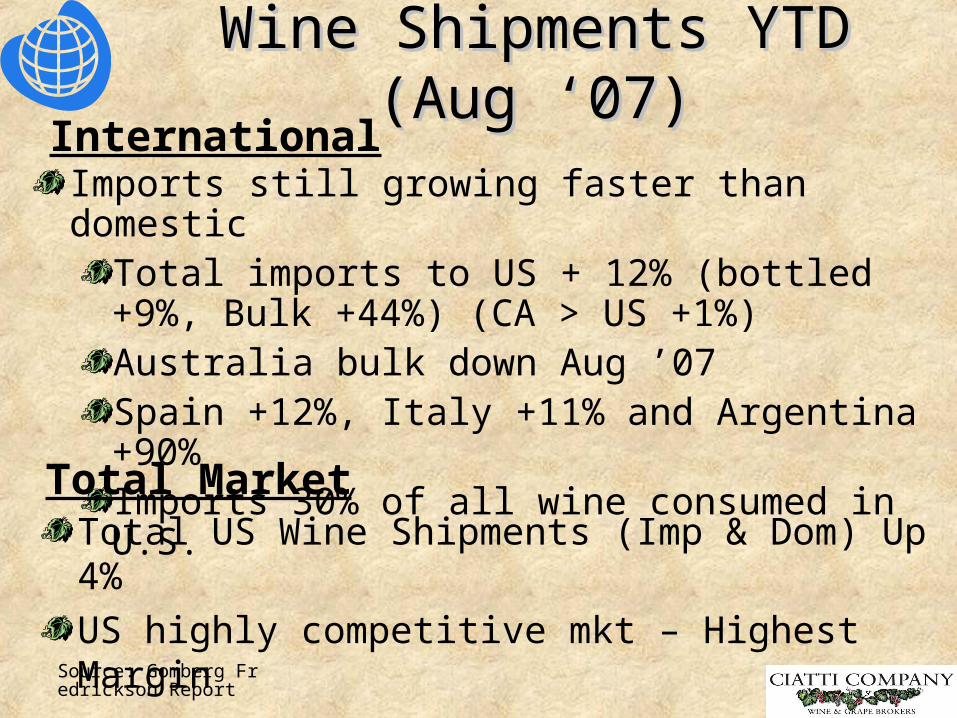
Source: Gomberg Fredrickson Report
Wine Shipments YTD Wine Shipments YTD (Aug ‘07)(Aug ‘07)
Imports still growing faster than domesticTotal imports to US + 12% (bottled +9%, Bulk +44%) (CA > US +1%)Australia bulk down Aug ’07Spain +12%, Italy +11% and Argentina +90%Imports 30% of all wine consumed in U.S.
International
Total MarketTotal US Wine Shipments (Imp & Dom) Up 4%
US highly competitive mkt – Highest Margin
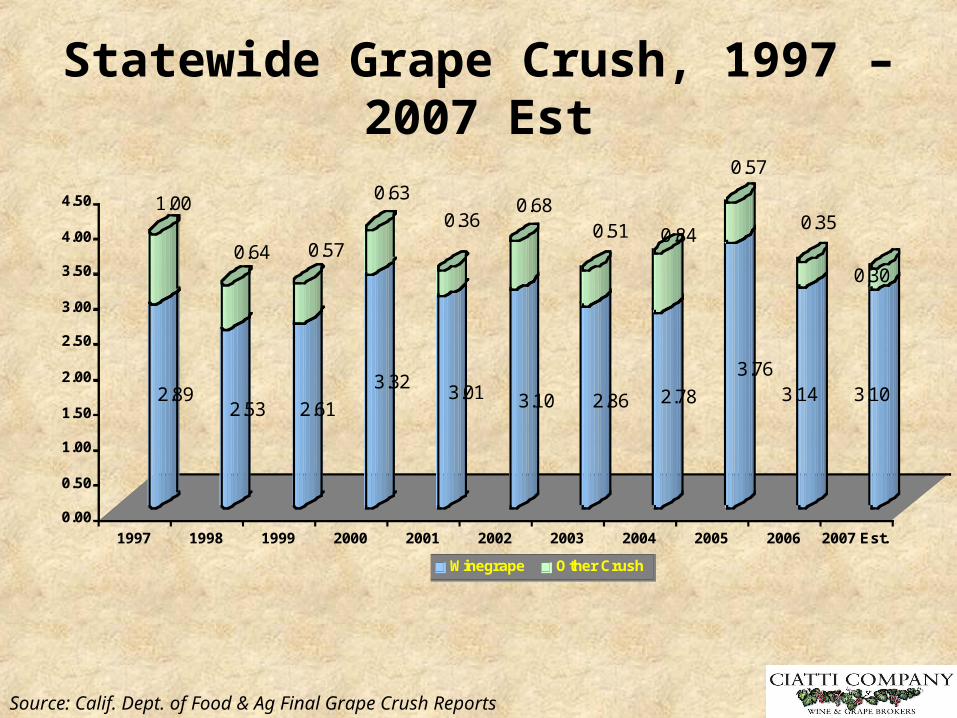
2.89
1.00
2.53
0.64
2.61
0.57
3.32
0.63
3.01
0.36
3.10
0.68
2.86
0.51
2.78
0.84
3.76
0.57
3.14
0.35
3.10
0.30
0.00
0.50
1.00
1.50
2.00
2.50
3.00
3.50
4.00
4.50
Tons in Millions
1997 1998 1999 2000 2001 2002 2003 2004 2005 2006 2007 Est.
Winegrape Other Crush
Source: Calif. Dept. of Food & Ag Final Grape Crush Reports
Statewide Grape Crush, 1997 – 2007 Est
Domestic Picture
Inventories – moving towards balanceOlder Reds still in system, whites better
Grape Pricing slow to improveGrape Concentrate options not as competitive as raisinsSmaller 2007 Vintage should increase optimism for 2008
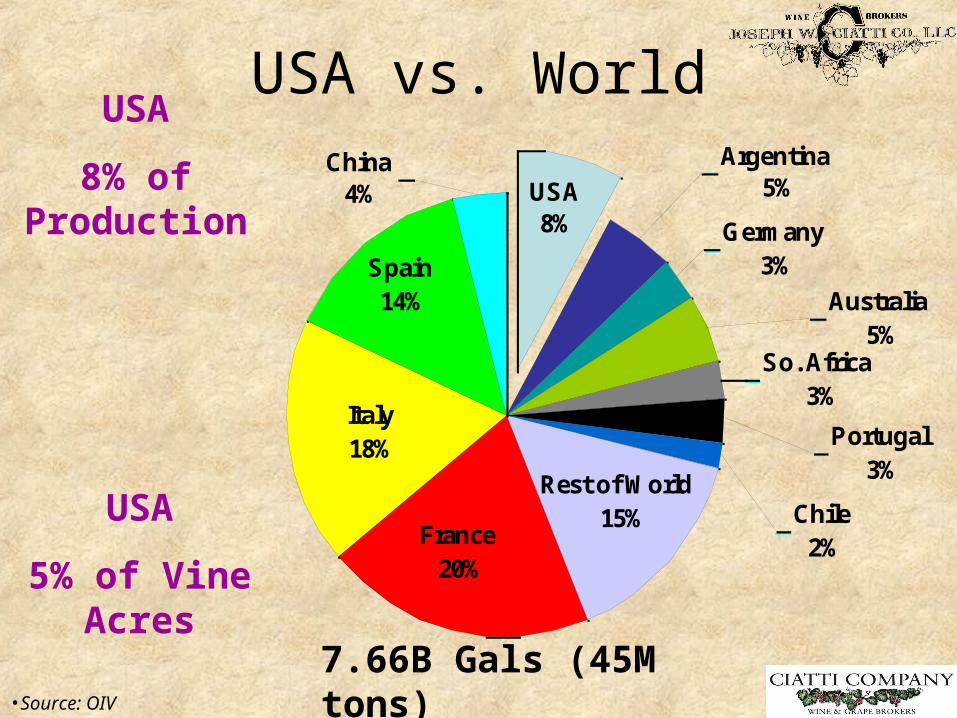
USA vs. WorldChina
4%
Portugal3%
So. Africa3%
Germany3%
Australia5%
Argentina5%
Spain14%
Chile2%
USA 8%
Italy18%
France20%
Rest of World15%
USA
8% of Production
USA
5% of Vine Acres
7.66B Gals (45M tons)•Source: OIV
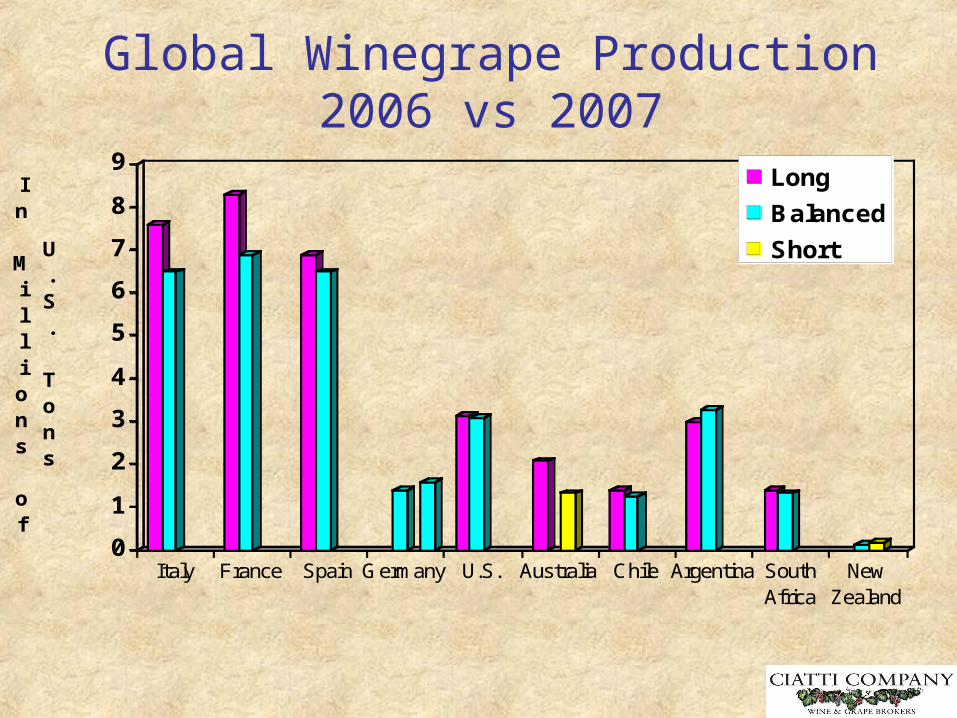
Global Winegrape Production 2006 vs 2007
0
1
2
3
4
5
6
7
8
9In
Millions of
U.S. Tons
Italy France Spain Germany U.S. Australia Chile Argentina SouthAfrica
NewZealand
Long
Balanced
Short

California Exports
0
10
20
30
40
50
60
70
In Millions of Gallons
2003 2004 2005 2006 2007 Est
Bulk Case
76.46M Gals94.13M Gals
91.27M Gals91.85M Gals
440,000 Tons540,000 Tons
520,000 Tons525,000 Tons
Source: Gomberg Fredrikson Report; State Board of Equalization
565,000 Tons99.3M Gals
SJV Export StrengthsWhite Zinfandel
Zinfandel
Ruby Cabernet
Colombard/Whites
Competitive Varietals

Dry White Wine2006
$0.76
$1.45
$2.10
$1.00
$1.50
$1.85
0.00
0.50
1.00
1.50
2.00
2.50
U.S. $ per Gal
Argentina Australia Calif. Chile Europe S. Africa
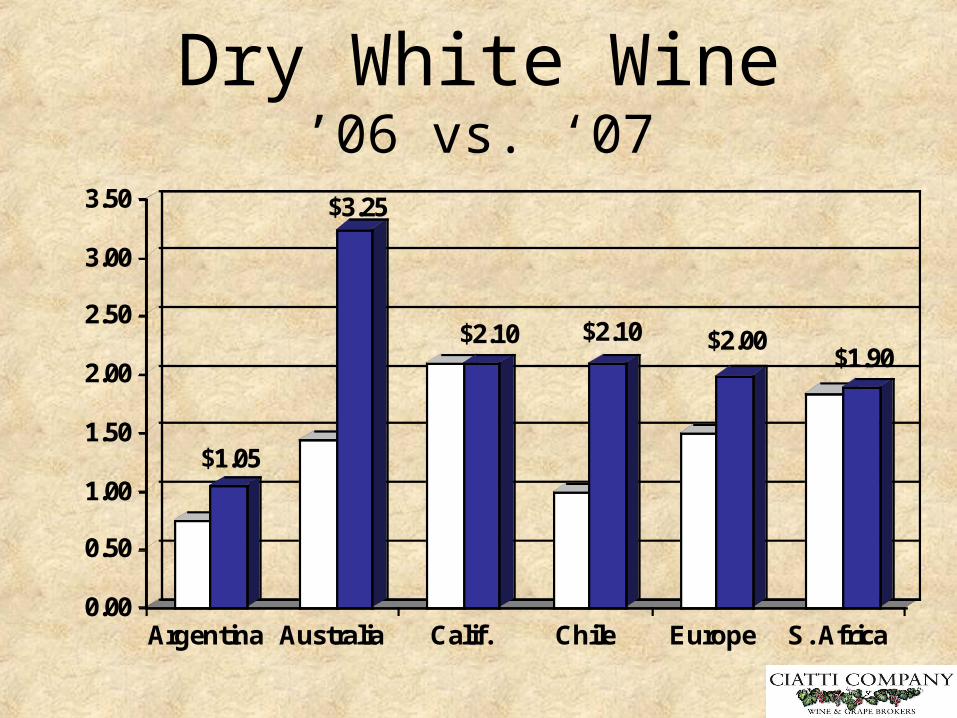
Dry White Wine’06 vs. ‘07
$1.05
$3.25
$2.10 $2.10 $2.00$1.90
0.00
0.50
1.00
1.50
2.00
2.50
3.00
3.50
U.S. $ per Gal
Argentina Australia Calif. Chile Europe S. Africa

Dry Red Wine2006
$0.95
$1.30
$2.25
$1.00
$1.50$1.70
0.00
0.50
1.00
1.50
2.00
2.50
U.S. $ per Gal
Argentina Australia Calif. Chile Europe S. Africa

Dry Red Wine’06 vs ‘07
$1.15
$3.25
$2.25$1.95 $2.00
$1.70
0.00
0.50
1.00
1.50
2.00
2.50
3.00
3.50
U.S. $ per Gal
Argentina Australia Calif. Chile Europe S. Africa
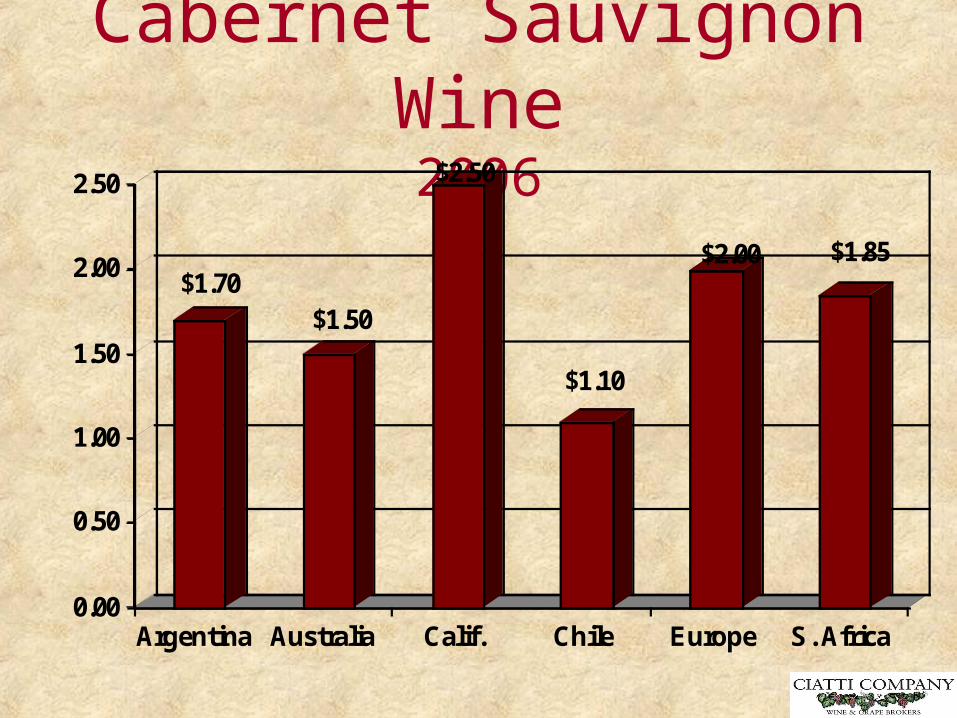
Cabernet Sauvignon Wine2006
$1.70$1.50
$2.50
$1.10
$2.00 $1.85
0.00
0.50
1.00
1.50
2.00
2.50
U.S. $ per Gal
Argentina Australia Calif. Chile Europe S. Africa
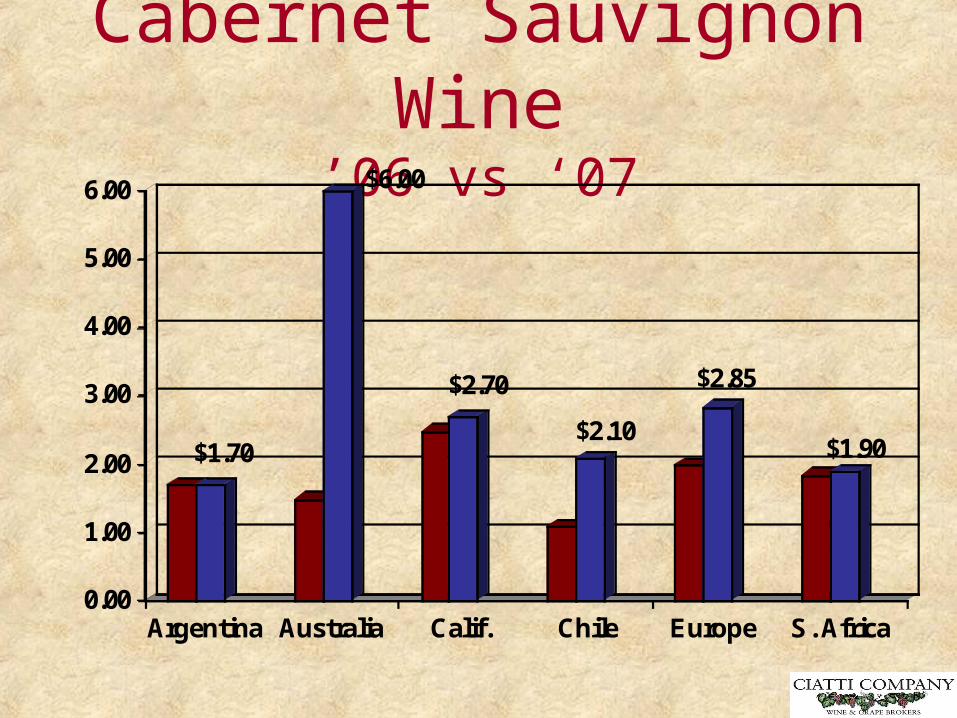
Cabernet Sauvignon Wine
’06 vs ‘07
$1.70
$6.00
$2.70
$2.10
$2.85
$1.90
0.00
1.00
2.00
3.00
4.00
5.00
6.00
U.S. $ per Gal
Argentina Australia Calif. Chile Europe S. Africa
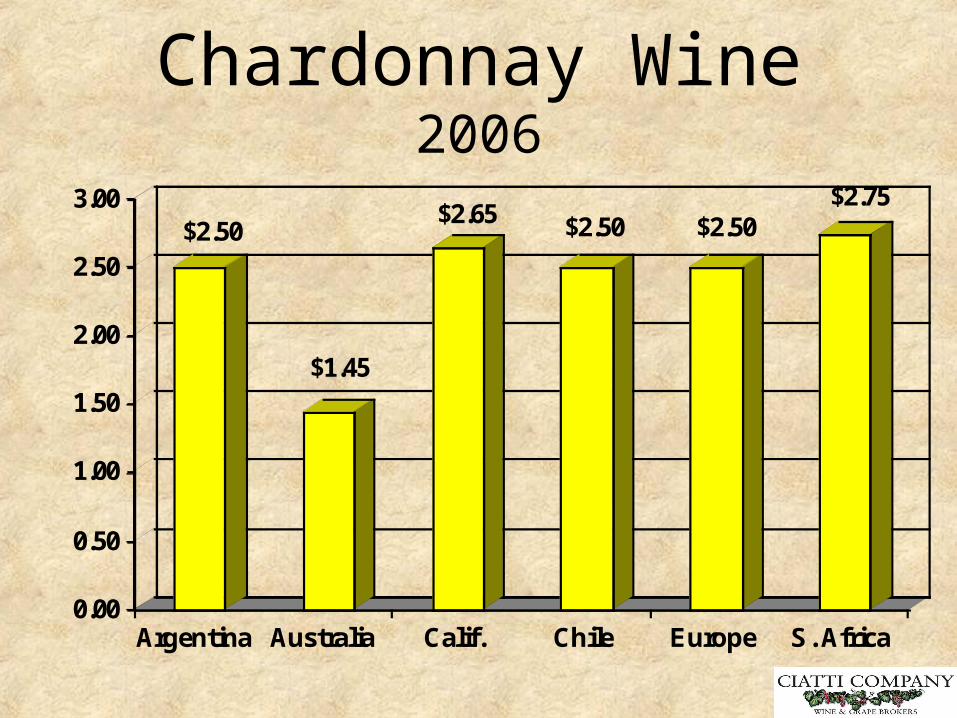
Chardonnay Wine2006
$2.50
$1.45
$2.65 $2.50 $2.50$2.75
0.00
0.50
1.00
1.50
2.00
2.50
3.00
U.S. $ per Gal
Argentina Australia Calif. Chile Europe S. Africa
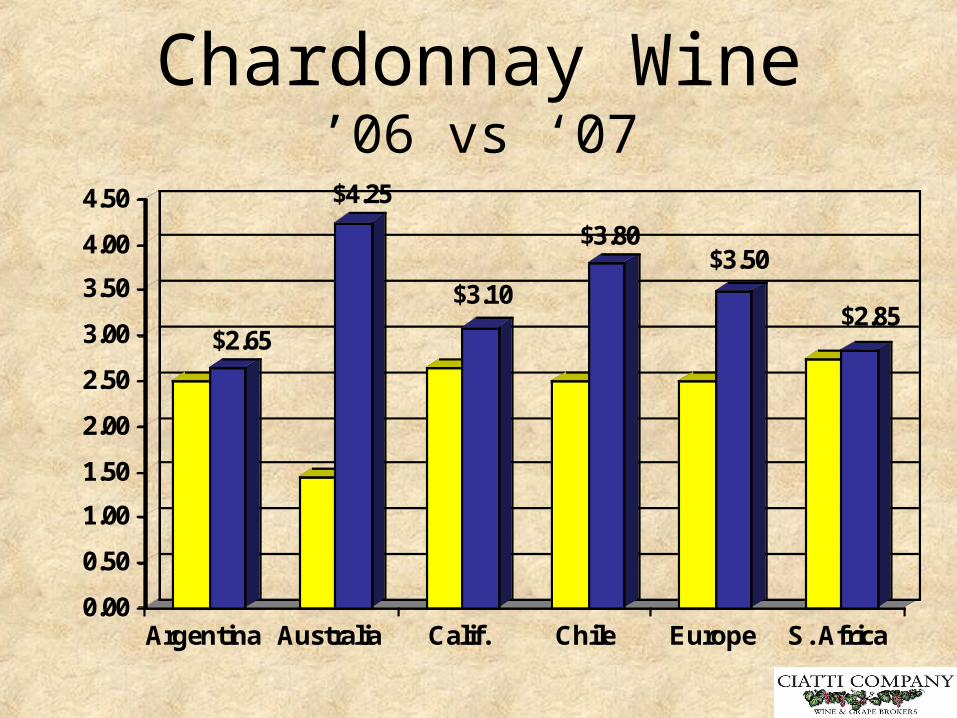
Chardonnay Wine’06 vs ‘07
$2.65
$4.25
$3.10
$3.80$3.50
$2.85
0.00
0.50
1.00
1.50
2.00
2.50
3.00
3.50
4.00
4.50
U.S. $ per Gal
Argentina Australia Calif. Chile Europe S. Africa
Major Export Mkts for SJV Wines
• Canada
• Germany
• Scandinavia
• UK
• Asia

ImportsKey Varieties
Pinot Grigio, Pinot Noir, Riesling, Traditional Varieties
Worldwide inventories move toward balance due to 2007 cropUS Mkt is the most attractive & best Mkt in WorldToday consumer is exploring and finding options for purchaseCurrency & Freight
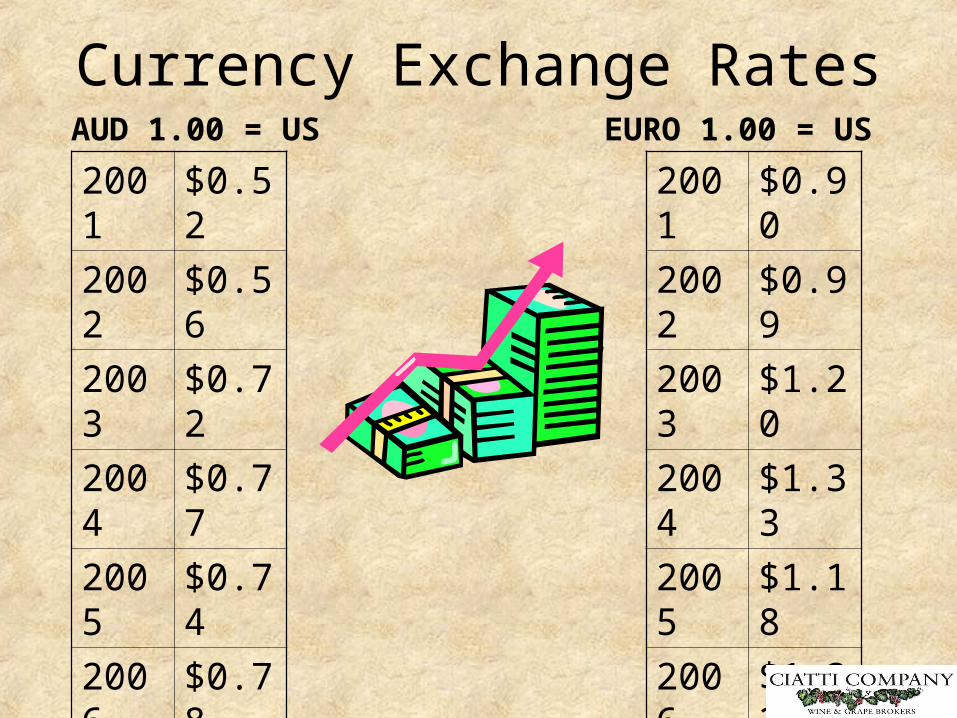
Currency Exchange Rates
2001 $0.52
2002 $0.56
2003 $0.72
2004 $0.77
2005 $0.74
2006 $0.78
2007 $0.87
2001 $0.90
2002 $0.99
2003 $1.20
2004 $1.33
2005 $1.18
2006 $1.32
2007 $1.48
AUD 1.00 = US EURO 1.00 = US

Cost of Ocean Freight
Approx. US$0.80 per gal

What the future holdsU.S. & World has thirst for Calif Wines
Market continues to grow, support it
Activity on grapes should accelerate on demand varietiesConsolidation will continue – Global Market
We must continue to be competitive to survive
Quality is the best option – deliver depth & flavor not sugarBrand Proliferation & Growth

Thank You for your time and Attention
John CiattiManaging Partner, Ciatti
CompanyT.415/458-5150www.ciatti.com


![Herald (Los Angeles, Calif. : 1893 : Daily) (Los Angeles [Calif.]) … · 2017-12-20 · Chicago tomorrow for the rauder of Mayor Harrison, the attorneys lor Pren-dergaet decided](https://img.dokumen.tips/doc/110x75/5f0a3fcc7e708231d42abc2d/herald-los-angeles-calif-1893-daily-los-angeles-calif-2017-12-20.jpg)