Embed Size (px)
Citation preview

This document has been edited for spelling and grammatical errors
1
Centers for Medicare & Medicaid Services
Payment Standardization and Risk Adjustment for the Medicare Physician Feedback and Value Modifier Programs
National Provider Call Moderator: Nicole Cooney
December 21, 2011 1:00 p.m. ET
Contents Introduction 3 Overview: Payment Standardization and Risk Adjustment 4 The Physician Feedback Program and Quality and Resource Use Reports 5 Payment Standardization of Medicare Claims Data 8 Question and Answer Session I 14 The CMS-Hierarchical Condition Categories Risk Adjustment Model 17
Risk Adjustment and the 2010 QRURs 25 Question and Answer Session II 32

This document has been edited for spelling and grammatical errors
2
Disclaimers CPT only copyright 2011 American Medical Association. All rights reserved. CPT is a registered trademark of the American Medical Association. Applicable FARS\DFARS Restrictions Apply to Government Use. Fee schedules, relative value units, conversion factors and/or related components are not assigned by the AMA, are not part of CPT, and the AMA is not recommending their use. The AMA does not directly or indirectly practice medicine or dispense medical services. The AMA assumes no liability for data contained or not contained herein. ICD-9-CM Notice The International Classification of Diseases, 9th Revision, Clinical Modification (ICD-9-CM) is published by the United States Government. A CD-ROM, which may be purchased through the Government Printing Office, is the only official Federal government version of the ICD-9-CM. ICD-9-CM is an official Health Insurance Portability and Accountability Act standard.

This document has been edited for spelling and grammatical errors
3
Introduction Operator: At this time I would like to welcome everyone to the Payment Standardization
and Risk Adjustment for the Medicare Physician Feedback and Value Modifier Program’s National Provider Call.
All lines will remain in a listen only mode until the question and answer
session. This call is being recorded and transcribed. If anyone has any objections, you may disconnect at this time.
Thank you for your participation in today’s call. I will now turn the call over
to Nicole Cooney. Thank you. Ma’am, you may begin. Nicole Cooney: Thank you, Holley. Hello. I’m Nicole Cooney from the Provider Communications Group here at
CMS and I’d like to welcome you to the Payment Standardization and Risk Adjustment for the Medicare Physician Feedback and Value Modifier Program’s National Provider Call.
Subject matter experts are here today to discuss how and why per capita cost
measures are adjusted under these programs. We have question and answer sessions included throughout today’s call to allow time for you to provide input and ask questions.
Before we get started, there are a few items that I’d like to cover. There is a
slide presentation for this session. If you registered for this call prior to 9:00 A.M. this morning, you should have received a direct link to the presentation in your e-mail. If you did not receive this e-mail, please check your spam or junk mail folder for an e-mail from the CMS National Provider Calls resource box.
If you did not receive that e-mail, you may download the presentation now from the Physician Feedback Program section on the CMS website located at http://www.cms.gov/physicianfeedbackprogram. That’s all one word. At the left side of the webpage, click on CMS Teleconferences and Events, then scroll down to the bottom of this page. Select the entry in the table with

This document has been edited for spelling and grammatical errors
4
today’s date, which is 12/21. From this page, scroll to the bottom and select Slide Presentation.
Let me repeat that. Go to http://www.cms.gov/physicianfeedbackprogram – all one word. At the left side of the page, click on CMS Teleconferences and Events, then scroll down to the bottom. Select the entry in the table with today’s date, which is 12/21, and then scroll to the bottom and select Slide Presentation.
This call is being recorded and transcribed. An audio recording and written
transcript will be posted to the CMS Teleconferences and Events page on the Physician Feedback Program website under the entry for today’s call, which I just referenced.
At this time, I’d like to introduce our speakers, who are subject matter experts
on today’s topic. We are pleased to have with us Michael Wroblewski, Senior Technical Advisor in the Center for Medicare; Dr. Sheila Roman, Senior Medical Officer in the Performance-Based Payment Policy Group, also in the Center for Medicare; Peter Hickman, Senior Analyst in the Policy and Data Analysis Group in the Center for Strategic Planning. We are also pleased to have with us Greg Pope, Director of Healthcare Financing and Payment at RTI International; as well as Jeff Ballou from Mathematica Policy Research Incorporated.
And now, it is my pleasure to turn the call over to our first speaker, Michael
Wroblewski from the Center for Medicare at CMS. Michael? Overview: Payment Standardization and Risk Adjustment Michael Wroblewski: Thank you, Nicole, and welcome. The purpose of today’s call – and, as I
get started here, I’m on slide two – the purpose of today’s National Provider Call is to provide transparencies into the methodologies that CMS uses to adjust per capita cost and resource use data in the Physician Feedback Program to insure fair comparisons among physicians.
As you’ll hear today, we have two basic methodologies that we’ve used. One,
what we’ll call payment standardization, is to make sure that we eliminate any
This document has been edited for spelling and grammatical errors
5
geographic adjustments in rates that Medicare pays to physicians. The second adjustment that we make to per capita cost is to take into account the health status of individual beneficiaries. We’ll call that risk adjustment.
The second purpose of the call today is to obtain stakeholder input, input into
these cost adjustment methodologies for use in the value modifier, and Dr. Roman in her presentation will outline the physician value program, as well as our next steps with the value modifier. And hopefully during the Q&A we’ll be able to discuss ways to further improve these cost adjustment processes.
This call is really the first in the series of calls and public events that we will
be having to obtain input into the Physician Feedback Program and as we develop proposals for the value modifier. We’ll be announcing details about these further events after the New Year.
So in terms of today’s agenda – I’m now on slide three – we’ll have some
opening comments and background about the two programs by Dr. Roman. Peter Hickman will talk about payment standardization, and that should last to about 1:30 or so Eastern Time, at which point we’ll then have Q&A.
Starting around 2:00 we’ll have two presentations regarding adjusting cost
data for beneficiary health status. The first will be by Dr. Greg Pope, who’ll talk about the risk methodology that we’ve used in general, and then Dr. Jeff Ballou will talk about how we’ve applied that risk methodology in our physician feedback reports. Then we’ll have about 20 minutes or so for questions and answers about the risk methodologies. And then we’ll have some closing remarks and next steps.
So I will now turn it over to Dr. Sheila Roman to provide some background.
Dr. Roman? The Physician Feedback Program and Quality and Resource Use Reports Sheila Roman: Thank you. Good afternoon, everybody, and thank you for joining the call
and welcome to the call. I’m going to provide some background on the Physician Feedback Program and the value-based modifier and I’m going to start on slide five.

This document has been edited for spelling and grammatical errors
6
What is the Physician Feedback Program? Physician Feedback Program
provides comparative performance information on quality and cost of care to physicians. It is just one part of Medicare’s efforts to improve the quality and efficiency of medical care. We do this by helping to provide meaningful and actionable information to physicians so they can improve the care they furnish and by changing physician reimbursement to reward value rather than volume. So, in essence, the Physician Feedback Program is laying the groundwork for a physician value-based purchasing program.
Turning to slide six, the program is mandated by legislation. The Physician
Resource Use Measurement and Reporting Program was created by the Medicare Improvements for Patients and Providers Act of 2008 and was extended and enhanced by the Affordable Care Act of 2010 and is now called the Physician Feedback Program. Under this program, CMS produces annual Physician Quality and Resource Use Reports that I’ll refer to as QRURs.
On slide seven you see a screenshot, which is the cover of our individual
physician report for this year. The QRURs, as I’ve alluded to, provide comparative information so the physicians can view the clinical care their patients receive and the cost of that care in relation to the average care and cost of other physicians’ Medicare patients. For example, CMS calculates total annual per capita cost measures for patients attributed to a physician or physician group practice.
Moving to slide eight, for this year we provided group reports in September to
35 large group practices that chose to participate in the Physician Quality Reporting System by the group reporting option in 2010. And in early 2012, we will provide physician level QRURs to more than 20,000 individual physicians who participated in Medicare Fee-for-Service in 2010 and practiced in Iowa, Kansas, Missouri or Nebraska.
On slide nine, I want to talk now and focus on the Value-Based Payment
Modifier. The Affordable Care Act of 2010 requires that, under the physician fee schedule, Medicare begin using differential payment to physicians or
This document has been edited for spelling and grammatical errors
7
groups of physicians based upon the quality of care furnished compared with cost. This will be applied in a budget-neutral fashion.
This Value-Based Payment Modifier will apply to services the physician bills
under the physician fee schedule. The types of information in the QRUR serve as the building blocks for the information that will comprise the Value-Based Payment Modifier. The statute also requires that the Secretary applied the Value-Based Payment Modifier to promote systems-based care. CMS will propose a methodology for the Value-Based Payment Modifier in next year’s physician fee schedule rule making, and we are using outreach sessions, such as the one today and others planned for 2012, to help us develop these proposals.
I’m now going to move to slide 11, which is the timeline for the Value-Based
Payment Modifier. And 2013 is the first year of note. The initial performance period for the Value-Based Payment Modifier is slated to begin in 2013, meaning that services provided during calendar year 2013 will be used in calculating the 2015 Value-Based Payment Modifier. Beginning in 2015, the Value-Based Payment Modifier will be phased in over a two-year period.
In 2015, the Secretary of Health and Human Services had discretion to apply
the Value-Based Payment Modifier to specific physicians and/or groups of physicians that he or she deems appropriate. In 2016, the Secretary will continue his or her efforts to apply the Value-Based Payment Modifier to specific physicians and/or groups of physicians that he or she deems appropriate. And by 2017, the Value-Based Payment Modifier will apply to most, or all, physicians who submit claims under the Medicare physician fees schedule.
Moving back to slide 10, the Affordable Care Act requirements. CMS is
required to make adjustments to measures of costs in both the Physician Feedback Program and for the Value-Based Payment Modifier, and these adjustments are different in geographic rates or payment standardization and underlying health status of individual beneficiaries or risk adjustment.

This document has been edited for spelling and grammatical errors
8
I’d like to now move to the discussion of payment standardization, and Peter Hickman will move on with this discussion. Thank you, Peter.
Payment Standardization of Medicare Claims Data Peter Hickman: Thank you, Sheila. I’m happy to be here this afternoon. Just by way of background, our group – my group within CMS, the Policy and
Data Analysis Group, has used payment standardization for analytic purposes to explore Medicare spending at the hospital (before the region) level. Our standardized payments are being used by Institute of Medicine as part of their study on geographic variation. Our payment standardization has been used by researchers like the Dartmouth Atlas Group, by Congressional agencies, like MedPAC, for analytic purposes, and it was also used in our QRUR reports that was sent out by CMS in September.
Today I’m going to be talking about why standardization is necessary; second,
what it means with regard to Medicare payments; and then third, to provide some simplified examples of kind of how it works; and then also be able to answer any questions that you might have.
So I’m now on slide 13. If we – all we were trying to do was to look at the
utilization of single services, there would be no need to do any type of standardization. You can compare inpatient space per thousand or emergency room visits per thousand across geographic areas without making any type of adjustments. But when you are trying to look kind of across services, or bundles of services, then using utilization measures alone becomes kind of problematic, especially in the Medicare program.
For example, with regard to post acute care services, Medicare beneficiaries
can receive post acute care in the skilled nursing setting, where we pay on a per diem basis; in a home health setting where we pay on an episode basis; or in the IRF or LTC where we pay on a stay basis; or they could be at home and go to an outpatient department and receive therapy services there. So trying to figure out what’s happening with regards to, say, post acute care services using just utilization measures is very problematic.

This document has been edited for spelling and grammatical errors
9
There’s also an issue of different practitioners might provide services, and if you were looking just at utilization measures you wouldn’t see that, but that might be important for the program to know that a physician is providing a service as opposed to a physician assistant or a nurse practitioner. Even in a situation of the same practitioner who is providing the service, that service possibly could be provided in the physician’s office itself or in an outpatient department, and that would be kind of important to know the kind of setting.
You could also have a service that’s provided singly or potentially in
conjunction with other types of services, and that would potentially be important to know from kind of an efficiency perspective. But if you’re just looking at utilization measures, you wouldn’t see that.
So, turning to slide 14, to kind of address these issues with using utilization
measures and to be able to capture a broader picture of service use, healthcare spending is often used as a proxy for service use. But this kind of raises its own set of questions. One question is, well, how do you deal with differences in wages and cost of living and cost of doing business practice expenses across geographic areas? Do you check places folks are operating in high cost areas. Do you want them to look inefficient relative to folks at low cost areas, and do you need to do something about differences in wages, differences in practice expenses?
You also have a question within the Medicare program, we have a number of
payment – additions to our payments that basically serve kind of a social purpose and aren’t really related to the care being provided to that particular individual. I’m thinking in terms of a hospital setting, the payments that we make to teaching hospitals, the payments that we make to hospitals that have a disproportionate share of low income patients.
Also in the physician setting, we make additional payments to physicians who
are operating in Health Professional Shortage Areas. And, again, you know, should those payments be included? If you include those payments, does that make the physician look less efficient than he – than he actually is?

This document has been edited for spelling and grammatical errors
10
When you go to dollars, as opposed to using utilization measures, some problems do go away. So, the differences that you have with regards to, say, the different types of setting for post acute care, when you’re dealing with just the dollars that we pay in those different settings, makes it easier to compare so you’re no longer dealing with days of care or episodes or stays, but you’re dealing with program payments. Also, by using dollars, you can capture differences and that result in a payment system from use of one setting versus another, providing a service in a physician office as opposed to an outpatient department or providing a service in ASC versus a – versus on OPD, outpatient department.
You have another issue, which – a final issue, which is kind of how do you
deal with underlying health status cushions, you know, difference in cost resulting from health status. Turning to 15, slide 15, so payment standardization is a process of adjusting Medicare allowed charges in order to be able to make comparisons of service use within or across geographic areas. It’s normally separate and kind of a first step before you think – go to risk adjustment, which deals with differences in allowed charges due to variation in the beneficiary’s health status, and Greg Pope will be talking about that in a couple of minutes.
Turning to slide 16, what does standardization mean for physician payments?
The major thing it means is that we’re taking out the impact of differences in practice expense and differences in labor cost that are measured by the geographic practice cost (indices). That’s removed in a standardized world, and so regardless of where you – where you are, that particular service, if it’s provided in the same setting, is priced at the same – at the same level. It also – standardization also excludes payments that support larger Medicare program goals, such as the add-on to physician payment in the Health Professional Shortage Areas or the differential that we have between participating physicians and non-participating physicians.
Turning to 17, slide 17, in a standardized world we do maintain certain things.
So, for example, we maintain the difference in payments that results from the choice of setting. So if a service is provided in a physician office versus an

This document has been edited for spelling and grammatical errors
11
outpatient department, there’s difference in practice expense, and we want to – we want to be able to capture that. Second, we also want to capture differences resulting from who provides the service, so the current differentials and actual payment for one, say, a physician assistant provides the service as opposed to a physician, those differentials are maintained when we’re talking about standardized dollars.
Also, any type of other adjustment that an actual payment – say, for example,
adjustments made if a procedure is provided in conjunction with other procedures as opposed to being provided by itself, those type of adjustments are maintained when we calculate standardized dollars.
Turning to slide 18, talking about how standardization affects payments in
other settings or other types of providers, I’d mentioned previously the medical education payments, so in standardization, medical education payments, both indirect and direct, are removed; disproportionate share payments are removed; the incremental payments that might occur to some community hospitals and Medicare-dependent hospitals above and beyond the normal DRG payments are removed; there are certain rural add-ons for inpatient rehab facilities, inpatient psych facilities. Those types of adjustments are removed.
Going to slide 19, some additional differences in the standardized, in terms of
standardized dollars, to parallel what we’re doing with removing the GPCI on the physician services, we remove the impact of the wage indices for the provider payments. And also for certain providers and for certain non-labor costs, there’s cost of living adjustments, we don’t include those type of adjustments in standardized dollars.
In some of our payment systems we have state fee schedules, so in a
standardized world, for standardized dollars, you would have a national payment rate as opposed to the state fee schedules. Finally, in terms of the types of adjustments, the outlier payments are included but outlier payments are adjusted to reflect the wages of the particular provider.
This document has been edited for spelling and grammatical errors
12
So now, on slide 20, and this is a very, very simplified example of kind of how payment works, normal payment works and standardized payment works. And the main difference between the two is that we take out the geographic and practice across (the indicia) effect, so that is removed from the formula. Otherwise, we try to mimic everything else that happens in terms of the result of payment modifiers, so for example the adjustments that are made for multiple procedures or the adjustments that are made for co-surgery, all these various types of adjustments also occur with regard to calculating standardized dollars for physician services.
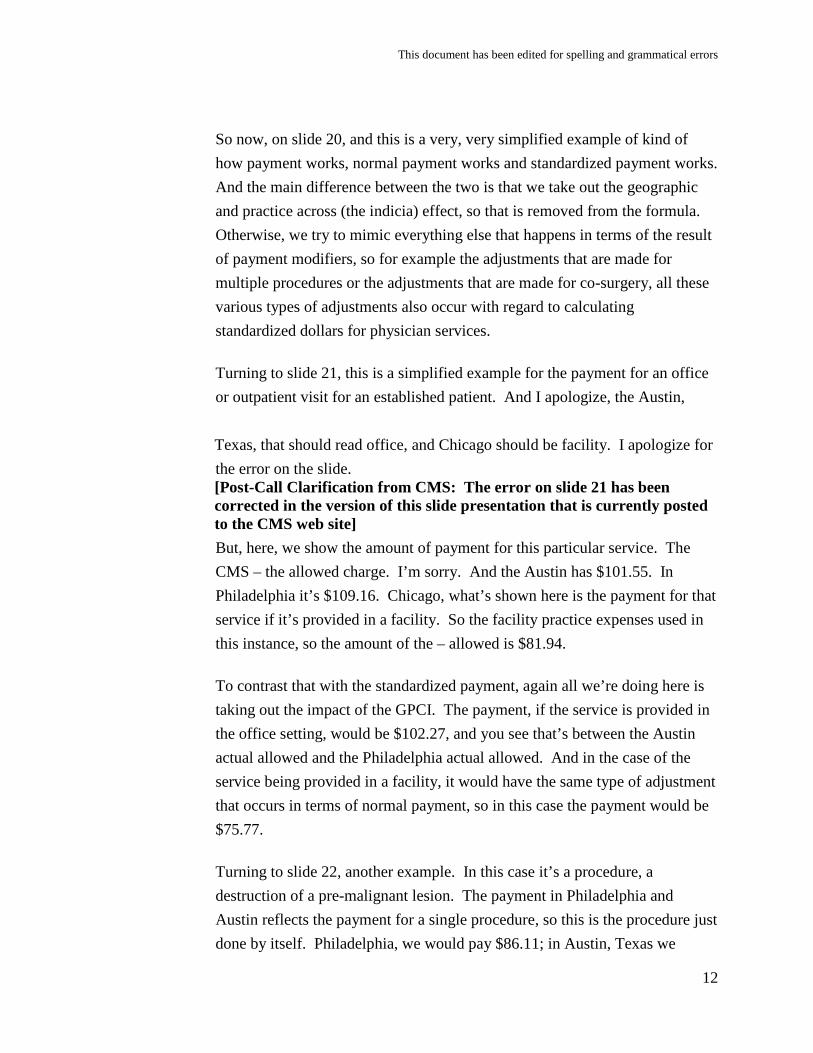
Turning to slide 21, this is a simplified example for the payment for an office
or outpatient visit for an established patient. And I apologize, the Austin,
Texas, that should read office, and Chicago should be facility. I apologize for the error on the slide. [Post-Call Clarification from CMS: The error on slide 21 has been corrected in the version of this slide presentation that is currently posted to the CMS web site]
But, here, we show the amount of payment for this particular service. The CMS – the allowed charge. I’m sorry. And the Austin has $101.55. In Philadelphia it’s $109.16. Chicago, what’s shown here is the payment for that service if it’s provided in a facility. So the facility practice expenses used in this instance, so the amount of the – allowed is $81.94.
To contrast that with the standardized payment, again all we’re doing here is
taking out the impact of the GPCI. The payment, if the service is provided in the office setting, would be $102.27, and you see that’s between the Austin actual allowed and the Philadelphia actual allowed. And in the case of the service being provided in a facility, it would have the same type of adjustment that occurs in terms of normal payment, so in this case the payment would be $75.77.
Turning to slide 22, another example. In this case it’s a procedure, a
destruction of a pre-malignant lesion. The payment in Philadelphia and Austin reflects the payment for a single procedure, so this is the procedure just done by itself. Philadelphia, we would pay $86.11; in Austin, Texas we

This document has been edited for spelling and grammatical errors
13
would pay $78.85. And Chicago shows the effect of- in terms of that service being provided with – or that procedure being performed with other procedures where it’s not the most expensive procedure. So it’s discounted in terms of our payment, so the payment for that destruction of a pre-malignant lesion as a second procedure in Chicago is $43.13.
CPT only copyright 2011 American Medical Association. All rights reserved. In terms of the standardized payments for this CPT code, it’s performed as a
single procedure. It would be $79.50. Again, you see that $79.50 is between the Austin payment of $78.85 and $86.11. And in the case of this procedure being done with other procedures, where it’s basically kind of a second procedure, the same discounting that occurs in terms of generating actual payments is mimicked with what regard it happens with standardized payment, so the payment would be $39.75.
So in a standardized world, every time a physician provides this particular
code, that $79.50 would be what’s credited to him or her as opposed to what the actual amount would be, and that’s kind of an equal amount across the whole country.
Turning to slide 23, here’s the example in a hospital setting. And again our
formula is a little bit more complicated here because potentially the hospital can receive payment for IME and DSH and outlier payments. But again you see the main difference or a couple of differences in the formula between the Medicare allowed amount and the standardized allowed amount, first of all we’re removing the impact of the wage index. Second, we’re removing IME and DSH payments, if they’re present. And third, we’re adjusting the outlier payment if there is an outlier payment.
If you turn to slide 24, you see a numeric example. In this instance we have
three hospitals – Hospital A, located in Philadelphia; Hospital B, located in Austin, Texas; Hospital C, located in Chicago. And this is for DRG 194, which is simple pneumonia, and you see that the actual payments range from $5,732.25 in Austin, so the Hospital B in Austin, to $9,199.75 to Hospital A in Philadelphia.

This document has been edited for spelling and grammatical errors
14
If you look at the columns, you see that one of the main reasons that the payment to Hospital A is so high is that it has the – receives the Indirect Medical Education payments because it’s a teaching hospital. In this example, both Hospital B and Hospital C are not teaching hospitals, but they still receive Disproportionate Share of payments.
So, if you look at the bottom, you see what the standardized payment would
be, so we remove the impact of the wage adjustment from the operating and the capital payment. There’s no payment for IME or DSH, so you get a payment that’s $56.69, and that would be uniform across the whole country.
So, hopefully that gives you a sense of kind of why standardization is
necessary, and how we’re thinking about implementing standardization in some examples. And, with that, I’ll turn it over to Nicole. Thank you very much.
Question and Answer Session I Nicole Cooney: Thank you, Peter. At this time, we would pause for just a few minutes to complete keypad
polling so that CMS has an accurate count of the number of participants on the line with us today. Please note, there may be moments of silence while we tabulate the results.
Holley, we’re ready to start the polling. Operator: CMS greatly appreciates that many of you minimize the government’s
teleconference expense by listening to these calls together in your office, using only one line. Today we would like to obtain an estimate of the number of participants in attendance to better document how many members of the provider community are receiving this valuable information.
At this time, please use your telephone keypad and enter the number of
participants that are currently listening in. If you are the only person in the room, enter one. If there are between two and eight of you listening in, enter

This document has been edited for spelling and grammatical errors
15
the corresponding number between two and eight. If there are nine or more of you in the room, enter nine.
Please hold while we complete the polling. Please continue to hold while we
complete the polling. Once again, please continue to hold while we complete the polling.
Thank you for your participation. We will now move into the Q&A session
for this call. To ask a question, press star followed by the number one on your touchtone
phone. To remove yourself from the queue, please press the pound key. Please state your name and organization prior to asking a question and pick up your handset before asking your question to assure clarity.
Please note, your line will be – will remain open during the time you are
asking your question, so anything you say or any background noise will be heard in the conference.
Nicole Cooney: And Holley, let me just take this time to remind everyone that this call is
being recorded and transcribed, and during this first Q&A session we’d like to hear input and questions on the presentations we’ve heard so far. We do have another Q&A session planned to hear questions and input on the second half of our agenda.
And, as Holley mentioned, before asking your question, please state your
name and the name of your organization. And in an effort to get to as many of your questions and comments as possible, we ask that you limit your question or comment to just one.
Holley, we’re ready for our first question. Operator: Your first question comes from the line of William Rich. William Rich: Hi. This is Bill Rich from the American Academy of Ophthalmology. A
question for Peter Hickman.

This document has been edited for spelling and grammatical errors
16
I have a little – you know, I understand standardization of cost. I’m deeply concerned, though, about your assumption that the employed facility physician should only be accredited – credited the work and limited practice expense and not the 44 percent kicker that’s actually part of the facility fee. It seems to be inconsistent with your policy of looking at costs that are associated with choice of facility, and this physician has chosen to work for a facility.
I appreciate your comment. Michael Wroblewski: Peter, would you like to go ahead and take – this is Michael Wroblewski.
Peter, would you like to go ahead and take that question? Peter Hickman: Sure. I mean, basically what we’re trying to do is – as best as possible to
replicate what happened with regards to Medicare payments, but just to exclude the geographic adjustors. So we’re not introducing anything that doesn’t happen already within the payment systems.
William Rich: So indeed those individuals are paid 44 percent more than the office-based
facilities. So, again, I think that’s the only assumption I think that I have any concerns with, Peter.
Peter Hickman: Well, thank you for sharing your opinion. Operator: Once again, in order to ask a question please press *1 on your telephone
keypad. Your next question comes from the line of Douglas Carr. Douglas Carr: Yes. This is Douglas Carr from Billings Clinic in Billings, Montana for
Sheila Roman. I’d like to have her expand on the quality of resource use reports that feeds into developing the Value-Based Payment Modifier. I assumed that – I know this is one question, but it’s all – it’s all one. You are giving two reports to, I assume, a single TIN, a physician group tax identification number and how does – how are the expenses or per capita beneficiary expenditures attributed to a particular group or to a particular physician?

This document has been edited for spelling and grammatical errors
17
Sheila Roman: Yes. I think you’re talking about our group reports, and for our group reports,
I’ll just mention that for quality, in order to participate in the Physician Quality Reporting System, there were 26 common measures that all of the 35 groups reported to CMS. So we had essentially a core measure set for quality for comparison.
For cost, we had to have two E&M visits with the – with the group in order to
be attributed to that group. Or, a plurality of visits. So, either two visits or a plurality of visits. [Post-Call Clarification From CMS: The statement above should read - For cost, patients had to have two evaluation and management (E&M) visits and a plurality of visits with the group in order for a patient to be attributed to that group.]
Nicole Cooney: OK. Holley, can we take the next question? Operator: Yes, ma’am. Your next question comes from the line of Sarah Ton. Sarah Ton: Yes. Hello. I’m a staff here at American Academy of Neurology, and I’m
asking a couple of things. On slide 10, I saw that you mentioned underlying health status of individual
beneficiaries having to do with risk adjustment, and then on slide 15 again you stated – let’s see here – the payment standardization is separate from risk adjustment, but then you say that the allowable charges due to variation and health status.
My question is that it would help a lot if we had common language behind
what you’re defining as health status. So,o my understanding when health status is used, it’s about quality of life, so how the patient reports their physical function, their mental function and their societal function, as well as some other variables. And yet when I read risk adjustment I’m thinking more of severity measures. So for example in stroke, adjusting for (NIEGSF), which is more of a clinical outcome severity adjustment rather than a health status. So it would benefit all of us if we all understand what is being captured on health status, or is that the way you intended to use the term
This document has been edited for spelling and grammatical errors
18
health status in terms of quality of life issues or getting into clinical outcomes, which are adjusted by severity of illness?
Sheila Roman: Yes. I think your point is well made, and I think that will become clearer in
the discussion by Dr. Gregory Pope specifically on risk adjustment. In general I would agree with you that health status refers to quality of life and I think it will become clear that when we speak about risk adjustment we’re talking more about more of comorbidities that patients may have.
Sarah Ton: OK. Thank you. That helps. Operator: At this time, there are no further questions. Nicole Cooney: OK. Thank you to those of you who asked questions during our first Q&A
session. And, as a reminder, we do have another session planned to take place after the next two presentations.
Now, I’ll turn the call over to our next presenter, Mr. Greg Pope from RTI
International. Greg? The CMS-Hierarchical Condition Categories Risk Adjustment Model Gregory Pope: Thank you. This is Gregory Pope. So I’m starting on slide 25 and I’ll be
talking about the CMS Hierarchical Condition Categories or CMS HCC risk adjustment model. I’m with RTI International, who’s a contractor to CMS, who helped develop and maintain this model, and we’re a non-profit research institution with our main offices in North Carolina’s Research Triangle Park.
All right, so moving on to slide 26, an overview of the presentation. I’ll start
out with why does CMS risk adjust based on beneficiary health status, talking about the principles of risk adjustment, give an overview of the model and talk about included conditions and model inputs, model structure and calibration, model performance and an example of calculating a risk score with the model.
So, on slide 27, why does CMS risk adjust cost? Risk adjustment, as a
method of adjusting per capita cost which may adjust them either up or down to account for differences in expected costs of individuals based on their health status. For the Physician Feedback and Value Modifier Programs, their

This document has been edited for spelling and grammatical errors
19
purpose is to promote fair per capita cost comparisons by adjusting for the health status of different beneficiary, attributed beneficiary populations.
Risk adjustment’s intended to accurately predict risk over aggregates of
individuals and not just specifically predict the cost of a particular individual. We turn to a point later with a larger aggregations of beneficiaries below average cost will balance out above average cost, so risk adjustment is intended to predict the systematic portion of cost but some of the unpredictable portions, when you aggregate over a number of beneficiaries, the above average and below average cost, unpredictable cost will tend to average out the systematic portion, which is what you’re attempting to adjust for.
So, on slide 28, principles of risk adjustment. Diagnostic category should be
clinically meaningful and should be able to predict cost in creating an individual’s clinical profile. Hierarchies are used to characterize the individual’s illness within each disease process as the effects of unrelated disease processes accumulate. And I’ll come back to explain in more detail later. Diagnostic classifications should encourage specific coding of diagnoses and not reward coding proliferation at the same or similar codes. And providers should not be penalized for recording additional diagnoses.
So, slide 29, an overview of the CMS-HCC model. The model uses
beneficiary demographic characteristics and prior year diagnoses to predict relative Part A and Part B Medicare Fee-for-Service program payments. The CMS-HCC model does not incorporate Medicare Part D costs, which are predicted separately by the CMS RXHCC model. The CMS-HCC model is prospective, meaning it uses prior year information to predict cost and focuses on specific conditions that are important in predicting Medicare expenditures.
Slide 30, what is the CMS-HCC model currently used for? Major use is is
Medicare Advantage capitation payments. It was implemented for this purpose in 2004 and fully phased in by 2007 for 100 percent risk adjusted payments. It’s also in the final rule, which was recently released for the Shared Savings/ Accountable Care Organization program to be implemented in 2012.

This document has been edited for spelling and grammatical errors
20
There are some twists as to how risk adjustment is to be used in that program.
It’s not used in the same way as in the Medicare Advantage program but it is the HCC risk scores are used or proposed to be used in that program. And then the Medicare Physician Quality and Resource Use Reports the potential here implemented in 2009 and adjust comparisons of per capita costs for patient health status.
So, I’m on to slide 31, a word about the development and maintenance of the
model. The CMS-HCC model was originally developed under contract to CMS by researchers at Boston University and the Research Triangle Institute, with clinical input from Harvard Medical School physicians. The model is currently maintained by RTI under contract to CMS, with clinical input from Harvard Medical School and other consultants to RTI. The model is updated every year to incorporate new diagnosis codes and is recalibrated regularly and more recent diagnoses and expenditure data.
So, slide 32, in terms of what medical conditions are included in the model,
the full CMS-HCC model classifies all conditions but, not all conditions are used in payment and other applications of the model. The CMS-HCC payment model includes clinically significant, generally, high cost medical conditions such as cancer, heart disease, hip fractures that are – some conditions are excluded from the payment model. These are those that do not predict a future cost.
For instance, appendicitis, certainly there are costs associated with that in the
year it occurs, but it’s not predictive of future costs. And, then, conditions where there’s a high degree of discretion or variability in diagnosis, diagnosis coding or treatment. Symptoms codes would be an example of this, you know, vague diagnoses would not be included.
So slide 33, model variants of the CMS-HCC model. There are actually a
number of different variants for different Medicare subpopulations or situations. For beneficiaries entitled to Medicare by age or disability, so this would be both, you know, elderly beneficiaries and the under 65 beneficiaries entitled by disability. There is a community continuing enrollee model. This

This document has been edited for spelling and grammatical errors
21
would be for beneficiaries residing at the community and who have been in Medicare at least 12 months, so they have 12 months of claims experience.
There’s an institutional continuing enrollee model and then there’s a new
Medicare enrollee model for beneficiaries with less than 12 months of claims experience because that 12 months of claims experience is necessary to establish a sufficient diagnostic profile to predict their costs. Then there are also several variant models for End Stage Renal Disease beneficiaries. For the Physician Quality and Resource Use Reports, those will be using – they are using the aged, disabled community, the new enrollee and the ESRD models.
So, slide 34, model inputs. So, we’ll start the risk adjustors and demographic
factors. So what are the risk adjustors used by the model? They can be divided into two main classes. One is demographic or Medicare enrollment information, insurance enrollment information for Medicare and diagnoses. Those are part of the two main categories.
In terms of demographic factors, the model uses 24 age-sex cells, so an
example would be a middle aged, (80 to 84). The model also uses Medicaid dual eligible status, so if they are, you know, dual eligibles for Medicaid as well as Medicare programs, so these are generally, you know, poor beneficiaries who qualify for Medicaid as well as Medicare, so there’s a adjustment for the higher costs associated with these beneficiaries, which is differentiated by sex and age versus disabled entitlement status.
Then, for disabled status for beneficiaries entitled by disability, there’s sort of
two related adjustments. There’s an adjustment for beneficiaries currently entitled by disability. So it would be the under age 65 Medicare beneficiaries and they’re separated by sex and Medicaid factors for them, as well. Selected diagnoses have different risk weights to affect – to reflect the different impact of certain diagnoses on the cause for the disabled as opposed to the aged.
Then, the second category of disabled status adjustment is for beneficiaries
who are currently entitled by age but who are originally entitled to Medicare by disability. So, these are beneficiaries aged 65 or older but who originally

This document has been edited for spelling and grammatical errors
22
joined the Medicare program when they were under age 65 because of a disability. And, there’s an adjustment for the higher cost of these beneficiaries as they age and become older and become entitled to Medicare by age when they’re older than 65. But, there is still higher cost and there’s a factor in the model to reflect that, and that’s differentiated by sex.
So, slide 35, so diagnoses. That’s the other major risk adjustor used in the
model for model calibration and Fee-For-Service applications. The diagnoses are obtained from Fee-For-Service Medicare provider claims or bills submitted to Medicare that use the International Classification of Diseases Version 9 Clinical Modification diagnosis codes and the codes will be transitioning to ICD 10 in fiscal year 2014, so October 2013.
Diagnoses are used only from specified settings and provider. Not all
diagnoses on the Medicare claims, so the diagnoses are used from the hospital inpatient setting, both the principal and patient diagnosis and secondary from a hospital outpatient, from physician claims and from certain clinically trained non-physician providers, such as clinical psychologists.
Moving to slide 36, continuing to talk about the diagnoses used in the model
diagnoses from laboratory, radiology, home health, skilled nursing facility and other settings are not used in the model. The number of times a diagnosis is recorded does not affect the calculated risk score from the model, and the setting from which a diagnosis is reported does not matter. So, for example, inpatient diagnoses are not weighted more heavily than outpatient diagnoses.
Slide 37, so how does the model capture severity of illness? The CMS-HCC
model counts in the most severe manifestation among related conditions and the principles implemented through what is called disease hierarchies. So related diseases are organized into hierarchy of severity from, you know, the most severe at the top to the less severe at the bottom.
And they – the beneficiary – the model counts the most severe manifestation
of a related disease for even beneficiary, for example, if a beneficiary happened to be coded both with diabetes with complications and diabetes

This document has been edited for spelling and grammatical errors
23
without complications, only the former will be counted. I will give some more examples in a minute.
So, in slide 38, how does the model handle multiple diagnoses which a
Medicare beneficiary has? The basic principle is that the model is added to across disease hierarchies. So, unrelated conditions are counted cumulatively. So, related conditions are counted within hierarchies.
For instance, a model has a cancer hierarchy, hierarchy for heart disease, lung
disease, cerebrovascular disease, but total disease burden is measured by the severity and disease hierarchy for related conditions. And the cumulative or additiveburden of multiple conditions across unrelated conditions.
The model also allows for disease interactions or interactive effects among
multiple conditions. For example, congestive heart failure and Chronic Obstructive Pulmonary Disease having an interactive effect beyond their separate additive effects, which is recognized in the model.
So slide 39, this is a graphic of the CMS-HCC model structure. Specific
counts here are related to Version 12 of the model. There are a number of versions and models have been revised over time and there’s, really, this specific Version 12, which is currently being used for Medicare Managed Payment.
So, the starting point for the model is the 14,000 or more ICD-9 codes are
coded on provider bills submitted to Medicare. And, then, the model groups it into something we call diagnostic groups or DXGs and they’re about 800 of these in Version 12 of the model. Then, there’s further stage of aggregation to condition categories and there are 189 of these.
And, at that point, hierarchies are imposed among the related diagnoses or
diagnostic categories to convert the condition categories into Hierarchical Condition Categories or HCC- still 189 of those. Then, a subset of those 189 diagnostic categories are selected for the payment version of the model, which 70 conditions excluding diagnoses or codes that are thought to be, you know, either empirically are not predictive of significant future cost or judged to be

This document has been edited for spelling and grammatical errors
24
subject to a high degree of discretion or variability in diagnosis or diagnostic coding or treatment.
So, slide 40 shows an example of the coronary artery disease hierarchy in
Version 12. The top of the hierarchy, CC-81, is acute myocardial infarction. The next CC hierarchy is 82 unstable angina and other acute ischemic heart disease and CC-83 is angina pectoris or myocardial infarction. And, then, at the bottom of the hierarchy is CC-84 is coronary atherosclerosis, other chronic ischemic heart disease.
So, if a beneficiary is coded, for example, with acute myocardial infarction,
CC-81, or I should say CC-81 is a different hierarchy here, then, they would be excluded from the other HCCs as would not be accounted in the model.
So, slide 41 gives a clinical vignette to show the process of how we move
from ICD-9 codes to DXGs to CCs and HCCs. So you can see on the left side of the slide, some hypothetical ICD-9 codes that the beneficiary might be coded with are listed. And you can see how 410.91 AMI of unspecified initial episode of care, that goes into the DXG AMI initial episode of care. And that DXGs then mapped into the CC acute myocardial infarction and that becomes the similarly labeled or the same label HCC.
This beneficiary also had ICD-9 for 13.9, which is unspecified angina
pectoris. That goes into the DXG for angina and CC, but then that’s excluded by the hierarchy because that was in the coronary artery disease hierarchy. And since HCC 81 is above HCC 83, only HCC 81 is counted and HCC 83 is excluded.
There’s also some one diagnosis we showed to along ICD-9 codes that are
grouped into DXG for emphysema and that goes into the CC for chronic obstructive pulmonary disease. And the HCC for chronic obstructive pulmonary disease so then because that’s in the lung hierarchies supposed in the heart hierarchy, the HCC 81 for AMI and HCC 108 for COPD would be counted additively because those are two separate hierarchies.

This document has been edited for spelling and grammatical errors
25
Then at the bottom of the slide, there are some codes for symptoms and some relatively minor acute conditions and those conditions are classified by the model, but they’re not included in the payment versions of the model.
So if we move to slide 42, which discusses model calibration, the model is
calibrated on 100 percent Medicare Fee -for -Service data of 25 to 30 million beneficiaries. Two years of data are used in the calibration. For example, 2009 and 2010, the first year, base year 2009 in this example is used to accumulate a diagnostic profile from the ICD-9 diagnosis codes. And then that diagnostic profile, together with the demographic enrollment information, is used to predict Medicare payments for the second or prediction year which is 2010 in this example.
So what is predicted by the model is Medicare Program Payment, so it does
exclude the beneficiary cost sharing deductibles and co-insurance paid by the beneficiary or supplemental insurance.
There are adjustments in the second year for partial eligibility. For example,
due to beneficiary death, but a full 12 months of year one eligibility is required to develop the diagnostic profile. And if the beneficiary does not have full 12 months in year one because, for example, they’re a new Medicare enrollee, they would be then allocated to the new enrollee model that I mentioned earlier that uses demographic and enrollment data only which is available for them and they would be predicted by that new enrollee model.
Then finally in this slide, multiple regression which is a statistical technique is
used to estimate the incremental cost impact of each demographic factor and diagnostic category.
OK. So moving on to slide 43, I have a couple of slides on model
performance. The first slide is the so-called R-squared statistic, which is a measure of the percentage of variation in individual beneficiary expenditures explained by the model. This is approximately 12 percent for the CMS-HCC model which may seem relatively low, but it’s important to keep in mind that you’re using prior year information to predict the following year, and much of

This document has been edited for spelling and grammatical errors
26
health expenditure variation like in a year ahead is acute or random from the point of view of the model and is not predictable with prior year information.
But, for example, as a comparison, the R-square from a demographics only
model is about one percent, so the diagnosis base model is predicting quite a bit more variations than the demographic model.
So if we go to slide 44, we see model performance for quintiles of predicted
expenditures and you can see that, you know, one would be the lowest quintile and five the highest. And you can see the mean actual dollars of expenditures ranging from 2,800 to over 19,000 and that the mean predicted dollars by the model ranging from about 2,500 to 19,500. And the final column of the table is a ratio of the predicted to the actual.
So this is showing that the model when beneficiary is, you know, predicted to
be expensive or less expensive than average that on average they are in fact predicted accurately so the model is well calibrated in the sense that when it predicts someone to be expensive, on average, they will be expensive. So it’s differentiating, sort of systematically, less expensive beneficiaries from systematically more expensive beneficiaries.
Slide 45, this is like in a model performance for predicting the average cost
associated with certain specific diagnosis. And here you can see the prediction is actually perfect which is cheating a little bit because these ratios were calculated on the calibration sample. If we took an independent sample it wouldn’t be quite so good. But still they’ll be closed to one.
So this is showing that the model is predicting the higher average cost
associated with, you know, serious, chronic illnesses that are but important to cost drivers. There are drivers of differences and costs among Medicare beneficiaries.
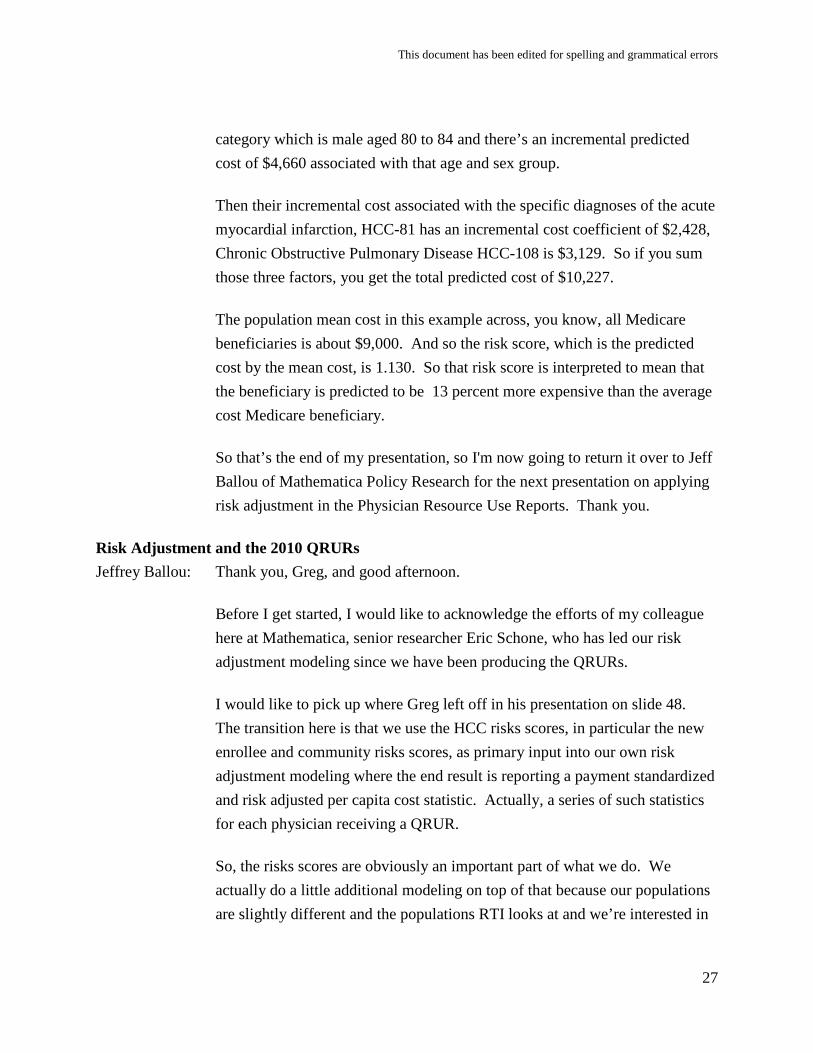
So slide 46 is an example of a risk score calculation for specific beneficiary
for a 20 – should say 82-year-old male with prior year diagnosis of acute myocardial infarction and Chronic Obstructive Pulmonary Disease. So the model consists of, you know, first allocating this person to their demographic
This document has been edited for spelling and grammatical errors
27
category which is male aged 80 to 84 and there’s an incremental predicted cost of $4,660 associated with that age and sex group.
Then their incremental cost associated with the specific diagnoses of the acute
myocardial infarction, HCC-81 has an incremental cost coefficient of $2,428, Chronic Obstructive Pulmonary Disease HCC-108 is $3,129. So if you sum those three factors, you get the total predicted cost of $10,227.
The population mean cost in this example across, you know, all Medicare
beneficiaries is about $9,000. And so the risk score, which is the predicted cost by the mean cost, is 1.130. So that risk score is interpreted to mean that the beneficiary is predicted to be 13 percent more expensive than the average cost Medicare beneficiary.
So that’s the end of my presentation, so I'm now going to return it over to Jeff
Ballou of Mathematica Policy Research for the next presentation on applying risk adjustment in the Physician Resource Use Reports. Thank you.
Risk Adjustment and the 2010 QRURs Jeffrey Ballou: Thank you, Greg, and good afternoon. Before I get started, I would like to acknowledge the efforts of my colleague
here at Mathematica, senior researcher Eric Schone, who has led our risk adjustment modeling since we have been producing the QRURs.
I would like to pick up where Greg left off in his presentation on slide 48.
The transition here is that we use the HCC risks scores, in particular the new enrollee and community risks scores, as primary input into our own risk adjustment modeling where the end result is reporting a payment standardized and risk adjusted per capita cost statistic. Actually, a series of such statistics for each physician receiving a QRUR.
So, the risks scores are obviously an important part of what we do. We
actually do a little additional modeling on top of that because our populations are slightly different and the populations RTI looks at and we’re interested in

This document has been edited for spelling and grammatical errors
28
making sure that the comparisons that we ultimately will make on resources across physicians are as fair as possible.
So I’d like to begin by giving you a brief overview on this slide 48 here and
then talking in slightly more detail in coming slides before concluding with a numerical example.
We start with beneficiary level data and we need to end up with physician
level statistics. So how do we that? Well, we start with claims data aggregate to the beneficiary level and price standardized from across total, basically beneficiary cost in total across Part A and Part B. And we want to estimate the relationship between beneficiary risks scores as described previously in these beneficiary costs.
We then want to take that estimated relationship and use it in the next step to
compute expected cost for each beneficiary, and a little bit more on that later. We then take from each physician all of the beneficiaries we’ve attributed by a separate algorithm to that physician and add up their observed costs and then divide that sum of observed costs by the sum of expected costs that have been calculated for that same set of beneficiaries.
And this gives us an observed to expected ratio for each physician. We then
take that ratio and translate it into a dollar format and then we use those dollar denominated risk adjustment costs to make comparisons among peers.
On slide 49, I want to discuss a little bit about what gets risk adjusted. Our
focus here is on adjusting per capita, per patient, per beneficiary cost measures for physicians to account for each beneficiary’s expected costs given the beneficiary’s health status.
And mindful of the comment that was made in the earlier Q&A session, if I
reference health status in my presentation; I have a very specific definition in mind, a very narrow definition which is essentially the combination of the beneficiary’s risk score and whether or not the beneficiary has ESRD, those two pieces of information taken together.
This document has been edited for spelling and grammatical errors
29
We have essentially one risk adjustment model that we apply, but we apply it to five populations. We risk adjust all beneficiaries in our sample and then we separately risk adjust beneficiaries with coronary artery disease, those with COPD, those with diabetes, and those with heart failure.
And the reason for this is that we report for a given physician receiving a
QRUR, not only a risk-adjusted per capita cost number for all of their attributed beneficiaries, but also, for example, a risk-adjusted per capita cost number for all of that physician’s attributed beneficiaries who have diabetes. And for that reason we want to make sure we risk adjust these populations separately.
On the next slide, slide 50, who gets risk adjusted? There are some
beneficiaries who, in spite of having been treated by a physician, do not end up entering into the data that the physician received on their QRUR that is they’re excluded. And they may be excluded for multiple reasons. But for example part-year beneficiaries are not eligible for attributions in 2010, which is the data year that we’re using for these reports. A part-year beneficiary is a beneficiary who does not have a full 12 months of enrollment in Medicare fee-for-service Part A and B. And there are some other reasons why beneficiaries might be excluded.
In addition, beneficiaries with total Medicare costs in the bottom one percent
of the unadjusted cost distribution – so those with very low total standardized Part A and Part B costs are dropped prior to doing any risk adjustment. All remaining beneficiaries, assuming that they have a 2009 new enrollee or community risk score, are included in our risk adjustment model. And a rare case where both, both scores are provided, we default to using the new enrollee score in our model.
So on Slide 51, the question is, well, how do we estimate this relationship
between risk and cost that I referred to at the outset, and then what do we do with it? We start by treating the data for outliers. So, as I’ve indicated on the previous slide, the very lowest cost beneficiaries are dropped from the model. The highest cost beneficiaries are not dropped from the model, but we are

This document has been edited for spelling and grammatical errors
30
concerned about disadvantaging any physician who, by virtue of chance, happens to be treating a beneficiary who has very high costs.
And for that reason, we take any beneficiary whose unadjusted costs are
above the 99th percentile and reset that cost to the 99th percentile. So, for example, if one of my patients costs $150,000 on an unadjusted basis and the 99th percentile value is $106,000, for all purposes of reporting and risk adjustment, that beneficiary is going to look like they actually cost the lower number, $106,000.
After we’ve addressed outliers in the data – again, this is for purposes of
fairness, but also to improve our subsequent model fit – we then take these 2010 costs and we use a multiple regression model – and Greg had referred to these in his earlier presentation – and we seek to explain them based on the 2009 value of those beneficiaries’ HCC risk scores. We anticipated and find a positive relationship – again, higher risk is consistent with higher cost, on average. We also look at whether the beneficiary has End-Stage Renal Disease. Again, there is a strong and significant association between the presence of ESRD in 2009 and costs in 2010.
And then finally, to further improve model fit, we also include the squared
value of the risk score – either the community risk score or the new enrollee risk score, whichever happens to be applicable to a given beneficiary cost. And so this step two here estimates the relationship between risk and cost. What is the output of that? Well, the output is essentially a series of multipliers from this regression model that we use to compute the expected costs from risk factors for each beneficiary in our sample.
And so what we mean by expected costs here are, what are our best guess of
what a given beneficiary would cost if we didn’t know their actual cost? Now what the model allows us to do is to put in as that best guess an estimate of the average cost of all beneficiaries in our sample who look like the one whose expected cost we’re considering. That is, we look at the average of all beneficiaries of the sample who have similar risk scores and the presence or absence of ESRD.

This document has been edited for spelling and grammatical errors
31
On Slide 52, I want to tell you now how we go from risk-adjusted beneficiary-level costs – which is where we are at the moment – to a summary statistic that’s at the physician level. And again, as I indicated in the overview, this is going to be based on a ratio of observed to expected costs where observed costs for a given physician are going to be the sum of actual – that is, prestandardized Part A and Part B costs for the physician’s attributed beneficiaries – divided by the sum of expected costs that have been computed for that same set of attributed beneficiaries.
To convert the observed to expected ratio into dollars, we then multiply by the
mean cost of all beneficiaries in our sample, which is on the order of $11,000 and change. And then finally, it’s – I guess this is sort of the summary of risk adjustment – it’s not physicians then with low observed costs relative to their peers who look good. But after risk adjustment, really the relevant comparison is physicians with low-observed to expected ratio of costs by the ones who do best in peer comparisons for resource use.
That’s a summary of how we proceed, starting with the risk scores that RTI –
you know, that the CMS HCC model outputs, and with further refinement. On Slide 53 I want to take you back through that same process, only this time using numbers to, hopefully, help clarify and, and crystalize the ideas. And, so, on Slide 53 we have the beneficiary-level data that we start out with for four hypothetical beneficiaries, four among many in our data. Again, the sample mean for all beneficiaries in our data of observed cost – again, that’s total Part A plus Part B on a payment-standardized basis is $11,379.
So we have an observed cost for each beneficiary, and then we have a risk
score for each beneficiary – either the community risk score or the new enrollee risk score. And then finally, we have information on whether each beneficiary has End-Stage Renal Disease or not. Now that we’ve got observed cost and some risk information – risk and ESRD – what we want to do next is figure out the expected cost of each beneficiary based on the previously estimated relationship between risk and cost.
So I want to show you how we’ll do that for Arthur. So we’re going to set
aside Arthur’s observed cost – that’s not going to enter into the next

This document has been edited for spelling and grammatical errors
32
calculation – and look at his community risk score and lack of End-Stage Renal Disease on the next slide, Slide 54, and ask how that information is used to output an expected cost, the cost we would guess would prevail for beneficiaries who are like Arthur in terms of having a similar community risk score and no ESRD.
So on this slide, what you see on the left-hand side, the various rows of this
table are the different variables that are in our risk adjustment model. The value column are Arthur’s data. A constant applies to every beneficiary. But the other numbers may vary from beneficiary to beneficiary. The third column is a multiplier column. This is the output of our estimated relationship between risk and cost. And these multipliers are going to be applied to the values of each beneficiary.
When you multiply values and the multiplier, what you end up with in the
right-most column is each variable’s contribution to expected cost. So for example, in Arthur’s case, the community risks score 1.739 when multiplied by 8,681 is going to result in a community risk score contributing to expected cost of $15,096, and a constant in the square value of the risk score also contribute to Arthur’s expected cost. (Arthur’s expected cost can be determined then by taking all of the line, the line numbers or the numbers in the right-most column and simply adding them up. So if we didn’t know Arthur’s cost but we did know his risk score and we do know that he doesn’t have End-Stage Renal Disease, our best guess, based on our model, is that Arthur would cost $16,768.
I’m going to take that number. I’m going to transport it to the next slide
which is the final slide, 55, and tell you that we can do the same thing, of course, for Betty and Carol and David. And so now, in this upper panel, we have an observed, total standardized cost for each beneficiary, and then we have an expected cost for each beneficiary. And the final thing we have in this table on top is the physician to whom each beneficiary is attributed by a separate algorithm. And so, for the sake of this example, let’s suppose that Dr. Smith has two and only two patients – Arthur and Betty – who are

This document has been edited for spelling and grammatical errors
33
assigned to her. And likewise, Dr. Jones is assigned two patients – Carol and David.
Moving from the upper panel to the lower panel of this table – excuse me, of
this slide – the lower panel actually puts together the final risk-adjusted cost statistics. So now we’re down to the physician level. Dr. Smith’s total observed costs are simply going to be the sum of the observed costs of her individual patients, Arthur and Betty, a total of $32,525. And her total expected costs are going to be similarly computed as the sum of Arthur’s expected cost and Betty’s expected cost, or $79,325.
We then take the ratio of those two numbers to get an observed to expected
ratio of .41. And for purposes of presentation in the report, we take that observed to expected ratio and multiply it by the mean beneficiary cost for all beneficiaries in our sample – again, that’s $11,379. And so the conclusion of this entire process is that when Dr. Smith receives her report, her overall payment-standardized, risk-adjusted, per capita cost score for all of her beneficiaries assigned to her will be $4,665. Now we can do the same thing with Dr. Jones, and following the same procedure, we’ll end up with a value for Dr. Jones of somewhat over $13,000 – $13,313. And that’s the process of risk adjustment.
I’ve been going through this perhaps quickly and certainly very mechanically,
so I want to step back in closing and indicate that if you look at the total observed cost column, the bottom panel, the second column from the left on this last slide, you see that if we were to compare Drs. Smith and Jones simply on the basis of the costs of their beneficiaries, without any adjustment other than payment standardization, they would look quite similar. Again, though, as I argued in the previous slide and has been explained earlier, that’s not really an apples-to apples-comparison.
By risk adjusting, we see that Dr. Smith ends up doing much better than Dr.
Jones because even though Dr. Smith had the most expensive patient in Betty in terms of observed cost, Dr. Smith’s observed costs were well below the numbers that would have been guessed for either Arthur or Betty if we didn’t actually know their observed costs. So if Drs. Smith and Jones were graded

This document has been edited for spelling and grammatical errors
34
solely on their resource use, based on these statistics in the bottom right, right-hand corner of the table, Dr. Smith would look better than Dr. Jones.
That is a summary of how we take the risk scores that the CMS HCC provides
to us, and ultimately use those along with beneficiary data to arrive at per capita cost numbers that are risk adjusted and provided to physicians receiving QRURs. I would now like to turn the presentation back over to Nicole.
Question and Answer Session II Nicole Cooney: Thank you, Jeff. At this point in time, we’re ready to begin our final Q&A
session. Again, as a reminder, this call is being recorded and transcribed. Before asking your question, please state your name and the name of your organization. In an effort to get to as many of your questions as possible, we ask that you limit your question or comment to just one. Holley, we’re ready to start questions.
Operator: Thank you. We will now open the lines for our question and answer session.
To ask a question, press star, followed by the number one on your touchtone phone. To remove yourself from the queue, please press the pound key. Please state your name and organization prior to asking a question, and pick up your handset before asking your question to assure clarity. Please note your line will remain open during the time you are asking your question. So anything you say, or any background noise, will be heard. Your first question comes from the line of Tracey Glenn.
Gus Geraci: Hi, this is Dr. Gus Geraci from the Pennsylvania Medical Society. I’m sitting
here with Tracey. I applaud your balancing of cost and taking into account severity of the patient’s illness. But I’m not seeing how quality is taken into account, other than the – other than cost. How, how do you – you know, you say that because expected costs are lower, Dr. Smith did better than Dr. Jones. But what if Dr. Smith is deliberately under treating patients?
Michael Wroblewski: This is Michael Wroblewski. Thanks for that question. You know, the
focus of today’s presentation has been on how we’re adjusting costs. In future events, we’ll be talking about the additional quality measures and the attribution methodology, the models for the value modifier. And so that

This document has been edited for spelling and grammatical errors
35
would be something that would be the subject of, of future presentations. But we are mindful of that concern. Thank you.
Dr. Gus Geraci: Thank you. Operator: The next question comes from the line of Donna Kinney. Donna Kinney: This is Donna Kinney with Texas Medical Association. When I wrote
comments in the, in the fee schedule rule this year, I was questioning the issue, issues about the risk adjustment methodology, because as we know, there are demographic factors that heavily affect both cost and physician compli – and patient compliance. And I – the final rule responded to that by saying that the HCC methodology was being modified or had been improved or expanded or something. And yet what I heard today was that there is not any improvement in the demographic information and the risk adjuster. Are there plans to do something about that?
Michael Wroblewski: Donna, thanks for that question. I’ll answer it quickly and then I’ll turn it
over to Jeff for a further response. You know, the HCC model that Greg described results in a risk-adjusted score, as you saw on his – on the last slide. And then, as you saw during Jeff’s presentation, we then do additional adjustments for fit. And I’ll let him talk about that. And then I’ll come back and ask if there are any additional risk factors that should be taken into account, and if so, how should we go about doing them? Jeff? And then I’ll come back to that question.
Jeff Ballou: Right, well, thank you, Michael. There – you know, I guess I should say that
because we’ve been working on these reports for several years now, there’s been quite a bit of testing that has gone into what we’re doing. And at various points, you know, various risk adjusters have been considered. And there, there may be, as you’ve alluded to, not only mechanical or fit-related but also policy-related reasons for including – excluding certain adjusters.
The model that we have right now – again, the – I think what I would say is
that we do view, given the, given the data that are available to us, the inclusion of EHCC risk scores is an important part of that model, you know,

This document has been edited for spelling and grammatical errors
36
without talking about other risk adjusters at the moment, we have experimented with including different – I’ll call them higher order terms of squared and cubed versions of those scores. The squared term did improve fit. And so for that reason, that has been included. Again, I guess I should let Michael speak to, you know, additional risk adjusters that might be considered in the future. Obviously we’re, we’re always interested in continuing to improve on what we’re doing currently.
Michael Wroblewski: In some ways what we’ve done is we’ve used additional statistical
techniques to improve the model’s fit. Are there specific factors that you would suggest, and if so, what would – what data sources could we use that we could validate and that would be, be able to collect?
Donna Kinney: I’m really not sure about the – about data sources. I’m really concerned about
data sources. But we do know that poverty and educational status and multiple other cultural factors do have an effect on both cost and on outcomes in quality. And one of the things that we see heavily here in Texas is, we see a factor that’s related to a history of uninsured status, so that patients who enter Medicare eligibility by – due to death or disability, either way – enter the program with pent-up demand, and then are very high-cost because they have a lifetime deficiency in health care. And I don’t know how you adjust for that. But I do think it’s necessary to consider it.
Michael Wroblewski: OK. Thank you for that comment. Operator: Your next question comes from the line of William Rich. Nicole Cooney: Mr. Rich, are you on the line? Holley, I’m not sure – we could barely hear
you there – I’m not sure if we have the next question on the line or not. Operator: Your next question comes from the line of Debra Lansey. Debra Lansey: Yes, hi, this is Debra Lansey from the American College of Physicians. I’m
wondering about the payment standardization model. A lot of it seems to be based on the ICD-9 diagnosis codes as a place to get started. And I’m wondering what CMS has in mind for, say, the two-year window span of

This document has been edited for spelling and grammatical errors
37
claims that would span 2012 and 2013 or 2013 and 2014 when the claims are going to have a mix of ICD-9 and ICD-10 codes on them?
Michael Wroblewski: Debra, this is Michael Wroblewski. Thanks so much for that question.
We’re very, very mindful of the transition to ICD-10 and are looking at ways to make sure that the payment standardization and the risk adjustment model take account, that transition, in a way that still ensures fair and accurate comparisons among physicians. So I guess the short answer is, is that we’re very mindful of it, and more details will be forthcoming. But thank you.
Debra Lansey: OK. Operator: Your next question comes from the line of Barbara Hall. (Barbara Hall): Yes, my name is Barbara Hall. I’m with the State of Missouri Department of
Mental Health. And this whole call is way above my head, but I was told to listen in. My question is, is this – appears to be based on what certain physicians have elected to report. How does that affect the physicians that do not report that? Does that not eventually affect their payments as well?
Michael Wroblewski: This is Michael Wroblewski again. Thanks for that comment. You know,
what we were trying to accomplish in today’s call was, we had been providing resource use reports for the past several years to physicians, to select physicians, which we – and well, our plans are to be able to produce them for all physicians. So, so we’re building off of that. In terms of your question and how does that relate to say the value modifier, we are – this is one set of input that we’re getting. We haven’t made any decisions yet in terms of what we would do with physicians who have not yet reported, say participated in the Physician Quality Reporting System. We are likely to have additional outreach calls and events over the next several months before we make – to get input to proposals that we’ll make during next summer and the beginning of the rulemaking cycle for the 2013 fee schedule. But that issue about non-reporters is one that we’re very aware of, and are looking at how to address that.
Barbara Hall: OK.

This document has been edited for spelling and grammatical errors
38
Michael Wroblewski: But thank you for that comment. Barbara Hall: Thank you. Operator: Your next question comes from the line of Karen Rousch. Karen Ruschel: Hi, thank you for the call. My name’s Karen Ruschel with (Pavilion)
Services. I’d just like it if you could review how the responsible physician is determined, please.
Michael Wroblewski: For the, for the 2010 physician QRURs, we identified – we’ve provided
the QRURs to 35 groups who had participated in the group practice reporting option for quality. And so the – we identified the 35 groups. They’re self-nominated. Then we attributed patients to those using an attribution rule in which you had to have – the group had to have at least two (E&M) visits during the previous year, during 2010, and that group had the plurality of visits overall. No other group had more. Even though they may have had two, no other group had more. So that was the attribution rule that we used for the, for the group reports.
For the individual reports that we’ll be sending out in the beginning of next
year, first quarter of 2012, we have used a series of different attribution rules and – to take, to match beneficiaries with physicians based on (E&M) visits and total charges. And since those reports aren’t out yet, I’m not going to go into detail about those. But we are likely to do additional outreach on kind of this attribution question once those reports come out so people can see what we’ve done and then we can take comment on that.
And then in terms of how we would go forward with the value modifier, I may
sound like a little bit of broken record but we’re trying to get input based on what we’ve done so far to then make proposals next summer, but thank you.
Operator: Your next question comes from the line of William Rich. William Rich: Hello Michael. A quick question, you didn’t mention anything about the
appropriate n. I know in the rules it’s something about 30. But more

This document has been edited for spelling and grammatical errors
39
importantly, what is the role of the new proposed grouper that you're looking at? To have a higher r squared? And when would you adopt or use a selected new grouper if one meets your criteria?
Michael Wroblewski: Thanks for both of those questions. In terms of the n number, you know,
for the physician – the individual reports, we’re actually providing information on every physicians see or, excuse me, every patient that is seen. So as well as providing what that n is. So we’re trying to actually provide a full view of all the Medicare Fee-for-Service beneficiaries that a patient sees.
You know, as I said a couple of times now, we haven't made any decisions in
terms of minimum n for the value modifier. And then in terms of the episode-based cost, you know, what we have been focusing on were – and what we have finalized at least for the initial year, for the value-based modifier is to use total per capita cost. And so we – the risk adjustment and the payment standardization techniques that we’ve talked about today really are focusing on total per capita cost.
As you know, Medicare is – or CMS was tasked with developing an episode
grouper for – by the end of this year. We are in the process of doing that and would be announcing you know, how we’re moving forward with that again in the beginning of next year. And at that time we would then describe how risk adjustment works related to episode-based cost.
William Rich: Thank you. Michael Wroblewski: Sure. Thank you. Operator: Your next question comes from the line of Douglas Carr. Douglas Carr: Yes, I think some of my questions have been answered previously but I did
want to make a comment. This is Douglas Carr from Billings Clinic, that in the attribution that is described at – it’s All Specialty, although it’s based virility of V and M, we’ve had experience with that in the original PGP.
And we note that in the shared savings program model it uses primary care
attribution. And so for a – you know, for synergy and alignment with other

This document has been edited for spelling and grammatical errors
40
programs which seems to be taken off like the shared savings plan or programs, you use different attribution methodologies in giving feedback to group or individual doctors, it’s kind of – might be very confusing. And so I think you need to think through that as you go forward with this physician value based purchasing.
Additionally, the elephant in the room is Medicare Part D. And clearly in you
know, fully capitated situations, the real total cost per care, pro capita care is the A plus B plus D. And you know the value equation is whether you use a combination of that, whether you spend more money on the pharmacy and less on the hospital or more on whatever, I think you’ve got to put it all together otherwise you’ve got a – you're pressing in on the balloon and you don’t have – you're really not capturing all of those costs, so just some comment.
Michael Wroblewski: Thank you for both of them. Operator: Your next question comes from the line of Andrea Cornejo. Andrea Cornejo: Hi, this is Andrea from TMG Health Consulting. So I've got a really basic
question. So if you can go back into Slide One which has the title of the presentation.
It’s Payment Standardization and Risk Adjustment for the Physician’s Feedback and Value Modifier Program.
Could someone and this could really be anyone, not direct to anyone in
particular, could someone just kind of piece together conceptually how, how all the different presentations and their focuses kind of connect together?
Michael Wroblewski: Sure. This is Michael Wroblewski, what we were trying to do was, we
have two programs, one underway, one in development that look at how do we, for lack of a better word, profile physicians. And one of the inputs to profiling physicians is cost data, per capita cost.
And in order to ensure fair comparisons, we used two techniques to make sure
that we compare physicians because physicians are very interested not only in

This document has been edited for spelling and grammatical errors
41
their own performance and how they compare to their peers. And so in order to make fair comparisons of total per capita costs, we use two methodologies to adjust those costs.
One was the first presentation that you heard (Peter Hickman) who talked
about payment standardization to the Medicare payments, so we’re comparing apples to apples. And then the second, the second and third presentations really dealt with looking at the diagnoses and conditions of the underlying beneficiaries so that physicians who treat very, very healthy beneficiaries don't automatically look much better than those who treat beneficiaries with lots of conditions. So – so that’s kind of, hold strings together but thank you for that comment though.
Andrea Cornejo: Yes. Thanks. And that really puts everything else and all the details kind of
much better (inaudible). Thank you. Operator: Your next question comes from the line of Michael Kichall. Michael Kichall: Yes. Just our group was part of the Group Practice Reporting Option. And
we were very pleased with the report that we got from the CMS. The concern I have though, is that the value measurements which I think I
would hope can evolve with both quality measurement and also some better risk adjustment, my concern is with regard to specialists that don't fit the model for these four major diseases and just are going to use the payment system for the overall beneficiary cost, for example, anesthesiologists or pathologists.
And so when you're talking about trying to fit this value based modifier into a
payment system for all physicians, the attribution problems are going to be humongous. And so my, my hope is that you will continue to have this progress for groups especially groups that are going to be accountable. I think it’s going to be very difficult for individual physicians especially when getting to those specialists that are outliers with the types of patients that they see.

This document has been edited for spelling and grammatical errors
42
So again my thanks to CMS for a good feedback report for our Group Practice Reporting Option. We really appreciated it. But I think this is going to be really difficult for attribution for other individual solo physicians especially specialists.
Sheila Roman: Thank you very much, we appreciate that Tom. And we certainly are aware of
the challenges of producing value based modifier and even the QRURs at the individual level.
Additionally, we are certainly aware that certain sub-specialties and in
particular the specialties that you have alluded to, present challenges since they are dependent on physician referrals for their patients they see rather than patients themselves initiating visits.
We – well be working very closely and have worked closely with the medical
societies as we move forward. And as we’ve alluded to, we have really taken a different approach to attribution in the individual reports and once those are made available, we’ll be holding other outreach to you to see and receive – to see your response and receive input from you on how we’ve been attributing at the individual level. So we do understand those challenges and appreciate your comment. Thank you.
Operator: Your next question comes from the line of Marida Jao. Marida Jao: Yes, hi, good afternoon. My name is Marida Jao with Medical Consulting.
My question is addressed to Greg Pope on couple slides, 33 and 34. First one on 33, could you kindly define the difference between the
community continuing enrollee and institutional continuing enrollee? And then on slide 34, you mentioned demographic factors that Medicaid dual eligibility status.
What about we have an Indiana population of patients that are under a state
sponsored plan but are being paid Medicare fee rates, are they being considered in the – the statistics that are being collected? And then is this way

This document has been edited for spelling and grammatical errors
43
of modeling one to be in the future, far future? I don't know how far, going to be applied to Medicaid as well?
Michael Wroblewski: I can answer at least a third of those three questions and then I’ll turn it
over to Greg for the first two in terms of the difference between community versus institutional and the collection of data at the state level.
In terms of application to Medicaid, what this program is really looking at is
Medicare Fee-For-Service. So that’s what this is all have been focused on. It has not been focused on Medicaid at this – up to this point. And the step does not direct us to do so. So then I’ll turn it over to Greg for the answers to the first two questions.
Greg Pope: Sure. The community versus institutional, the differentiation there is the
institutional model was applied to beneficiaries who are long term residents in nursing facilities which is just defined as three months or more. So it includes like you know, a short term episode in the scaled nursing facility but a long term three months or plus in an institution nursing facility. And essentially everyone else would be in a community model.
As to your second question, I don't know the answer to that off hand so I think
we need more detail. And possibly I don't know if you could provide more detail to CMS. I believe there’s an email address or something. We can probably get you an answer to that question. I don't know for sure without more – more information on that one.
Nicole Cooney: Hi. Sure, Greg. This is Nicole. The email address where you can send
additional detail is qrur, q as in quality, r as in resource, u as in use, r as report, [email protected].
(Marida Jao): OK. Thank you. Operator: Your next question comes from the line of Sarah Tonn. Sarah Tonn: Hello again the staff at the American Academy and Neurology. We really
appreciate the time and support to regional specialties and societies in helping to understand this complex but very good work. But I think that when you

This document has been edited for spelling and grammatical errors
44
messaged to the physicians this – it needs to be very succinct about what this is and then how to use it.
And so I’m just going to give a little example here and you know, I’m
ignorant about how this is calculated. But if I were to get this or physicians were to get this and I were to read this, first of all I’d say, “Well, what is this?” And so I’d want to know the – you know, the clear definite that this model is based on XXX but also what the limitations of the model was and what it excludes.
And then I would also want definitions of like what HCC new enrollee is and
what community risk score involves. So that’s just one comment. The second part of the how, so the first part is what is this, how to – and
what it is not. And the second is how should I use this. So if I was Doctor Smith, slide 55 I think, I would look at this and I’d say, “Gosh, I was expected to cost $80,000 but my observed was $32,000”.
So first of all, I’d want to know my patient breakdown. So then I’d go up to
the table involved and see that (inaudible) Betty. And then I’d see that Betty is going to cost me a lot more and so my intervention plan might be x. You know, what should, how should I, how can I interpret this? And then make a difference so that it costs less?
So my interpretation as what I’m seeing here is Doctor Smith is, “Oh, I’m
doing fine. I – actually with adjustment I’m at averaging $4,000 but Doctor Jones on the other side has increased to $13,000.” So when I analyze it as if I were Doctor Jones, I would look at this and say, “Gosh, you know, last year, cuz you're taking previous year experience observed – no excuse me, the expected is previous year right?
So what’s happened with Doctor Jones is the observed year at present, which
I’m not quite sure about timeframe but then my total expected based on last year’s. So last year’s was less. And I should have tried to perform at 1.0 versus nine. 70 percent over expected (inaudible), so what could have

This document has been edited for spelling and grammatical errors
45
happened is Doctor Jones could have intervened. With a certain, you know, to make the expected cost excuse me, lower last year.
So do you see what I mean? I think it’s going to be the interpretation what this
is and then how to use, how to interpret this and then act on it. So I think it’s very confusing when the feedback reports came out of the PQRS reporting.
And so this, what we want to do is get people act on this report. And so what
are we telling them to do or how do you use this stuff and so if you get something in aggregate physicians are likely to go back and say, “OK, who’s costing me the most and then you put – you actually put more heavy intervention on to that.
Bring in more med level groups so then you're costing more next time and less
until you get punished. So I think it really needs to be analyzed how these are going to be used, expected to be used or actually are used. Thank you.
Michael Wroblewski: Thank you for that comment. You know, you’ve summed it up with some
nice action things and we’ll follow-up with you. Thank you. Nicole Cooney: Holley, we’ll take one more question. Operator: At this time there are no further questions. Nicole Cooney: OK. At this time I’d like to turn the call back over to Michael Wroblewski for
the closing. Michael Wroblewski: I just wanted to thank everyone for joining – I wanted to thank everyone
for joining us this afternoon. As I mentioned a couple times, we will be providing details about, about future events.
Whether they’re call or in-person events in the coming weeks related to the
value modifier proposals, as well as to the physician feedback reports. And if you have any additional questions, that you weren’t able to ask today, or you thought of since the call has ended, please use the – the email address that Nicole gave earlier which is [email protected] and we will be sure to answer those questions.

This document has been edited for spelling and grammatical errors
46
And I want to say thank you to everyone. Happy holidays. Nicole Cooney: And I just wanted to add, we definitely do want to thank everyone for
participating in today’s call. An audio recording and written transcript will be posted to the physician’s feedback program page on the CMS website which is http://www.cms.hhs.gov/physiciansfeedbackprogram all one word.
It’s also listed on the final slide in our presentation. And the materials will be
under the CMS teleconferences and events tab listed under today’s date. I’d like to thank our speakers today, Michael Wroblewski, Dr. Sheila Roman, Peter Hickman, Greg Pope and Jeff Ballou for their participation. Have a great day everyone.
Operator: Thank you for your participation you may now disconnect.
END