Embed Size (px)
Citation preview

CENTER FOR RESPONSE TO INTERVENTION
IN EARLY CHILDHOOD
Presentation prepared for RTI Early Childhood SummitKansas City, MOOctober 12, 2010
Tier 1 Instruction in Early Education
Classrooms:
Implications for Response to Intervention
Tier 1 Instruction in Early Education
Classrooms:
Implications for Response to Intervention

Our Key Partners
University of KansasCharles Greenwood & Judith Carta
Dynamic Measurement Group; Eugene, OR
Ruth KaminskiUniversity of Minnesota
Scott McConnellOhio State University
Howard GoldsteinDivision for Early Childhood-CEC

What does Tier 1 Instruction look like in preschool classrooms?
What does Tier 1 (universal) look like in a broad sampling of preschool programs?Who are the children?
What are their entering characteristics?How are 4 year olds performing on early literacy/language measures in Fall before kindergarten?
What is the quality of their early literacy/language experience in preschool classrooms?How much do they grow in early literacy/language in the school year before kindergarten?How is that growth influenced by their instructional experiences?
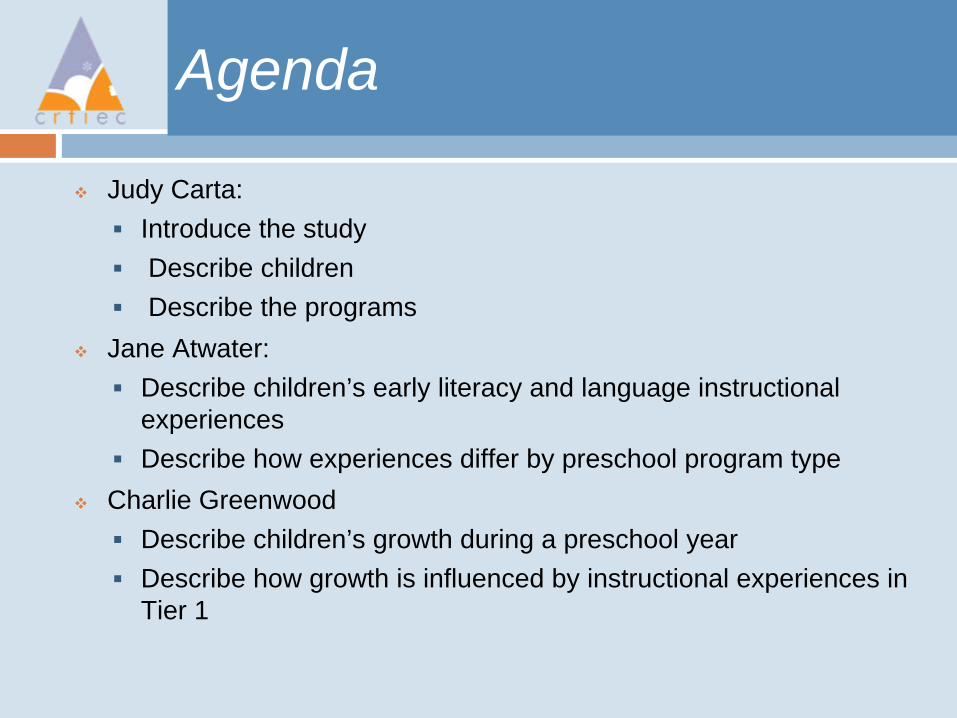
Agenda
Judy Carta: Introduce the studyDescribe childrenDescribe the programs
Jane Atwater: Describe children’s early literacy and language instructional experiencesDescribe how experiences differ by preschool program type
Charlie GreenwoodDescribe children’s growth during a preschool yearDescribe how growth is influenced by instructional experiences in Tier 1
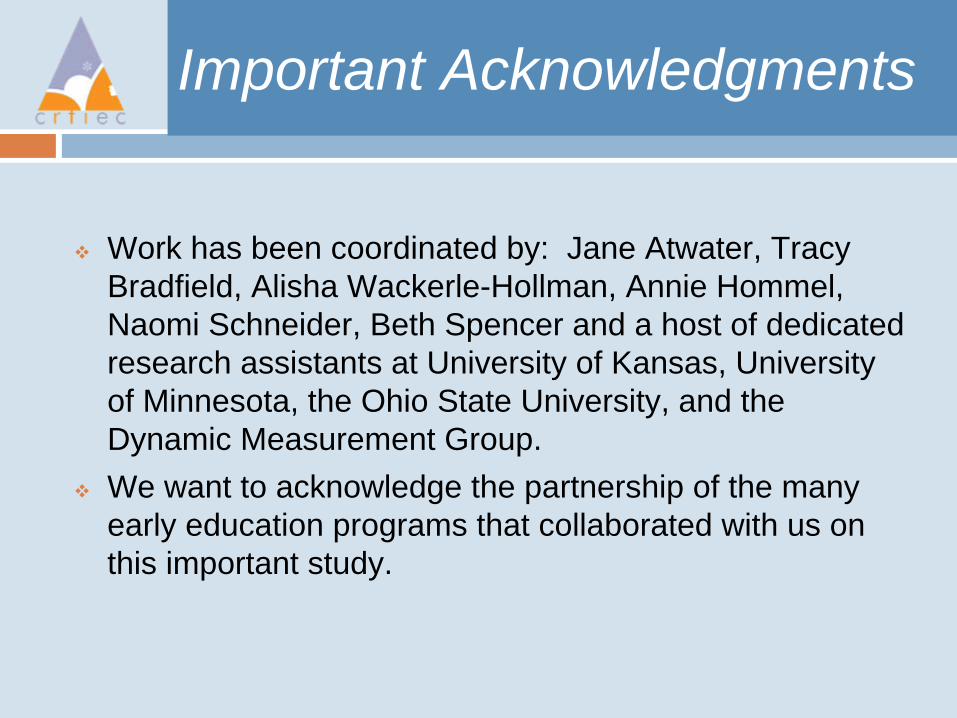
Important Acknowledgments
Work has been coordinated by: Jane Atwater, Tracy Bradfield, Alisha Wackerle-Hollman, Annie Hommel, Naomi Schneider, Beth Spencer and a host of dedicated research assistants at University of Kansas, University of Minnesota, the Ohio State University, and the Dynamic Measurement Group.We want to acknowledge the partnership of the many early education programs that collaborated with us on this important study.

Underlying Assumptions of RtI
RTI will reduce the need for special education by through early identification of children needing additional support to succeed. A critical assumption is that instruction at the universal level is of high quality based on an evidence-based core curriculum implemented with high fidelity. RTI services will be individualized and based on evidence-based strategies.

RtI services assume a high quality of general instruction or core curriculum.
We assume most children will demonstrate adequate growth in response to core curriculumResources and services will be added as needed to increase instructional opportunities.We assume more intensive tiers of instruction will be needed by smaller proportions of students.

Overarching Question 1
What proportion of children can we expect in each of the tiers in a three-tier RtI model;
what proportion of children will fail to meet cut points on screening measures in early literacy and language development, and thus be identified for Tier 2 or Tier 3 level of early literacy and language intervention?

Overarching Question 2
Will the proportions of children at risk will be influenced by students’ characteristics at program entry as well as instructional quality and quantity?
the quality of curriculum (evidence base for its skill content and instructional delivery); instructional interactions (i.e., teachers’ use of evidence-based teaching procedures);

Design
Descriptive study of 68 classrooms in 4 regions of U.S Standardized early literacy and language measures collected on all consented children at the beginning and end of the school yearObservation data collected on classrooms and 6 randomly selected children in each classroomAt least 3 waves of IGDIs collected on all children across the school year

Measurement
Child LevelGet Ready to Read early literacy screen in the FallIGDIs (Picture Naming; Sound Identification) 3 repeated measures of Oral Language and Alphabet KnowledgeFall and Spring standardized early language and literacy measures (TOPEL, PPVT, CELF) on all consented childrenClassroom Code for Interactive Recording of Children’s Language Environment (CIRCLE) on 6 randomly selected children
Classroom LevelClassroom Assessment Scoring System (CLASS)Preschool Curriculum Checklist (PCC)

Measurement Timeline
AUG SEPOCT NOV DEC JAN FEBMAR APR MAY JUN JUL
Get Ready to Read
TOPEL TOPEL
PCC
PPVT
IGDI-PN & SI
IGDI-PN & SI
IGDI-PN & SI
PPVT
CELF CELF
CIRCLE
CLASS

Child Participants
840 children embedded in 68 classroomsEthnicity
35.2% African-American30.7% Caucasian20.2% Hispanic/Latino10.2% Multi-ethnic3.7% Other
IEP status: 11.1% had IEPLanguage status: 15.8% most comfortable with language other thanEnglishParent education: 21.7% did not have HS diploma or GEDAge at beginning of school year: mean = 4.5 years (range = 3.7 –5.6)

Classroom Inclusionary Criteria
These were classrooms where RTI might occur.They were implementing an early literacy curriculum that had a specific scope and sequence.Majority of early literacy instruction was in English.The included at least 10 students who would be age-eligible for kindergarten in the fall of 2010 and communicate primarily in either English or Spanish.The majority of children did not have identified disabilities but could include children with disabilitiesThey operated at least 12 hours/week.
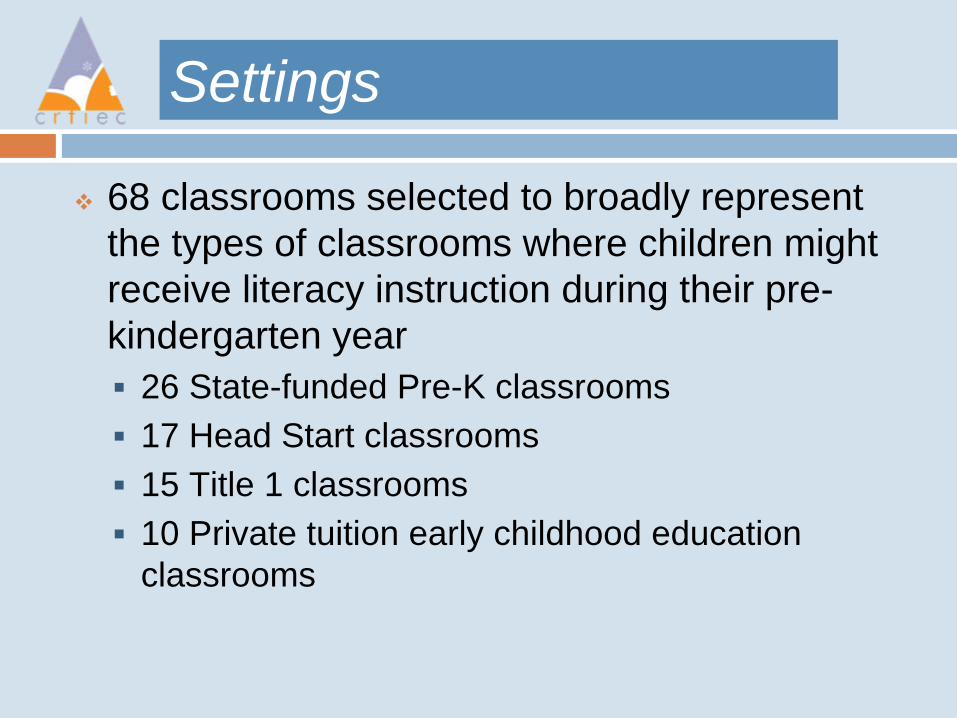
Settings
68 classrooms selected to broadly represent the types of classrooms where children might receive literacy instruction during their pre-kindergarten year
26 State-funded Pre-K classrooms17 Head Start classrooms15 Title 1 classrooms10 Private tuition early childhood education classrooms

Number of Classrooms Across Sites
KS OH OR MN
Full-Day 12 1 14
Half-Day 22 16 3
State-
Funded Pre-K
18 1 7
Head Start 17
Title 1 4 11
Private Tuition
10

Demographics Across Program Types
Pre-K%
Head Start%
Title 1%
Private Tuition %
IEP 15 14 6 5
Parent has not completed HS diploma or GED
23 31 18 0
Child most comfortable with language other than English
28 16 4 0
Ethnicity:
African American 29 3 72 0
Caucasian 24 49 14 90
Hispanic/Latino 32 27 6 0
Multi-ethnic 10 19 6 5
Other 6 2 2 5
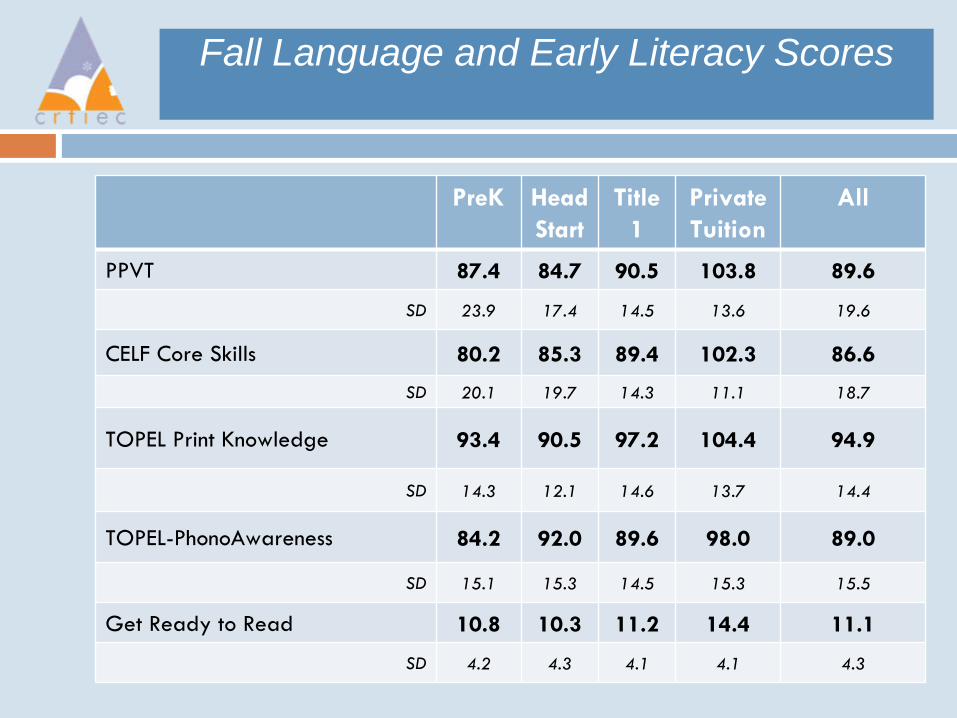
Fall Language and Early Literacy Scores
PreK Head Start
Title
1Private Tuition
All
PPVT 87.4 84.7 90.5 103.8 89.6
SD 23.9 17.4 14.5 13.6 19.6
CELF Core Skills 80.2 85.3 89.4 102.3 86.6
SD 20.1 19.7 14.3 11.1 18.7
TOPEL Print Knowledge 93.4 90.5 97.2 104.4 94.9
SD 14.3 12.1 14.6 13.7 14.4
TOPEL-PhonoAwareness 84.2 92.0 89.6 98.0 89.0
SD 15.1 15.3 14.5 15.3 15.5
Get Ready to Read 10.8 10.3 11.2 14.4 11.1
SD 4.2 4.3 4.1 4.1 4.3
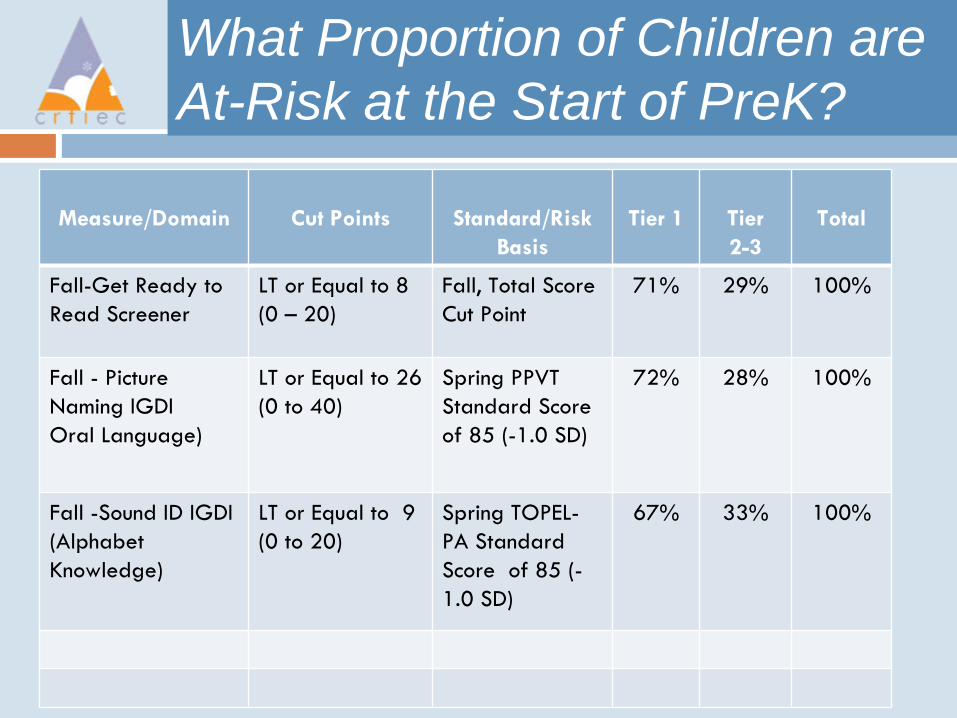
What Proportion of Children are At-Risk at the Start of PreK?
Measure/Domain Cut Points Standard/Risk Basis
Tier 1 Tier 2-3
Total
Fall-Get Ready to Read Screener
LT or Equal to 8 (0 –
20)Fall, Total Score Cut Point
71% 29% 100%
Fall -
Picture Naming IGDI Oral Language)
LT or Equal to 26 (0 to 40)
Spring PPVT Standard Score of 85 (-1.0 SD)
72% 28% 100%
Fall -Sound ID IGDI (Alphabet Knowledge)
LT or Equal to 9 (0 to 20)
Spring TOPEL-
PA Standard Score of 85 (-
1.0 SD)
67% 33% 100%

Fall Language and Literacy Outcomes Associated with Tiers Based on Fall
Picture Naming IGDI
Measure Tier 1 Mean Tier 2/3 Mean
PPVT Receptive Language 97 70*
CELF Core Language Skills 95 72*
TOPEL Print Knowledge 98 88
TOPEL Phonological Awareness 93 79*
Norm = 100 -1SD = 85*
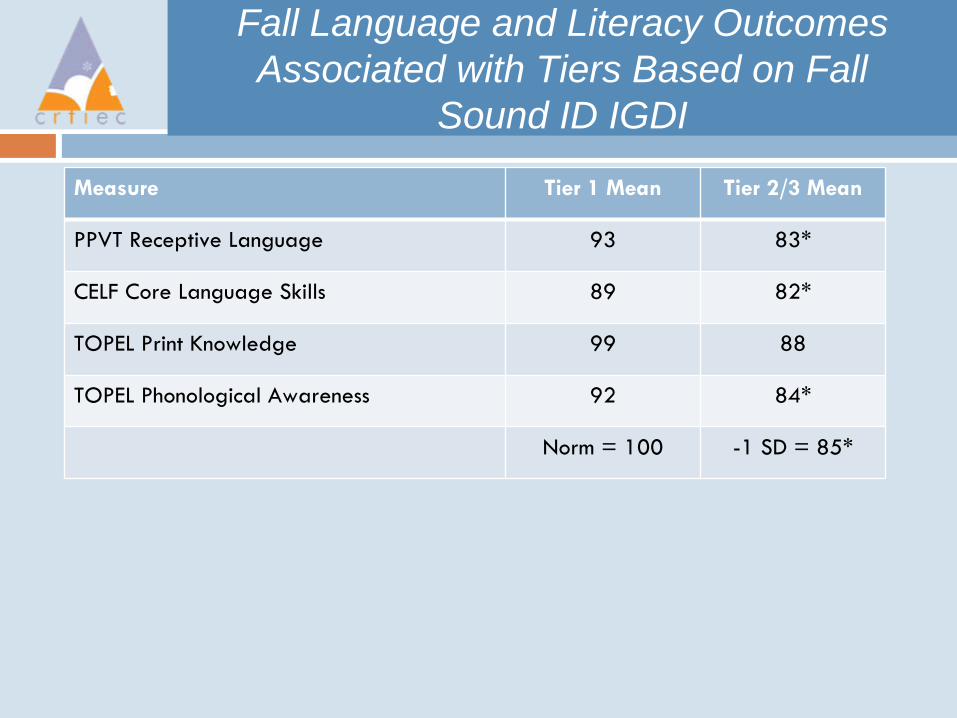
Fall Language and Literacy Outcomes Associated with Tiers Based on Fall
Sound ID IGDI
Measure Tier 1 Mean Tier 2/3 Mean
PPVT Receptive Language 93 83*
CELF Core Language Skills 89 82*
TOPEL Print Knowledge 99 88
TOPEL Phonological Awareness 92 84*
Norm = 100 -1 SD = 85*

Are Proportions At-Risk Related to Program Types? (Based on Fall Picture Naming IGDI)

Are Proportions At-Risk Related to Program Types? (Based on Fall Sound ID IGDI)

What are the Characteristics of Children in These Tiers?
Tiers Based on Fall Picture Naming IGDI
Tier 1 Tier 2/3
% with IEP 12 9
% with low parent education (parent has not completed a HS diploma or GED) 15 41
% most comfortable with a language other than English 6 39
% with limited literacy opportunities at home (no one has read to child at home during the past week) 4 9

Summary
Not surprisingly, using the various measures used to identify children who may need more instructional support, we found higher proportions of children in pre-k than we would typically see in K-5 grades.Children with more family risk factors are more likely to be identified for Tier 2/3.Children with IEPs as likely to be identified for Tier 1 as tier 2/3.Differences in proportion of children identified for Tier 2/3 by program type is likely a reflection of their entering characteristics.
Coming Up……
Jane will describe the instruction children were likely to experience during their pre-kindergarten year.Charlie will describe their growth in early literacy and language and how this was influenced by their instructional experience.

CHILDREN’S EXPERIENCES IN TIER 1
INSTRUCTION

Research Questions
What is Tier 1 instruction like in preschool programs across our local communities?
In their interactions with children, how often do teachers employ strategies for promoting language and early literacy?
How often are children actively engaged in activities related to early literacy?
What experiences are associated with a higher level of child engagement?

Measures of Tier 1 Instruction
Preschool Curriculum Checklist (PCC) (Kaminski & Carta, 2010)
Document review of curricular support for language and literacy
CLASS Pre-K (Pianta, La Paro & Hamre, 2008)
Ratings of support for learning in the classroom as a whole
Classroom CIRCLE (Atwater, Lee, Montagna, Reynolds & Tapia, 2009)
Time-sampled recording of individual children’s behaviors and experiences in the classroom

Preschool Curriculum Checklist
Evaluates curricula on 10 curriculum design features that support the development of early literacy skills: phonological awareness, alphabet knowledge, vocabulary and oral language, and listening comprehension
Based on a detailed review of curriculum materials by trained staff who met reliability standards
Scores represent the percentage of criteria met by each curriculum, with a possible range from 0 to 100

Curricula Used for Teaching Early Literacy
Number of Classrooms
AEPS: Assessment, Evaluation and Programming System 6
Brookes: Ladders to Literacy + Handwriting Without Tears 17
Creative Curriculum 2
Creative Discoveries + SEEDS of Early Literacy Supplement 10
Harcourt Brace: StoryTown 12
Houghton Mifflin 2
Jolly Phonics 2
Lucy Calkins Writers’
and Readers’
Workshop 1
Scholastic: Building Language and Literacy 11
SRA: Open Court 4

PCC Scores Across Classrooms
MeanStd
DeviationMinimum Maximum
Phonological Awareness
63.0 17.9 25 83
Alphabet Knowledge 62.5 18.6 0 83
Vocabulary and Oral Language
63.9 18.3 0 83
Listening Comprehension
60.2 22.0 0 83

Classroom Assessment Scoring System: CLASS Pre-K
Provides ratings (1-7) of support for learning in the classroom
Emotional SupportClassroom OrganizationInstructional Support
Based on 80 minutes of observation in each of 67 classrooms

Components of Instructional Support
Concept DevelopmentAnalysis and reasoning, creating, integration, connections to the real world
Quality of FeedbackScaffolding, feedback loops, prompting thought processes, providing information, encouragement and affirmation
Language modeling Frequent conversation, open-ended questions, repetition and extension, self- and parallel talk, advanced language

CLASS Ratings Across Classrooms

Classroom CIRCLE
Computerized observation system for recording the classroom experiences and behaviors of individual focus children
6 focus children randomly selected in each classroom (n=353)
30-minutes of observation for each focus child – sampled broadly across the typical program day, including any time designated for literacy learning by the teacher

Classroom CIRCLE
Classroom Context
Teacher BehaviorVerbal ResponseRecipient of Verbal Response (focus child or child’s group)Focus on Early LiteracyInvolvement
Child BehaviorCommunication and Social BehaviorSocial PartnerEngagement in Classroom Activities

Classroom Characteristics Across Programs
Pre-K%
Head Start%
Title 1%
Private Tuition %
Includes dual language learners 84 88 80 44
Language of instruction includes some non-English 4 6 0 0
Includes children with IEP 53 93 40 33
Uses strategies to identify children who need additional support for language and literacy
68 82 69 56
Uses small groups or embedded instruction to provide additional support
100 35 100 43

Key Measures Related to Language Support
The amount of teacher talk to the focus child
Teacher verbal input that may support language development
Asking questions, expanding and extending child language, and engaging in positive conversation
Child verbal communication

How often was a teacher talking to the focus child?

What types of teacher verbal response did children receive?
Verbal Response Composites
Pre-K%
Head Start%
Title 1%
Private Tuition
%
Prompting and expanding child language 7.0 4.2 5.4 3.6
Positive feedback and conversation 18.4 18.8 18.8 13.9
Reading, reciting, and singing 6.9 4.9 8.1 4.6
Directives and negative feedback 4.5 3.9 4.6 6.2
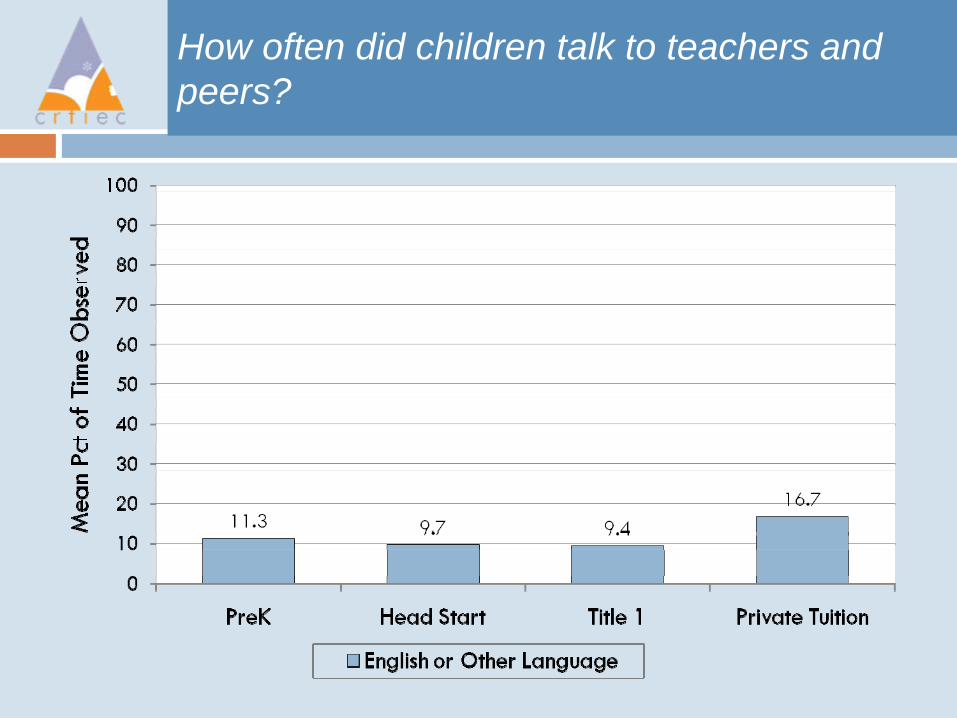
How often did children talk to teachers and peers?

Child verbal communication given teachers’ prior verbal response (n=55)

Key Measures Related to Early Literacy Support
Literacy Focus of InstructionTeacher focuses on phonological awareness, alphabetic/print concepts, vocabulary, comprehension, or reading
Child Academic EngagementEarly writing, early reading, manipulation, verbal response, or attention related to an academic topic Academic topics: early literacy, numeracy, science, and social studies

How often did teachers focus on literacy with the children observed?

What aspects of early literacy did teachers focus on most often?
Pre-K%
Head Start%
Title 1%
Private Tuition %
Phonological awareness 1.6 0.2 1.7 0.2
Alphabet knowledge 4.2 1.1 3.3 2.9
Comprehension 11.5 1.8 7.1 4.6
Vocabulary 1.7 0.1 0.3 0.3
Reading 2.8 2.9 3.3 3.8

What was the level of children’s engagement?

What were the components of academic engagement?
Pre-K%
Head Start%
Title 1%
Private Tuition %
Writing 1.2 0.5 1.6 1.2
Reading 0.8 0.6 0.8 0.1
Manipulating materials 5.0 9.2 3.7 3.1
Responding verbally 2.5 0.2 1.5 0.6
Attending 17.7 6.7 17.8 9.2

Children’s Academic Engagement Given Teachers’ Prior Focus on Literacy (n=289)

What we have learned so far
Community-based classrooms in our sample differed considerably in children served, in curricula, and in support for learning.
We found consistently lower ratings for instructional support, the CLASS measure most closely related to support for early literacy.
From the perspective of individual children, teacher support for language and literacy varied considerably within and across program types.

What we have learned so far
Teacher talk to the individual child was associated with an increased likelihood of child communication in most classrooms.
Teacher focus on literacy skills was associated with a sizeable increase in children’s academic engagement
But, these teacher behaviors were relatively infrequent in occurrence, highlighting potentially fruitful targets for intervention:
Talk to the individual child – occurred 4% of the time, or approximately 7 minutes during a 3-hour classroom period
Literacy focus – 16% of the time, or less than 30 minutes during a 3-hour period

What more do we need to learn?
How Tier 1 classroom experiences may vary for different groups of children (i.e., dual language learners, children with IEPs, and children who may need Tier 2 and Tier 3 intervention)
Instructional features and classroom experiences that are predictive of children’s progress and eventual readiness for kindergarten
How factors, such as dual language status, may moderate the relationships among classroom experiences, engagement, and outcomes
Implications for the development and implementation of Tier 2 and 3 interventions

WHAT WERE THE FALL TO SPRING FINDINGS?
Charles R. Greenwood
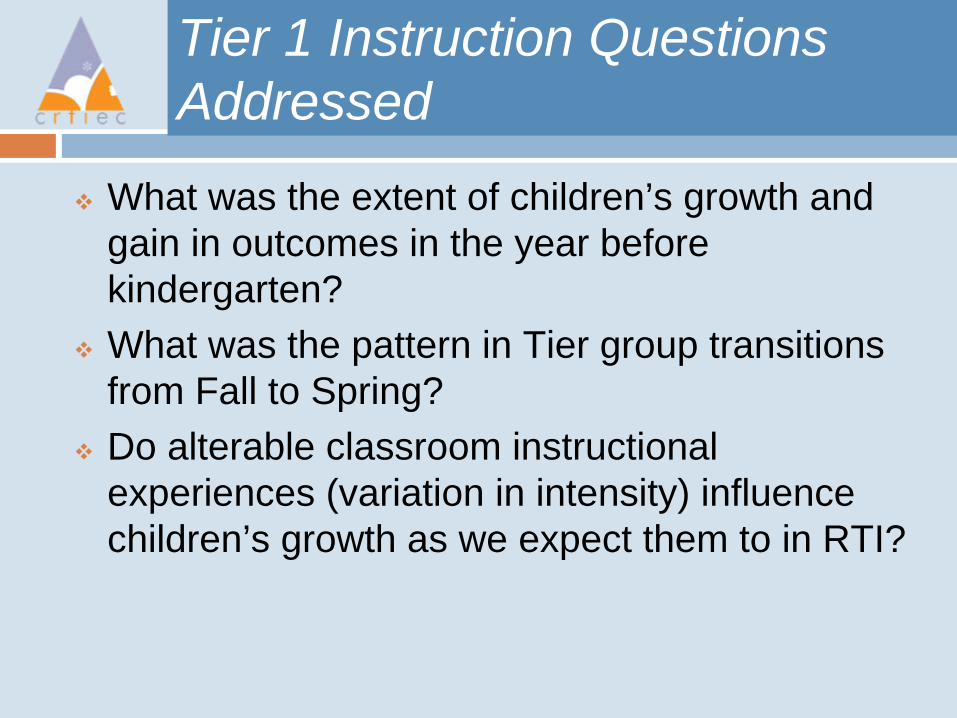
Tier 1 Instruction Questions Addressed
What was the extent of children’s growth and gain in outcomes in the year before kindergarten?What was the pattern in Tier group transitions from Fall to Spring?Do alterable classroom instructional experiences (variation in intensity) influence children’s growth as we expect them to in RTI?
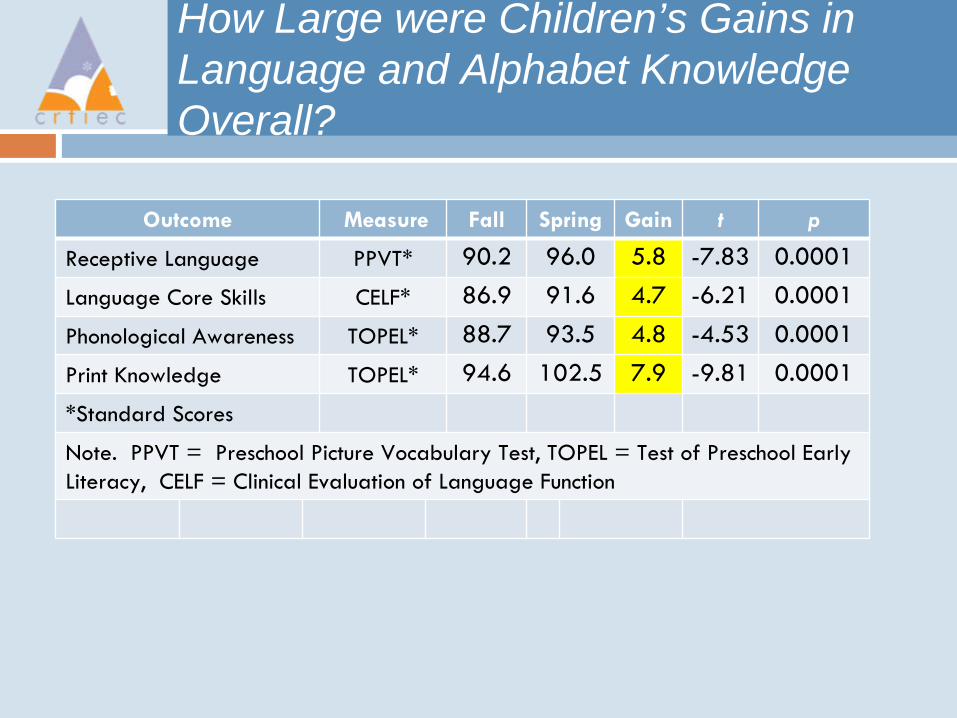
How Large were Children’s Gains in Language and Alphabet Knowledge Overall?
Outcome Measure Fall Spring Gain t p
Receptive Language PPVT* 90.2 96.0 5.8 -7.83 0.0001
Language Core Skills CELF* 86.9 91.6 4.7 -6.21 0.0001
Phonological Awareness TOPEL* 88.7 93.5 4.8 -4.53 0.0001
Print Knowledge TOPEL* 94.6 102.5 7.9 -9.81 0.0001
*Standard Scores
Note. PPVT = Preschool Picture Vocabulary Test, TOPEL = Test of Preschool Early Literacy, CELF = Clinical Evaluation of Language Function

Growth in Language Standard Scores by Program Type

Children’s Growth in Alphabet Knowledge by Program Type

Children’s Growth in the Picture Naming and Sound ID IGDIs

Oral Language Outcomes by Tier

Alphabet Knowledge by Tier

IGDIs by Tier

Sum Up!
What was the extent of children’s growth and gain in outcomes in the year before kindergarten?
Overall, children made gains in standard scores doing better on average, closing the gap on the normative groups. Children in different program types start at different levels in the Fall and make comparatively different gains by SpringChildren qualifying for Tier 23 start significantly lower (normatively) than Tier 1 children, make progress by Spring but do not close the gap with the Tier 1 group with the exception of Print Knowledge

Tier 1 Instruction Questions Addressed
What was the pattern in Tier group transitions in one preschool year?

Change in Tier Proportions Fall to Spring Based on Picture Naming
Fall Spring

Change in Tier Proportions Fall to Spring on Picture Naming
Of 602 Children in T1 @ Fall, 92% stayed in T1, and 9% moved down to Tier 23Of 236 Children in T2 @ Fall, 55% improved, moving to T1, while 45% remained in Tier 23

Trends in Picture Naming by Fall to Spring Outcome Groups

Fall to Spring Growth in PPVT by Picture Naming IGDI Outcome Groups

Fall to Spring Growth in CELF Core Language Sills by Picture Naming IGDI Outcome Groups

Is the Path to Improved Child Outcomes Through Children’s Alterable Instructional Experience and Short-term IGDI Growth?
FallLang-Lit Status
Children’sClassroom
Instructional Experiences
IGDI Growth
SpringLang-Lit OutcomeHome Lang-
Lit Environ
SocioDemo
Picture Naming
SoundID
TOPEL-
PATOPEL-
PK
CELF-
Core L
PPVT-
RL
CIRCLE Language
Focus
CIRCLELiteracy Focus

Change in Tier Proportions Fall to Spring Based on Sound ID
Fall Spring

Change in Tier Proportions Fall to Spring on Sound ID
Of 562 Children in T1 @ Fall, 97% stayed in T1, and 13% moved down to Tier 23Of 276 Children in T2 @ Fall, 65% improved, moving to T1, while 35% remained in Tier 23

Sum Up!
What was the pattern in Tier group transitions in one preschool year?
Relevance: A goal of RTI is to reduce the numbers of children not responding to intervention. The size of T23 groups in any program is a baseline for marking future program progress in its reductionDepending on the IGDI (PN vs Sound ID)1. Some Tier 1 qualified children in Fall qualified for Tier23
by Spring (9%, 13% respectively by IGDI)2. Some Tier 23 qualified children in Fall, remained in Tier
23 by Spring (35%, 45% respectively by IGDI)

Tier 1 Instruction Questions Addressed
Do alterable classroom instructional experiences in Tier 1 appear to influence children’s growth as we expect?
For example, does the Amount of Literacy Focus impact IGDI growth and Spring outcomes?
We are exploring the answer to this and related questions relevant to RTI currently.We offer some preliminary findings and explanation

Is the Path to Improved Child Outcomes Through Children’s Alterable Instructional Experience?
FallLang-Lit Status
Children’sClassroom
Instructional Experiences
SpringLang-Lit Outcome
TOPEL-
PATOPEL-
PK
CELF-
Core L
PPVT-
RL
CIRCLELiteracy Focus

Does the Amount of Literacy Focus Influence Outcome After Accounting for Initial Status?

Is the Amount of Literacy Focus Influencing Short-term IGDI Growth and Spring Outcome?
Children’sClassroom
Instructional Experiences
IGDI Growth
CIRCLELiteracy Focus
IGDI Spring
Outcome

Does Teacher Literacy Focus Influence Sound ID Growth and Spring IGDI Outcome?

Is the Path from Literacy Focus to Spring Outcomes Direct or Through IGDI Progress?

Sum Up and Discussion
The intensity of classroom instruction in terms of classroom time focused on language and early literacy and student engagement in academic responding is an issue in RTIPreliminary findings are suggesting that amount of literacy focus is one alterable factor at the classroom and student levels of analysis in students’ IGDI growth and year-end outcomesWe are examining others in our measurement model with implications for RTI