Embed Size (px)
Citation preview
Portland State University Portland State University
PDXScholar PDXScholar
Center for Real Estate Quarterly Center for Real Estate
8-1-2010
Center for Real Estate Quarterly, Volume 4, Number 3 Center for Real Estate Quarterly, Volume 4, Number 3
Portland State University. Center for Real Estate
Follow this and additional works at: https://pdxscholar.library.pdx.edu/realestate_pub
Part of the Real Estate Commons
Let us know how access to this document benefits you.
Citation Details Citation Details Portland State University. Center for Real Estate, "Center for Real Estate Quarterly, Volume 4, Number 3" (2010). Center for Real Estate Quarterly. 14. https://pdxscholar.library.pdx.edu/realestate_pub/14
This Newsletter is brought to you for free and open access. It has been accepted for inclusion in Center for Real Estate Quarterly by an authorized administrator of PDXScholar. Please contact us if we can make this document more accessible: [email protected].

CENTER FOR REAL ESTATEQuarterly Journal
Volume 4, Number 3 Summer 2010
A publication of Portland State UniversityAvailable for download at: http://www.pdx.edu/realestate/research quarterly.html

CONTENTS
1 Summary and Editorial 1
2 Housing and the Economy: A New Paradigm? 3Randall J. Pozdena
3 Interest Rates: What Goes Up Must Come Down 11John M. Petersen
4 PERS in Crisis: The Sequel 17Phil Keisling
5 Developers Use Creative Strategies to Keep the Lights On 23Julie Serote
6 Portland’s Unreinforced Masonry Apartment Buildings: A Threatened Species? 31Walter W. McMonies
7 Office Market Analysis 45Greg LeBlanc
iii
iv CONTENTS
8 Retail Market Analysis 53Kyle Smith
9 Portland Industrial Market Analysis 59Kyle Smith
10 Multifamily Market Analysis 63Greg LeBlanc
11 Residential Market Analysis 69Kyle Smith
1
SUMMARY AND EDITORIAL
While the recession has been declared officially over for more than a year, many parts ofthe economy are waiting for recovery. Real estate is one of those parts. Much of the realestate market is relatively flat. Even so, some market participants are beginning to seeimprovement. For example, this journal’s residential market analysis finds that an in-crease in sales activity has been partially offset by a slight decline in median prices. At thesame time, our multifamily market analysis reports that owners and managers are see-ing improved conditions to the point that some have scaled back the use of concessions andintroduced modest rent increases. This issue of the Real Estate Quarterly focuses largely onthe causes and consequences of what has been called the “Great Recession.”
Real estate markets, and housing in particular, have taken much of the blame for thecurrent recession. Many hope that fiscal and monetary policies can correct what they seeas failures in the market. Randall Pozdena takes a different approach. He argues thatmonetary and other government policy interventions set the housing market up for a fall.In addition, the “bail out mania” that has dominated federal policies in the wake of therecession has gotten in the way of the forces of supply and demand and may have the effectof dragging out the recession rather than stimulating the economy.
The recession’s impact on credit markets has produced a paradox. We are now in an eraof rock bottom interest rates and high levels of liquidity. At the same time, we are in anera of constrained credit in which borrowers can neither take advantage of the low ratesnor obtain loans to pursue their projects. For borrowers that can overcome the cash costsand other challenges of refinancing, however, John Petersen sees some sparks of activity.
Center for Real Estate Quarterly Journal, vol. 4, no. 3. Summer 2010Copyright c© 2010 Portland State University
1
2 SUMMARY AND EDITORIAL
Julie Serote reports that the disappearance of financing and equity from the real estatemarket means that developers are no longer following business models from years past.She finds that developers who continue to survive utilize their entrepreneurial and creativeskills to form new business models in order to keep the lights on.
On the fiscal side of the economy, Oregon again faces challenges from its public employeeretirement system, known as PERS. From reporter at Willamette Week to Oregon’s secretaryof state, Phil Keisling has spanned the state. In this issue, he writes on the future of thestate’s public employee pension system. He finds that a combination of factors—especiallythe recent recession which has impaired PERS’ investment returns—mean public employ-ers will face steep increases in payroll costs over the next decade. These increases will likelyexacerbate future state and local budget problems as employee costs rapidly rise. In turn,state and local governments will be pressured to increase revenues through higher taxes,fees, and charges.
Turning away from the economy, Walter McMonies examines an overlooked and under-reported issue affecting many Oregon buildings. Portland is home to numerous unreinforcedmasonry apartment buildings, many of which has historic or architectural importance. Atthe same time, Western Oregon and Washington have been identified as being subject tomassive if infrequent “subduction zone” earthquakes. Mr. McMonies reports that the own-ers of unreinforced masonry apartment buildings can expect to face pressure from casualtyinsurers, mortgage lenders, and the local government to seismically reinforce their build-ings. He explains that in many cases such efforts do not “pencil out” in that the costs of thereinforcement likely exceed the expected incremental cash flows from the effort. He arguesthat building owners, architectural preservationists, structural engineers, mortgage lendersand insurers, and city and state officials need to work collaboratively to reduce impedimentsto and increase incentives for seismically upgrading affected apartment buildings.
Despite the recession, something new is happening almost every day in Oregon’s real es-tate markets. To chronicle that news, I have created a feed of news stories involving Oregonreal estate. It covers almost every paper in the state, including Portland Business Journaland the Daily Journal of Commerce. I have done my best to filter the results to get only rel-evant real estate related news stories. Even so, there may be some “junk” stories that willpop up. This is a work in progress that will require some tweaking. For most web browsersyou can simply paste this link into your address bar: http://bit.ly/PSURealEstate.
This is my first issue editing the Real Estate Quarterly. I welcome any constructivecomments and ideas for future issues. If you would like to submit an article, please feel freeto contact me. All the best.
Eric Fruits, Ph.D.Editor, Center for Real Estate Quarterly [email protected]: 503-928-6635
2
HOUSING AND THE ECONOMY: A NEWPARADIGM?
Randall J. Pozdena
QuantEcon, Inc.
Many see activities in the housing and mortgage markets as causes of thecurrent economic malaise and monetary and fiscal policies as a reaction. Thisarticle challenges this notion and argues that the current recession, like mostprior recessions in history, did not arise because of endogenous problems in thehousing sector but rather because of policy interventions that set the housingmarket up for a fall. The article discusses what this perspective says about thelikely path of recovery and the efficacy and necessity of the administration’sinterventions to spur recovery.
The connection between housing and the economy has always been intimate. For decades,in fact, the housing sector was the channel through which monetary policy influenced thepace of the economy. Today, many attribute the current economic malaise to problems thatoriginated in housing and mortgage markets. Monetary and fiscal policy changes are seenas the consequence, rather than the cause, of the depressed housing market.
This article challenges the notion that this represents a new paradigm in the relationshipbetween economic policy and the housing sector. Rather, I argue that the current recession,like most prior recessions in history, did not arise because of endogenous problems in thehousing sector but rather because of policy interventions that set the housing market up fora fall. Along the way, we discuss what this perspective says about the likely path of recoveryand the efficacy and necessity of Obama administration interventions to spur recovery.
Center for Real Estate Quarterly Journal, vol. 4, no. 3. Summer 2010Copyright c© 2010 Portland State University
3
4 HOUSING AND THE ECONOMY: A NEW PARADIGM?
THE OLD DAYS
In most of the post World War II decades, monetary policy exploited anomalies in bankingand mortgage policy to regulate the real economy. If the central bank wanted to slow anoverheated economy, it did so by elevating interest rates and, thereby, the cost of mortgagecredit. Higher mortgage rates would slow the rate of new home sales and with it, the levelof construction activity, appliance sales, and furniture sales. The resulting, sharp reductionin aggregate demand for these products would propagate throughout the economy and slowthe pace of income and output growth.
The connection between Federal Reserve policy, housing and the economy was amplifiedin most of the 20th century by the nature of financial products that banks and savings andloan associations could offer. First, banks were restricted from paying interest on bankdeposits. As a consequence, when market interest rates increased, a process known as dis-intermediation occurred. Depositors would withdraw their funds from non-interest payingdepository institutions and buy interest bearing instruments from brokerage firms and gov-ernment borrowers. With fewer deposits on hand, lending contracted sharply.
Because our banking system, like most modern banking systems, is a fractional reservesystem, withdrawal of small amounts of deposits would cause much larger, system-widereductions in lending as the loss in reserves (vault cash and deposits at the Federal Re-serve bank) necessitated reduction in lending by an amount that was a multiple of thedeposits withdrawn. This disintermediation channel persisted until innovations in meth-ods of providing checkable access to non-bank balances and, ultimately, the abandonmentof Regulation D, reduced the virulence of disintermediation.
The other phenomenon that helped create a channel for monetary policy to influencehousing was the nature of mortgage instrumentation and regulation. Specifically, mosthome mortgages were standard, self-amortizing fixed rate loans. Cycles in interest ratestranslated directly into changes in mortgage payments on new loans. Adjustable-rate mort-gages and mortgages with whose contract rate and amortization features could vary withthe interest rate cycle were uncommon. Whereas today mortgage instruments allow pay-ments to grow over time with the households’ ability to pay, the standard fixed rate mort-gage made access to mortgage credit more difficult during high interest rate parts of thebusiness cycle. Other innovations, such as longer mortgage terms, mortgage insurance,and inclusion of spousal income in loan qualification standards, increased the resilience ofmortgage credit flows to interest rate shocks.
By the 1980s, weakened disintermediation processes and more flexible mortgage instru-mentation limited considerably the impact of monetary policy on housing and mortgagemarkets. Coupled with a new Federal Reserve operating strategy introduced under thechairmanship of Paul Volcker, the stage was set for economic growth to be much less volatilethan in earlier decades. This is precisely what happened. By the end of the 1990s, journalssuch as Foreign Affairs went so far as to herald the end of the business cycle (Weber, 1997).
GOVERNMENT CAN’T KEEP ITS HANDS OFF HOUSING
The 1980s and 1990s were a period of prosperity, as the high inflation and interest ratesof the Carter years were replaced by a steady downtrend in both indicators. Coupled withreductions in marginal tax rates initiated in the Reagan years, the 1980s were particularly

DEMOCRATIZATION BITES THE HANDS THAT FED IT 5
prosperous, and prior budget deficits gave way to modest surpluses in the Federal budget.The stage was set for an extended period of prosperity, and growth and stability in thehousing sector.
Unfortunately, politicians do not get rewarded for husbanding the status quo. Prosperityallows politicians to believe that they now have the latitude to “do good” by interveningin the way the economy is distributing the resulting economic largesse to its citizens. Inparticular, the notion of credit “democratization” became a hallmark of Clinton administra-tion banking policy. An old mythology dating from the Carter years was resurrected, andvarious policies were put in place to address the alleged tendency for mortgage and otherlenders to discriminate against protected classes of individuals or certain communities intheir application approval processes.
As a result, a series of initiatives were undertaken in the mid-1990s to aid the “democ-ratization” and anti-discrimination initiative and to provide additional tax incentives tohome buyers. This included plans to send “testers” (individuals posing as borrowers) intothe offices of lenders to see how they were treated, passage of reforms of the CommunityReinvestment Act (CRA) to hold banks to the same ratios of loan rejection across races andcommunities, applying pressure to the secondary mortgage market makers (e.g., FannieMae and Freddie Mac) to adopt looser standards in their definitions of conforming mort-gages, and the passage of the 1997 Tax Act, that allowed capital gains tax exemption onhomes held for as few as two years.
For its part, the investment banking community provided securitization services to helpget pools of substandard loans into the hands of investors, thereby channeling funds thatfueled the democratization process. Indeed, in 1997, the ill-fated Bear Stearns investmentbank was underwriter on the first security backed by Community Reinvestment Act loans.The success of this sale was heralded by the Comptroller of the Currency and other regu-lators, as were the aggressive efforts by Countrywide Bank and others to market loans tosub-par quality credits.
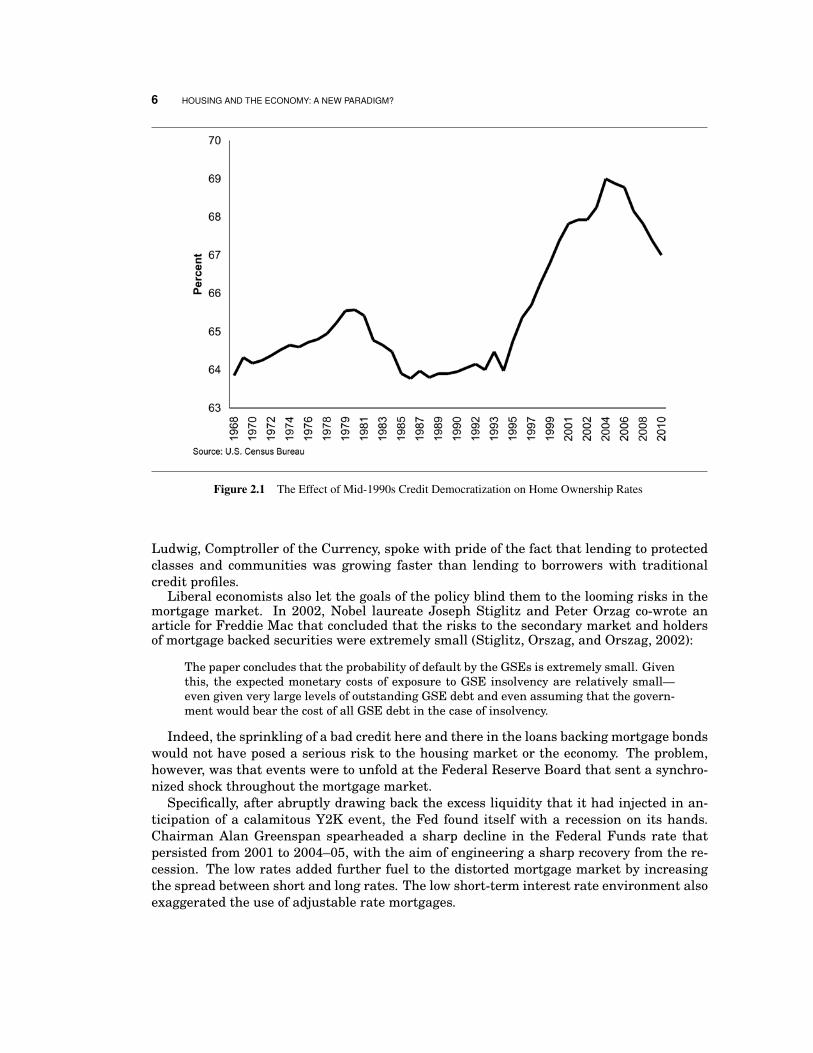
The cheerleading of junk lending by regulators, the Clinton administration, and com-munity groups was combined with laxer standards and higher leverage permitted at thegovernment-sponsored enterprises (GSEs) such as Fannie Mae and Freddie Mac. TheseGSEs are important secondary mortgage market makers via provision of credit enhance-ment. In the name of democratization of credit, they tilted credit flows sharply towardhome ownership in general, and homeownership by poor credits in particular. These poli-cies began in earnest in the mid-1990s, and their distortionary effect on home ownershiprates can be easily seen in the figure below. Homeownership jumped nearly five percent,drawing in many households lacking the job stability and credit-worthiness to take on theburden of home ownership.
DEMOCRATIZATION BITES THE HANDS THAT FED IT
Non-market credit allocation is never a good idea, but it is a particularly bad idea whenthe distortions are glossed over by the eagerness of social engineers to “do good.” Although1990s housing policy was creating a ticking time bomb of poor credit, few people sounded thealarm. Although there was no mistaking the trend toward junk mortgage lending, attentionwas not focused on the accumulating risks, but rather the seemingly good things that werehappening as a result of the policies. In 1997, in a speech in New York, for example, Eugene
6 HOUSING AND THE ECONOMY: A NEW PARADIGM?
Figure 2.1 The Effect of Mid-1990s Credit Democratization on Home Ownership Rates
Ludwig, Comptroller of the Currency, spoke with pride of the fact that lending to protectedclasses and communities was growing faster than lending to borrowers with traditionalcredit profiles.
Liberal economists also let the goals of the policy blind them to the looming risks in themortgage market. In 2002, Nobel laureate Joseph Stiglitz and Peter Orzag co-wrote anarticle for Freddie Mac that concluded that the risks to the secondary market and holdersof mortgage backed securities were extremely small (Stiglitz, Orszag, and Orszag, 2002):
The paper concludes that the probability of default by the GSEs is extremely small. Giventhis, the expected monetary costs of exposure to GSE insolvency are relatively small—even given very large levels of outstanding GSE debt and even assuming that the govern-ment would bear the cost of all GSE debt in the case of insolvency.
Indeed, the sprinkling of a bad credit here and there in the loans backing mortgage bondswould not have posed a serious risk to the housing market or the economy. The problem,however, was that events were to unfold at the Federal Reserve Board that sent a synchro-nized shock throughout the mortgage market.
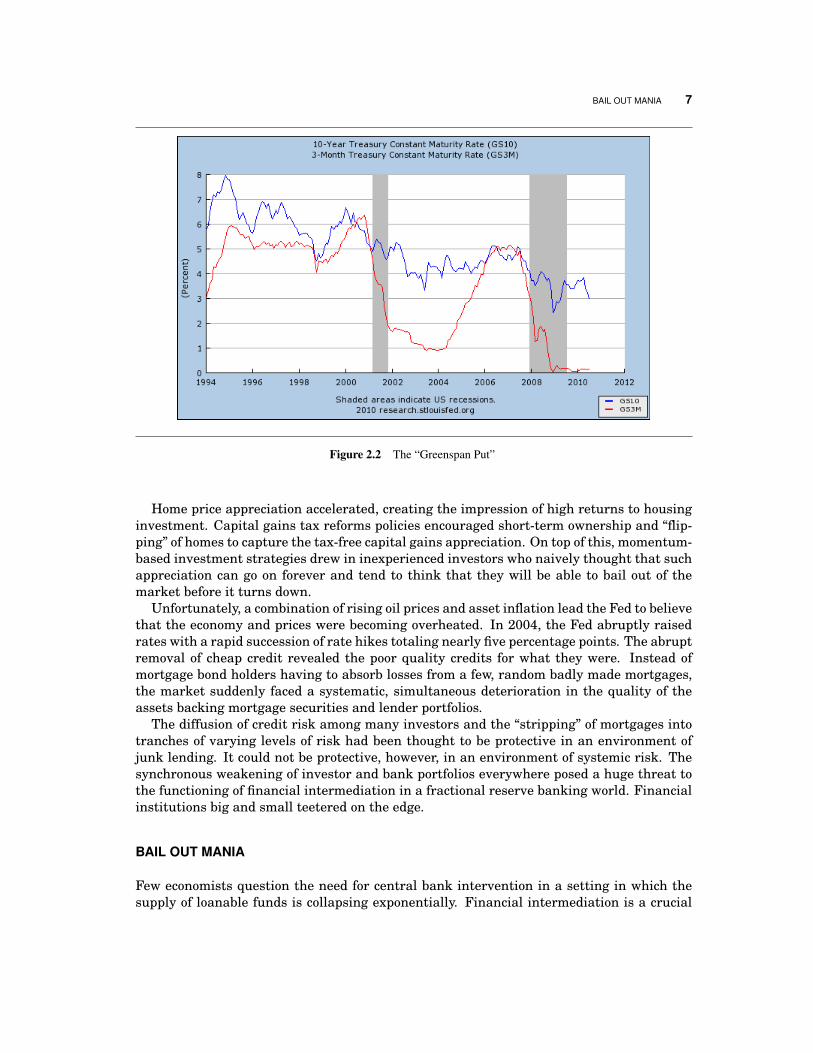
Specifically, after abruptly drawing back the excess liquidity that it had injected in an-ticipation of a calamitous Y2K event, the Fed found itself with a recession on its hands.Chairman Alan Greenspan spearheaded a sharp decline in the Federal Funds rate thatpersisted from 2001 to 2004–05, with the aim of engineering a sharp recovery from the re-cession. The low rates added further fuel to the distorted mortgage market by increasingthe spread between short and long rates. The low short-term interest rate environment alsoexaggerated the use of adjustable rate mortgages.
BAIL OUT MANIA 7
Figure 2.2 The “Greenspan Put”
Home price appreciation accelerated, creating the impression of high returns to housinginvestment. Capital gains tax reforms policies encouraged short-term ownership and “flip-ping” of homes to capture the tax-free capital gains appreciation. On top of this, momentum-based investment strategies drew in inexperienced investors who naively thought that suchappreciation can go on forever and tend to think that they will be able to bail out of themarket before it turns down.
Unfortunately, a combination of rising oil prices and asset inflation lead the Fed to believethat the economy and prices were becoming overheated. In 2004, the Fed abruptly raisedrates with a rapid succession of rate hikes totaling nearly five percentage points. The abruptremoval of cheap credit revealed the poor quality credits for what they were. Instead ofmortgage bond holders having to absorb losses from a few, random badly made mortgages,the market suddenly faced a systematic, simultaneous deterioration in the quality of theassets backing mortgage securities and lender portfolios.
The diffusion of credit risk among many investors and the “stripping” of mortgages intotranches of varying levels of risk had been thought to be protective in an environment ofjunk lending. It could not be protective, however, in an environment of systemic risk. Thesynchronous weakening of investor and bank portfolios everywhere posed a huge threat tothe functioning of financial intermediation in a fractional reserve banking world. Financialinstitutions big and small teetered on the edge.
BAIL OUT MANIA
Few economists question the need for central bank intervention in a setting in which thesupply of loanable funds is collapsing exponentially. Financial intermediation is a crucial
8 HOUSING AND THE ECONOMY: A NEW PARADIGM?
lubricant of economic activity. Hence, the steps taken by the Fed and the Treasury in thewaning months of the Bush administration likely were needed to quell a much more rapiddecline in financial activity.
Unfortunately, the new Obama administration chose to take steps that had little prospectof bootstrapping the economy, and most likely aggravated the recession. Specifically, theObama administration resurrected long-discredited classical Keynesian policies under theguise of “fiscal stimulus.” Under this notion, the taking of private resources and spendingthem in the public sector somehow is supposed to stimulate the economy. In fact, of course,public spending can increase only by either taking current resources from the private sector(through immediate taxation) or by saddling the private sector with debt (i.e., a burden oftaxes to be collected later).
In addition to a giant $870 million fiscal stimulus program, the Obama administrationengineered programs specifically targeting the housing sector. Unwilling to let marketforces deal with the imbalance in housing supply and ability to pay, the administrationcrafted dozens of programs to try to keep these inevitable forces from working to restorebalance between housing supply and demand.
There are several key features of the policy initiatives. First, there were efforts to en-courage banks to renegotiate mortgage terms for those borrowers who, in all probability,should never have been given a mortgage in the first place. Most of these efforts simplyprolonged the inevitable, since these borrowers were self-selectively financially naive, lack-ing in sufficient income or over extended speculators. Hence, the net macroeconomic effectof this program was to delay the adjustment of housing supply and demand to correct theimbalances caused by the earlier, imprudent efforts to democratize credit.
A second key feature was the extension of the Mortgage Forgiveness Debt Relief Act,first passed by Congress at the end of the Bush Administration, but extended through 2012under the Obama administration. This act removed an important disincentive to a homeowner walking away from a mortgage loan. Specifically, under long-standing IRS regula-tions, if a homeowner walks way from a mortgage, the value of the mortgage left unpaidis considered income to the homeowner and subject to federal income taxes. This policyprovides a strong disincentive to letting a home go into foreclosure even if the home’s valuehas fallen below its loan obligation. By removing the tax burden associated with walkingaway from a mortgage loan, this policy has the perverse effect of accelerating, rather thancontaining, the pace of foreclosures.
A third policy tried to address the weakened demand for housing by subsidizing (throughtax credits) the purchase of homes by first-time homebuyers. Like the “Cash for Clunkers”program in the automobile market, this program’s only effect is to create a temporarystrengthening in prices, followed by a likely equal or larger weakening when the programis over. Hence, it is yet another program with no prospects of positive effect, but at the costof further enlarging the deficit.
A fourth policy is so-called financial reform. Policy makers have refused to accept thatgovernment intervention in mortgage markets was the precipitating cause of the currenthosing market and macroeconomic malaise. Instead, the financial agents that accommo-dated to these distortions have become the target for blame, and the justification for fur-ther government involvement in the marketplace. Instead of focusing on restoration of anormally functioning banking market, policy makers have chosen to focus on creating adiversion from their culpability by lambasting industry participants.
THE FUTURE FOR HOUSING AND THE ECONOMY 9
THE FUTURE FOR HOUSING AND THE ECONOMY
In my view, the Keynesian stimulus policy pursued by the Obama administration has donelittle to restore or preserve economic growth and employment. It has distorted Fed policyby adding long-term debt management challenges to the Fed’s already-full plate. It has alsoincreased the temptation to bring down deficits through repeal of the Bush-era tax rate cutsand increases in Social Security and Medicare payroll tax rates.
The Obama administration’s “Cash for Clunkers” and first-time homebuyer tax creditshave only further served to aggravate the deficit, with little or no net effect on the tar-get markets except to shift purchases in time. Its persistence with, and extension of, theMortgage Forgiveness Debt Relief Act has very likely amplified the number of homeownerswalking away from their mortgage debt. Such an effect would further depress, rather thanstimulate, home prices and cause further foreclosures and slow the re-entry of investmentin housing.
As Stanford economist John Taylor testified before Congress, cycles in the economy aremuch more strongly related to investment activity than government spending (Taylor, 2010).Ironically, Obama’s own Chair of his Council of Economic Advisors, Christina Romer, con-cluded in a recent paper published with her economist husband that, indeed, tax cuts, ratherthan fiscal stimulus with tax increases, is most likely to stimulate economic growth (Romerand Romer, 2010). Thus, the depression of investment caused by the threat of higher taxrates on high-income households and the Administration’s perverse approach to the home-price and foreclosure problem continue to threaten recovery.
As two decades of missteps by Japanese policy makers has illustrated, the pursuit ofKeynesian policies, enlargement of deficits, and tax rate increases—if continued—will onlylengthen economic malaise. The first series of Japanese fiscal stimulus programs (begun in1991) totaled 21 percent of annual GDP. By way of comparison, ours was 5.5 percent. Addin Japan’s subsequent 5.1 percent package in 1998, and it makes one wonder why thereremains in the U.S. a call from some for further fiscal stimulus. All such behavior got Japanwas a 180 percent debt-to-GDP ratio.
In sum, investment in general, and housing investment in particular, remain importantchannels of economic growth. Under current policies, unfortunately, we seem bent on delay-ing the reinvigoration of these channels. �
Randall J. Pozdena is president of QuantEcon, Inc., an Oregon-based economics, financeand planning consultancy. He is the author of the textbook, The Modern Economics ofHousing. The views expressed herein are the author’s alone.
REFERENCES
ROMER, C. D., AND D. H. ROMER (2010): “The Macroeconomic Effects of Tax Changes: EstimatesBased on a New Measure of Fiscal Shocks,” American Economic Review, 100(3), 763–801.
STIGLITZ, J. E., J. M. ORSZAG, AND P. R. ORSZAG (2002): “Implications of the New Fannie Maeand Freddie Mac Risk-based Capital Standard,” Fannie Mae Papers, 1(2), 1–10.
TAYLOR, J. B. (2010): “Perspectives on the U.S. Economy: Fiscal Policy Issues,” Testimony beforethe Committee on the Budget, U.S. House of Representatives, July 1.

10 HOUSING AND THE ECONOMY: A NEW PARADIGM?
WEBER, S. (1997): “The End of the Business Cycle?,” Foreign Affairs, 76(4), 65–82.
3
INTEREST RATES: WHAT GOES UP MUST COMEDOWN
John M. Petersen
Melvin Mark Capital Group, LLC
What an interesting time to be asked to write something about interest rates! Our practiceemphasis is commercial real estate capital markets (also known as finance and investment).I will use this opportunity to discuss rates in that context. I will also attempt prediction as tofuture rates. However, with comfort, it would be difficult to do worse than recent consensus.
“Interest rates” mean different things to different market participants. In addition themarket is faced with many different interest rates: LIBOR, SWAPs, prime, SFR mortgages,Treasuries, Fed funds, bond rates, and so on.
My comments will focus on those facets of the interest rate universe that impacts com-mercial real estate the most: the 10-year Treasury in particular, but also cap rates, the yieldcurve, LIBOR, and risk spreads. The U.S. Treasury bond rate is the standard for risk free,fixed income investing. Treasuries are viewed by many as a barometer of market sentiment,anticipating both central banker behavior and global economic trends; the forecast is wor-risome. Treasuries span durations ranging from from 3 months to 30 years. At the startof the year there was strong consensus of rising rates on Treasuries over the second halfof 2010. When the investment world becomes unpleasant or uncertain, as has happenedseveral times this year, investors move toward what they expect to be safer investments.This “flight to quality” drives bond yields lower and bond prices higher. We have now hada series of runs taking the yield on the 10-year Treasury from more than 4 percent to lessthan 3 percent This is in contrast to earlier forecasts that predicted increasing yields. The
Center for Real Estate Quarterly Journal, vol. 4, no. 3. Summer 2010Copyright c© 2010 Portland State University
11
12 INTEREST RATES: WHAT GOES UP MUST COME DOWN
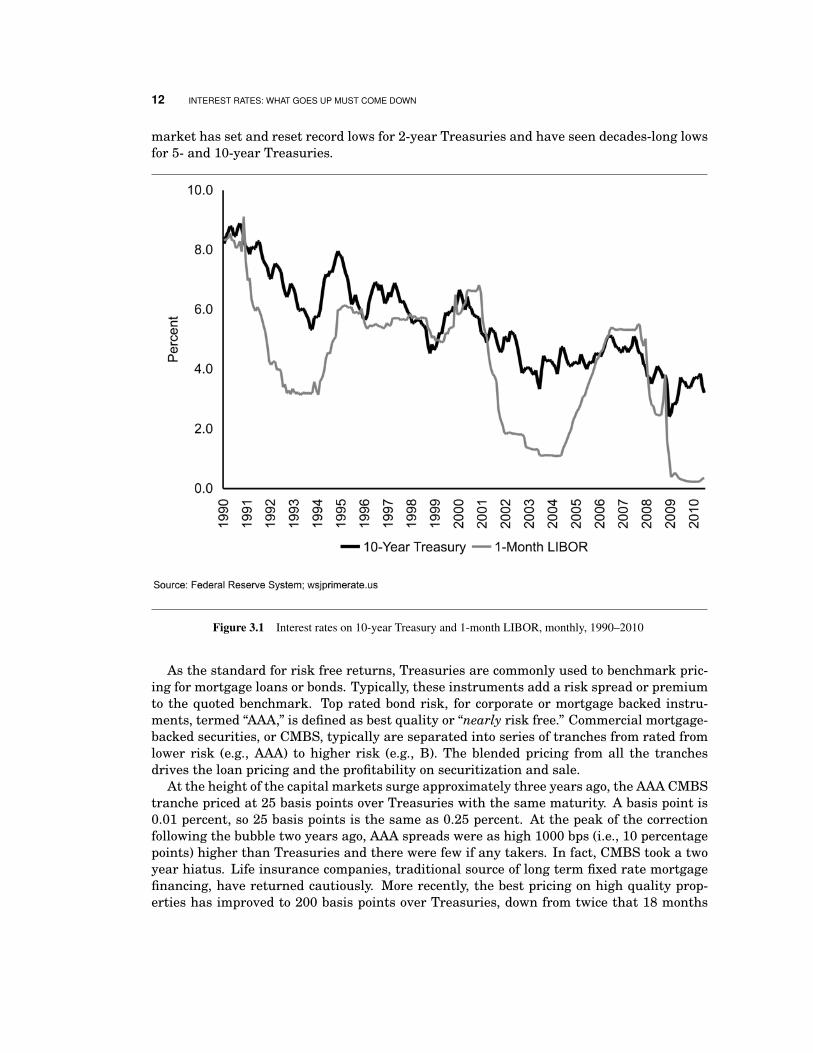
market has set and reset record lows for 2-year Treasuries and have seen decades-long lowsfor 5- and 10-year Treasuries.
Figure 3.1 Interest rates on 10-year Treasury and 1-month LIBOR, monthly, 1990–2010
As the standard for risk free returns, Treasuries are commonly used to benchmark pric-ing for mortgage loans or bonds. Typically, these instruments add a risk spread or premiumto the quoted benchmark. Top rated bond risk, for corporate or mortgage backed instru-ments, termed “AAA,” is defined as best quality or “nearly risk free.” Commercial mortgage-backed securities, or CMBS, typically are separated into series of tranches from rated fromlower risk (e.g., AAA) to higher risk (e.g., B). The blended pricing from all the tranchesdrives the loan pricing and the profitability on securitization and sale.
At the height of the capital markets surge approximately three years ago, the AAA CMBStranche priced at 25 basis points over Treasuries with the same maturity. A basis point is0.01 percent, so 25 basis points is the same as 0.25 percent. At the peak of the correctionfollowing the bubble two years ago, AAA spreads were as high 1000 bps (i.e., 10 percentagepoints) higher than Treasuries and there were few if any takers. In fact, CMBS took a twoyear hiatus. Life insurance companies, traditional source of long term fixed rate mortgagefinancing, have returned cautiously. More recently, the best pricing on high quality prop-erties has improved to 200 basis points over Treasuries, down from twice that 18 months
13
ago Even so, these more favorable rates are seen only on “least risky” assets with leveragelevels of 55–60 percent.
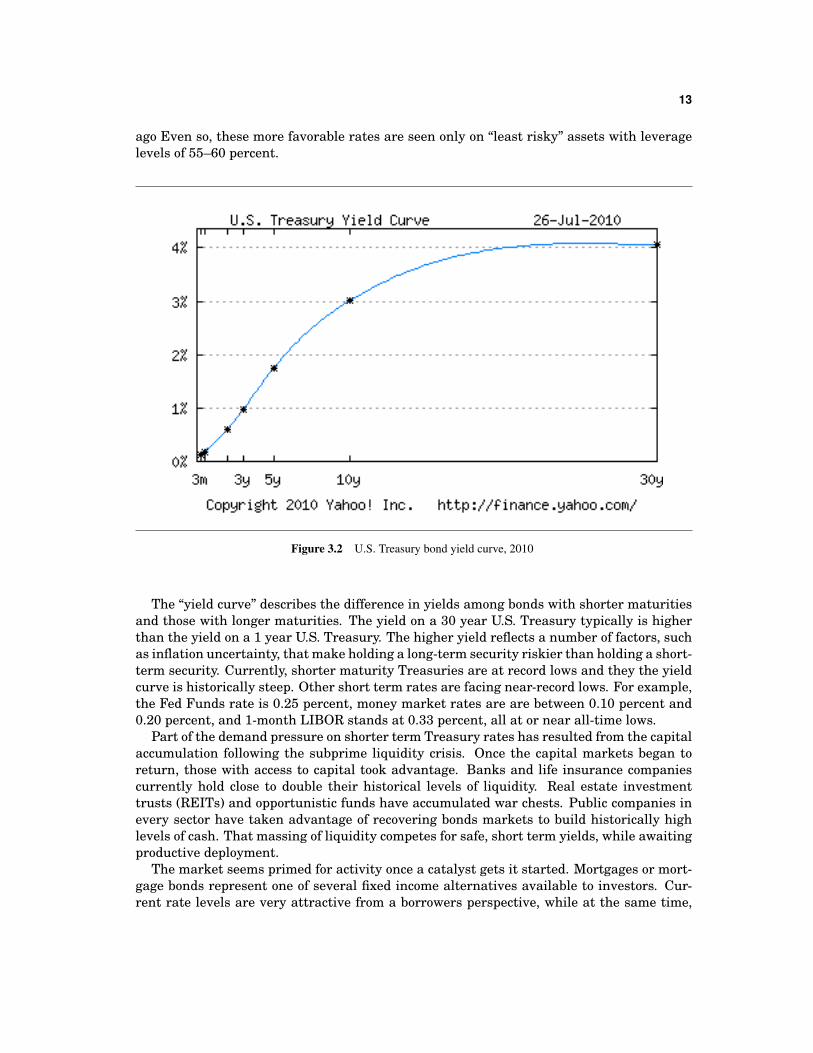
Figure 3.2 U.S. Treasury bond yield curve, 2010
The “yield curve” describes the difference in yields among bonds with shorter maturitiesand those with longer maturities. The yield on a 30 year U.S. Treasury typically is higherthan the yield on a 1 year U.S. Treasury. The higher yield reflects a number of factors, suchas inflation uncertainty, that make holding a long-term security riskier than holding a short-term security. Currently, shorter maturity Treasuries are at record lows and they the yieldcurve is historically steep. Other short term rates are facing near-record lows. For example,the Fed Funds rate is 0.25 percent, money market rates are are between 0.10 percent and0.20 percent, and 1-month LIBOR stands at 0.33 percent, all at or near all-time lows.
Part of the demand pressure on shorter term Treasury rates has resulted from the capitalaccumulation following the subprime liquidity crisis. Once the capital markets began toreturn, those with access to capital took advantage. Banks and life insurance companiescurrently hold close to double their historical levels of liquidity. Real estate investmenttrusts (REITs) and opportunistic funds have accumulated war chests. Public companies inevery sector have taken advantage of recovering bonds markets to build historically highlevels of cash. That massing of liquidity competes for safe, short term yields, while awaitingproductive deployment.
The market seems primed for activity once a catalyst gets it started. Mortgages or mort-gage bonds represent one of several fixed income alternatives available to investors. Cur-rent rate levels are very attractive from a borrowers perspective, while at the same time,
14 INTEREST RATES: WHAT GOES UP MUST COME DOWN
lenders find mortgage spreads relatively attractive both historically and compared to alter-native fixed income investments.
Many commercial loans, however, include payment protection. Prepayment protectionis typically provided in the form of prohibition, yield maintenance or defeasance. Yieldmaintenance calculates a “make whole” prepayment penalty while defeasance provides forpreservation of scheduled payments from replacement bond collateral. The steep yield curvemakes either very expensive from a borrowers perspective: borrowers must give up substan-tial cash up-front to obtain the savings from lower interest rates. As a result, early refinancehas become very challenging, frustrating borrowers and lenders alike.
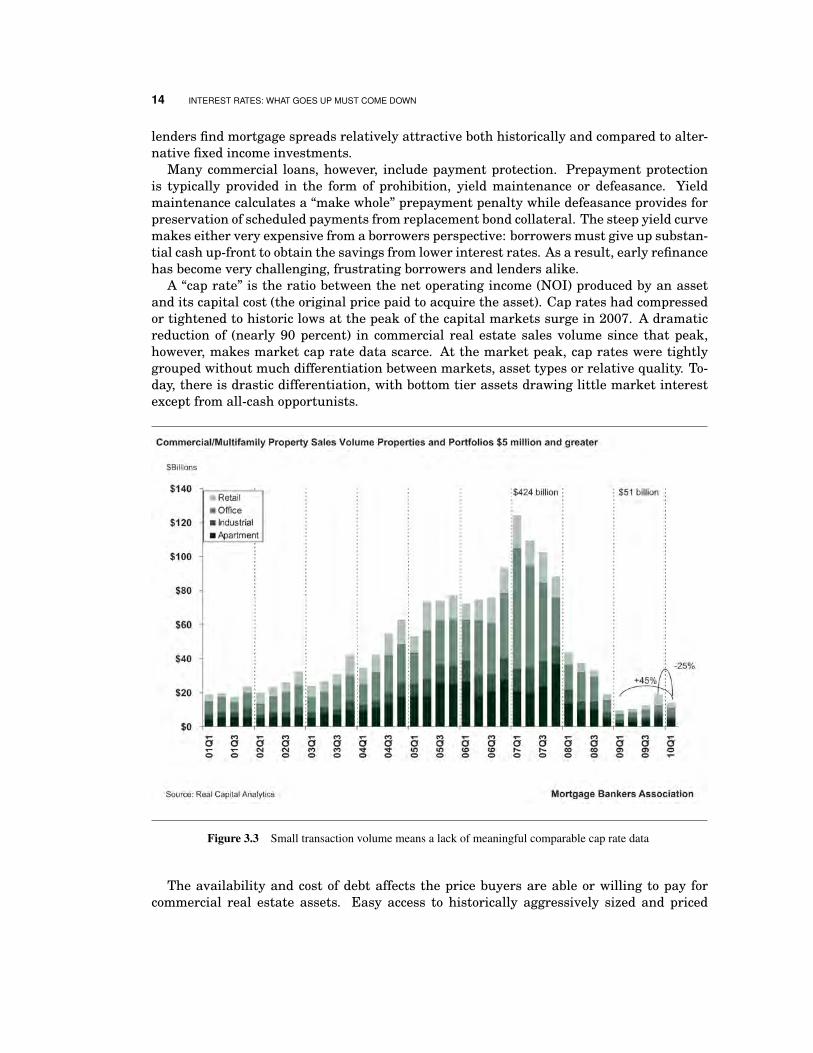
A “cap rate” is the ratio between the net operating income (NOI) produced by an assetand its capital cost (the original price paid to acquire the asset). Cap rates had compressedor tightened to historic lows at the peak of the capital markets surge in 2007. A dramaticreduction of (nearly 90 percent) in commercial real estate sales volume since that peak,however, makes market cap rate data scarce. At the market peak, cap rates were tightlygrouped without much differentiation between markets, asset types or relative quality. To-day, there is drastic differentiation, with bottom tier assets drawing little market interestexcept from all-cash opportunists.
Figure 3.3 Small transaction volume means a lack of meaningful comparable cap rate data
The availability and cost of debt affects the price buyers are able or willing to pay forcommercial real estate assets. Easy access to historically aggressively sized and priced
15
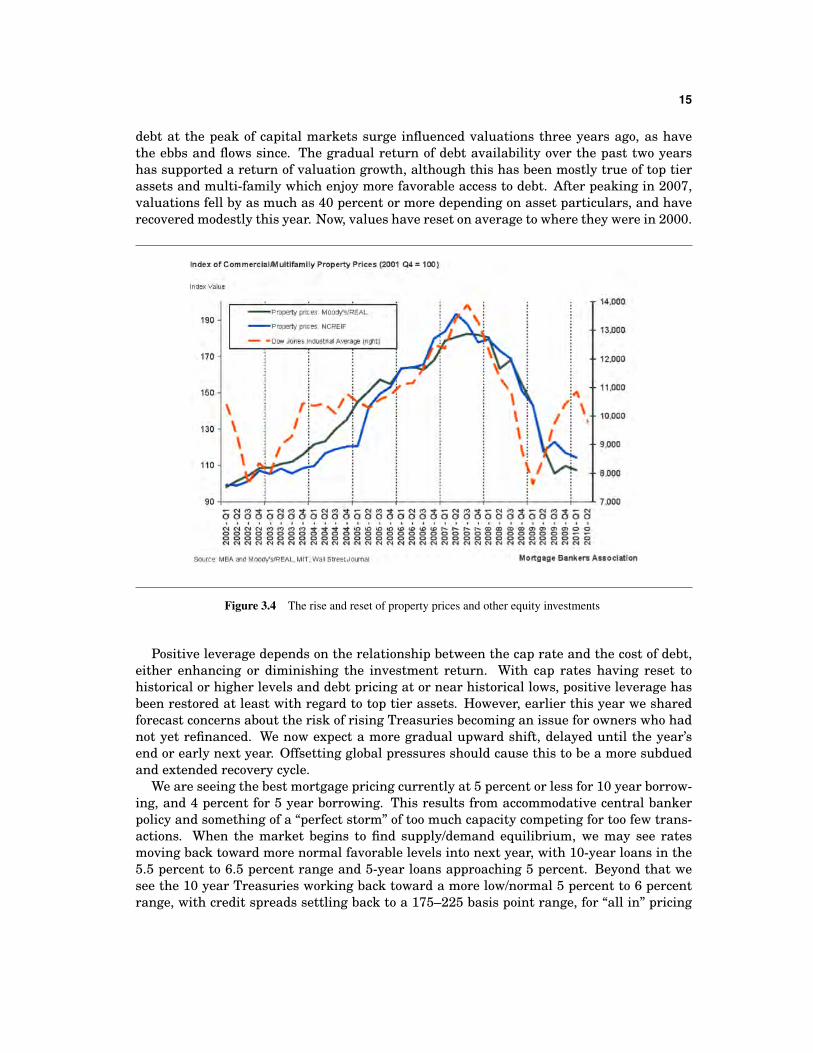
debt at the peak of capital markets surge influenced valuations three years ago, as havethe ebbs and flows since. The gradual return of debt availability over the past two yearshas supported a return of valuation growth, although this has been mostly true of top tierassets and multi-family which enjoy more favorable access to debt. After peaking in 2007,valuations fell by as much as 40 percent or more depending on asset particulars, and haverecovered modestly this year. Now, values have reset on average to where they were in 2000.
Figure 3.4 The rise and reset of property prices and other equity investments
Positive leverage depends on the relationship between the cap rate and the cost of debt,either enhancing or diminishing the investment return. With cap rates having reset tohistorical or higher levels and debt pricing at or near historical lows, positive leverage hasbeen restored at least with regard to top tier assets. However, earlier this year we sharedforecast concerns about the risk of rising Treasuries becoming an issue for owners who hadnot yet refinanced. We now expect a more gradual upward shift, delayed until the year’send or early next year. Offsetting global pressures should cause this to be a more subduedand extended recovery cycle.
We are seeing the best mortgage pricing currently at 5 percent or less for 10 year borrow-ing, and 4 percent for 5 year borrowing. This results from accommodative central bankerpolicy and something of a “perfect storm” of too much capacity competing for too few trans-actions. When the market begins to find supply/demand equilibrium, we may see ratesmoving back toward more normal favorable levels into next year, with 10-year loans in the5.5 percent to 6.5 percent range and 5-year loans approaching 5 percent. Beyond that wesee the 10 year Treasuries working back toward a more low/normal 5 percent to 6 percentrange, with credit spreads settling back to a 175–225 basis point range, for “all in” pricing

16 INTEREST RATES: WHAT GOES UP MUST COME DOWN
in the mid 6 percent to mid 7 percent range. Those who are in a position to transact overthe next year and a half will be pleased that they did. �
John M. Petersen is president of Melvin Mark Capital Group, LLC, a mortgage bankingcompany that focus on arranging capital and financial solutions for regional owners, buyersand developers of commercial real estate.
4
PERS IN CRISIS: THE SEQUEL
Phil Keisling
Public employers in Oregon, such as state and local governments, supportemployee retirement benefits via contributions to the state’s Public EmployeeRetirement System (PERS). Historically, these contributions have averaged12 percent to 15 percent of public payrolls. However, a combination offactors—especially the recent recession which has impaired PERS’ investmentreturns—mean public employers are facing steep increases in payroll costsover the next decade. These increases will likely exacerbate future state andlocal budget problems.
On May 29, 2009, the five member board that oversees the Oregon Public Employee Retire-ment System (PERS) convened for one of its regular, bi-monthly meetings.
No journalists apparently attended this meeting, nor did any legislator. At the time,Oregon’s 90 lawmakers were holed up in the Capitol building in Salem, trying to grapplewith a $4.5 billion projected budget deficit—a deficit that was driven by Oregon’s worsteconomic crisis in a half century.
In a lengthy presentation the actuary hired by PERS, Mercer Consulting, outlined therecession’s severe impact on PERS’ financial fortunes. In less than two years, PERS’ mainaccount, known by its acronym OPERF, had fallen from a peak of $63 billion to $45 billion.The “funded status” of OPERF—the ratio of PERS assets to liabilities—had fallen fromalmost 100 percent funded to 74 percent funded.
Center for Real Estate Quarterly Journal, vol. 4, no. 3. Summer 2010Copyright c© 2010 Portland State University
17
18 PERS IN CRISIS: THE SEQUEL
For the State ofOregon, totalPERS related
obligationsamount to about
15 percent ofpayroll
Mercer’s actuaries then described an even more brutal reality.Historically, OPERF earnings have provided 70 percent of whatthe PERS system needs to meet its actuarial and contractual obli-gations. The remainder is then largely made up by direct employercontributions, with rates set every two years by the PERS boardbased on OPERF’s past (and projected future) returns, plus a widerange of other assumptions.
As the Mercer report noted, with OPERF so ravaged by the mar-ket downturn, there was only one other source for necessary funds:Oregon taxpayers, the ultimate financiers of any public employer’scontribution rate. Even with a relatively quick and robust recov-
ery of OPERF earnings back to about 8 percent annual returns Mercer’s conclusion wasbreath-taking. By decade’s end, Oregon’s public employers would likely need to pony upan additional $5 billion a biennium (compared to 2009–11 levels) to keep PERS adequatelyfunded.
This is real money. Even half that amount, or $2.5 billion, would allow the hiring of20,000 new K–12 school teachers; or could entirely abolish tuition for all of Oregon’s univer-sity and community college students; or could provide health insurance for 300,000 unin-sured Oregonians.
STATE EMPLOYER CONTRIBUTIONS AND THE EMPLOYEE “BURDEN RATE”
When I first came across the Mercer report, I was a Vice President for Beaverton-basedCorSource Technology Group, an IT and software services company that provided contractstaffing and project services to many Oregon businesses. So I was familiar with the basicconcept of a “burden rate” for calculating total employee costs.
All employers, private and public, are required to pay certain taxes, such as Social Se-curity and Medicare payroll taxes. In addition to other mandatory costs, such as unem-ployment insurance and workers compensation, most private employers provide employeebenefits such as health insurance and retirement contributions. In the private sector, thecombined total of all these “burden costs” is typically between 30 percent and 35 percent ofpayroll. So an employer, hiring an employee at $50,000 a year, needs to budget an additional$15,000 to $17,500 to cover all these obligations.
PERS obligations vary for each of Oregon’s 800+ public employers. But for the Stateof Oregon itself, total PERS related obligations amount to about 15 percent of payroll for2009–11.
Based on the Mercer report’s analysis of the “50 percent probability” scenario for future fi-nancial market returns—and assuming the continuation of existing policies and practices—by 2017–19 the burden rate for PERS related obligations alone or a typical public employerwould be about 35 percent of payroll. (Further assuming the state also continued to pro-vide current levels of health insurance and other benefits, the total employee burden wouldalso rise, to about 70 percent of payroll or more than double the typical rate in the privatesector.)
While Mercer’s most recent analysis now projects typical rates peaking at about 30 per-cent by decade’s end, this still represents an historic sea change. Since 1975, the core “em-ployer contribution rate” paid by state and local entities to support their PERS obligations
WHAT ABOUT THE PERS REFORMS IN 2003? 19
was fairly stable. Over this period, it stayed within a narrow band of 9 percent to 12 percentof payroll, even during the recession earlier this decade.
WHAT ABOUT THE PERS REFORMS IN 2003?
The 2001 recession triggered major changes in PERS. In the wake of the recession, OPERFlost about 17 percent of its value in the 2001–02 period. With potential unfunded liabilitiesprojected to soar to $17 billion, and employer rates projected to hit 25 percent, in 2003 theLegislature enacted major changes in PERS.
If Oregon’s stringof public finance
crises were a chainof horror films, thelatest predicament
might be calledPERS in Crisis:
the Sequel
These reforms, which are still controversial, were championedby Democratic Governor Ted Kulongoski, most Republican legisla-tors, and a few Democratic legislators like Rep. Greg MacPherson.Even so, many reforms were widely opposed by PERS recipientsand public employee unions, who challenged the reforms in court.In the end, the Oregon Supreme Court rejected the most ambitiousreforms, but retained others.
From 2003 to 2007, OPERF grew at an annualized rate of15 percent. The combination of relatively high returns and otherchanges made by a newly-constituted PERS board allowed PERSrates to remain relatively stable. “Crisis averted” was the domi-nant emotion and PERS essentially vanished from the public pol-icy radar screen.
In 2008, OPERF plunged an historic 28 percent. Though OPERF has rebounded from itsMarch 2009 low point of $41 billion, its $50 billion value (as of December 31, 2009, a keydate for rate-setting purposes) is still down about 21 percent from its $63 billion high pointof 2007.
If Oregon’s string of public finance crises were a chain of horror films, the latest predica-ment might be called PERS in Crisis: the Sequel. It even has its own scary plot line: Evenif OPERF can consistently earn 8 percent a year, every year for the next decade, employercontribution rates will still soar so that for the state of Oregon (and many other local gov-ernments) total PERS obligations will approach approximately 30 percent of payroll.
THE UPS AND DOWNS OF SIDE ACCOUNTS
The state as well as many K–12 school districts and local governments face another poten-tial PERS problem due to a once-promising “hedge strategy” that could end up adding totheir deficit. Over the last decade the state of Oregon and over 100 local government enti-ties sold more than $6 billion in pension obligation bonds. In so doing, they borrowed moneyat about 5 percent interest, and then invested the proceeds in OPERF “side accounts.” Theydid so in the expectation that OPERF returns would be higher than the interest rates theywould pay on the bonds. Through this arbitrage strategy they hoped they could “buy down”their employer contribution rate by as much as three percentage points.
The strategy worked brilliantly during the 2003–07 market run-up. Some jurisdictionsreduced their entire employer contribution to zero through side account earnings.
But, bonds are debt and debts have to be repaid. What’s more, many jurisdictions decidedto repay their bonds on an escalating schedule of about 8 percent more each biennium, on
20 PERS IN CRISIS: THE SEQUEL
the assumption that their payrolls would also increase about 8 percent. For example, underthis repayment schedule, the Portland public school district will pay about $61 million inbond repayments during the 2009–11 period. By the 2019–21 biennium, those obligationswill rise to about $106 million. Contrast this with how most homeowners repay their mort-gages or home equity loans, with fixed, regular payments until their loan obligations arefully discharged.
Public finance experts will likely debate the wisdom of the pension obligation bond strat-egy for years to come. But at the risk of some over-simplification, the strategy is similar toa homeowner taking out a $100,000 second mortgage to invest in the stock market. Thishomeowner then further assumed his or her salary would steadily increase, so that the in-creasing repayments would remain constant as a percentage of household income. Needlessto say, a wrong bet, either with respect to future investment returns or future householdincome, can quickly cause real problems.
Of course, unlike most homeowners, public pension funds have a much longer investmenthorizon, and since 1975 the Oregon Treasury calculates OPERF’s annual rate of return at10 percent. But for the 1999–2009 period, the return rate was just 4.5 percent and nowsome jurisdictions are losing money on their side account investments.
THE SIX PERCENT PICKUP
The final major component of PERS obligations involves something known as the “6 per-cent employee pick up.” By law, a PERS beneficiary must contribute 6 percent of his or herpay to participate in PERS. But over the last 30 years, and often through negotiated con-tracts, most public employees in Oregon now have their 6 percent share paid, in full, by thepublic employer. (There are, however, exceptions; in the 1990s, the Portland school boardnegotiated a contract with its employees that included pay hikes and the abolition of theemployer-financed pick up.)
Few issues so raisehackles as muchas the 6 percent
pick up issue
While the 6 percent pick up issue can legally be re-visited aspart of any new contract negotiation, for decades it has been widelytreated as a “built in” component. For example, its assumed con-tinuation is part of the state’s current projected state general funddeficit of $2.7 billion. Even so, Governor Kulongoski’s recent “ResetCabinet” report recommended reducing the state’s pick-up contri-bution.
Few issues so raise hackles as much as the 6 percent pick upissue. Proponents of the pick up argue that it is justified because employees in past yearsagreed to forego what they considered to be deserved pay increases in exchange for this pickup. Critics of the pickup note that most private sector workers (and public workers in otherstates) must make some contribution from their own pockets to their retirement plans.
A further wrinkle is that, since the 2003 reforms, these employee contributions have goneinto separate accounts, which are more like “defined contribution” plans than PERS’ core“defined benefit” plans whose value is based on factors such as salary, years worked, anddate of original hire. This means a portion of today’s public employees’ retirement plans arealso subject to market uncertainties, though certainly to a lesser extent than for workerssolely reliant on their 401(k) plans.
CONCLUSION 21
CONCLUSION
Regardless of the various legal and political debates surround PERS, few would disagreethat an adequate, stable retirement plan is an essential ingredient to any well-designed,well run public compensation system. It is the various details of PERS that will be keyissues for policy makers, public employees, and courts in coming years, especially as publicemployers at all levels grapple with unprecedented budget deficits that could well persistlong after the economy recovers. With PERS, some of those details have already been re-solved by various court decisions. But other details can and likely will be discussed (e.g., the6 percent pick up) as public officials now confront a “perfect storm” of a lingering economicrecession, near double-digit unemployment, and yet another round of massive budget cuts.
Already, that grappling is evident, as PERS costs are beginning to play a much biggerrole in state and local budget crises. For example, beginning with the 2011–13 bienniumthe state and other Oregon public employers will face about a 6 percent hike in their net em-ployer contribution rates. Put another way, they must come up with an additional $1 billionrelative to the 2009–11 biennium just to stay even with their PERS obligations.
And of course, the timing could not be worse. The state currently faces a projected$2.7 billion deficit for 2011–13 (this is on top of an additional 9 percent in state generalfund cuts recently ordered by Governor Kulongoski). Meanwhile, some local governmentsmay be even worse off than the state. Many have already started to lay off employees, dueto current revenue shortfalls and partly in anticipation of looming PERS hikes.
Indeed, even though these increased PERS costs have not technically “hit the books”yet, there is no escaping that they will arrive with all the certainty of an Oregon summereventually turning to a rainy winter. That is all the more reason for policy makers to startdiscussing PERS now, lest the passage of time (or more bad economic news) make the prob-lems even more difficult to resolve. �
Phil Keisling served as Oregon Secretary of State from 1991 to 1999. Prior to that he wasa member of the Oregon House of Representatives, and spent six years as a journalist forWillamette Week and The Washington Monthly magazine in Washington, D.C.

5
DEVELOPERS USE CREATIVE STRATEGIES TOKEEP THE LIGHTS ON
Julie Serote
Portland State University
With the disappearance of financing and equity from the real estate market,developers are no longer following business models from recent years past.They have had to retune their strategies. The developers who continue tosurvive utilize their entrepreneurial and creative skills to form new businessmodels in order to keep the lights on. As a result, innovation and conser-vatism have emerged. Some have expanded into property management or fee-based development. Others have transferred their development skills over-seas. Some who were laid off have started their own businesses utilizing theirdevelopment expertise. New development work in the U.S. now exists arounda few scarce industries where financing continues to exist. Developers are stillworking. But the job description of a developer has certainly expanded.
What exactly are real estate developers doing now that new development has virtuallystopped? With pen and paper in hand, I hit the pavement to get answers to this question.The findings were much of what you would expect, mirroring the most recent recessionsin the 1980s and 1990s, with many expanding into areas such as property and asset man-agement and others having little time to pursue new ventures due to the extensive timespent managing creditors. Some developers who have the financial wherewithal are simplywaiting it out until some sign of market cash flow appears. Others have become financially
Center for Real Estate Quarterly Journal, vol. 4, no. 3. Summer 2010Copyright c© 2010 Portland State University
23
24 DEVELOPERS USE CREATIVE STRATEGIES TO KEEP THE LIGHTS ON
overwhelmed and cease to exist. Many continue to work, day by day, persevering throughadversity to create ways in which they can stay in business. Amidst the challenge of findingor creating work, I found stories of success where unemployment or lack of financing leaddevelopers to new, innovative business plans and unexpected blessings in disguise. Theseare their stories.
EXPAND THE BUSINESS MODEL
In past years, Kirk Olsen, Partner for DP Partners’ northwest region, spent much of his dayraising capital and overseeing development of speculative and build to suit developments.Now, he is spending much of his time looking for land and, to survive in a depressed market,he has broadened the services his company provides.
From aconstruction point
of view, it is anopportune time to
build
Based in Reno, Nevada, DP Partners recently signed a contractwith an institutional investor to manage their portfolio of Portlandproperties. Olsen noted that expanding their business model toinclude third party property management was a natural transitiongiven their experience managing their own portfolio of propertiesnationwide.
DP Partners has diversified its business model by acquiringexisting buildings at prices below their replacement cost, addingvalue, and taking on the lease-up risk. Here they are utilizing
their expertise in positioning and leasing new properties and transferring those same skillsto existing properties.
While the company has traditionally developed properties for their own portfolio, DPPartners has begun developing property on a fee basis. Completed in May, 2010, MorganDistributing recently moved to its new 105,000 square foot build-to-suit headquarters lo-cated at LogistiCourt at Portal Way in Portland, Oregon. This high-end, $12 million projectallowed Morgan Distributing to consolidate their headquarter facility in Oregon City withtheir distribution facility in The Dalles. Finding a company in an industry that is morerecession-proof, such as beer distribution, was a fortunate find for Olsen and enabled himto develop one of only three industrial sites to complete construction in 2010.
FIND A MARKET THAT IS FINANCEABLE
Isaac Scott, Principal with Anthem Memory Care and Alumni of PSU’s Graduate Certificateprogram, indicated his company has been fortunate to have active debt markets for theirproducts. After experiencing the demand for secondary homes dry up, the principals ofPacific Santa Fe, a Portland-based development company with over 25 years developmentexperience, formed a new development company in 2008. The company, Anthem Mem-ory Care, develops senior housing specific to individuals with Alzheimer’s disease. Fundedthrough the HUD 232 program, Anthem currently has two, 54–60 bed communities under-way, with construction expected to break ground by year-end.
Scott feels fortunate to be in a market where they can take advantage of some of theopportunities that come with a depressed construction market. From a construction pointof view, it is an opportune time to build, as construction costs have decreased, primarily dueto labor but also due to the reduced costs for certain materials. Land prices are low and the
CREATE FINANCING AND INNOVATION 25
entitlement process can be easier than in years past due to the absence of requests for newbuilding permits.
When asked if Anthem’s move into the memory care facility business was a reaction to thedown economy, Scott responded affirmatively, but also indicated that it was a response tothe realization of a huge unmet need in senior housing. Anthem determined that there wasenormous demographic support for Alzheimer care facilities, and they spent approximately6–8 months of their first year building a market research model to help them determineexactly which markets most needed a memory care facility. To date they have performedresearch on more than 150 submarkets, enabling them to discern where market demand isthe strongest. Anthem’s goal is to have four to six additional projects underway nationwidein 2011.
CREATE FINANCING AND INNOVATION
At the crux of the suspension of new development has been a lack of financing. With thecapital markets essentially dry, developers have been forced to put proposed projects onthe back burner, and many have significantly downsized their staffing as a result. Howhas Gerding Edlen Development, one of Portland’s most prominent developers, respondedto this recession? Dennis Wilde, principal with Gerding Edlen Development, noted threestrategies they have underway.
First, Gerding Edlen has created a fund to raise capital for deep green renovations by up-dating or replacing dated, energy-consuming building systems with more efficient systems.Having extensive experience in green building and environmentally responsible systems,Gerding Edlen has shifted their business model to utilize their green building expertise fromnew construction to an existing stock of office and multi-family properties located in highgrowth, urban markets within the United States. With financing virtually non-existent, thecompany created the Green Cities Fund. It pools investor funds, primarily union pensionfund money, for the purpose of acquiring existing buildings with good bones and a goodlocation to perform a deep green renovation, with subsequent re-leasing and portfolio man-agement. To date the Green Cities Fund has reached $140 million to $150 million of itstargeted $600 million in funding, according to Wilde.
Gerding Edlen Sustainable Solutions (GESS) is another arm of Gerding Edlen that is us-ing its understanding of the need for energy, water and waste conservation by creating a newventure involving energy management. The company is joining forces with EqRM Interna-tional to facilitate the sale of power to utility companies. GESS facilitates the managementof an energy resource within a building or campus for property owners. The property ownerexperiences reduced utility bills. The energy saved is treated by the utility company thesame as new energy generated, and it can sell the energy on the open market. The utilitycompanies finance the renovation and retrofits that produce the energy savings at costs sub-stantially lower than constructing new generation sources, thus providing lower cost energythan available from traditional generation sources. GESS earns a fee for their developmentmanagement services.
Specifically, GESS first performs a detailed audit of the energy consumption of a buildingor campus and outlines specific action items that the building owner can take to improve theefficiency of their facilities. GESS then determines the necessary financing and returns thatwill be needed. Building owners do not pay for the energy efficiencies, but rather GESS finds
26 DEVELOPERS USE CREATIVE STRATEGIES TO KEEP THE LIGHTS ON
off balance sheet financing (i.e. investment partners) for their projects. GESS is workingwith EqRM to create some innovative financing structures that will allow building ownersto reach for deeper savings than the typical 15–20 percent that they can normally achieve.“The GESS goal is to obtain a 50–70 percent reduction in energy and 50 percent reductionin water consumption,” Wilde notes.
Gerding Edlencreated its own
propertymanagement andleasing arm. Now
they can bettermanage the
environmentalinnovations thatwere originallydeveloped to be
part of thebuilding
The “efficiency energy” that is produced results in lower gas, oil,or electricity costs for the building owner. This energy savings issold to the utility company via a power purchase agreement. Thebuilding owners come out ahead because they are paid a percent-age of the value of the energy generated (saved) for the use of thebuilding “site.” GESS manages the project for the owner to assurethat the targeted savings are achieved. Essentially, a profit incen-tive is utilized to create energy innovation and conservation.
Historically, Gerding Edlen’s development team has developed afairly unique skillset working with innovative, green technologiessuch as conservation, solar and wind power in new development.This skillset, combined with their 15 years of public/private devel-opment experience, enables GESS to reposition their developmentservices in a novel new business.
Finally, Gerding Edlen created its own property managementand leasing arm to manage and lease their own portfolio. This notonly has saved the company from paying outside fees, but also hasresulted in their being able to better manage the environmentalinnovations that were originally developed to be part of the build-
ing. For example, in the past a tenant or condo owner might remove the low flow fixturesin their units in an attempt to increase water flow. Property managers in the past hadnot been diligent in educating the tenant or owner not to do this. As property manager,Gerding Edlen now has a better handle on ensuring that owners are not negating the greentechnologies that were intended for the building.
LAUNCH YOUR OWN COMPANY
When Nancy Hubbard was laid off along with the bulk of Avamere’s development staff inMarch 2009, she decided to dust off her consultant hat and look for independent contractwork where she could utilize her 20+ years of development experience. She had a solid back-ground of development experience, ranging from land acquisitions and entitlement work, toworking as the Development Director for the Vancouver Housing Authority. Prior to be-ing laid off, she was developing senior independent living and assisted living facilities forAvamere Health Services.
After six months of marketing efforts, Hubbard responded to a RFP for Riverdale SchoolDistrict and was awarded the contract to be their owner representative for the constructionof the new grade school. In this role she used her construction and development expertise torepresent the owner (Riverdale School District) in facilitating the communication betweenthe school district, staff, and public for the development of the new grade school. She even-tually became the project manager for the Riverdale development project, which is slatedfor completion in August 2010. She also landed a contract with the West Linn/Wilsonville
TRANSFER DEVELOPMENT SKILLS OVERSEAS 27
School District to help them purchase owner supply items (i.e. furniture) for both newschools and five remodeling projects for existing schools in the district.
Hubbard not only found herself a job in a tough economic environment, but also found onethat is fulfilling. She said that her new development niche (school development) is similarto the work she did in affordable housing and senior housing. “It’s a good feeling at the endof the day to go home and know that the work I did is making a difference in people’s lives.”She also is enjoying the benefits of owning her own company and the flexibility of workingindependently. “The funny thing is that if someone offered me a development job now (astheir employee) I would turn them down because I’m happy with what I’m doing.”
TRANSFER DEVELOPMENT SKILLS OVERSEAS
John Bartell left Opus Northwest in May, 2009, to utilize his development skills to the cre-ation of Camana Bay, a new urbanist town on Grand Cayman. Already underway, phase oneof Camana Bay is the development of the town center consisting of approximately 550,000square feet of built space, of which 100,000 square feet is retail, 63 apartment units, andthe remainder being office space. Phase two, beginning later this year or early 2011, is thehousing phase consisting of approximately 200 single family homes. John also manages andleases a six-building class B office park for the same owner as Camana Bay.
Bartell, who is filling the role of Director of Property Management, spends the majorityof his time managing the properties, but also does some work with the development andleasing teams for Camana Bay. “I’m doing the same thing companies did 20 years ago inthe recession. Companies like Trammell Crow and Koll reinvented themselves as propertymanagement companies, buying property management companies to obtain fee income, ac-quiring new clients, and managing a portfolio until the development market returns.”
Bartell says he has been able to easily transfer his 26 years of development experienceoverseas. It is a matter of understanding the market, according to Bartell, so he has got-ten to know his tenants and understands their needs, allowing him to effectively negotiatetheir leases as they expire. He is taking his operating practices and discipline that were soingrained in his years of development work in the U.S. and transferring them to projectsoverseas.
Originally Bartell’s contract for the Camana Bay project was two years. Needless to say,with a five minute walk to work from his ocean-front apartment, he now plans to be therelonger.
PSU Real Estate Certificate student Mazen Abualhaija has over 10 years of developmentexperience and has also taken his skills overseas. Abualhaija currently works for a large de-velopment company based in Dubai. While the company shrank from approximately 400 to100 employees, the company is focused on completing projects that were already underwayprior to the construction slowdown.
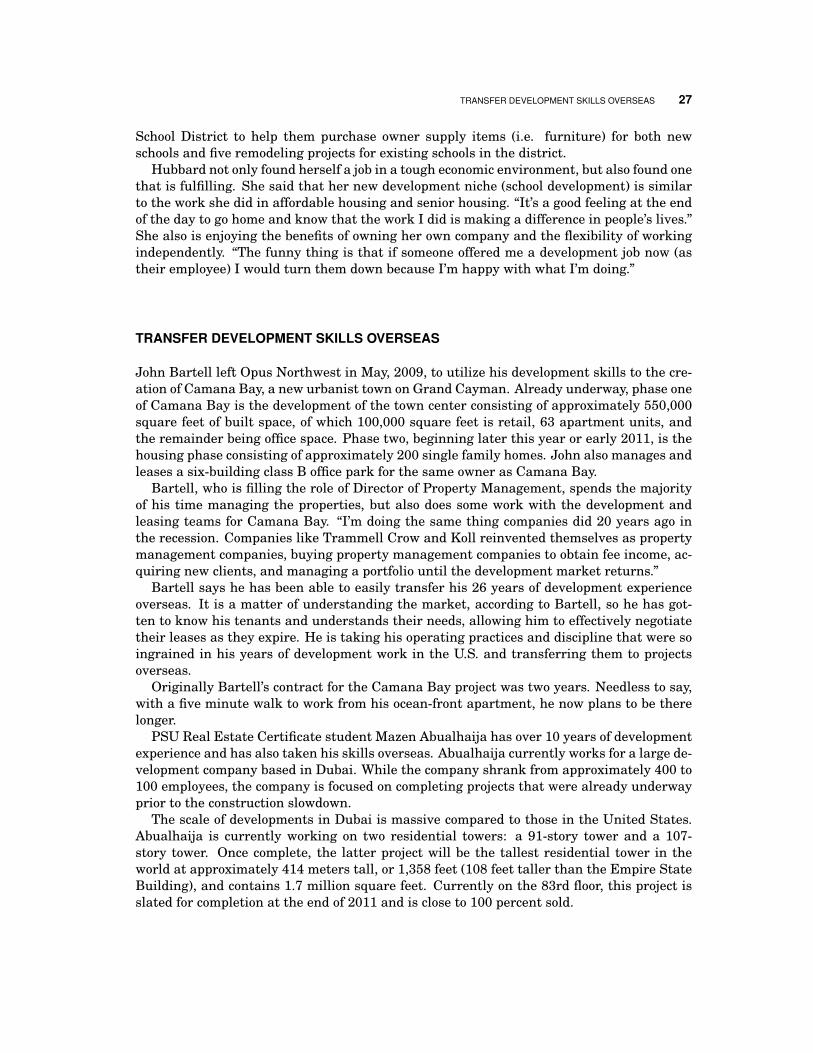
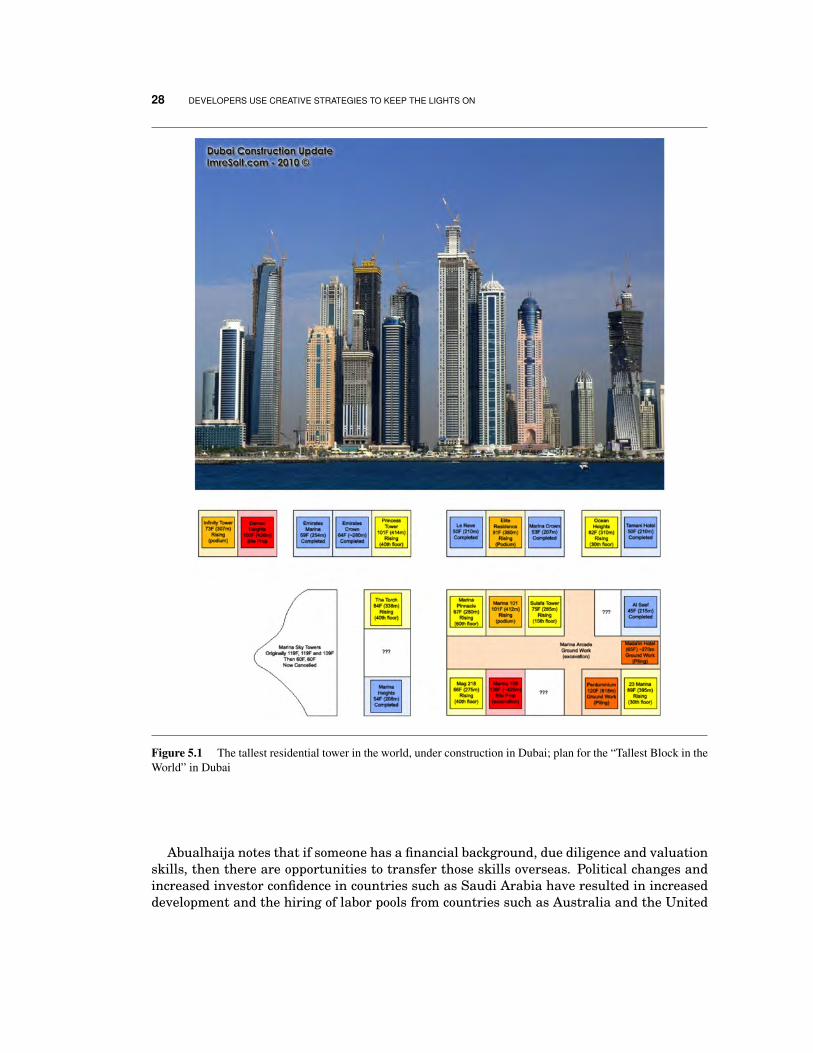
The scale of developments in Dubai is massive compared to those in the United States.Abualhaija is currently working on two residential towers: a 91-story tower and a 107-story tower. Once complete, the latter project will be the tallest residential tower in theworld at approximately 414 meters tall, or 1,358 feet (108 feet taller than the Empire StateBuilding), and contains 1.7 million square feet. Currently on the 83rd floor, this project isslated for completion at the end of 2011 and is close to 100 percent sold.
28 DEVELOPERS USE CREATIVE STRATEGIES TO KEEP THE LIGHTS ON
Figure 5.1 The tallest residential tower in the world, under construction in Dubai; plan for the “Tallest Block in theWorld” in Dubai
Abualhaija notes that if someone has a financial background, due diligence and valuationskills, then there are opportunities to transfer those skills overseas. Political changes andincreased investor confidence in countries such as Saudi Arabia have resulted in increaseddevelopment and the hiring of labor pools from countries such as Australia and the United
CONCLUSION 29
Kingdom. A recent report from Jones Lang LaSalle, a financial and professional servicesfirm specializing in real estate services and investment management, notes:
Saudi Arabia is by far the largest real estate market in the Gulf and is poised to be one ofthe fastest growing markets in the region over the next three years, with up to 30 millionsquare meters of commercial (office, retail and hospitality space) forecast across the majorcities within the Kingdom by 2012. Unlike most of the other GCC markets, the Saudi realestate market is driven primarily by internal demand generated by the rapidly growinglocal population.
Saudi Arabia is just one example of a handful of countries that are now welcoming foreigndevelopers’ expertise as a result of recent changes in governmental policies and restrictions.
CONCLUSION
Developers are known for their entrepreneurial spirit, creative problem solving skills, andtenacious attitude to persevere through insurmountable challenges. These same skills arebeing used by developers today to survive this economic crisis. Change is inevitable, and thejob description of developers will continue to evolve until the market settles on a “new nor-mal.” Developers will need to continue to be innovative in finding ways in which to makemoney in a world where new construction barely exists. Transferring development skillsand knowledge such as project management, working with public officials, green buildingand energy efficiency, and creative problem solving into less traditional areas of develop-ment will enable developers to continue to do business. In the short term, developers mayhave to relocate either nationally or internationally to find development work. While devel-opers have downsized staffing, new jobs will slowly emerge as they expand their businessmodels into new ventures. Yes, the Great Recession has caused some developers to close upshop, but silver linings centered around innovation and ingenuity will undoubtedly appear,creating completely new businesses, and jobs, for the future and success for those developerswho persevere through the storm. �
Julie Serote is the assistant director at the Center for Real Estate, Portland State Uni-versity. Her responsibilities include industry outreach, career counseling, administeringindustry networking and mentor programs, coordination of the Center’s annual real estateconference, and fundraising for the Center. Ms. Serote brings more than nine years of realestate experience, including asset management, underwriting, loan servicing and workouts,and affordable housing lending to PSU’s Center for Real Estate. She has has an MBA fromPortland State University and a bachelor’s in Business Administration from PepperdineUniversity.

6
PORTLAND’S UNREINFORCED MASONRYAPARTMENT BUILDINGS: A THREATENEDSPECIES?
Walter W. McMonies
Roberts Kaplan LLP
Now that Western Oregon and Washington have been identified as being sub-ject to massive if infrequent “subduction zone” earthquakes and that the vul-nerability of unreinforced masonry (URM) buildings to damage or collapsein a major earthquake has been documented, the owners of URM apartmentbuildings can expect to face gentle but inevitable pressure from casualty insur-ers, mortgage lenders and the local government to seismically reinforce theirbuildings. The challenge facing such owners is that the (1) cost of a standardseismic retrofit of an URM building will in many cases approach 20 percent ofthe value of that building, but (2) the retrofit adds little to the cash flow of thebuilding aside from marginally lowering earthquake insurance premiums andmortgage interest rates. Given the large number of and historic/ architecturalimportance of URM apartments to Portland, URM building owners, architec-tural preservationists, structural engineers, mortgage lenders and insurers,and city and state officials need to work collaboratively to reduce impedimentsto and increase incentives for seismically upgrading URM apartments.
By 1991, geologists led by Brian Atwater of the U.S. Geological Service had establishedthat Western Oregon and Washington are subject to periodic but infrequent (every 300-600 years) Cascadia Subduction Zone (“CSZ”) earthquakes of enormous destructiveness,
Center for Real Estate Quarterly Journal, vol. 4, no. 3. Summer 2010Copyright c© 2010 Portland State University
31
32 PORTLAND’S UNREINFORCED MASONRY APARTMENT BUILDINGS: A THREATENED SPECIES?
approximately Magnitude (“M”) 8.7 to 9.2. The most recent CSZ quake occurred 310 yearsago in January, 1700. Geologists now estimate that there is at least a 10 percent probabilityof another CSZ, M 9 quake affecting Western Oregon in the next 50 years.
Some casualtyinsurers and
commercial realestate lenders arebecoming hesitantto insure or loan
on URM buildings
In 2001, the City of Portland published a database identifyingURM buildings in Portland. Of those, by this author’s count, about200 are apartment buildings, totaling over 5,200 units and con-servatively worth over $350 million. At least 70 of these URMapartments are of National Register historic quality. Another 100historic apartment buildings, more or less, listed on the databaseof the State Historic Preservation Office (SHPO) are of similar ma-sonry construction, although not strictly URM’s.
A URM building is vulnerable to damage or collapse in a majorearthquake because such buildings generally: (1) are rigid, lackingflexibility, (2) are not securely connected together, such that theirfoundations, exterior walls, floor and roof diaphragms are prone
to separation and (3) lack lateral strength sufficient, given the relatively heavy weight ofmasonry, to withstand large and sustained horizontal forces (shaking). This damage or col-lapse, in turn, will result in the injury or death of many occupants, the loss of a substantialpercentage of Portland’s urban (in-close) rental housing, and the loss of much of Portlandhistoric fabric.
Some casualty insurers and commercial real estate lenders are becoming hesitant to in-sure or loan on URM buildings in locales like Portland which have been identified as havinga high earthquake risk.
Portland’s URM apartment buildings are too important to “write off.” Similar buildingsin Los Angeles and San Francisco have been seismically retrofitted, albeit at substantialcost, to anticipate and ameliorate the effects of a major earthquake.
There are tax incentives to the renovation of historic buildings including a 10-year (orwith extension 20-year) Oregon historic property tax assessment freeze, a 20 percent fed-eral historic rehabilitation tax credit for substantial renovation, and Oregon and federalcharitable deductions for building faade (conservation easement) donations. Additional in-centives, especially for URM apartment buildings that are not of National Register historicquality, are advisable. Minimal “life-safety” seismic upgrades to URM’s may need eventu-ally to be made mandatory.
EARTHQUAKE RISK IN WESTERN OREGON AND THE VULNERABILITY OF URMBUILDINGS
The vulnerability of Western Oregon (as well as coastal British Columbia and WesternWashington) to a large subduction zone earthquake along the Cascadia Subduction Zone(“CSZ”), the intersection of the subducting Juan de Fuca (Tectonic) Plate and the overridingNorth American (Tectonic) Plate, has been known for almost 20 years (Atwater, Musumi-Rokkaku, Satake, Tsuji, Ueda, and Yamaguchi, 2005). An earthquake in 1700 relievedhundreds of years of tectonic plate pressure and resultant uplifting of the coastal areasof Oregon and Washington with one massive fault line correction which resulted in a sev-eral meter drop of coastal areas and incidentally created a “ghost forest” of dead red cedartrees in a tidal salt marsh near Grays Harbor, Washington. This forest was a key clue
EARTHQUAKE RISK IN WESTERN OREGON AND THE VULNERABILITY OF URM BUILDINGS 33
to the discovery of the CSZ. The exact date (January 26) and intensity (M 8.7 to 9.2) of the1700 earthquake were established based on an analysis of Japanese archives from that yearrecording the effects of an “orphan” tsunami that struck Japan on the next day, apparentlywithout any local Japanese earthquake having occurred (Atwater, Musumi-Rokkaku, Sa-take, Tsuji, Ueda, and Yamaguchi, 2005; Tobias, 2010). Atwater, Musumi-Rokkaku, Satake,Tsuji, Ueda, and Yamaguchi (2005) cite buried soil evidence in Washington of “. . . five greatearthquakes of the past 3000 years . . . [and] seven earthquakes from the past 3,500 years.”
FEMA concludesthat URM
buildings bear adisproportionate
share the damagesuffered in quakes
Analysis of coastal sediment cores has disclosed a 10,000 yearhistory of large (1.5 to 2.0 meter) periodic drops of coastal land inOregon and Washington, evidence of other CSZ quakes. Investi-gation of undersea landslides by a team of researchers headed byOregon State University Professor Chris Goldfinger has indicated19 distinct, approximate M 9 CSZ earthquake events in the last10,000 years (Rojas-Burke, 2010). These events involved a rup-ture along the entire 600 mile long Cascadia fault. Previously 13such events had been identified as having occurred since the erup-tion of Mt. Mazama 7,700 years ago with an average repeat timeof 600 years (Goldfinger, Nelson, and Johnson, 2003). Some geol-ogists, including Goldfinger, have theorized that the larger M 9 Cascadia quakes come inclusters separated by 1000-year periods of inactivity (Rojas-Burke, 2010).
A large subduction zone earthquake not only has an extremely high magnitude and a longduration, but also has long-period waves which particularly affect tall buildings (CascadiaRegion Earthquake Workgroup, 2005). A M-9 quake radiates twice the energy of a 90-mph hurricane if it blew for a month (Atwater, Musumi-Rokkaku, Satake, Tsuji, Ueda,and Yamaguchi, 2005). The shock waves emanating from an earthquake will typically beamplified with respect to a particular building if the soil under a building is soft, especiallyif the soil is either saturated with water and could liquefy or if the soil is artificial fill(Cascadia Region Earthquake Workgroup, 2005).
In a M-9 CSZ quake occurring close to Portland, many or even most (whether URM ornot) buildings in Portland will be at risk of substantial damage or collapse, but the amountof damage to a particular building will depend upon factors including: the intensity andduration of the quake’s shaking, the depth and horizontal distance of the quake’s epicenterfrom the building, the site’s soil conditions, including the amount of water in the soil, theslope of adjacent hillsides, the building’s type of construction and state of repair, and theproximity of other earthquake-vulnerable buildings which might collapse on the subjectbuilding.
The Federal Emergency Management Agency (“FEMA”), in surveying eight major UnitedStates earthquakes in the period from the 1886 Charleston, S.C. quake (M 7.7) to the 2003San Simeon, CA quake (M 6.5), concluded that URM buildings bore a disproportionate sharethe damage suffered in such quakes. Taking the eight quakes together, 4,457 URM build-ings were involved of which 5 of 6 (or about 83 percent) were damaged enough for brickworkto fall and one fifth (or about 20 percent) were damaged to the point of partial or completecollapse (Reitherman and Perry, 2009).
The vulnerability of URM buildings to earthquake damage arises from the following:
1. The inadequacy of an URM building’s exterior and/or load bearing walls to resist hori-zontal (“shear”) forces and the walls’ lack of flexibility (“ductility”), such that in a large
34 PORTLAND’S UNREINFORCED MASONRY APARTMENT BUILDINGS: A THREATENED SPECIES?
quake the floors move laterally and disintegrate in a manner akin to how the layers ofa wedding cake might be affected if violently shaken,
2. The heavy weight of the building and its floors creating enormous momentum once inmotion,
3. The lack of structural connections variously between (a) exterior walls and floors di-aphragms, (b) exterior walls and roof diaphragms and (c) exterior walls and the foun-dation,
4. The weakness and consequent susceptibility of the roof and floor diaphragms to de-flection in an earthquake, resulting in inadequate lateral support for the walls,
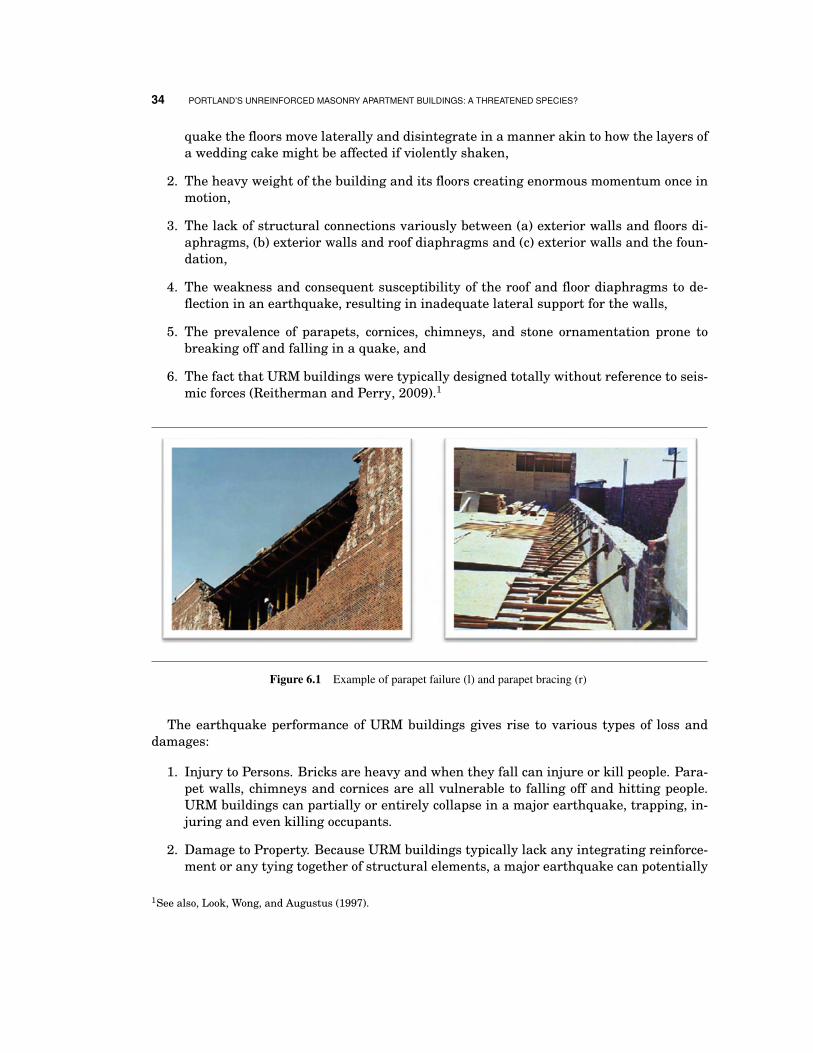
5. The prevalence of parapets, cornices, chimneys, and stone ornamentation prone tobreaking off and falling in a quake, and
6. The fact that URM buildings were typically designed totally without reference to seis-mic forces (Reitherman and Perry, 2009).1
Figure 6.1 Example of parapet failure (l) and parapet bracing (r)
The earthquake performance of URM buildings gives rise to various types of loss anddamages:
1. Injury to Persons. Bricks are heavy and when they fall can injure or kill people. Para-pet walls, chimneys and cornices are all vulnerable to falling off and hitting people.URM buildings can partially or entirely collapse in a major earthquake, trapping, in-juring and even killing occupants.
2. Damage to Property. Because URM buildings typically lack any integrating reinforce-ment or any tying together of structural elements, a major earthquake can potentially
1See also, Look, Wong, and Augustus (1997).
THE RESPONSE OF INSURERS AND LENDERS TO WESTERN OREGON’S EARTHQUAKE RISK 35
cause their partial or total collapse. As a result, a URM building may be costly torestore after earthquake damage occurs such that demolition often is the only feasiblealternative. For instance, the 1989 Loma Prieta earthquake (M 7.1) near Santa Cruz,California damaged the Pacific Avenue Historic District with the result that 52 per-cent of the URM brick buildings were quickly demolished and another 16 percent were“red tagged” (closed to use by the City inspectors because unsafe to enter).2
3. Loss of Use. Even modest earthquake damage to an URM building can require closureuntil repairs are made. Typically post-quake repairs will need to be coupled withseismic upgrades, such that closure may be for many months (Reitherman and Perry,2009).
THE RESPONSE OF INSURERS AND LENDERS TO WESTERN OREGON’SEARTHQUAKE RISK
Financialinstitutions
offering apartmentloans in Portlandnow are becoming
somewhatcautious about
loaning on URMapartments
In the mid-1990’s, soon after the discovery of a history of CSZquakes in the Northwest became public and well before any in-creased lender concern about the earthquake risk in Western Ore-gon, some of casualty insurance companies changed their ratingsof Western Oregon and Washington with respect to earthquakecasualty risk and took steps to limit their exposure to this risk.This retrenchment began in part as a reaction to the enormouslosses suffered by the insurance industry in the January 1994Northridge Quake in Los Angeles. In the immediate aftermathof the Northridge Quake, the insurers estimated $3 billion in in-surance claims, but ultimately paid out more than $15 billion, onlosses of nearly $18 billion (Treaster, 1999; Missouri EarthquakeInsurance Task Force, 2008). In response, 90 percent of the pre-existing insurers writing earthquake insurance in California with-drew from that market. To insure this risk, the California Legislature created the Califor-nia Earthquake Authority, a state backed and managed but privately funded organization(pool) which provides basic or “bare bones” earthquake coverage in California (MissouriEarthquake Insurance Task Force, 2008).
In the Northwest, by contrast, most casualty insurers offering residential and/or com-mercial earthquake coverage have not withdrawn from the market. However, most havelessened their risk by: (1) raising their policy deductibles to 10 percent or even 20 percentof the amount of the coverage, not a percentage of the amount of loss (Oregon Departmentof Consumer and Business Services, 2010), by (2) covering primarily direct physical loss toproperty and by not covering landslides, erosion, tsunami or volcanic eruption, even if partof an earthquake event (Oregon Department of Consumer and Business Services, 2009), and(3) excluding from coverage items such as personal property, ancillary improvements andrental income replacement. In 2006, Allstate announced it was dropping earthquake cov-erage for most of its customers nationwide (Associated Press, 2006; Meyer, 2006). Several
2Reitherman and Perry (2009), citing Architectural Resources Group (1990).
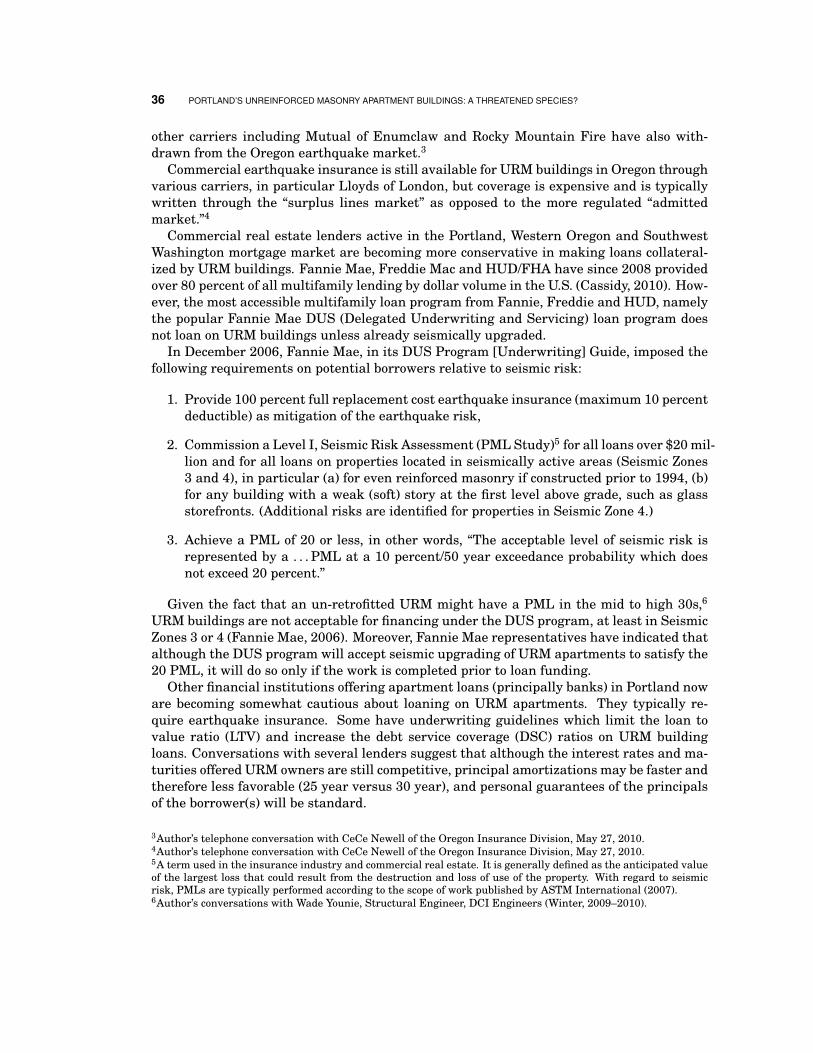
36 PORTLAND’S UNREINFORCED MASONRY APARTMENT BUILDINGS: A THREATENED SPECIES?
other carriers including Mutual of Enumclaw and Rocky Mountain Fire have also with-drawn from the Oregon earthquake market.3
Commercial earthquake insurance is still available for URM buildings in Oregon throughvarious carriers, in particular Lloyds of London, but coverage is expensive and is typicallywritten through the “surplus lines market” as opposed to the more regulated “admittedmarket.”4
Commercial real estate lenders active in the Portland, Western Oregon and SouthwestWashington mortgage market are becoming more conservative in making loans collateral-ized by URM buildings. Fannie Mae, Freddie Mac and HUD/FHA have since 2008 providedover 80 percent of all multifamily lending by dollar volume in the U.S. (Cassidy, 2010). How-ever, the most accessible multifamily loan program from Fannie, Freddie and HUD, namelythe popular Fannie Mae DUS (Delegated Underwriting and Servicing) loan program doesnot loan on URM buildings unless already seismically upgraded.
In December 2006, Fannie Mae, in its DUS Program [Underwriting] Guide, imposed thefollowing requirements on potential borrowers relative to seismic risk:
1. Provide 100 percent full replacement cost earthquake insurance (maximum 10 percentdeductible) as mitigation of the earthquake risk,
2. Commission a Level I, Seismic Risk Assessment (PML Study)5 for all loans over $20 mil-lion and for all loans on properties located in seismically active areas (Seismic Zones3 and 4), in particular (a) for even reinforced masonry if constructed prior to 1994, (b)for any building with a weak (soft) story at the first level above grade, such as glassstorefronts. (Additional risks are identified for properties in Seismic Zone 4.)
3. Achieve a PML of 20 or less, in other words, “The acceptable level of seismic risk isrepresented by a . . . PML at a 10 percent/50 year exceedance probability which doesnot exceed 20 percent.”
Given the fact that an un-retrofitted URM might have a PML in the mid to high 30s,6
URM buildings are not acceptable for financing under the DUS program, at least in SeismicZones 3 or 4 (Fannie Mae, 2006). Moreover, Fannie Mae representatives have indicated thatalthough the DUS program will accept seismic upgrading of URM apartments to satisfy the20 PML, it will do so only if the work is completed prior to loan funding.
Other financial institutions offering apartment loans (principally banks) in Portland noware becoming somewhat cautious about loaning on URM apartments. They typically re-quire earthquake insurance. Some have underwriting guidelines which limit the loan tovalue ratio (LTV) and increase the debt service coverage (DSC) ratios on URM buildingloans. Conversations with several lenders suggest that although the interest rates and ma-turities offered URM owners are still competitive, principal amortizations may be faster andtherefore less favorable (25 year versus 30 year), and personal guarantees of the principalsof the borrower(s) will be standard.
3Author’s telephone conversation with CeCe Newell of the Oregon Insurance Division, May 27, 2010.4Author’s telephone conversation with CeCe Newell of the Oregon Insurance Division, May 27, 2010.5A term used in the insurance industry and commercial real estate. It is generally defined as the anticipated valueof the largest loss that could result from the destruction and loss of use of the property. With regard to seismicrisk, PMLs are typically performed according to the scope of work published by ASTM International (2007).6Author’s conversations with Wade Younie, Structural Engineer, DCI Engineers (Winter, 2009–2010).
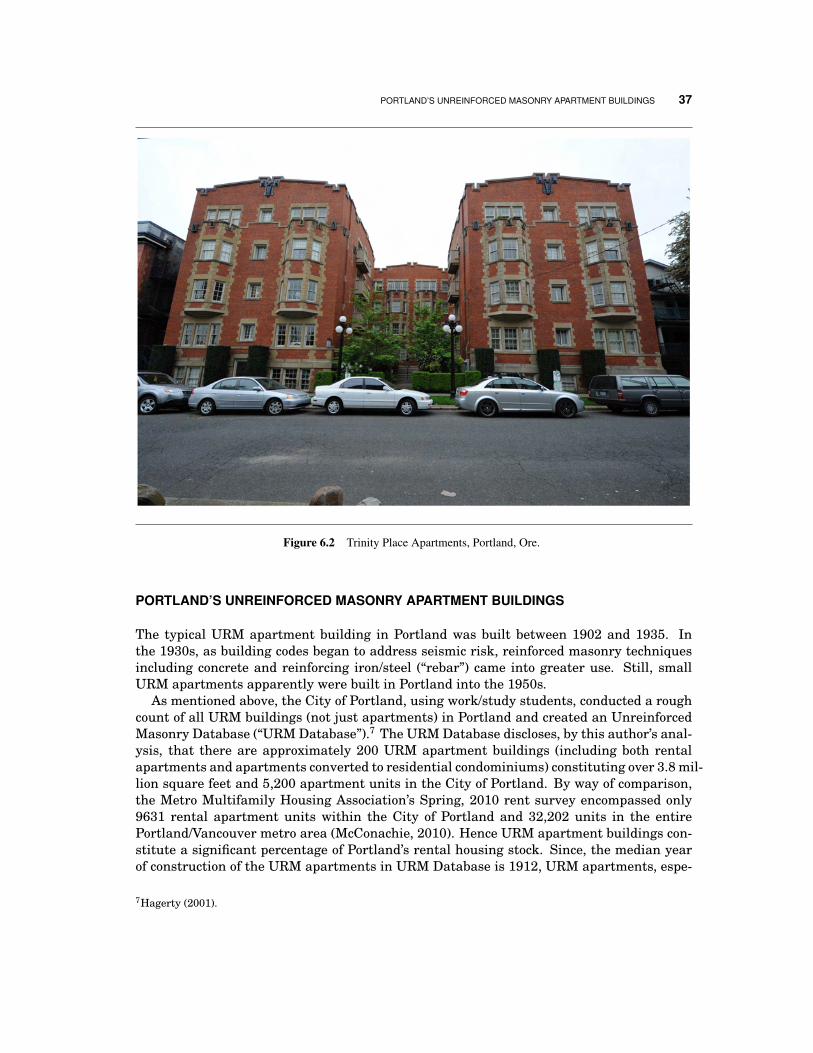
PORTLAND’S UNREINFORCED MASONRY APARTMENT BUILDINGS 37
Figure 6.2 Trinity Place Apartments, Portland, Ore.
PORTLAND’S UNREINFORCED MASONRY APARTMENT BUILDINGS
The typical URM apartment building in Portland was built between 1902 and 1935. Inthe 1930s, as building codes began to address seismic risk, reinforced masonry techniquesincluding concrete and reinforcing iron/steel (“rebar”) came into greater use. Still, smallURM apartments apparently were built in Portland into the 1950s.
As mentioned above, the City of Portland, using work/study students, conducted a roughcount of all URM buildings (not just apartments) in Portland and created an UnreinforcedMasonry Database (“URM Database”).7 The URM Database discloses, by this author’s anal-ysis, that there are approximately 200 URM apartment buildings (including both rentalapartments and apartments converted to residential condominiums) constituting over 3.8 mil-lion square feet and 5,200 apartment units in the City of Portland. By way of comparison,the Metro Multifamily Housing Association’s Spring, 2010 rent survey encompassed only9631 rental apartment units within the City of Portland and 32,202 units in the entirePortland/Vancouver metro area (McConachie, 2010). Hence URM apartment buildings con-stitute a significant percentage of Portland’s rental housing stock. Since, the median yearof construction of the URM apartments in URM Database is 1912, URM apartments, espe-
7Hagerty (2001).
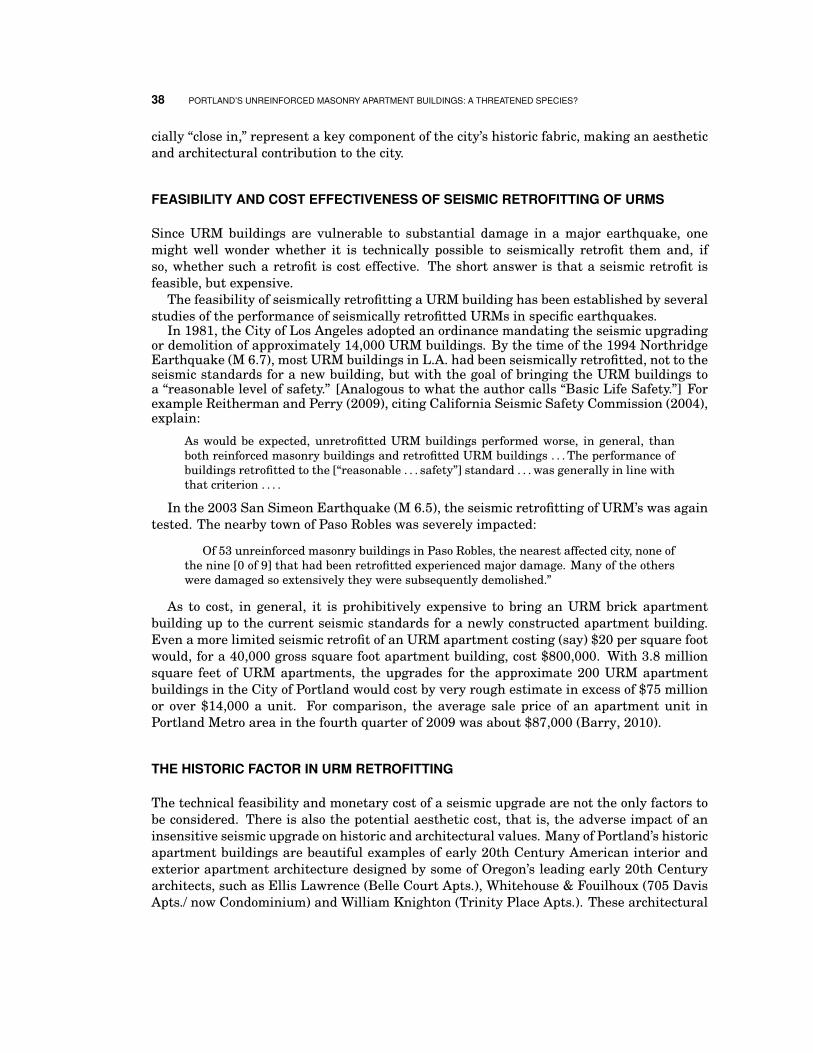
38 PORTLAND’S UNREINFORCED MASONRY APARTMENT BUILDINGS: A THREATENED SPECIES?
cially “close in,” represent a key component of the city’s historic fabric, making an aestheticand architectural contribution to the city.
FEASIBILITY AND COST EFFECTIVENESS OF SEISMIC RETROFITTING OF URMS
Since URM buildings are vulnerable to substantial damage in a major earthquake, onemight well wonder whether it is technically possible to seismically retrofit them and, ifso, whether such a retrofit is cost effective. The short answer is that a seismic retrofit isfeasible, but expensive.
The feasibility of seismically retrofitting a URM building has been established by severalstudies of the performance of seismically retrofitted URMs in specific earthquakes.
In 1981, the City of Los Angeles adopted an ordinance mandating the seismic upgradingor demolition of approximately 14,000 URM buildings. By the time of the 1994 NorthridgeEarthquake (M 6.7), most URM buildings in L.A. had been seismically retrofitted, not to theseismic standards for a new building, but with the goal of bringing the URM buildings toa “reasonable level of safety.” [Analogous to what the author calls “Basic Life Safety.”] Forexample Reitherman and Perry (2009), citing California Seismic Safety Commission (2004),explain:
As would be expected, unretrofitted URM buildings performed worse, in general, thanboth reinforced masonry buildings and retrofitted URM buildings . . . The performance ofbuildings retrofitted to the [“reasonable . . . safety”] standard . . . was generally in line withthat criterion . . . .
In the 2003 San Simeon Earthquake (M 6.5), the seismic retrofitting of URM’s was againtested. The nearby town of Paso Robles was severely impacted:
Of 53 unreinforced masonry buildings in Paso Robles, the nearest affected city, none ofthe nine [0 of 9] that had been retrofitted experienced major damage. Many of the otherswere damaged so extensively they were subsequently demolished.”
As to cost, in general, it is prohibitively expensive to bring an URM brick apartmentbuilding up to the current seismic standards for a newly constructed apartment building.Even a more limited seismic retrofit of an URM apartment costing (say) $20 per square footwould, for a 40,000 gross square foot apartment building, cost $800,000. With 3.8 millionsquare feet of URM apartments, the upgrades for the approximate 200 URM apartmentbuildings in the City of Portland would cost by very rough estimate in excess of $75 millionor over $14,000 a unit. For comparison, the average sale price of an apartment unit inPortland Metro area in the fourth quarter of 2009 was about $87,000 (Barry, 2010).
THE HISTORIC FACTOR IN URM RETROFITTING
The technical feasibility and monetary cost of a seismic upgrade are not the only factors tobe considered. There is also the potential aesthetic cost, that is, the adverse impact of aninsensitive seismic upgrade on historic and architectural values. Many of Portland’s historicapartment buildings are beautiful examples of early 20th Century American interior andexterior apartment architecture designed by some of Oregon’s leading early 20th Centuryarchitects, such as Ellis Lawrence (Belle Court Apts.), Whitehouse & Fouilhoux (705 DavisApts./ now Condominium) and William Knighton (Trinity Place Apts.). These architectural
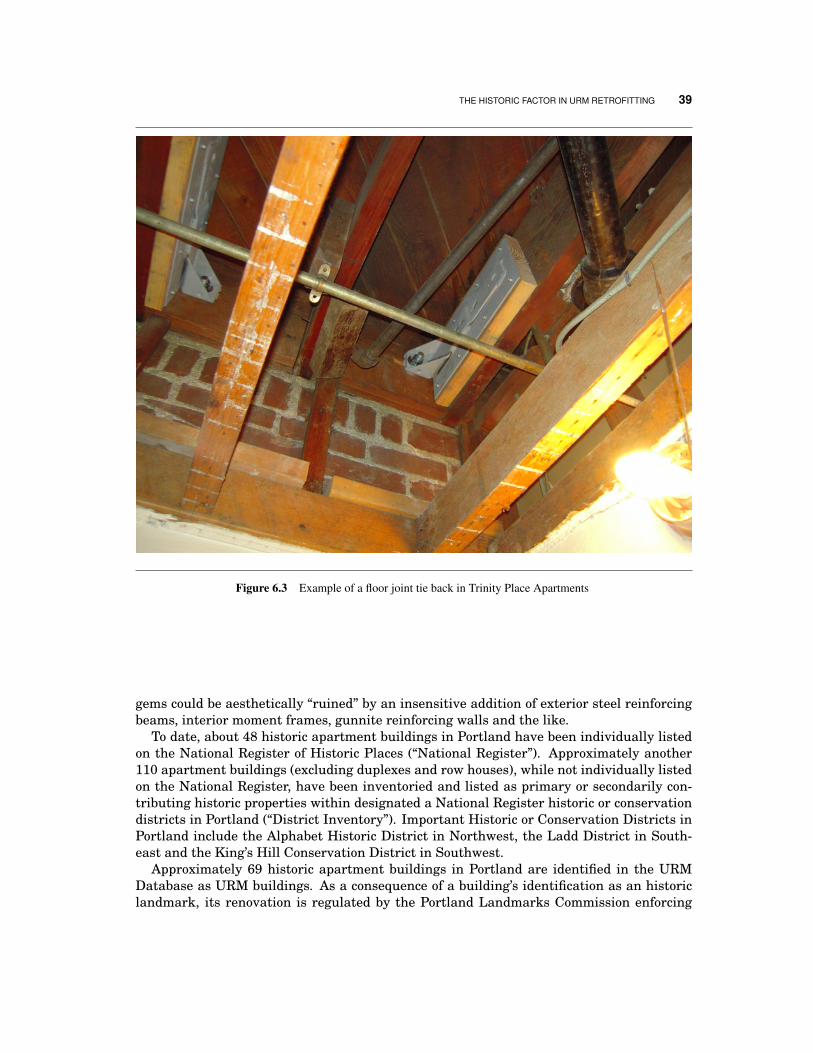
THE HISTORIC FACTOR IN URM RETROFITTING 39
Figure 6.3 Example of a floor joint tie back in Trinity Place Apartments
gems could be aesthetically “ruined” by an insensitive addition of exterior steel reinforcingbeams, interior moment frames, gunnite reinforcing walls and the like.
To date, about 48 historic apartment buildings in Portland have been individually listedon the National Register of Historic Places (“National Register”). Approximately another110 apartment buildings (excluding duplexes and row houses), while not individually listedon the National Register, have been inventoried and listed as primary or secondarily con-tributing historic properties within designated a National Register historic or conservationdistricts in Portland (“District Inventory”). Important Historic or Conservation Districts inPortland include the Alphabet Historic District in Northwest, the Ladd District in South-east and the King’s Hill Conservation District in Southwest.
Approximately 69 historic apartment buildings in Portland are identified in the URMDatabase as URM buildings. As a consequence of a building’s identification as an historiclandmark, its renovation is regulated by the Portland Landmarks Commission enforcing
40 PORTLAND’S UNREINFORCED MASONRY APARTMENT BUILDINGS: A THREATENED SPECIES?
City Code.8 If a building is listed individually on the National Register or if deemed histor-ically compatible in a District Inventory and if the owner has taken the additional step ofapplying for an historic property tax abatement, then in such case a building’s renovationis further subject to regulation by the Oregon State Historic Preservation Office (“SHPO”)enforcing the regulations of the National Park Service.
LEVELS OF SEISMIC UPGRADING FOR HISTORIC BUILDINGS
There are various levels of seismic upgrading available to the owner of an historic URMapartment building. The degree of seismic upgrade chosen by the owner is likely to bedetermined by:
1. The requirements of the local government, e.g. the City of Portland,
2. The requirements of the owner’s lender and/or insurer, if any,
3. The owner’s financial strength and perception of earthquake risk,
4. The availability of reasonably priced renovation financing and of tax incentives,
5. The importance or uniqueness of the building, and
6. The costs of engineering design, permitting, construction and loss of rental incomefrom the seismic upgrade project.
Preservation
By the author’s rough estimate, a “premium” seismic upgrade would cost at least $50 more asquare foot (i.e. $2 million or more for a 40,000 square foot building). Such an upgrade wouldnot be appropriate for a typical URM commercial or apartment building. It is normallyreserved for important public buildings, hospitals, and irreplaceable historic structures likethe 1897 Pioneer Courthouse in Portland. Recently the Courthouse (57,000 square feet)was not only seismically reinforced, but the entire building was seismically isolated fromits foundation with “friction pendulum isolators.” The construction manager on the projectreports that the total cost of the Courthouse’s renovation was $20 million, but this includednumerous improvements unrelated to seismic issues, e.g. creating an underground parkingarea, refurbishing all interior areas, and replacing all mechanical systems. This level ofupgrade promises to protect the building from a major earthquake almost intact, so it cancontinue to be open and in operation.
Full or Standard Seismic Retrofit, Zone 3
This level of seismic upgrade is estimated to cost in the range of $20 to $40 per square footdepending on building design and condition (i.e. a minimum of $800,000 for a 40,000 squarefoot building). Under this approach, an historic building is substantially retrofitted to meet,to the extent possible, the prescribed IBC (building code) provisions for renovation of a
8City of Portland, Title 33, Planning and Zoning, 33.445 Historic Resource Protection Overlay Zone and 33.846Historic Reviews.
INCREASING INCENTIVES AND REMOVING OBSTACLES TO THE SEISMIC UPGRADING OF URM APARTMENTS 41
building to Seismic Zone 3 standards.9 Some substantial, but repairable, damage would beexpected after a major earthquake. This is the level of upgrade one might use for an historicquality URM apartment building.
Basic Seismic Upgrade
This level of upgrade is estimated to cost from $10 to $15 per square foot depending onbuilding design and condition (i.e. $400,000 to $600,000 for a 40,000 square foot building).Under this approach, the building is selectively upgraded to substantially reduce damageand loss in a moderate earthquake. Inherent deficiencies found in older buildings, suchas poor floor to wall framing connections and un-braced masonry walls would be corrected.After a design-level (moderate) earthquake, some structural damage is anticipated, suchas masonry cracking, and the building would be temporarily unusable, but it would berepairable; moreover occupants would be able to exit the building in relative safety.
Basic Life Safety
This upgrade is estimated to cost in the $5 to $10 per square foot range depending on build-ing design and condition (i.e. $200,000 to $400,000 for a 40,000 square foot building). Thistype of project addresses the most serious life-safety concerns by correcting those deficien-cies that could lead to serious human injury or total building collapse. Upgrades may in-clude (i) bracing and tying the most vulnerable elements of the building, such as parapets,chimneys, and projecting ornamentation, or (ii) reinforcing routes of exit. It is expectedthat if an earthquake were to occur, the building would not collapse but would be seriouslydamaged requiring major repairs (Look, Wong, and Augustus, 1997).
INCREASING INCENTIVES AND REMOVING OBSTACLES TO THE SEISMIC UPGRADINGOF URM APARTMENTS
URM building owners, architectural preservationists, architects, structural engineers, mort-gage lenders, the City, SHPO, all need to work collaboratively to increase incentives andreduce or impediments to undertaking seismic upgrades of URM apartments. These imped-iments and possible solutions include:
1. The inability of many building owners to benefit from the 20 percent Federal HistoricTax Rehabilitation Credit because of alternate minimum tax (“AMT”) limitations.10
Suggested solution: Short of inducing Congress to change AMT rules, the City,through (say) the Portland Development Commission (“PDC”), might commit to fa-cilitate the “sale” and potentially help “create a market” for the “sale” by the buildingowners of historic tax credits to local and national corporations able to use them.
2. The onerous expenditure requirements (i.e. 10 percent of the building’s Real MarketValue as determined by the county assessor in 5 years) which must be agreed to in a
9See Oregon Structural Specialty Code (2007), Section 1613, Earthquake Loads.10See Internal Revenue Code, Section 47 and Regulations 26 CFR 1.48-12.
42 PORTLAND’S UNREINFORCED MASONRY APARTMENT BUILDINGS: A THREATENED SPECIES?
“preservation plan” and accomplished by the historic building owner to qualify for orextend an Oregon historic property tax assessment freeze for 10 years.11
Suggested solution: Modify ORS 358.487(2)(a) so that a phased seismic upgrade ofan historic building over as long as a 15 to 20 year period, so long as the expendituresduring the each 10-year freeze period total at least 5 percent (as opposed to 10 percent)of the property’s initial RMV, is sufficient to qualify the property for a full 20 years (10initial years and 10-year extension) of assessment freeze.
3. The perception (if not reality) that City Building Inspectors, Portland LandmarksCommission and SHPO approvals of rehabilitation plans for historic buildings areoften bureaucratically determined with little reference to practical realities and thatcostly plan changes are sometimes required. Note that typically, no City Landmarksapproval is required if there are no exterior modifications.Suggested solution: Encourage the City and SHPO to appoint a joint task force,including representative architects, engineers and building owners, charged with ana-lyzing and expediting the rehabilitation plan approval process and criteria for reviewof seismic upgrades.
4. The unavailability of most historic tax incentives to the owners of non-historic qualityURM apartment buildings in Portland.Suggested solution: Lobby Congress to remove the “no-residential” exclusion fromthe 10 percent rehabilitation credit for seismic upgrade work in Seismic Zones 3 and4 and lobby the Oregon legislature to pass a property tax assessment freeze to non-historic URM apartments undergoing seismic upgrading.
5. The higher cost, higher deductibles and more limited coverage of earthquake insur-ance for URM buildings.Suggested solution: The Oregon Insurance Commissioner should set up a task force,including representative URM apartment owners and insurance companies, to studythe potential need for and steps required to set up a state- organized commercial earth-quake insurance program for URM buildings.
6. The expense of building-specific engineering studies of seismic risk ($2,000 to $10,000)and of seismic upgrade designs needed by the owner of a URM building to analyzehis/her building’s seismic condition and to design seismic upgrades to address defi-ciencies.Suggested solution: A mechanism for pooling technical information on current seis-mic upgrade technology and design for URM buildings and for subsidizing engineeringinspections of URM apartment buildings so as to facilitate the analysis of URM build-ing deficiencies and the design of seismic upgrades.
7. The relative unavailability and, if available, the costliness (high loan fees and interestrates) of renovation (construction) loans for URM apartment buildings.Needed: A State or City/ PDC grant and/or low interest subordinated loan program(possibly funded by municipal bonds) affording URM building owners renovation loanssufficient to cover a majority of the cost of at least life safety seismic upgrades.
11ORS 358.475-545
REFERENCES 43
8. The difficulty of making extensive seismic upgrades to an apartment building espe-cially to interior spaces without terminating all tenants and the consequent loss ofincome.
Suggested solution: The owner should be allowed by the City inspectors and itsrenovation lender, if any, to undertake the project in discrete stages over several years,For instance, the exterior work (less intrusive) first, interior common area work next,and work that necessitates unit entry on a unit by unit basis, as much as possible onunit turnover (vacancy).
These impediments to seismic upgrades of URM apartment buildings, together with thegeneral lack of knowledge among URM apartment owners of either the earthquake riskor the feasibility of seismic upgrades, compounded by the natural tendency of investmentproperty owners to avoid voluntary capital expenditures that do not improve the “bottomline” cash flow, these factors have resulted in a very slow pace for seismic upgrades of URMapartment buildings in Portland. Given the risk of an M 9 earthquake in the next 50 years,this pace must be accelerated for the owners, the tenants, and the City. As the creationof additional generous governmental incentives to seismic upgrading are unlikely in thecurrent economic climate, some combination of (i) a governmentally mandated timetable forminimum (Basic Life Safety) seismic upgrading timetable (over say 15 to 20 years) for URMapartments and (ii) changes ameliorating the impediments listed as items 1 to 8 above, maybe the only feasible approach. �
Walter W. McMonies is a partner at the law firm of Roberts Kaplan LLP, where his prac-tice emphasizes real estate transactions. He owns of several historic apartment buildings.Mr. McMonies is a member of the Trust for Public Land (Oregon Advisory Council) and is apast board member of the Historic Preservation League of Oregon.
REFERENCES
ARCHITECTURAL RESOURCES GROUP (1990): “An Assessment of Damage Caused to HistoricResources by the Loma Prieta Earthquake,” National Trust for Historic Preservation.
ASSOCIATED PRESS (2006): “Allstate Dropping Most Earthquake Insurance Nationwide,” June 5.
ASTM INTERNATIONAL (2007): “Standard Guide for Seismic Risk Assessment of Buildings,”ASTM E2026-07.
ATWATER, B. F., S. MUSUMI-ROKKAKU, K. SATAKE, Y. TSUJI, K. UEDA, AND D. K. YAMAGUCHI(2005): The Orphan Tsumani of 1700: Japanese Clues to a Parent Earthquake in North America.U.S. Geological Survey and University of Washington Press.
BARRY, M. D. (2010): “Portland Apartment Overview and Forecast for 2010,” Presentation toMetro Multifamily Housing Association, April 23.
CALIFORNIA SEISMIC SAFETY COMMISSION (2004): “Findings and Recommendations from theSan Simeon Earthquake of December 22, 2003,” CSSC No. 04-02.
CASCADIA REGION EARTHQUAKE WORKGROUP (2005): “Cascadia Subduction Zone Earthquakes:A Magnitude 9.0 Earthquake Scenario,” .
CASSIDY, K. (2010): “Issues and Trends in the Multifamily Debt Market in 2010,” Presentationto Metro Multifamily Housing Association, April 23.
44 PORTLAND’S UNREINFORCED MASONRY APARTMENT BUILDINGS: A THREATENED SPECIES?
FANNIE MAE (2006): “Multifamily/Delegated Underwriting and Servicing (DUS) Guide, Part III,”Section 805.03: Earthquake/ Seismic Risk Assessment Requirements.
GOLDFINGER, C., C. H. NELSON, AND J. E. JOHNSON (2003): “Holocene Earthquake RecordsFrom the Cascadia Subduction Zone and Northern San Andreas Fault Based on Precise Dating ofOffshore Turbidites,” Annual Review of Earth and Planetary Sciences, 31, 555–577.
HAGERTY, M. R. (2001): “Unreinforced Masonry Database,” Office of Planning and DevelopmentReview, City of Portland.
LOOK, D. W., T. WONG, AND S. R. AUGUSTUS (1997): “The Seismic Retrofit of Historic Buildings:Keeping Preservation in the Forefront,” Preservation Briefs, No. 41, National Parks Service.
MCCONACHIE, C. (2010): “Positive Signs Emerging,” Apartment Report, Metro Multifamily Hous-ing Association.
MEYER, G. (2006): “Earthquake Insurance Phased Out,” Kansas City Star, June 6.
MISSOURI EARTHQUAKE INSURANCE TASK FORCE (2008): “Final Report,” Missouri Departmentof Insurance, Financial Institutions & Professional Registration.
OREGON DEPARTMENT OF CONSUMER AND BUSINESS SERVICES (2009): “Earthquakes,” Insur-ance Tips, Insurance Division.
(2010): “Twenty Percent of Oregonians Insured for Earthquakes,” News release, InsuranceDivision.
REITHERMAN, R., AND S. C. PERRY (2009): “Unreinforced Masonry Buildings and Earthquakes:Developing Successful Risk Reduction Programs,” Publication No. P-774, Federal EmergencyManagement Agency.
ROJAS-BURKE, J. (2010): “Quake Study Asks When, Not If,” Oregonian, April 21.
TOBIAS, L. (2010): “Big Earthquake Coming Sooner Than We Thought, Oregon Geologist Says,”Oregonian, April 19.
TREASTER, J. B. (1999): “Why Insurers Shrink From Earthquake Risk,” New York Times, Novem-ber 21.
7
OFFICE MARKET ANALYSIS
Greg LeBlanc
Portland State University
With the conclusion of the second quarter of 2010 the office market continues to struggleunder the weight of the current recession. Overall, vacancy rates have increased and rentscontinue to decline. Current office vacancy, according to the major local brokerage firms,ranges from 15.5 percent to 19.5 percent within the metropolitan area. Recent data revealsthe office market is showing signs of bottoming out, but the pace of improvement has slowedfrom the previous quarter and increasing vacancy, primarily within the suburbs, continuesto be concern.
Recently, the U.S. Commerce Department issued revised gross domestic product (GDP)numbers indicating the recession was worse than previously thought over the last threeyears. The Wall Street Journal recently reported:12
[T]he overall depth of the latest recession surpassed that of any other downturn since thelate 1940s. GDP fell by 4.1 percent from the fourth quarter of 2007, when the recessionofficially began, to the second quarter of 2009, when many economists believe it ended. . . the previous estimate for peak-to-trough decline was 3.7 percent.
Despite the gloomy GDP report, there were some positive signs, namely the increase incorporate profits. However, it appears that a good portion of the increase in corporate profitscan be attributed to belt tightening and not large increases in revenue. In general, higher
12Murray, Sara, “Revisions Show Slower Recovery, Deeper Recession,” Wall Street Journal, August 1, 2010.
Center for Real Estate Quarterly Journal, vol. 4, no. 3. Summer 2010Copyright c© 2010 Portland State University
45
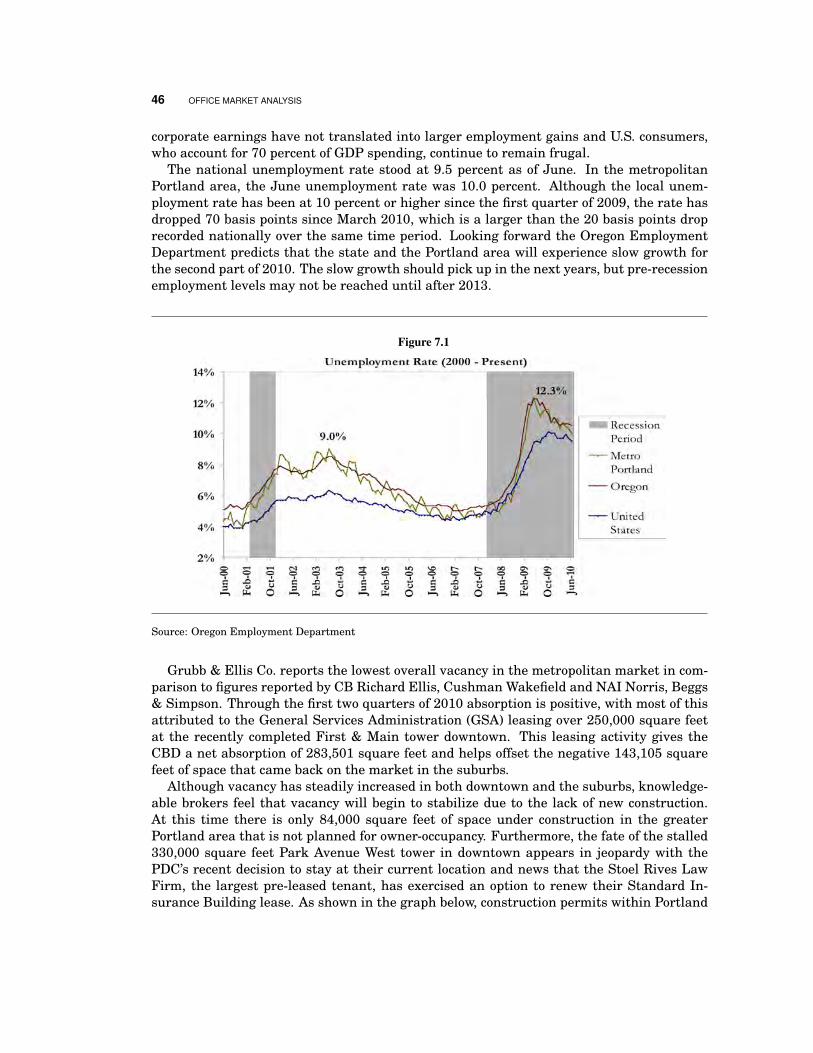
46 OFFICE MARKET ANALYSIS
corporate earnings have not translated into larger employment gains and U.S. consumers,who account for 70 percent of GDP spending, continue to remain frugal.
The national unemployment rate stood at 9.5 percent as of June. In the metropolitanPortland area, the June unemployment rate was 10.0 percent. Although the local unem-ployment rate has been at 10 percent or higher since the first quarter of 2009, the rate hasdropped 70 basis points since March 2010, which is a larger than the 20 basis points droprecorded nationally over the same time period. Looking forward the Oregon EmploymentDepartment predicts that the state and the Portland area will experience slow growth forthe second part of 2010. The slow growth should pick up in the next years, but pre-recessionemployment levels may not be reached until after 2013.
Figure 7.1
Source: Oregon Employment Department
Grubb & Ellis Co. reports the lowest overall vacancy in the metropolitan market in com-parison to figures reported by CB Richard Ellis, Cushman Wakefield and NAI Norris, Beggs& Simpson. Through the first two quarters of 2010 absorption is positive, with most of thisattributed to the General Services Administration (GSA) leasing over 250,000 square feetat the recently completed First & Main tower downtown. This leasing activity gives theCBD a net absorption of 283,501 square feet and helps offset the negative 143,105 squarefeet of space that came back on the market in the suburbs.
Although vacancy has steadily increased in both downtown and the suburbs, knowledge-able brokers feel that vacancy will begin to stabilize due to the lack of new construction.At this time there is only 84,000 square feet of space under construction in the greaterPortland area that is not planned for owner-occupancy. Furthermore, the fate of the stalled330,000 square feet Park Avenue West tower in downtown appears in jeopardy with thePDC’s recent decision to stay at their current location and news that the Stoel Rives LawFirm, the largest pre-leased tenant, has exercised an option to renew their Standard In-surance Building lease. As shown in the graph below, construction permits within Portland
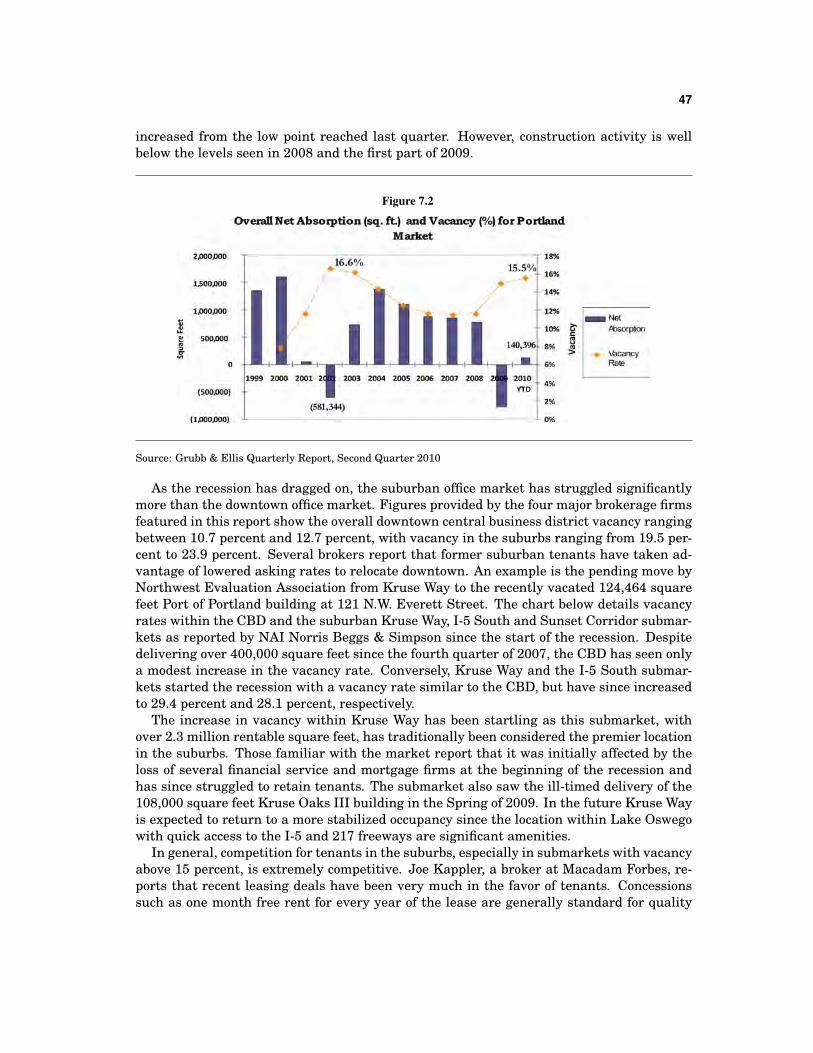
47
increased from the low point reached last quarter. However, construction activity is wellbelow the levels seen in 2008 and the first part of 2009.
Figure 7.2
Source: Grubb & Ellis Quarterly Report, Second Quarter 2010
As the recession has dragged on, the suburban office market has struggled significantlymore than the downtown office market. Figures provided by the four major brokerage firmsfeatured in this report show the overall downtown central business district vacancy rangingbetween 10.7 percent and 12.7 percent, with vacancy in the suburbs ranging from 19.5 per-cent to 23.9 percent. Several brokers report that former suburban tenants have taken ad-vantage of lowered asking rates to relocate downtown. An example is the pending move byNorthwest Evaluation Association from Kruse Way to the recently vacated 124,464 squarefeet Port of Portland building at 121 N.W. Everett Street. The chart below details vacancyrates within the CBD and the suburban Kruse Way, I-5 South and Sunset Corridor submar-kets as reported by NAI Norris Beggs & Simpson since the start of the recession. Despitedelivering over 400,000 square feet since the fourth quarter of 2007, the CBD has seen onlya modest increase in the vacancy rate. Conversely, Kruse Way and the I-5 South submar-kets started the recession with a vacancy rate similar to the CBD, but have since increasedto 29.4 percent and 28.1 percent, respectively.
The increase in vacancy within Kruse Way has been startling as this submarket, withover 2.3 million rentable square feet, has traditionally been considered the premier locationin the suburbs. Those familiar with the market report that it was initially affected by theloss of several financial service and mortgage firms at the beginning of the recession andhas since struggled to retain tenants. The submarket also saw the ill-timed delivery of the108,000 square feet Kruse Oaks III building in the Spring of 2009. In the future Kruse Wayis expected to return to a more stabilized occupancy since the location within Lake Oswegowith quick access to the I-5 and 217 freeways are significant amenities.
In general, competition for tenants in the suburbs, especially in submarkets with vacancyabove 15 percent, is extremely competitive. Joe Kappler, a broker at Macadam Forbes, re-ports that recent leasing deals have been very much in the favor of tenants. Concessionssuch as one month free rent for every year of the lease are generally standard for quality
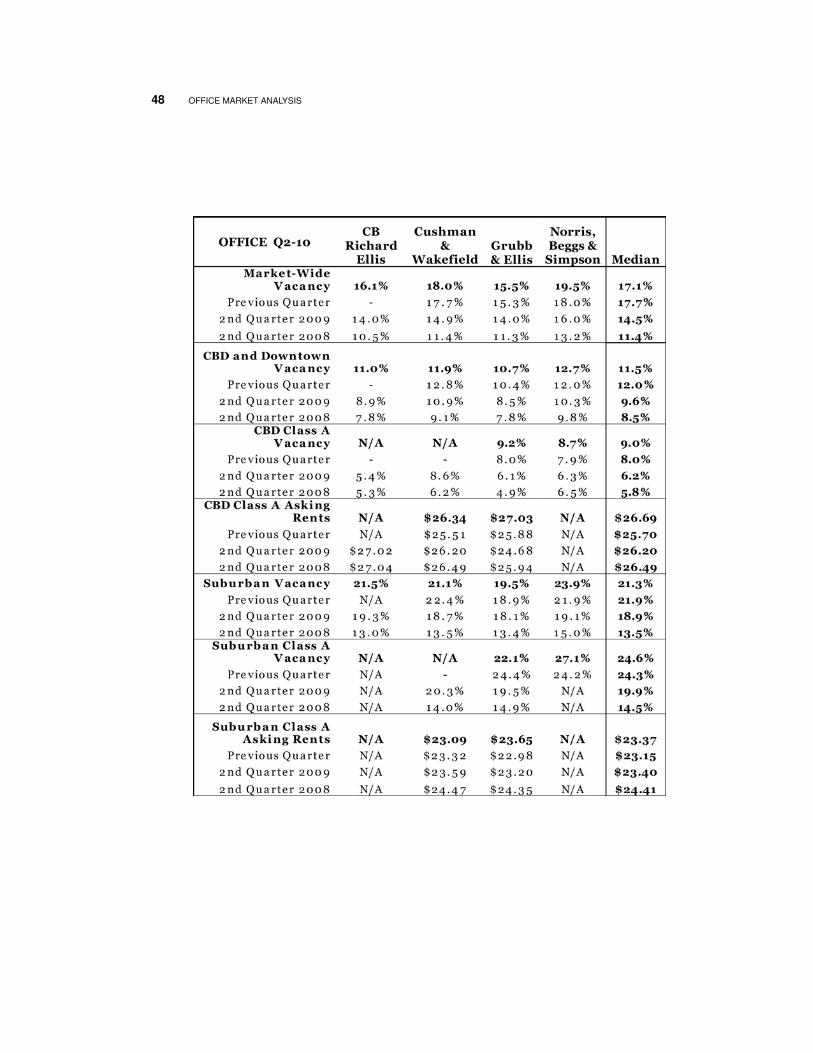
48 OFFICE MARKET ANALYSIS
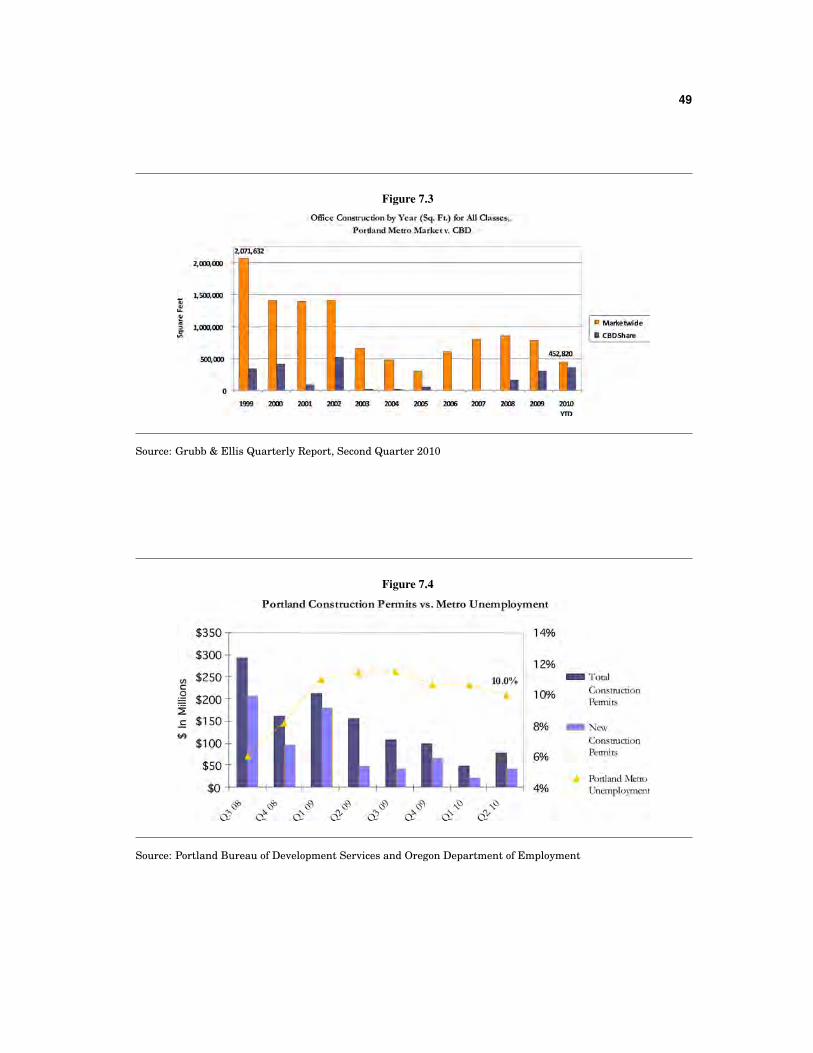
49
Figure 7.3
Source: Grubb & Ellis Quarterly Report, Second Quarter 2010
Figure 7.4
Source: Portland Bureau of Development Services and Oregon Department of Employment
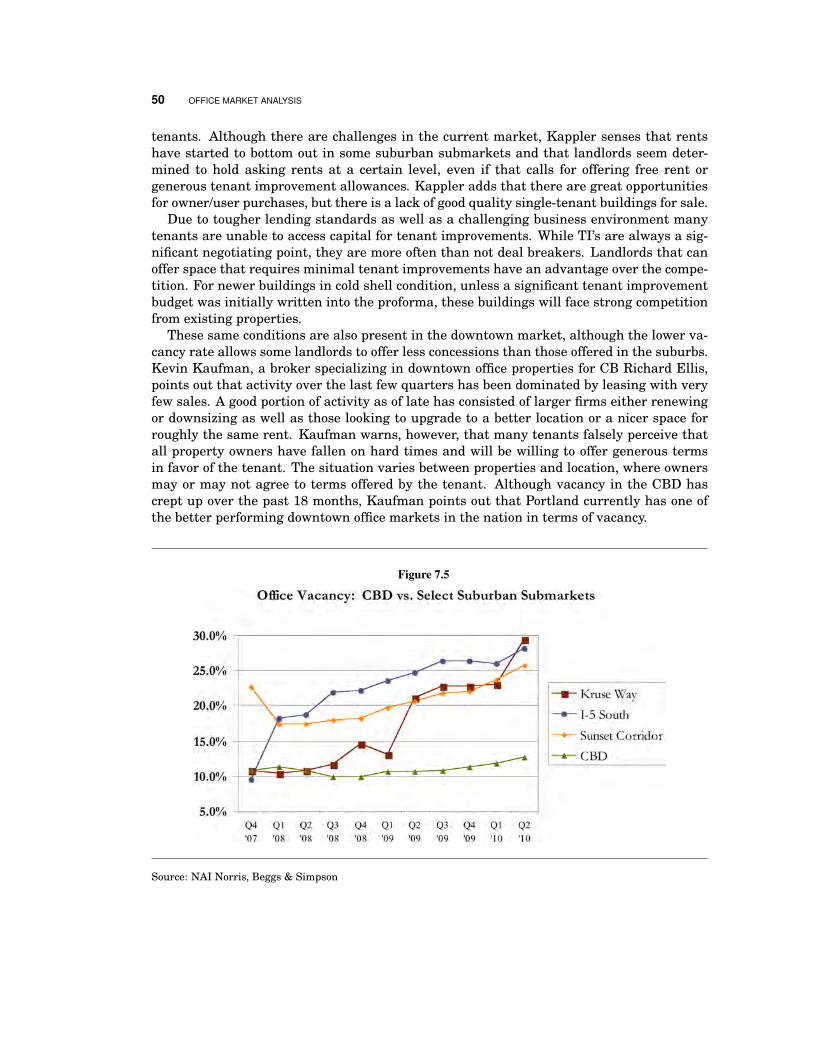
50 OFFICE MARKET ANALYSIS
tenants. Although there are challenges in the current market, Kappler senses that rentshave started to bottom out in some suburban submarkets and that landlords seem deter-mined to hold asking rents at a certain level, even if that calls for offering free rent orgenerous tenant improvement allowances. Kappler adds that there are great opportunitiesfor owner/user purchases, but there is a lack of good quality single-tenant buildings for sale.
Due to tougher lending standards as well as a challenging business environment manytenants are unable to access capital for tenant improvements. While TI’s are always a sig-nificant negotiating point, they are more often than not deal breakers. Landlords that canoffer space that requires minimal tenant improvements have an advantage over the compe-tition. For newer buildings in cold shell condition, unless a significant tenant improvementbudget was initially written into the proforma, these buildings will face strong competitionfrom existing properties.
These same conditions are also present in the downtown market, although the lower va-cancy rate allows some landlords to offer less concessions than those offered in the suburbs.Kevin Kaufman, a broker specializing in downtown office properties for CB Richard Ellis,points out that activity over the last few quarters has been dominated by leasing with veryfew sales. A good portion of activity as of late has consisted of larger firms either renewingor downsizing as well as those looking to upgrade to a better location or a nicer space forroughly the same rent. Kaufman warns, however, that many tenants falsely perceive thatall property owners have fallen on hard times and will be willing to offer generous termsin favor of the tenant. The situation varies between properties and location, where ownersmay or may not agree to terms offered by the tenant. Although vacancy in the CBD hascrept up over the past 18 months, Kaufman points out that Portland currently has one ofthe better performing downtown office markets in the nation in terms of vacancy.
Figure 7.5
Source: NAI Norris, Beggs & Simpson
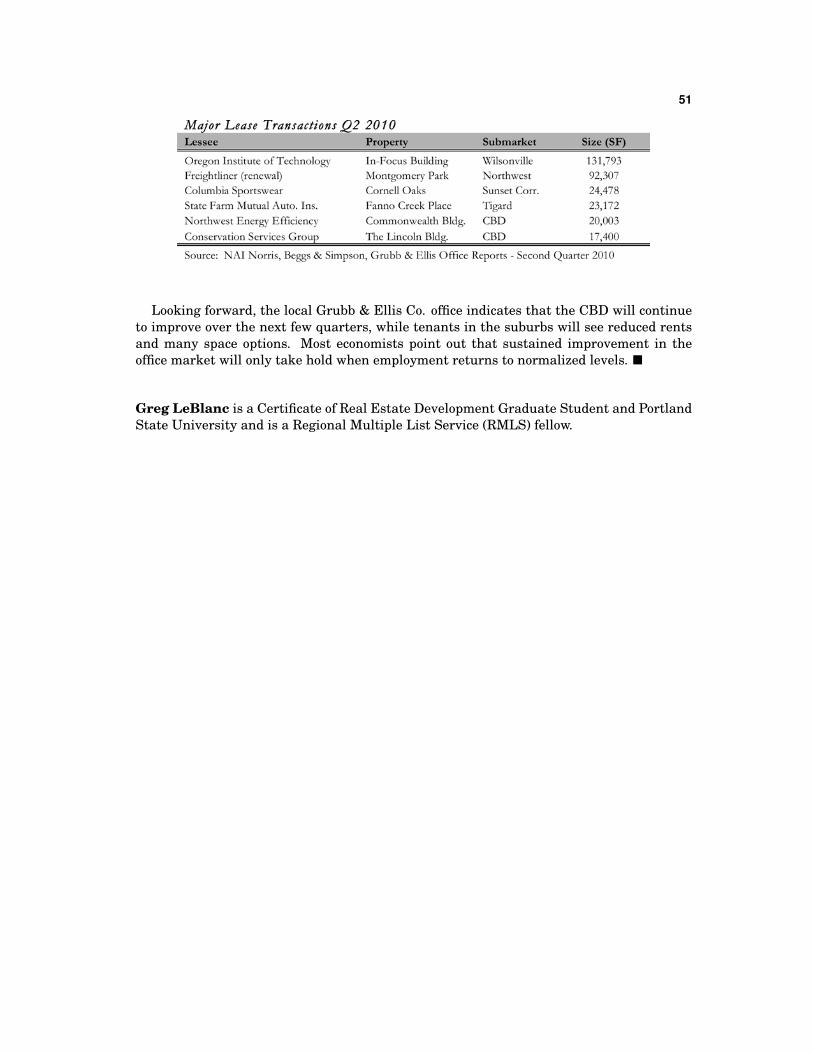
51
Looking forward, the local Grubb & Ellis Co. office indicates that the CBD will continueto improve over the next few quarters, while tenants in the suburbs will see reduced rentsand many space options. Most economists point out that sustained improvement in theoffice market will only take hold when employment returns to normalized levels. �
Greg LeBlanc is a Certificate of Real Estate Development Graduate Student and PortlandState University and is a Regional Multiple List Service (RMLS) fellow.

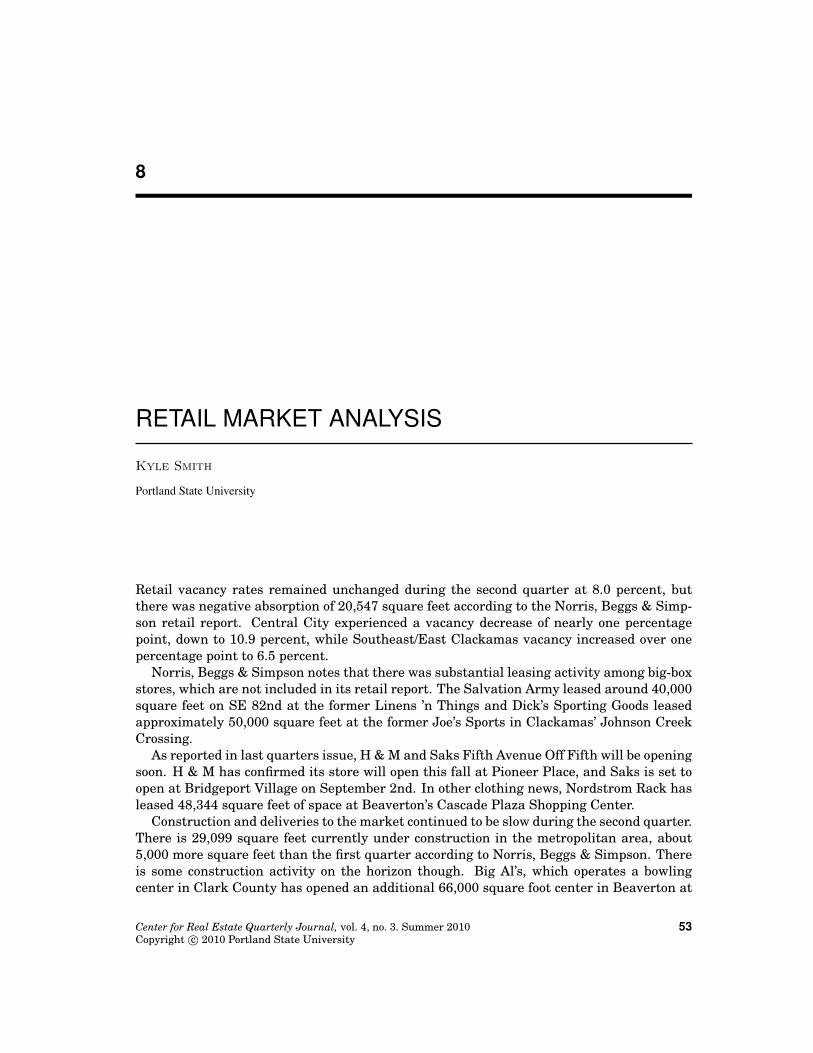
8
RETAIL MARKET ANALYSIS
Kyle Smith
Portland State University
Retail vacancy rates remained unchanged during the second quarter at 8.0 percent, butthere was negative absorption of 20,547 square feet according to the Norris, Beggs & Simp-son retail report. Central City experienced a vacancy decrease of nearly one percentagepoint, down to 10.9 percent, while Southeast/East Clackamas vacancy increased over onepercentage point to 6.5 percent.
Norris, Beggs & Simpson notes that there was substantial leasing activity among big-boxstores, which are not included in its retail report. The Salvation Army leased around 40,000square feet on SE 82nd at the former Linens ’n Things and Dick’s Sporting Goods leasedapproximately 50,000 square feet at the former Joe’s Sports in Clackamas’ Johnson CreekCrossing.
As reported in last quarters issue, H & M and Saks Fifth Avenue Off Fifth will be openingsoon. H & M has confirmed its store will open this fall at Pioneer Place, and Saks is set toopen at Bridgeport Village on September 2nd. In other clothing news, Nordstrom Rack hasleased 48,344 square feet of space at Beaverton’s Cascade Plaza Shopping Center.
Construction and deliveries to the market continued to be slow during the second quarter.There is 29,099 square feet currently under construction in the metropolitan area, about5,000 more square feet than the first quarter according to Norris, Beggs & Simpson. Thereis some construction activity on the horizon though. Big Al’s, which operates a bowlingcenter in Clark County has opened an additional 66,000 square foot center in Beaverton at
Center for Real Estate Quarterly Journal, vol. 4, no. 3. Summer 2010Copyright c© 2010 Portland State University
53
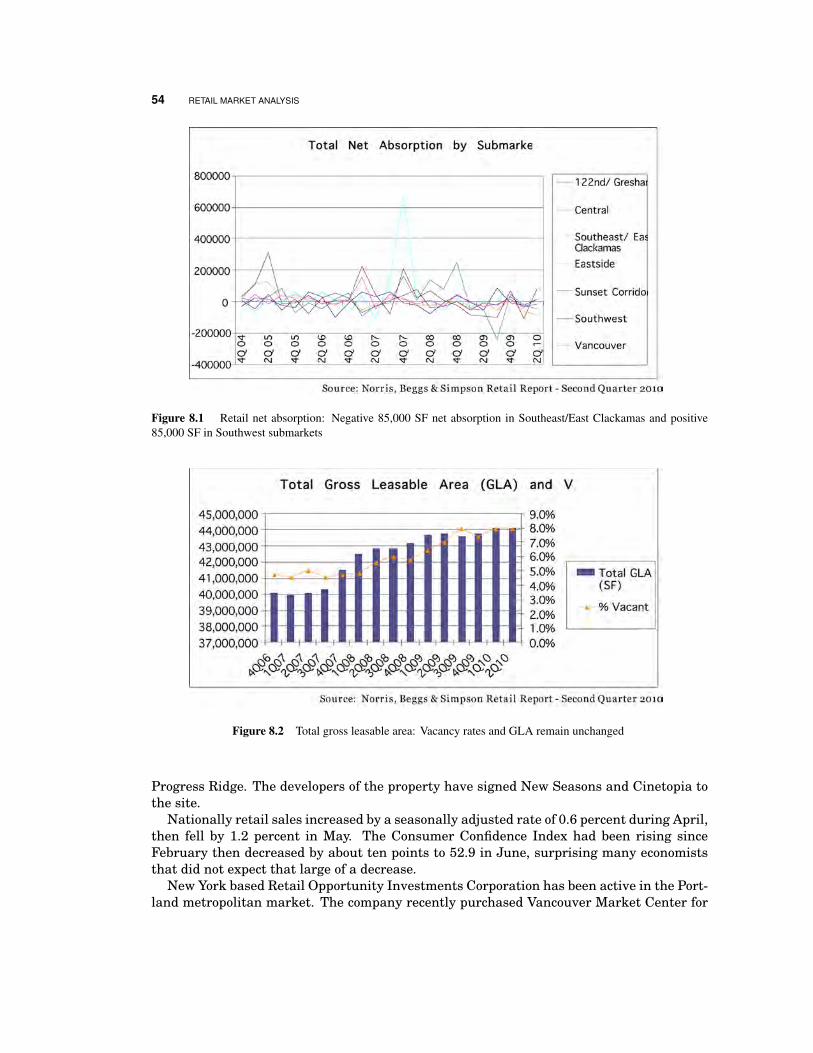
54 RETAIL MARKET ANALYSIS
Figure 8.1 Retail net absorption: Negative 85,000 SF net absorption in Southeast/East Clackamas and positive85,000 SF in Southwest submarkets
Figure 8.2 Total gross leasable area: Vacancy rates and GLA remain unchanged
Progress Ridge. The developers of the property have signed New Seasons and Cinetopia tothe site.
Nationally retail sales increased by a seasonally adjusted rate of 0.6 percent during April,then fell by 1.2 percent in May. The Consumer Confidence Index had been rising sinceFebruary then decreased by about ten points to 52.9 in June, surprising many economiststhat did not expect that large of a decrease.
New York based Retail Opportunity Investments Corporation has been active in the Port-land metropolitan market. The company recently purchased Vancouver Market Center for
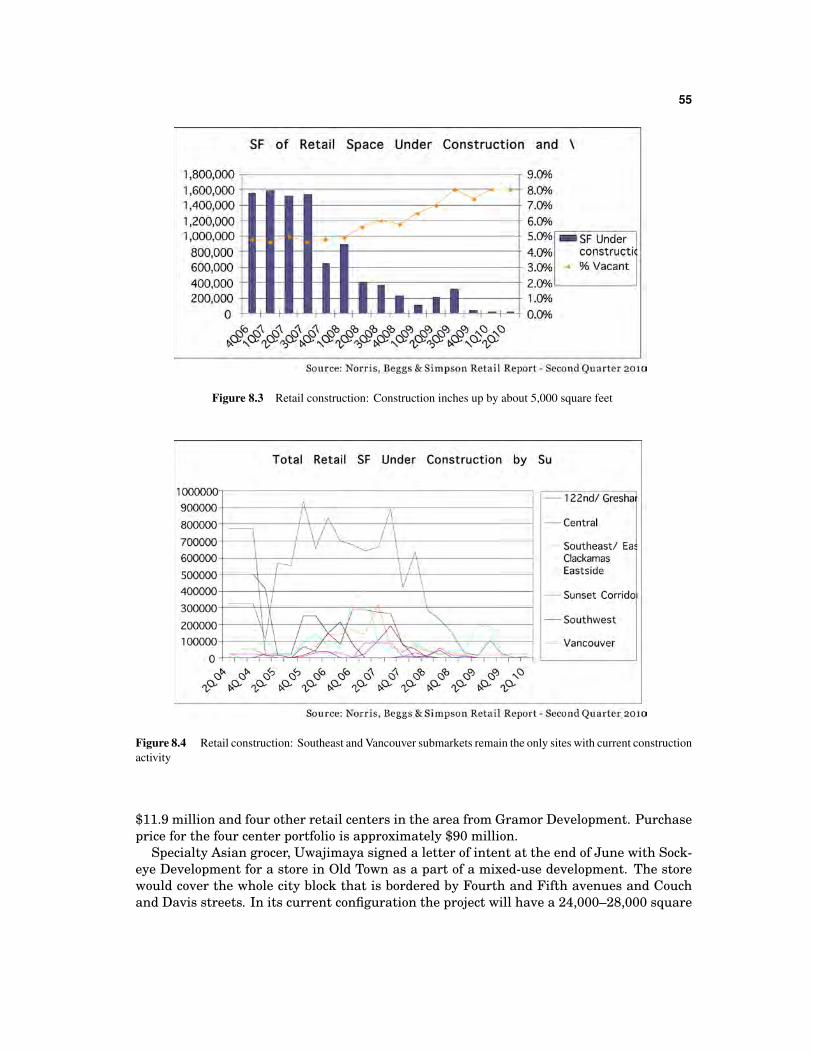
55
Figure 8.3 Retail construction: Construction inches up by about 5,000 square feet
Figure 8.4 Retail construction: Southeast and Vancouver submarkets remain the only sites with current constructionactivity
$11.9 million and four other retail centers in the area from Gramor Development. Purchaseprice for the four center portfolio is approximately $90 million.
Specialty Asian grocer, Uwajimaya signed a letter of intent at the end of June with Sock-eye Development for a store in Old Town as a part of a mixed-use development. The storewould cover the whole city block that is bordered by Fourth and Fifth avenues and Couchand Davis streets. In its current configuration the project will have a 24,000–28,000 square
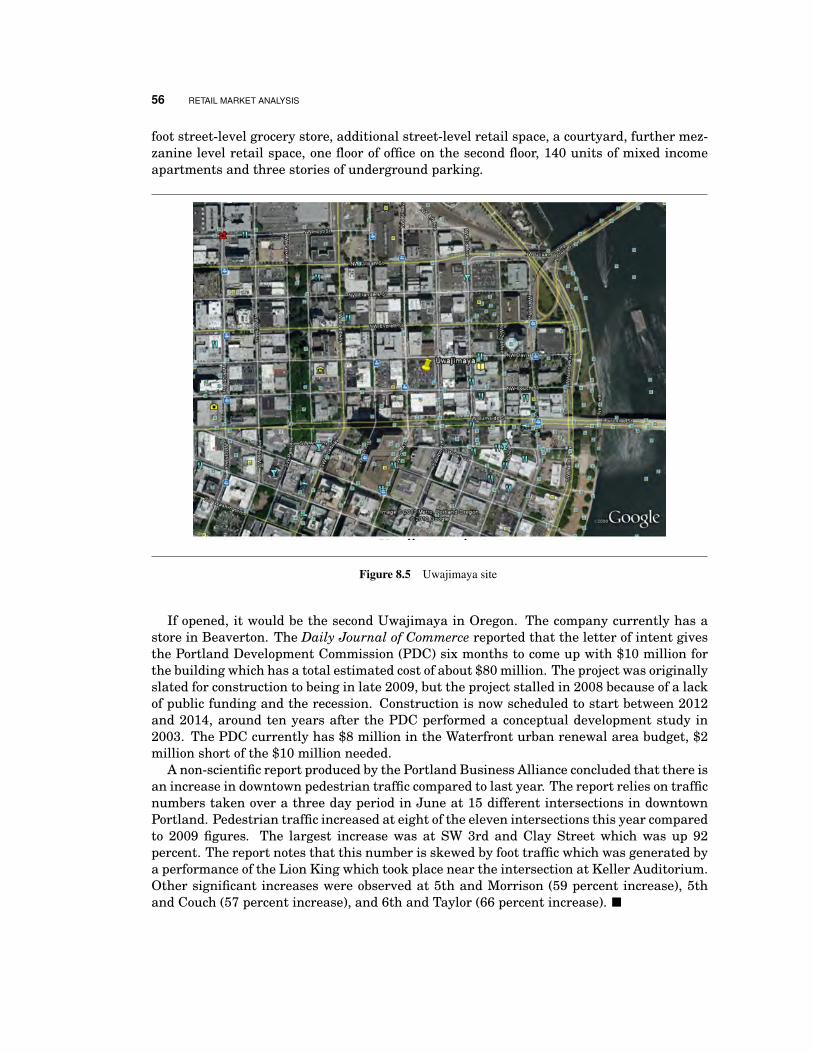
56 RETAIL MARKET ANALYSIS
foot street-level grocery store, additional street-level retail space, a courtyard, further mez-zanine level retail space, one floor of office on the second floor, 140 units of mixed incomeapartments and three stories of underground parking.
Figure 8.5 Uwajimaya site
If opened, it would be the second Uwajimaya in Oregon. The company currently has astore in Beaverton. The Daily Journal of Commerce reported that the letter of intent givesthe Portland Development Commission (PDC) six months to come up with $10 million forthe building which has a total estimated cost of about $80 million. The project was originallyslated for construction to being in late 2009, but the project stalled in 2008 because of a lackof public funding and the recession. Construction is now scheduled to start between 2012and 2014, around ten years after the PDC performed a conceptual development study in2003. The PDC currently has $8 million in the Waterfront urban renewal area budget, $2million short of the $10 million needed.
A non-scientific report produced by the Portland Business Alliance concluded that there isan increase in downtown pedestrian traffic compared to last year. The report relies on trafficnumbers taken over a three day period in June at 15 different intersections in downtownPortland. Pedestrian traffic increased at eight of the eleven intersections this year comparedto 2009 figures. The largest increase was at SW 3rd and Clay Street which was up 92percent. The report notes that this number is skewed by foot traffic which was generated bya performance of the Lion King which took place near the intersection at Keller Auditorium.Other significant increases were observed at 5th and Morrison (59 percent increase), 5thand Couch (57 percent increase), and 6th and Taylor (66 percent increase). �

57
Kyle Smith is a Certificate of Real Estate Development Graduate Student and PortlandState University and is the Regional Multiple List Service (RMLS) fellow.

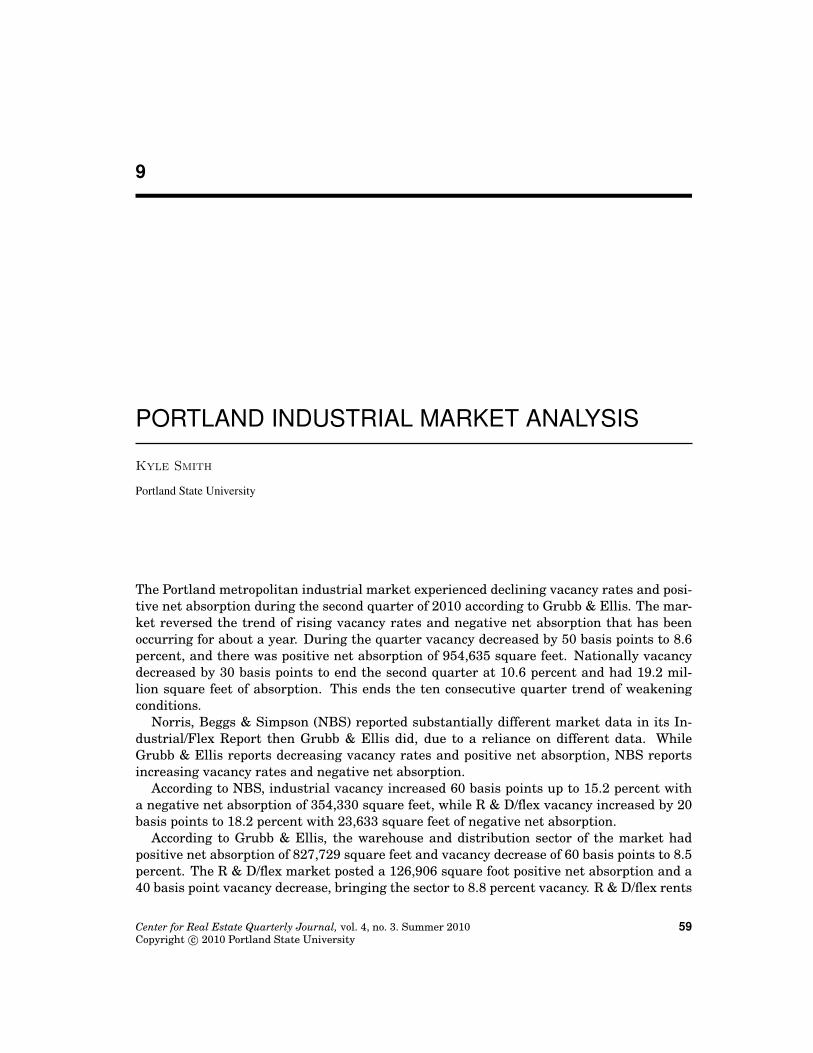
9
PORTLAND INDUSTRIAL MARKET ANALYSIS
Kyle Smith
Portland State University
The Portland metropolitan industrial market experienced declining vacancy rates and posi-tive net absorption during the second quarter of 2010 according to Grubb & Ellis. The mar-ket reversed the trend of rising vacancy rates and negative net absorption that has beenoccurring for about a year. During the quarter vacancy decreased by 50 basis points to 8.6percent, and there was positive net absorption of 954,635 square feet. Nationally vacancydecreased by 30 basis points to end the second quarter at 10.6 percent and had 19.2 mil-lion square feet of absorption. This ends the ten consecutive quarter trend of weakeningconditions.
Norris, Beggs & Simpson (NBS) reported substantially different market data in its In-dustrial/Flex Report then Grubb & Ellis did, due to a reliance on different data. WhileGrubb & Ellis reports decreasing vacancy rates and positive net absorption, NBS reportsincreasing vacancy rates and negative net absorption.
According to NBS, industrial vacancy increased 60 basis points up to 15.2 percent witha negative net absorption of 354,330 square feet, while R & D/flex vacancy increased by 20basis points to 18.2 percent with 23,633 square feet of negative net absorption.
According to Grubb & Ellis, the warehouse and distribution sector of the market hadpositive net absorption of 827,729 square feet and vacancy decrease of 60 basis points to 8.5percent. The R & D/flex market posted a 126,906 square foot positive net absorption and a40 basis point vacancy decrease, bringing the sector to 8.8 percent vacancy. R & D/flex rents
Center for Real Estate Quarterly Journal, vol. 4, no. 3. Summer 2010Copyright c© 2010 Portland State University
59
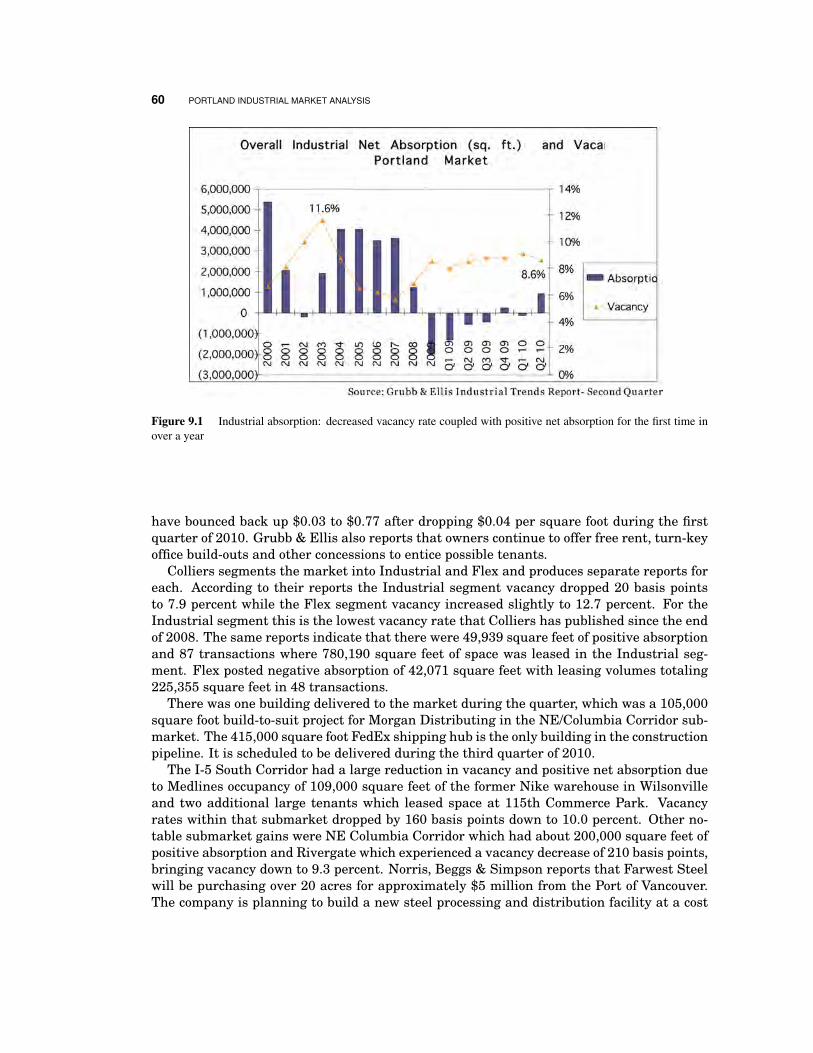
60 PORTLAND INDUSTRIAL MARKET ANALYSIS
Figure 9.1 Industrial absorption: decreased vacancy rate coupled with positive net absorption for the first time inover a year
have bounced back up $0.03 to $0.77 after dropping $0.04 per square foot during the firstquarter of 2010. Grubb & Ellis also reports that owners continue to offer free rent, turn-keyoffice build-outs and other concessions to entice possible tenants.
Colliers segments the market into Industrial and Flex and produces separate reports foreach. According to their reports the Industrial segment vacancy dropped 20 basis pointsto 7.9 percent while the Flex segment vacancy increased slightly to 12.7 percent. For theIndustrial segment this is the lowest vacancy rate that Colliers has published since the endof 2008. The same reports indicate that there were 49,939 square feet of positive absorptionand 87 transactions where 780,190 square feet of space was leased in the Industrial seg-ment. Flex posted negative absorption of 42,071 square feet with leasing volumes totaling225,355 square feet in 48 transactions.
There was one building delivered to the market during the quarter, which was a 105,000square foot build-to-suit project for Morgan Distributing in the NE/Columbia Corridor sub-market. The 415,000 square foot FedEx shipping hub is the only building in the constructionpipeline. It is scheduled to be delivered during the third quarter of 2010.
The I-5 South Corridor had a large reduction in vacancy and positive net absorption dueto Medlines occupancy of 109,000 square feet of the former Nike warehouse in Wilsonvilleand two additional large tenants which leased space at 115th Commerce Park. Vacancyrates within that submarket dropped by 160 basis points down to 10.0 percent. Other no-table submarket gains were NE Columbia Corridor which had about 200,000 square feet ofpositive absorption and Rivergate which experienced a vacancy decrease of 210 basis points,bringing vacancy down to 9.3 percent. Norris, Beggs & Simpson reports that Farwest Steelwill be purchasing over 20 acres for approximately $5 million from the Port of Vancouver.The company is planning to build a new steel processing and distribution facility at a cost
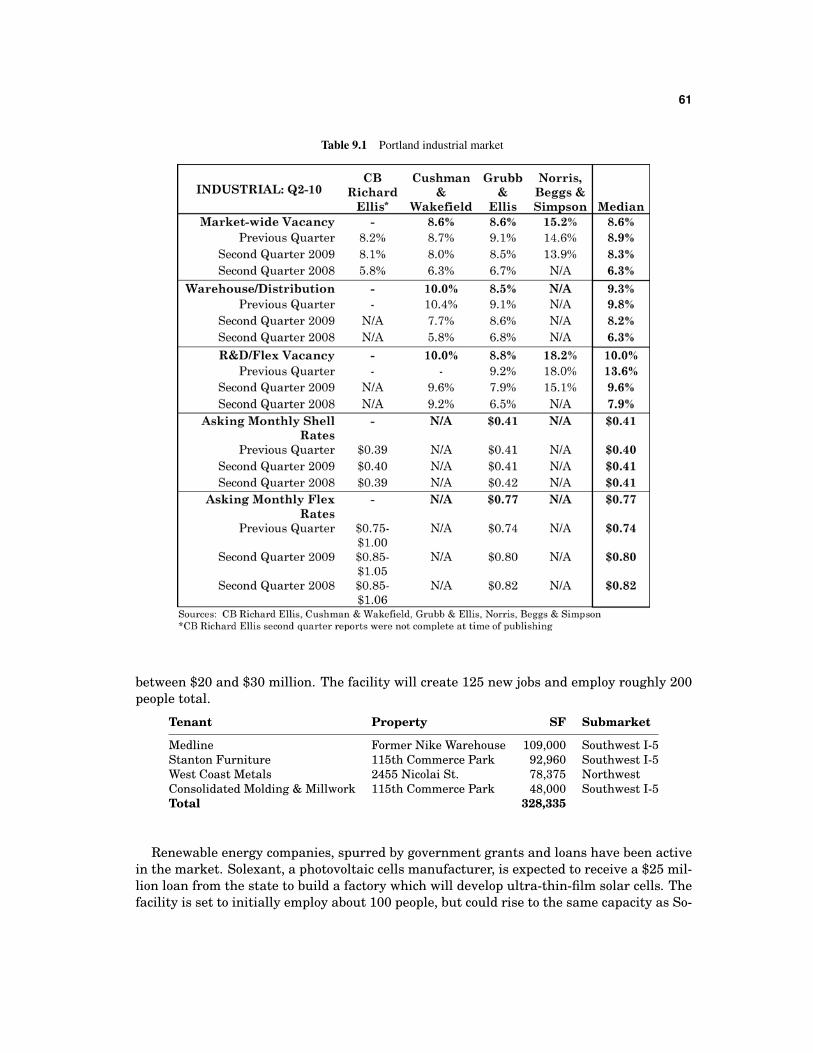
61
Table 9.1 Portland industrial market
between $20 and $30 million. The facility will create 125 new jobs and employ roughly 200people total.
Tenant Property SF Submarket
Medline Former Nike Warehouse 109,000 Southwest I-5Stanton Furniture 115th Commerce Park 92,960 Southwest I-5West Coast Metals 2455 Nicolai St. 78,375 NorthwestConsolidated Molding & Millwork 115th Commerce Park 48,000 Southwest I-5Total 328,335
Renewable energy companies, spurred by government grants and loans have been activein the market. Solexant, a photovoltaic cells manufacturer, is expected to receive a $25 mil-lion loan from the state to build a factory which will develop ultra-thin-film solar cells. Thefacility is set to initially employ about 100 people, but could rise to the same capacity as So-
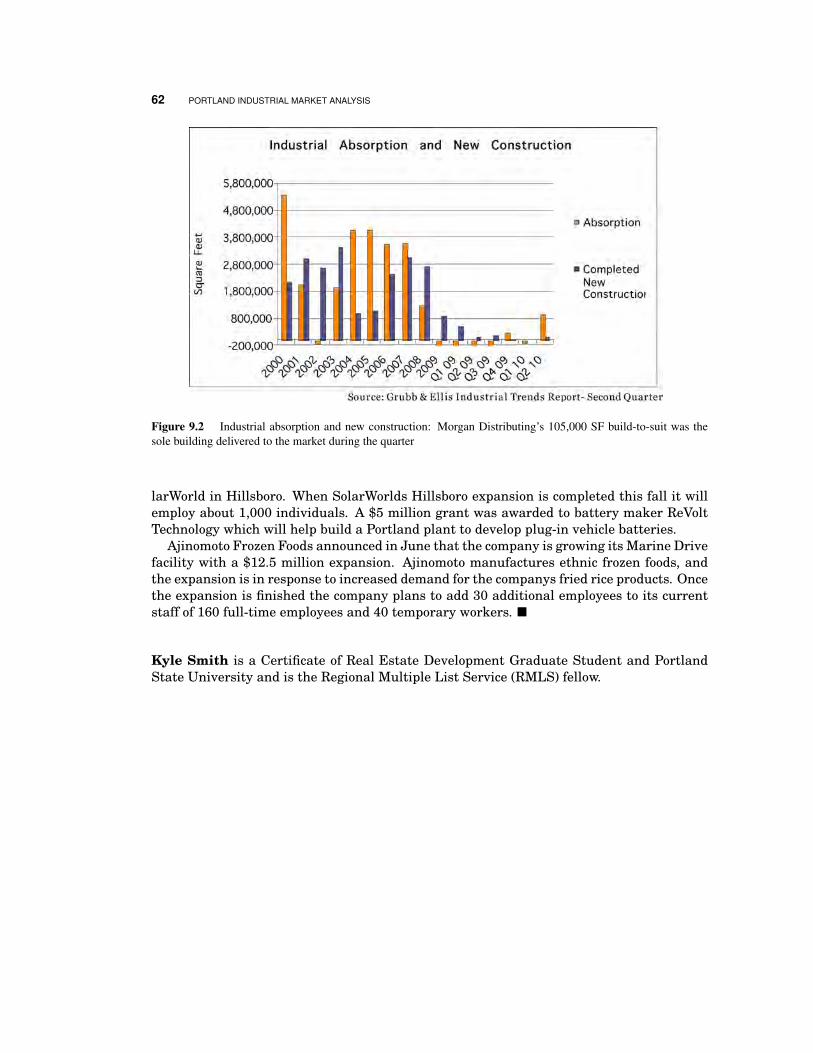
62 PORTLAND INDUSTRIAL MARKET ANALYSIS
Figure 9.2 Industrial absorption and new construction: Morgan Distributing’s 105,000 SF build-to-suit was thesole building delivered to the market during the quarter
larWorld in Hillsboro. When SolarWorlds Hillsboro expansion is completed this fall it willemploy about 1,000 individuals. A $5 million grant was awarded to battery maker ReVoltTechnology which will help build a Portland plant to develop plug-in vehicle batteries.
Ajinomoto Frozen Foods announced in June that the company is growing its Marine Drivefacility with a $12.5 million expansion. Ajinomoto manufactures ethnic frozen foods, andthe expansion is in response to increased demand for the companys fried rice products. Oncethe expansion is finished the company plans to add 30 additional employees to its currentstaff of 160 full-time employees and 40 temporary workers. �
Kyle Smith is a Certificate of Real Estate Development Graduate Student and PortlandState University and is the Regional Multiple List Service (RMLS) fellow.
10
MULTIFAMILY MARKET ANALYSIS
Greg LeBlanc
Portland State University
Through the first half of 2010 the local multifamily market has improved. According tothe Spring 2010 survey by the Metropolitan Multifamily Housing Association (MMFHA),vacancy dropped to 5.1 percent in the metropolitan Portland market, down from 5.9 per-cent in the fall 2009. Similar results are seen in a more recent survey completed by Norris& Stevens, a local brokerage firm specializing in multifamily. The summer 2010 Norris &Stevens survey showed that the Portland area vacancy rate dropped to 5.75 percent, down1.14 percent from the last survey in the fall of 2009. At this time many owners and man-agers are reporting improved conditions within the market and have scaled back the use ofconcessions and started to introduce modest rent increases in some cases. The encourag-ing signs seem to have indicated that the worst conditions in the multifamily market havepassed and investment interest in the market is picking up as illustrated by several largesales in the last two months. Whether or not this growth can be sustained in the face ofhigh unemployment and continued turmoil within investment markets remains to be seen.
The drop in the local vacancy rate reflects similar conditions in the national apartmentmarket. Data released by Reis Inc., a New York real estate research firm, showed that thenational multifamily vacancy rate stood at 7.8 percent at the end of June. The Wall StreetJournal reports this was a modest decrease from the 8 percent vacancy reported in the firstquarter of 2010, which was the highest national vacancy rate in 30 years.
Center for Real Estate Quarterly Journal, vol. 4, no. 3. Summer 2010Copyright c© 2010 Portland State University
63

64 MULTIFAMILY MARKET ANALYSIS
Figure 10.1 Multifamily vacancy, Portland metro
The recent Norris & Stevens survey shows asking rents for older two-bedroom/one-bathunits to be flat since 2008 (see graph below). Asking rents for newer two-bedroom/two-bath units have increased slightly over this time period, going from $897 per month to$920 per month in 2010. This survey, however, only pertains to asking rents and does notmake an adjustment for rent concessions, which were prevalent in the market last yearand still common today. As reported by Norris & Stevens in their Summer 2010 ApartmentInvestors Journal “Most submarkets are currently seeing some concessions, but rents seemto be holding steady, or increasing slightly. Downtown rents in new construction are pushingthe average gains up for newer units citywide, but most areas have seen at least smallincreases.”
Figure 10.2 Multifamily rents, average, Portland metro
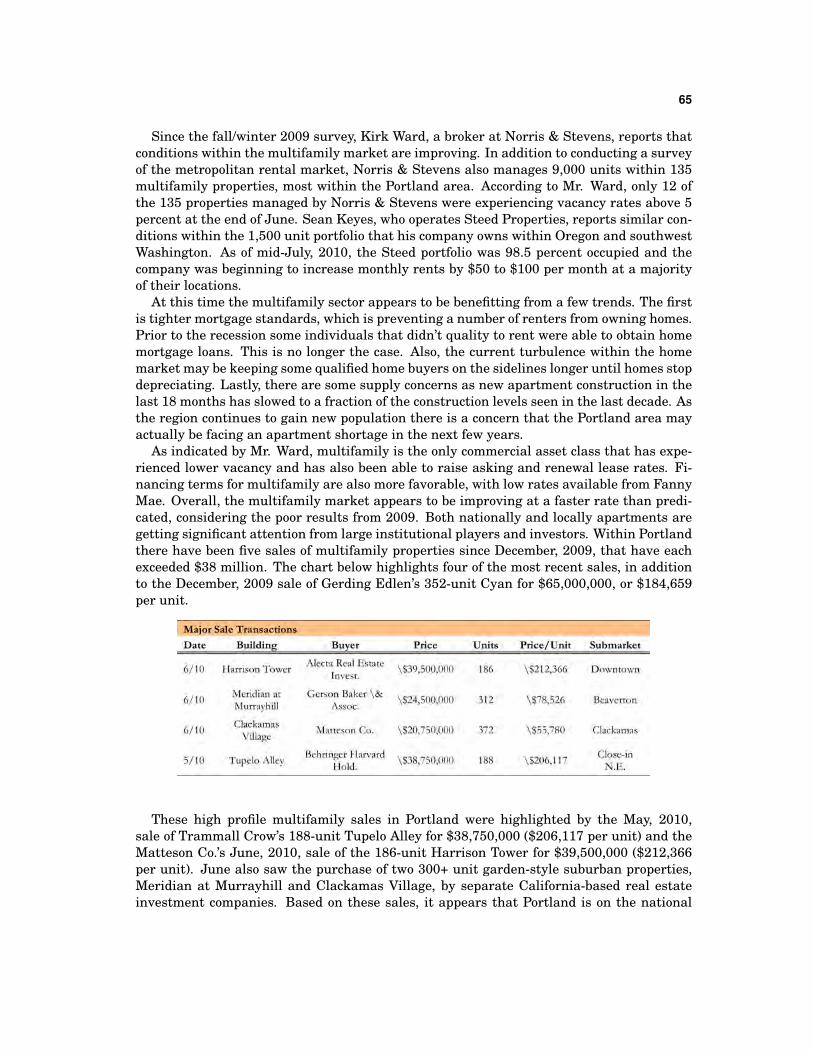
65
Since the fall/winter 2009 survey, Kirk Ward, a broker at Norris & Stevens, reports thatconditions within the multifamily market are improving. In addition to conducting a surveyof the metropolitan rental market, Norris & Stevens also manages 9,000 units within 135multifamily properties, most within the Portland area. According to Mr. Ward, only 12 ofthe 135 properties managed by Norris & Stevens were experiencing vacancy rates above 5percent at the end of June. Sean Keyes, who operates Steed Properties, reports similar con-ditions within the 1,500 unit portfolio that his company owns within Oregon and southwestWashington. As of mid-July, 2010, the Steed portfolio was 98.5 percent occupied and thecompany was beginning to increase monthly rents by $50 to $100 per month at a majorityof their locations.
At this time the multifamily sector appears to be benefitting from a few trends. The firstis tighter mortgage standards, which is preventing a number of renters from owning homes.Prior to the recession some individuals that didn’t quality to rent were able to obtain homemortgage loans. This is no longer the case. Also, the current turbulence within the homemarket may be keeping some qualified home buyers on the sidelines longer until homes stopdepreciating. Lastly, there are some supply concerns as new apartment construction in thelast 18 months has slowed to a fraction of the construction levels seen in the last decade. Asthe region continues to gain new population there is a concern that the Portland area mayactually be facing an apartment shortage in the next few years.
As indicated by Mr. Ward, multifamily is the only commercial asset class that has expe-rienced lower vacancy and has also been able to raise asking and renewal lease rates. Fi-nancing terms for multifamily are also more favorable, with low rates available from FannyMae. Overall, the multifamily market appears to be improving at a faster rate than predi-cated, considering the poor results from 2009. Both nationally and locally apartments aregetting significant attention from large institutional players and investors. Within Portlandthere have been five sales of multifamily properties since December, 2009, that have eachexceeded $38 million. The chart below highlights four of the most recent sales, in additionto the December, 2009 sale of Gerding Edlen’s 352-unit Cyan for $65,000,000, or $184,659per unit.
These high profile multifamily sales in Portland were highlighted by the May, 2010,sale of Trammall Crow’s 188-unit Tupelo Alley for $38,750,000 ($206,117 per unit) and theMatteson Co.’s June, 2010, sale of the 186-unit Harrison Tower for $39,500,000 ($212,366per unit). June also saw the purchase of two 300+ unit garden-style suburban properties,Meridian at Murrayhill and Clackamas Village, by separate California-based real estateinvestment companies. Based on these sales, it appears that Portland is on the national
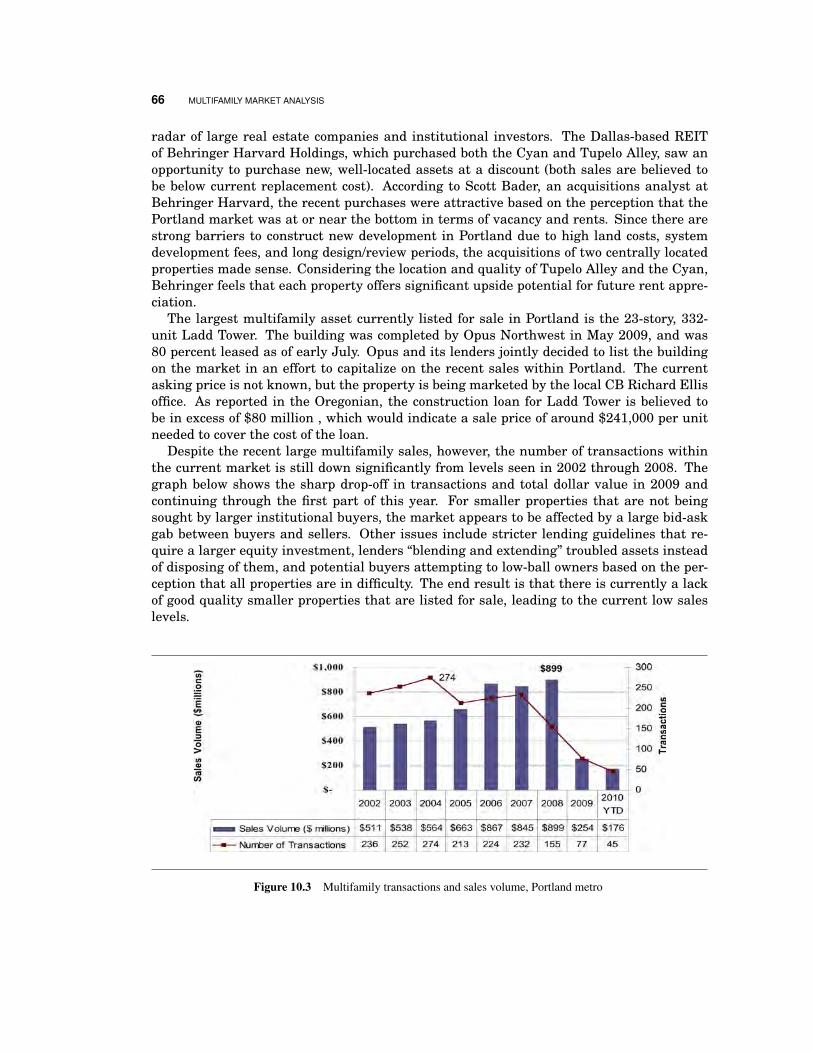
66 MULTIFAMILY MARKET ANALYSIS
radar of large real estate companies and institutional investors. The Dallas-based REITof Behringer Harvard Holdings, which purchased both the Cyan and Tupelo Alley, saw anopportunity to purchase new, well-located assets at a discount (both sales are believed tobe below current replacement cost). According to Scott Bader, an acquisitions analyst atBehringer Harvard, the recent purchases were attractive based on the perception that thePortland market was at or near the bottom in terms of vacancy and rents. Since there arestrong barriers to construct new development in Portland due to high land costs, systemdevelopment fees, and long design/review periods, the acquisitions of two centrally locatedproperties made sense. Considering the location and quality of Tupelo Alley and the Cyan,Behringer feels that each property offers significant upside potential for future rent appre-ciation.
The largest multifamily asset currently listed for sale in Portland is the 23-story, 332-unit Ladd Tower. The building was completed by Opus Northwest in May 2009, and was80 percent leased as of early July. Opus and its lenders jointly decided to list the buildingon the market in an effort to capitalize on the recent sales within Portland. The currentasking price is not known, but the property is being marketed by the local CB Richard Ellisoffice. As reported in the Oregonian, the construction loan for Ladd Tower is believed tobe in excess of $80 million , which would indicate a sale price of around $241,000 per unitneeded to cover the cost of the loan.
Despite the recent large multifamily sales, however, the number of transactions withinthe current market is still down significantly from levels seen in 2002 through 2008. Thegraph below shows the sharp drop-off in transactions and total dollar value in 2009 andcontinuing through the first part of this year. For smaller properties that are not beingsought by larger institutional buyers, the market appears to be affected by a large bid-askgab between buyers and sellers. Other issues include stricter lending guidelines that re-quire a larger equity investment, lenders “blending and extending” troubled assets insteadof disposing of them, and potential buyers attempting to low-ball owners based on the per-ception that all properties are in difficulty. The end result is that there is currently a lackof good quality smaller properties that are listed for sale, leading to the current low saleslevels.
Figure 10.3 Multifamily transactions and sales volume, Portland metro
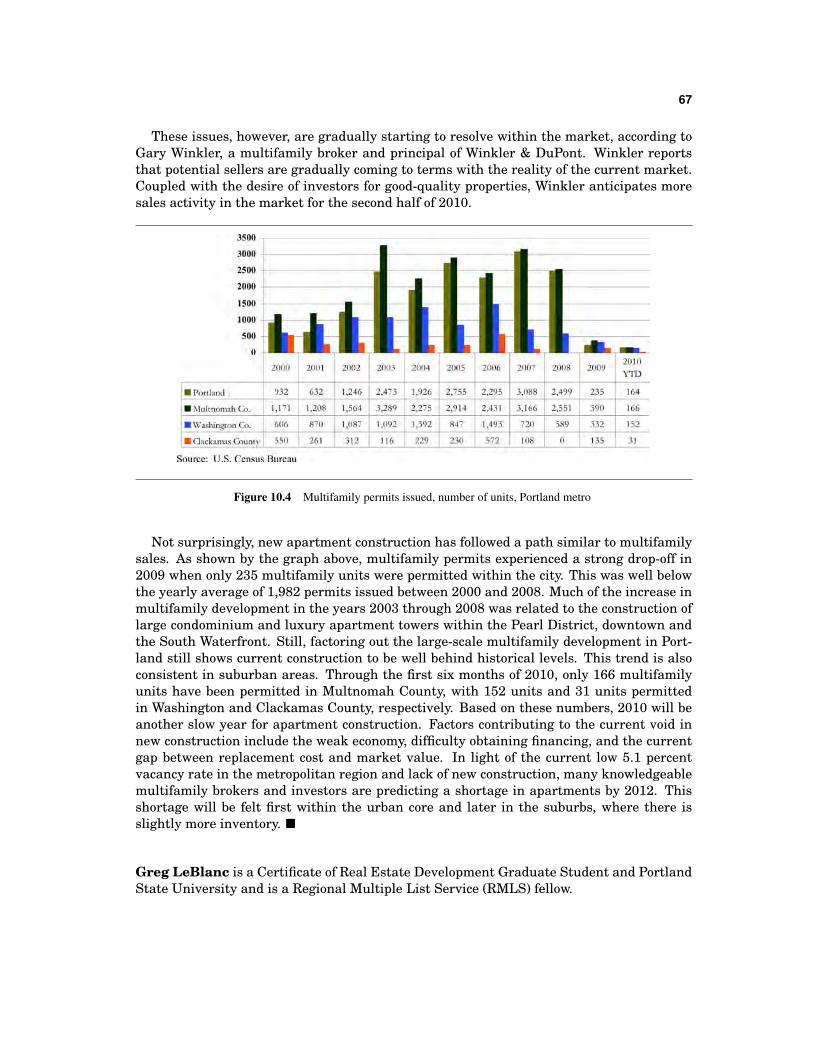
67
These issues, however, are gradually starting to resolve within the market, according toGary Winkler, a multifamily broker and principal of Winkler & DuPont. Winkler reportsthat potential sellers are gradually coming to terms with the reality of the current market.Coupled with the desire of investors for good-quality properties, Winkler anticipates moresales activity in the market for the second half of 2010.
Figure 10.4 Multifamily permits issued, number of units, Portland metro
Not surprisingly, new apartment construction has followed a path similar to multifamilysales. As shown by the graph above, multifamily permits experienced a strong drop-off in2009 when only 235 multifamily units were permitted within the city. This was well belowthe yearly average of 1,982 permits issued between 2000 and 2008. Much of the increase inmultifamily development in the years 2003 through 2008 was related to the construction oflarge condominium and luxury apartment towers within the Pearl District, downtown andthe South Waterfront. Still, factoring out the large-scale multifamily development in Port-land still shows current construction to be well behind historical levels. This trend is alsoconsistent in suburban areas. Through the first six months of 2010, only 166 multifamilyunits have been permitted in Multnomah County, with 152 units and 31 units permittedin Washington and Clackamas County, respectively. Based on these numbers, 2010 will beanother slow year for apartment construction. Factors contributing to the current void innew construction include the weak economy, difficulty obtaining financing, and the currentgap between replacement cost and market value. In light of the current low 5.1 percentvacancy rate in the metropolitan region and lack of new construction, many knowledgeablemultifamily brokers and investors are predicting a shortage in apartments by 2012. Thisshortage will be felt first within the urban core and later in the suburbs, where there isslightly more inventory. �
Greg LeBlanc is a Certificate of Real Estate Development Graduate Student and PortlandState University and is a Regional Multiple List Service (RMLS) fellow.

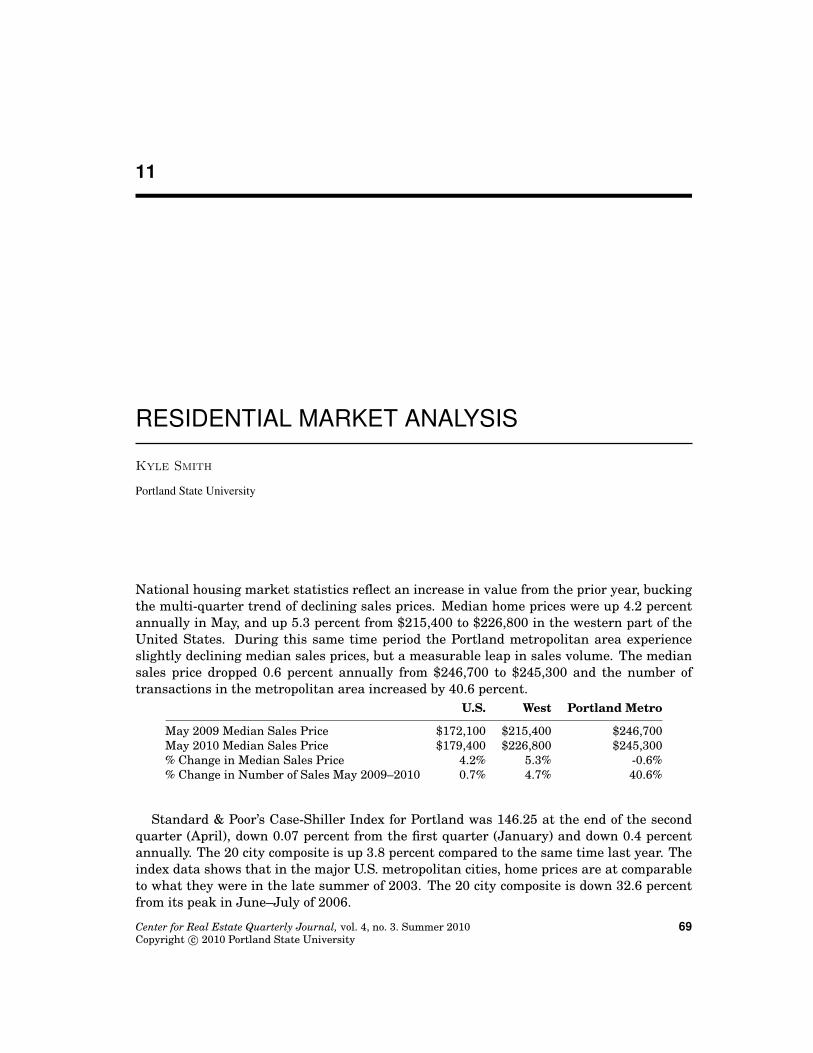
11
RESIDENTIAL MARKET ANALYSIS
Kyle Smith
Portland State University
National housing market statistics reflect an increase in value from the prior year, buckingthe multi-quarter trend of declining sales prices. Median home prices were up 4.2 percentannually in May, and up 5.3 percent from $215,400 to $226,800 in the western part of theUnited States. During this same time period the Portland metropolitan area experienceslightly declining median sales prices, but a measurable leap in sales volume. The mediansales price dropped 0.6 percent annually from $246,700 to $245,300 and the number oftransactions in the metropolitan area increased by 40.6 percent.
U.S. West Portland Metro
May 2009 Median Sales Price $172,100 $215,400 $246,700May 2010 Median Sales Price $179,400 $226,800 $245,300% Change in Median Sales Price 4.2% 5.3% -0.6%% Change in Number of Sales May 2009–2010 0.7% 4.7% 40.6%
Standard & Poor’s Case-Shiller Index for Portland was 146.25 at the end of the secondquarter (April), down 0.07 percent from the first quarter (January) and down 0.4 percentannually. The 20 city composite is up 3.8 percent compared to the same time last year. Theindex data shows that in the major U.S. metropolitan cities, home prices are at comparableto what they were in the late summer of 2003. The 20 city composite is down 32.6 percentfrom its peak in June–July of 2006.
Center for Real Estate Quarterly Journal, vol. 4, no. 3. Summer 2010Copyright c© 2010 Portland State University
69
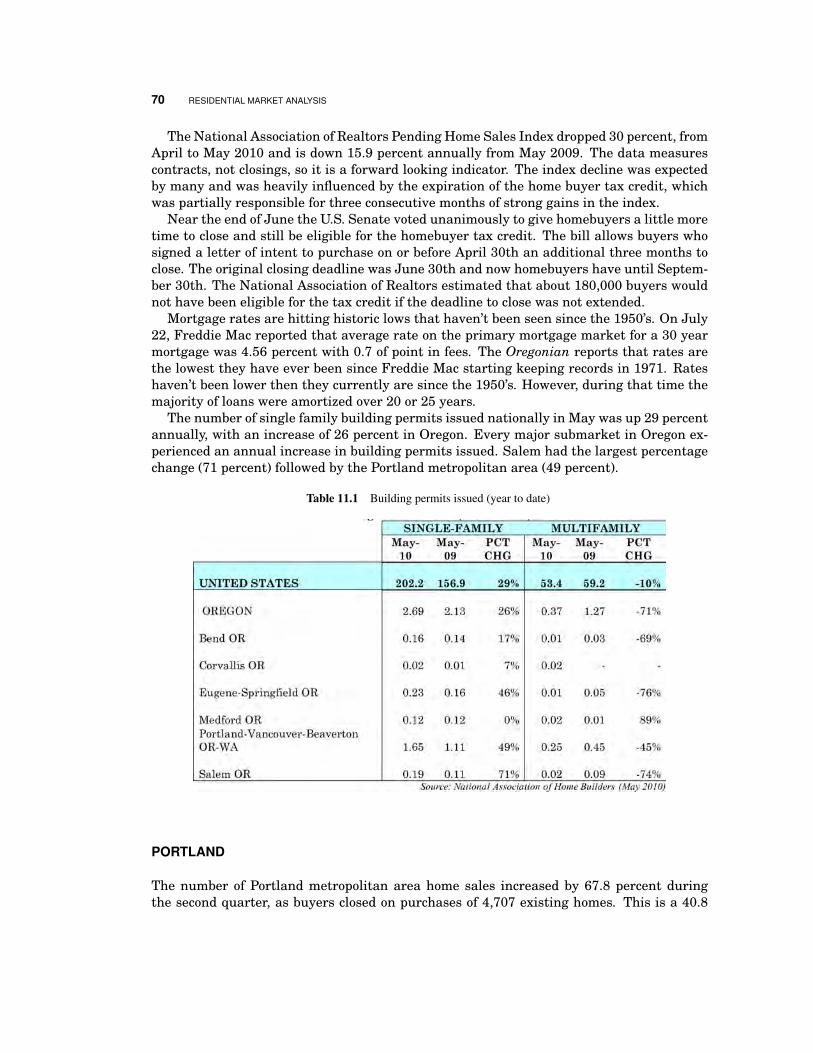
70 RESIDENTIAL MARKET ANALYSIS
The National Association of Realtors Pending Home Sales Index dropped 30 percent, fromApril to May 2010 and is down 15.9 percent annually from May 2009. The data measurescontracts, not closings, so it is a forward looking indicator. The index decline was expectedby many and was heavily influenced by the expiration of the home buyer tax credit, whichwas partially responsible for three consecutive months of strong gains in the index.
Near the end of June the U.S. Senate voted unanimously to give homebuyers a little moretime to close and still be eligible for the homebuyer tax credit. The bill allows buyers whosigned a letter of intent to purchase on or before April 30th an additional three months toclose. The original closing deadline was June 30th and now homebuyers have until Septem-ber 30th. The National Association of Realtors estimated that about 180,000 buyers wouldnot have been eligible for the tax credit if the deadline to close was not extended.
Mortgage rates are hitting historic lows that haven’t been seen since the 1950’s. On July22, Freddie Mac reported that average rate on the primary mortgage market for a 30 yearmortgage was 4.56 percent with 0.7 of point in fees. The Oregonian reports that rates arethe lowest they have ever been since Freddie Mac starting keeping records in 1971. Rateshaven’t been lower then they currently are since the 1950’s. However, during that time themajority of loans were amortized over 20 or 25 years.
The number of single family building permits issued nationally in May was up 29 percentannually, with an increase of 26 percent in Oregon. Every major submarket in Oregon ex-perienced an annual increase in building permits issued. Salem had the largest percentagechange (71 percent) followed by the Portland metropolitan area (49 percent).
Table 11.1 Building permits issued (year to date)
PORTLAND
The number of Portland metropolitan area home sales increased by 67.8 percent duringthe second quarter, as buyers closed on purchases of 4,707 existing homes. This is a 40.8
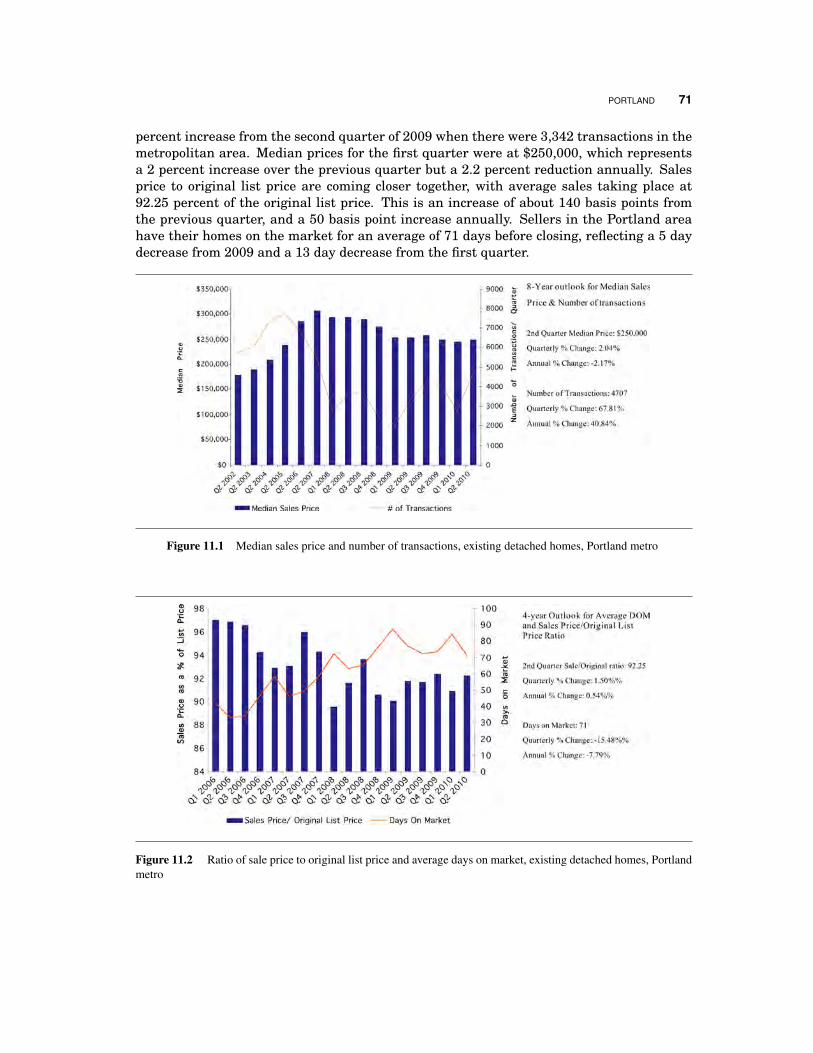
PORTLAND 71
percent increase from the second quarter of 2009 when there were 3,342 transactions in themetropolitan area. Median prices for the first quarter were at $250,000, which representsa 2 percent increase over the previous quarter but a 2.2 percent reduction annually. Salesprice to original list price are coming closer together, with average sales taking place at92.25 percent of the original list price. This is an increase of about 140 basis points fromthe previous quarter, and a 50 basis point increase annually. Sellers in the Portland areahave their homes on the market for an average of 71 days before closing, reflecting a 5 daydecrease from 2009 and a 13 day decrease from the first quarter.
Figure 11.1 Median sales price and number of transactions, existing detached homes, Portland metro
Figure 11.2 Ratio of sale price to original list price and average days on market, existing detached homes, Portlandmetro
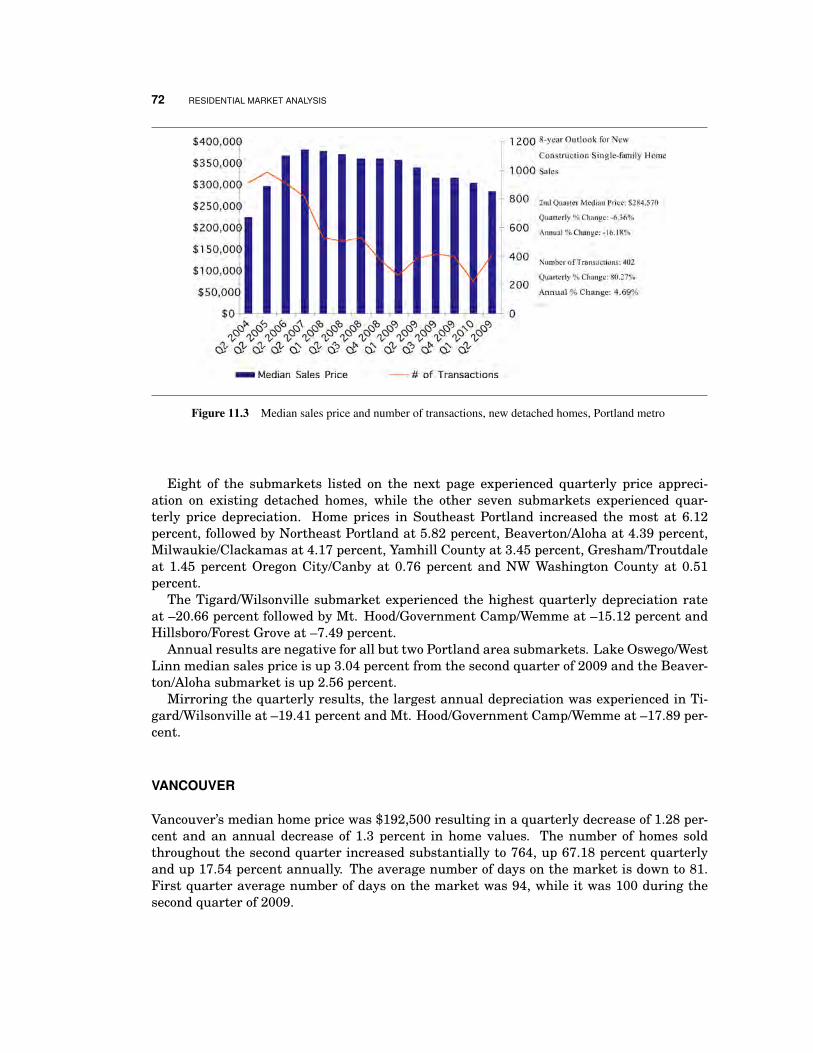
72 RESIDENTIAL MARKET ANALYSIS
Figure 11.3 Median sales price and number of transactions, new detached homes, Portland metro
Eight of the submarkets listed on the next page experienced quarterly price appreci-ation on existing detached homes, while the other seven submarkets experienced quar-terly price depreciation. Home prices in Southeast Portland increased the most at 6.12percent, followed by Northeast Portland at 5.82 percent, Beaverton/Aloha at 4.39 percent,Milwaukie/Clackamas at 4.17 percent, Yamhill County at 3.45 percent, Gresham/Troutdaleat 1.45 percent Oregon City/Canby at 0.76 percent and NW Washington County at 0.51percent.
The Tigard/Wilsonville submarket experienced the highest quarterly depreciation rateat –20.66 percent followed by Mt. Hood/Government Camp/Wemme at –15.12 percent andHillsboro/Forest Grove at –7.49 percent.
Annual results are negative for all but two Portland area submarkets. Lake Oswego/WestLinn median sales price is up 3.04 percent from the second quarter of 2009 and the Beaver-ton/Aloha submarket is up 2.56 percent.
Mirroring the quarterly results, the largest annual depreciation was experienced in Ti-gard/Wilsonville at –19.41 percent and Mt. Hood/Government Camp/Wemme at –17.89 per-cent.
VANCOUVER
Vancouver’s median home price was $192,500 resulting in a quarterly decrease of 1.28 per-cent and an annual decrease of 1.3 percent in home values. The number of homes soldthroughout the second quarter increased substantially to 764, up 67.18 percent quarterlyand up 17.54 percent annually. The average number of days on the market is down to 81.First quarter average number of days on the market was 94, while it was 100 during thesecond quarter of 2009.
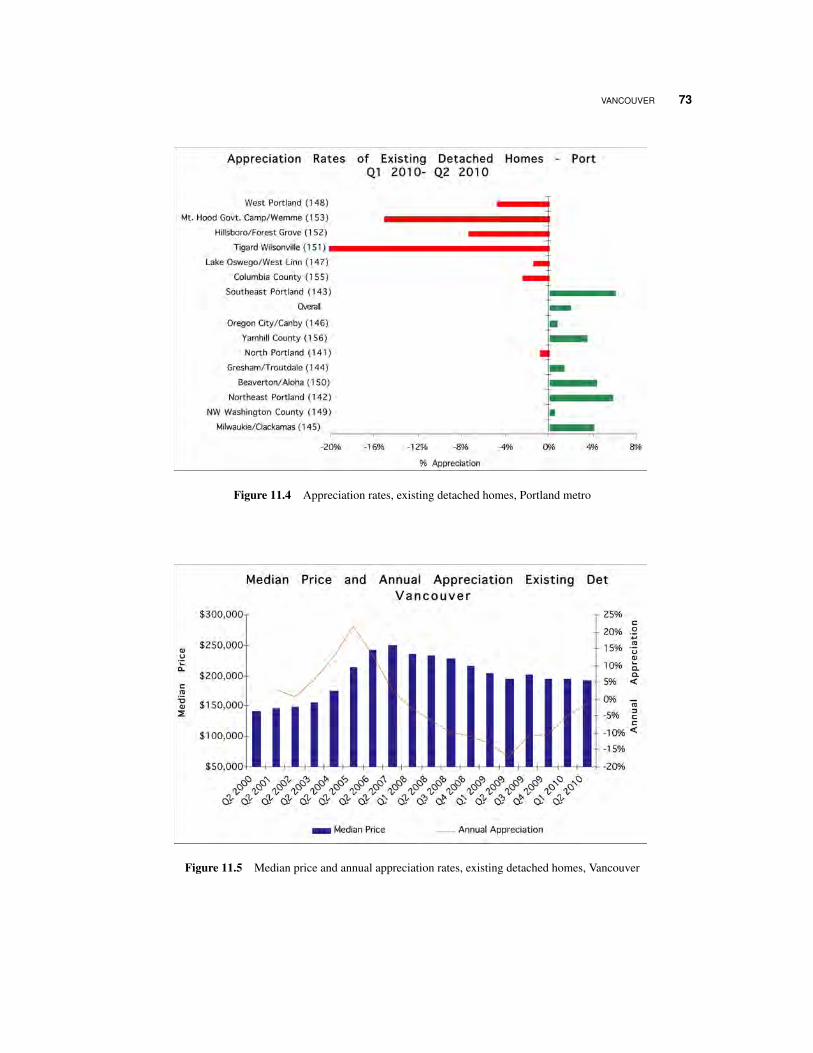
VANCOUVER 73
Figure 11.4 Appreciation rates, existing detached homes, Portland metro
Figure 11.5 Median price and annual appreciation rates, existing detached homes, Vancouver
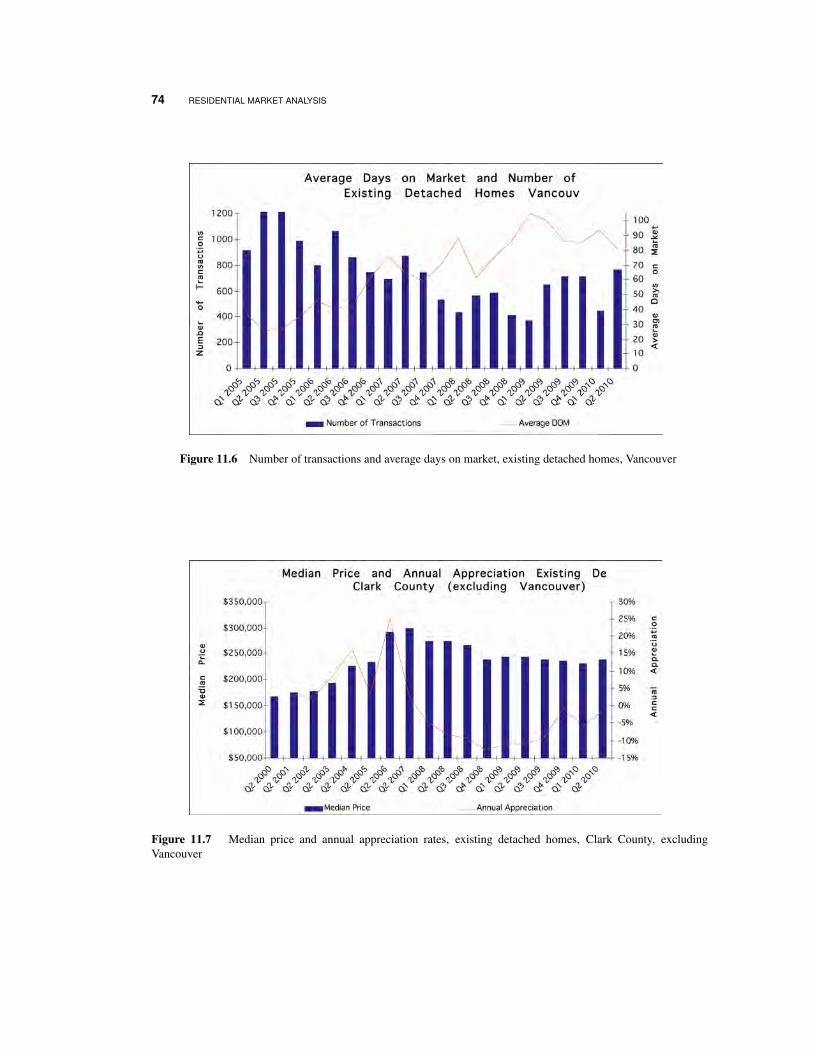
74 RESIDENTIAL MARKET ANALYSIS
Figure 11.6 Number of transactions and average days on market, existing detached homes, Vancouver
Figure 11.7 Median price and annual appreciation rates, existing detached homes, Clark County, excludingVancouver
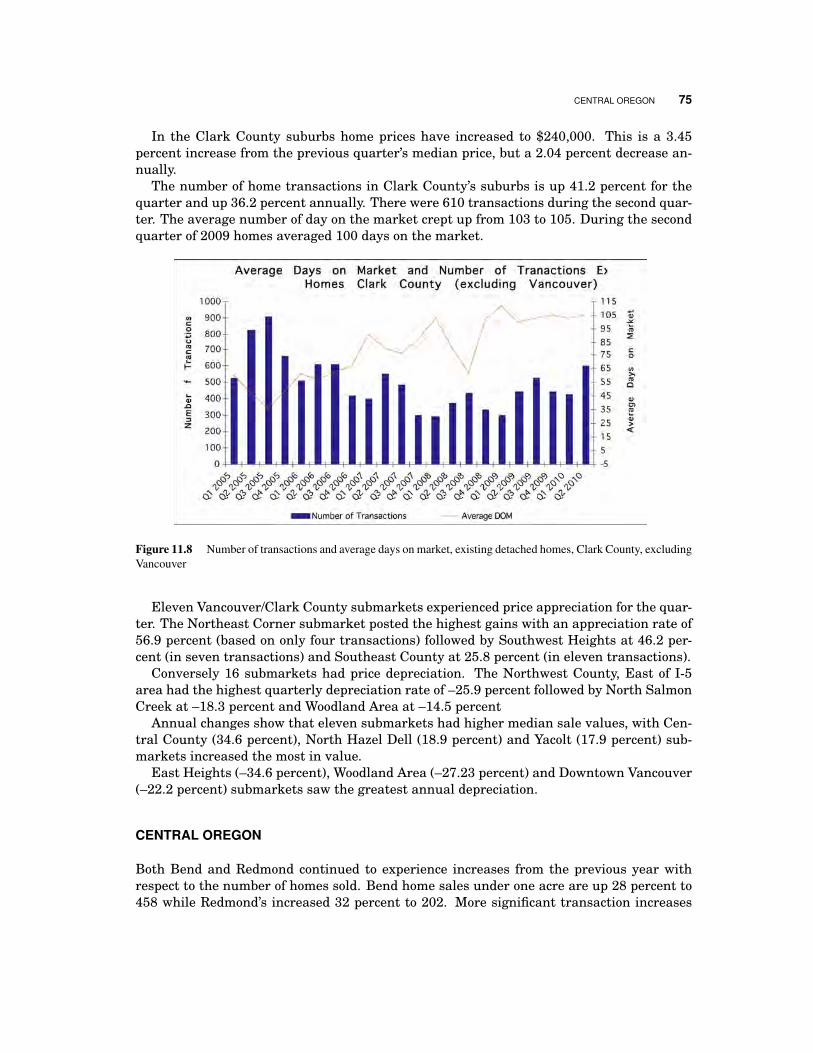
CENTRAL OREGON 75
In the Clark County suburbs home prices have increased to $240,000. This is a 3.45percent increase from the previous quarter’s median price, but a 2.04 percent decrease an-nually.
The number of home transactions in Clark County’s suburbs is up 41.2 percent for thequarter and up 36.2 percent annually. There were 610 transactions during the second quar-ter. The average number of day on the market crept up from 103 to 105. During the secondquarter of 2009 homes averaged 100 days on the market.
Figure 11.8 Number of transactions and average days on market, existing detached homes, Clark County, excludingVancouver
Eleven Vancouver/Clark County submarkets experienced price appreciation for the quar-ter. The Northeast Corner submarket posted the highest gains with an appreciation rate of56.9 percent (based on only four transactions) followed by Southwest Heights at 46.2 per-cent (in seven transactions) and Southeast County at 25.8 percent (in eleven transactions).
Conversely 16 submarkets had price depreciation. The Northwest County, East of I-5area had the highest quarterly depreciation rate of –25.9 percent followed by North SalmonCreek at –18.3 percent and Woodland Area at –14.5 percent
Annual changes show that eleven submarkets had higher median sale values, with Cen-tral County (34.6 percent), North Hazel Dell (18.9 percent) and Yacolt (17.9 percent) sub-markets increased the most in value.
East Heights (–34.6 percent), Woodland Area (–27.23 percent) and Downtown Vancouver(–22.2 percent) submarkets saw the greatest annual depreciation.
CENTRAL OREGON
Both Bend and Redmond continued to experience increases from the previous year withrespect to the number of homes sold. Bend home sales under one acre are up 28 percent to458 while Redmond’s increased 32 percent to 202. More significant transaction increases
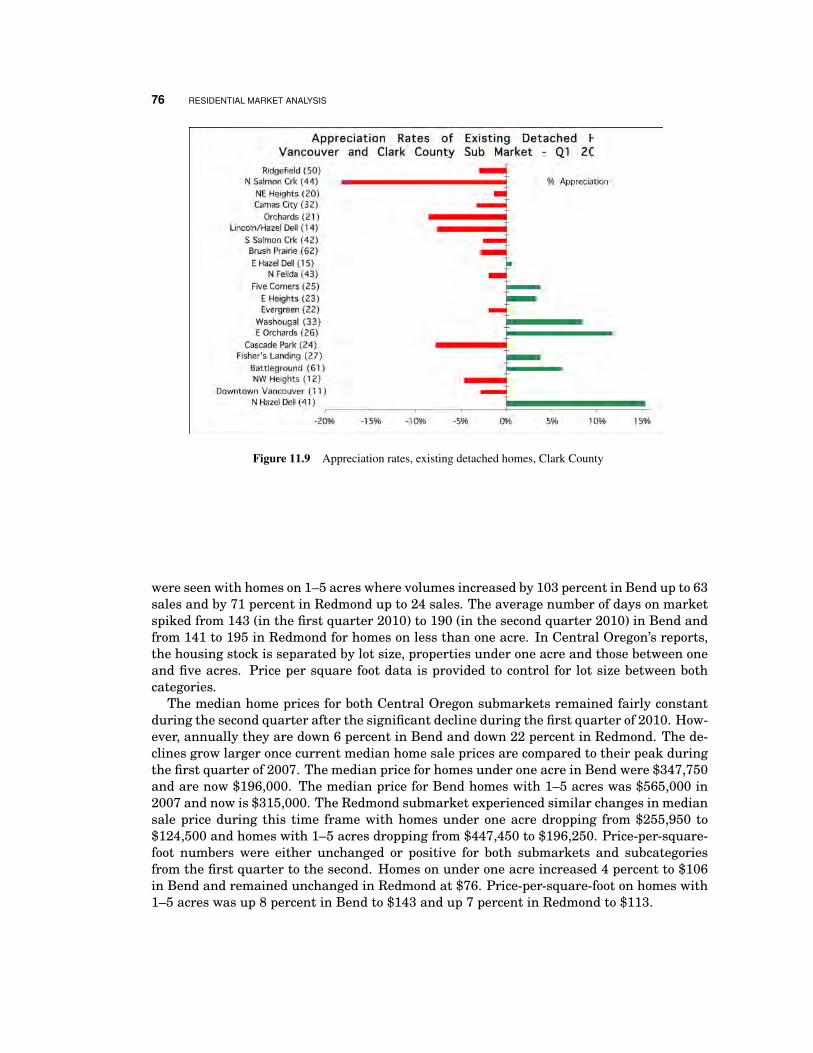
76 RESIDENTIAL MARKET ANALYSIS
Figure 11.9 Appreciation rates, existing detached homes, Clark County
were seen with homes on 1–5 acres where volumes increased by 103 percent in Bend up to 63sales and by 71 percent in Redmond up to 24 sales. The average number of days on marketspiked from 143 (in the first quarter 2010) to 190 (in the second quarter 2010) in Bend andfrom 141 to 195 in Redmond for homes on less than one acre. In Central Oregon’s reports,the housing stock is separated by lot size, properties under one acre and those between oneand five acres. Price per square foot data is provided to control for lot size between bothcategories.
The median home prices for both Central Oregon submarkets remained fairly constantduring the second quarter after the significant decline during the first quarter of 2010. How-ever, annually they are down 6 percent in Bend and down 22 percent in Redmond. The de-clines grow larger once current median home sale prices are compared to their peak duringthe first quarter of 2007. The median price for homes under one acre in Bend were $347,750and are now $196,000. The median price for Bend homes with 1–5 acres was $565,000 in2007 and now is $315,000. The Redmond submarket experienced similar changes in mediansale price during this time frame with homes under one acre dropping from $255,950 to$124,500 and homes with 1–5 acres dropping from $447,450 to $196,250. Price-per-square-foot numbers were either unchanged or positive for both submarkets and subcategoriesfrom the first quarter to the second. Homes on under one acre increased 4 percent to $106in Bend and remained unchanged in Redmond at $76. Price-per-square-foot on homes with1–5 acres was up 8 percent in Bend to $143 and up 7 percent in Redmond to $113.
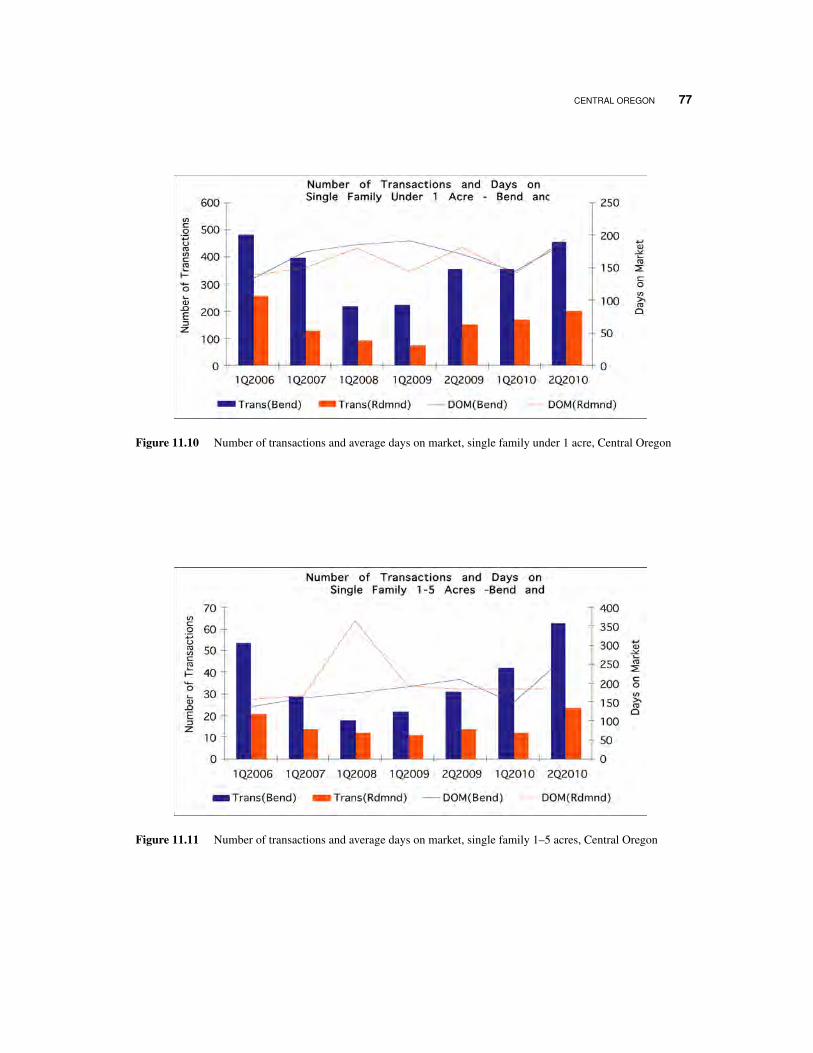
CENTRAL OREGON 77
Figure 11.10 Number of transactions and average days on market, single family under 1 acre, Central Oregon
Figure 11.11 Number of transactions and average days on market, single family 1–5 acres, Central Oregon
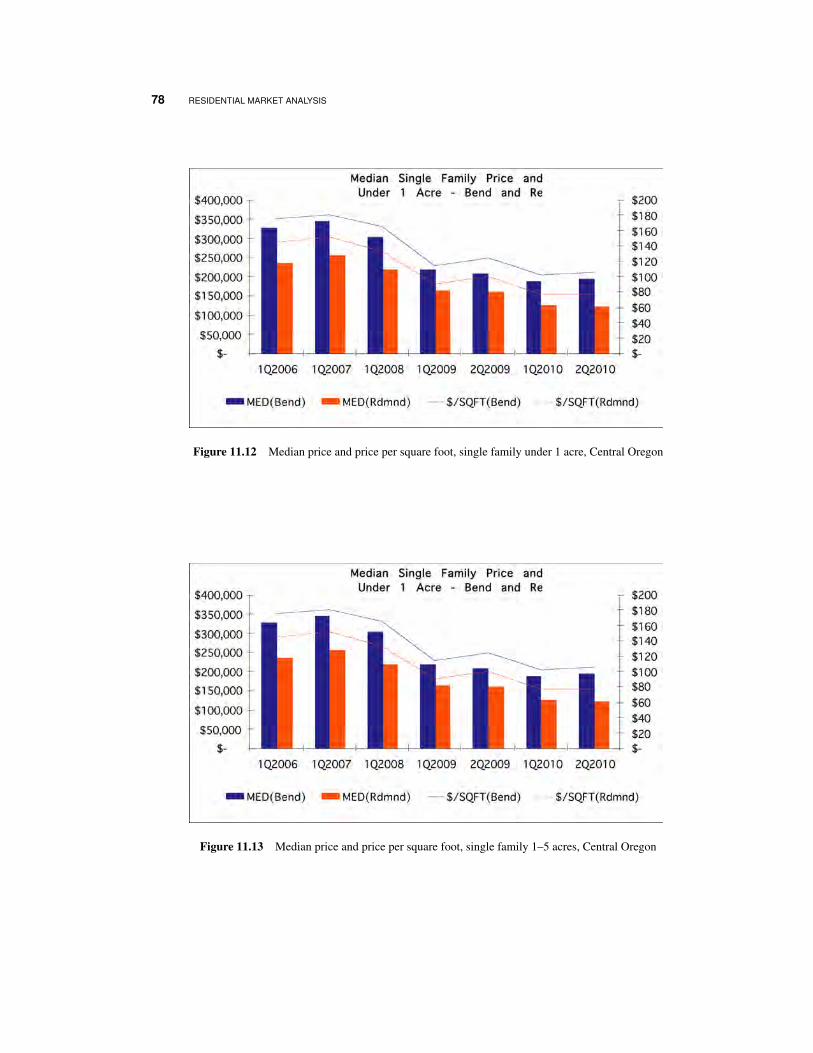
78 RESIDENTIAL MARKET ANALYSIS
Figure 11.12 Median price and price per square foot, single family under 1 acre, Central Oregon
Figure 11.13 Median price and price per square foot, single family 1–5 acres, Central Oregon
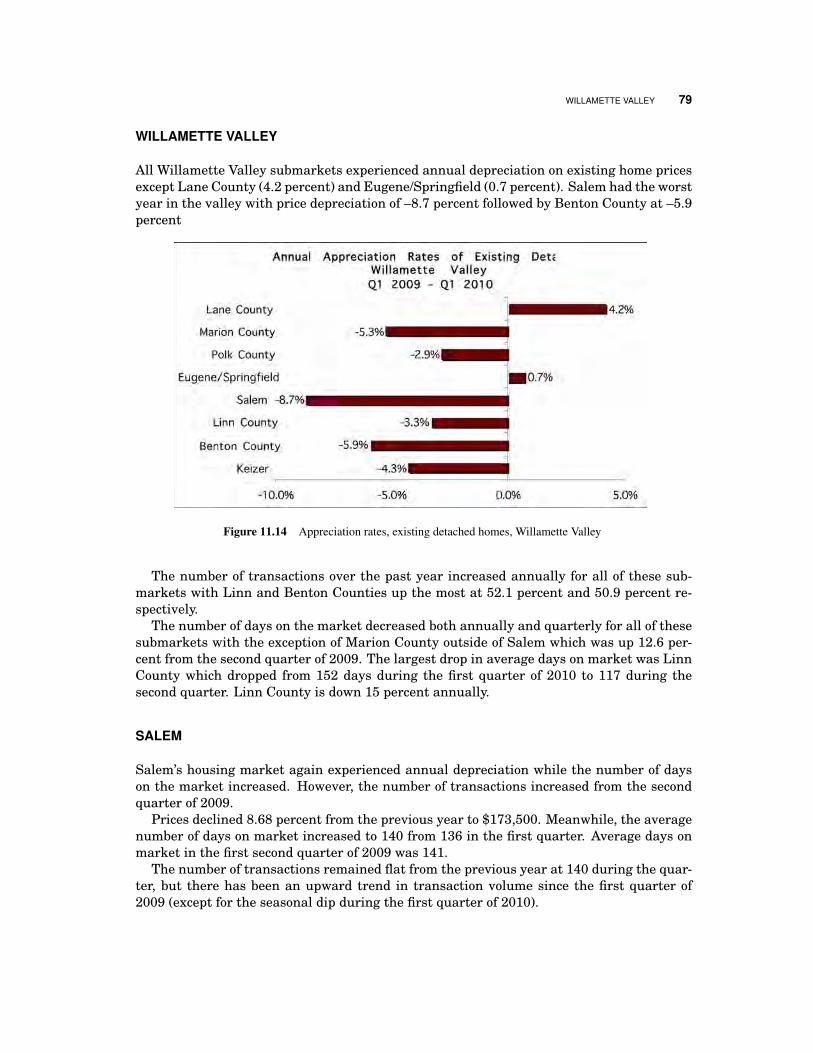
WILLAMETTE VALLEY 79
WILLAMETTE VALLEY
All Willamette Valley submarkets experienced annual depreciation on existing home pricesexcept Lane County (4.2 percent) and Eugene/Springfield (0.7 percent). Salem had the worstyear in the valley with price depreciation of –8.7 percent followed by Benton County at –5.9percent
Figure 11.14 Appreciation rates, existing detached homes, Willamette Valley
The number of transactions over the past year increased annually for all of these sub-markets with Linn and Benton Counties up the most at 52.1 percent and 50.9 percent re-spectively.
The number of days on the market decreased both annually and quarterly for all of thesesubmarkets with the exception of Marion County outside of Salem which was up 12.6 per-cent from the second quarter of 2009. The largest drop in average days on market was LinnCounty which dropped from 152 days during the first quarter of 2010 to 117 during thesecond quarter. Linn County is down 15 percent annually.
SALEM
Salem’s housing market again experienced annual depreciation while the number of dayson the market increased. However, the number of transactions increased from the secondquarter of 2009.
Prices declined 8.68 percent from the previous year to $173,500. Meanwhile, the averagenumber of days on market increased to 140 from 136 in the first quarter. Average days onmarket in the first second quarter of 2009 was 141.
The number of transactions remained flat from the previous year at 140 during the quar-ter, but there has been an upward trend in transaction volume since the first quarter of2009 (except for the seasonal dip during the first quarter of 2010).
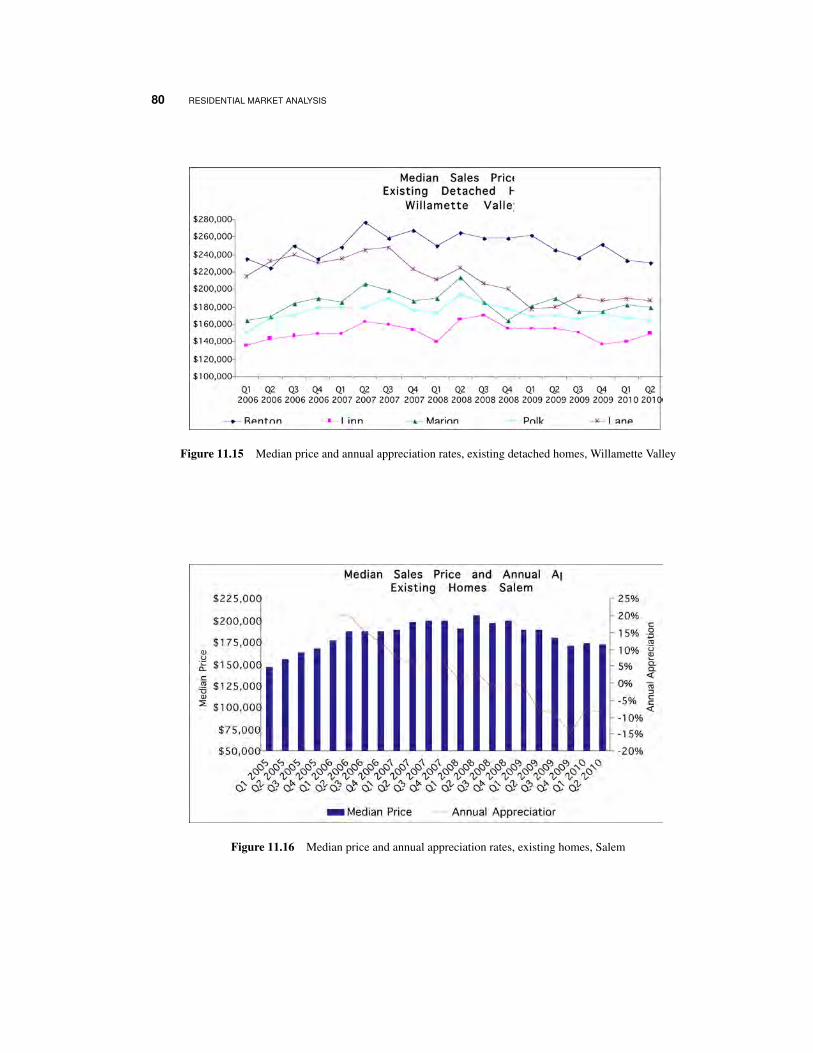
80 RESIDENTIAL MARKET ANALYSIS
Figure 11.15 Median price and annual appreciation rates, existing detached homes, Willamette Valley
Figure 11.16 Median price and annual appreciation rates, existing homes, Salem
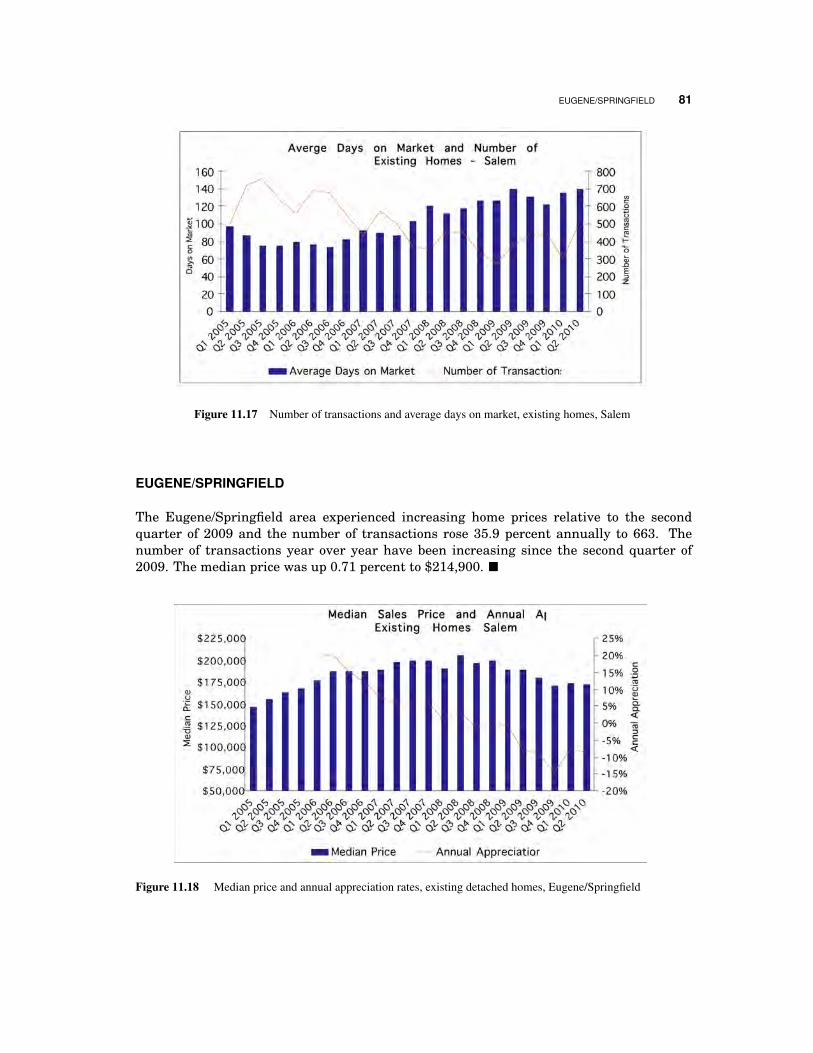
EUGENE/SPRINGFIELD 81
Figure 11.17 Number of transactions and average days on market, existing homes, Salem
EUGENE/SPRINGFIELD
The Eugene/Springfield area experienced increasing home prices relative to the secondquarter of 2009 and the number of transactions rose 35.9 percent annually to 663. Thenumber of transactions year over year have been increasing since the second quarter of2009. The median price was up 0.71 percent to $214,900. �
Figure 11.18 Median price and annual appreciation rates, existing detached homes, Eugene/Springfield

82 RESIDENTIAL MARKET ANALYSIS
Kyle Smith is a Certificate of Real Estate Development Graduate Student and PortlandState University and is the Regional Multiple List Service (RMLS) fellow.