Embed Size (px)
Citation preview

CENTER OF EXCELLENCE (COE) FOR CLEAN ENERGY
IN INDONESIA
DECEMBER 2015

• Increasing pressure on the supply and access of energy to
accommodate its economic and social development of Indonesia
• National necessity for utilization of the country’s vast available
renewable-energy sources
• Establishment of a separate Directorate General for Renewable
Energy and Energy Conservation under the MEMR in 2010 as part of
institutional development to support the acceleration of NRE
contribution on energy sector
• The Ministry of Energy and Mineral Resource (MEMR) will establish a
Centre of Excellence (COE) to support the national clean-energy
programme
• COE will be established to bring together national and international expertise and public-and private-entities to assist in the transfer and
deployment of technologies through innovative financing and
business models
2 INTRODUCTION

INDONESIA’S ENERGY MIX3
Minyak Bumi20%
Gas Bumi24%
Batubara25%
Panas Bumi6%Hidro
2%
Bioenergi14%
EBT Lainnya9%
2050: 1000 MTOE
YEAR 2015 2020 2025 2030 2040 2050
UNIT MTOE % MTOE % MTOE % MTOE % MTOE % MTOE %
Biofuel 6 2.8% 9 3.1% 19 4.7% 22 4.6% 44 5.9% 78 7.7%
MSW 4 1.9% 7 2.4% 20 5.0% 25 5.2% 52 7.0% 64 6.4%
Geothermal 9 4.2% 23 7.9% 28 7.1% 31 6.5% 36 4.9% 58 5.8%
Hydro 2 0.9% 5 1.7% 11 2.6% 12 2.5% 13 1.8% 20 2.0%
Ocean 0 0.0% 0 0.0% 0 0.0% 1 0.2% 2 0.3% 4 0.4%
Solar 0 0.0% 0 0.0% 0 0.0% 1 0.2% 11 1.5% 17 1.7%
Other RE (Wind) 0 0.0% 0 0.0% 0 0.0% 0 0.0% 1 0.1% 1 0.1%
New Energy (Nuclear, CBM etc) 0 0.0% 5 1.7% 13 3.2% 27 5.6% 48 6.5% 68 6.8%
Oil 84 39.3% 93 32.1% 100 25.0% 106 22.1% 155 20.9% 200 20.0%
Gas 47 22.0% 64 22.1% 88 22.0% 110 23.0% 178 24.1% 240 24.0%
Coal 62 29.0% 84 29.0% 120 30.0% 144 30.1% 200 27.0% 250 25.0%
TOTAL 215 100.0% 290 100.0% 400 100.0% 479 100.0% 740 100.0% 1000 100.0%
SUB TOTAL FOSSIL 193 90.2% 241 83.1% 308 77.0% 360 75.2% 533 72.0% 676 69.0%
SUB TOTAL NON FOSSIL (NRE) 21 9.8% 49 16.9% 92 23.0% 119 24.8% 207 28.0% 310 31.0%
Minyak Bumi39%
Gas Bumi22%
Batubara29%
Panas Bumi4%
Hidro1%
Bioenergi5%
EBT Lainnya
0%
2015: 215 MTOE
Minyak Bumi25%
Gas Bumi22% Batubara
30%
Panas Bumi7%
Hidro3%
Bioenergi10%
EBT Lainnya3%
2025: 400 MTOE
Minyak Bumi32%
Gas Bumi22%
Batubara29%
Panas Bumi8%
Hidro2%
Bioenergi5%
EBT Lainnya2%
2020: 290 MTOE
Minyak Bumi22%
Gas Bumi23%
Batubara30%
Panas Bumi6%
Hidro3%
Bioenergi10%
EBT Lainnya6%
2030: 480 MTOE
Minyak Bumi21%
Gas Bumi24%
Batubara27%
Panas Bumi5%
Hidro2%
Bioenergi13%
EBT Lainnya8%
2040: 740 MTOE
3
(Government Regulation NO. 79/2014 on National Energy Policy)
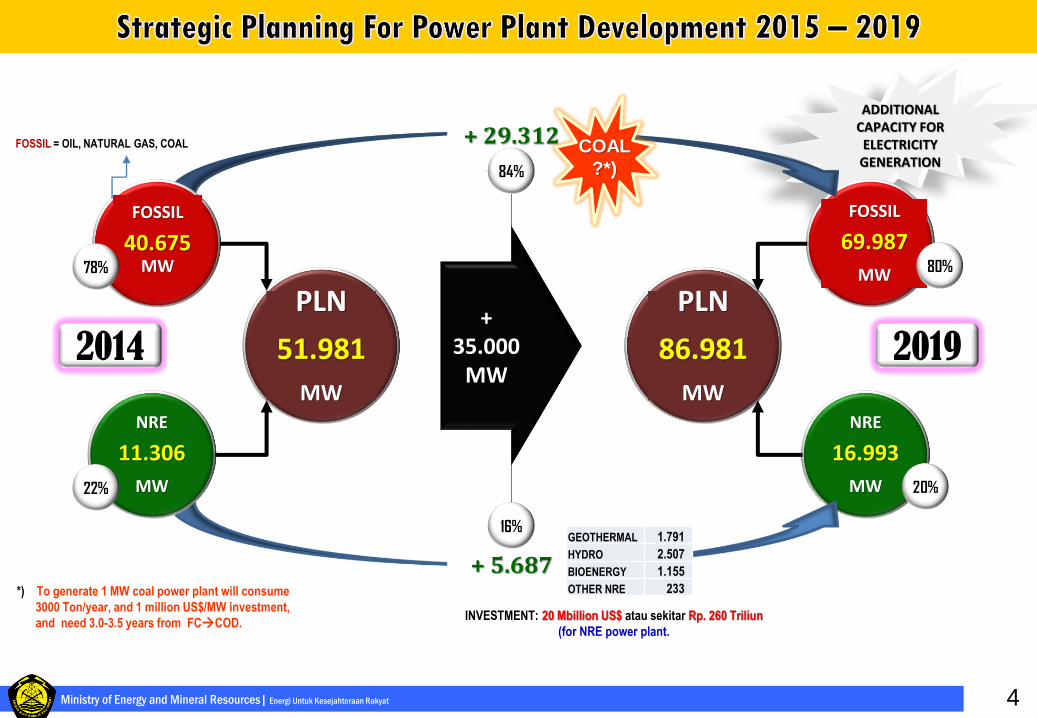
ADDITIONAL CAPACITY FOR ELECTRICITY
GENERATION
FOSSIL
69.987
MW
NRE
16.993
MW
+ 35.000
MW
NRE
11.306
MW
PLN
51.981
MW
FOSSIL
40.675 MW
PLN
86.981
MW
2014 2019
+ 5.687
+ 29.312
80%
20%
78%
22%
84%
16%
COAL
?*)
GEOTHERMAL 1.791
HYDRO 2.507
BIOENERGY 1.155
OTHER NRE 233
INVESTMENT: 20 Mbillion US$ atau sekitar Rp. 260 Triliun
(for NRE power plant.
FOSSIL = OIL, NATURAL GAS, COAL
*) To generate 1 MW coal power plant will consume
3000 Ton/year, and 1 million US$/MW investment,
and need 3.0-3.5 years from FCCOD.
4Ministry of Energy and Mineral Resources| Energi Untuk Kesejahteraan Rakyat

*) Preliminary figures up to December 2013 excluding biomass and the use of non-energy
NO NEW RENEWABLE ENERGY RESOURCES INSTALLED CAPACITY (IC)RATIO OF
IC/RESOURCES (%)
1 2 3 4 5 = 4/3
1 Hydro 75,000 MW 7,572 MW 10.1 %
2 Geothermal 28,910 MW 1,403.5 MW 4.9 %
3 Biomass 32,654 MW 1,717.9 MW 5.4 %
4 Solar 112.000 GW(4.80 kWh/m2/day)***** 48.05 MW -
5 Wind 3 – 6 m/s 1.87 MW -
6 Ocean 61 GW ***) 0.01 MW ****) -
7 Uranium 3,000 MW *) 30 MW **) -
*) Only in Kalan – West Borneo
**) As a center of research, non-energy
***) Source: R&D Agency of EMR
****) BPPT’s Prototype *****) Source R&D A of EMR
NO SECTORENERGY CONSUMPTION PER
SECTOR 2012 (MBOE) *)
POTENTIAL OF ENERGY
CONSERVATION
TARGET OF SECTORAL
ENERGY CONSERVATION
(2025)
1 Industry 305 (39,7%) 10 – 30% 17%
2 Transportation 311 (40,4%) 15 – 35% 20%
3 Household 92 (12%) 15 – 30% 15%
4 Commercial 34 (4,4%) 10 – 30% 15%
5Others (Agriculture, Construction, and
Mining)26 (3,4%) 25% -
POTENTIAL OF NRE RESOURCES
POTENTIAL OF ENERGY CONSERVATION
Source: Draft on National Energy Conservation Master Plan 2011
5
Ministry of Energy and Mineral Resources| Energi Untuk Kesejahteraan Rakyat

No.
WKP
(Geothermal Work
Area)
Development
Planning
(MW)
COD
Planning
1 Sibual-Buali 3 x 110
2016,
2017,
2018.
2Hululais - Tambang
Sawah2 x 55
2018,
2019.
3 Lumut Balai 4 x 55
2016,
2018,
2019.
4 Sungai Penuh 2 x 55 2019
5 Karaha-Cakrabuana1 x 30,
2 x 55
2016,
2019.
6Buyan Bratan
(Bedugul)1 x 10 2018
7 Kotamobagu 2 x 20 2019
8 Iyang-Argopuro 1 x 55 2019
9 Tulehu, 20 2018
10 Cibuni 10 2017
11 Ciater 30 2019
12Liki Pinangawan
Muaralaboh220
2017.
2018.
13 Gn. Rajabasa 2202018,
2019
14 Jaboi 10 2018
15Sorik Marapi-Roburan-
Sampuraga240
2018,
2019.
16 Cisolok Cisukarame 45 2017
17Gn. Tangkuban
Perahu110 2017
18 Gn. Tampomas 40 2018
19 Gn. Ungaran 55 2017
20 Sokoria 6 x 5
2017,
2018,
2019.
21 Atadei 10 2016
22 Jailolo 10 2019
23 Suoh Sekincau 2202018,
2019.
24 Hu'u Daha 202018,
2019.
25 Kaldera Danau Banten 110 2019
26 Rantau Dedap 220 2018
27 Blawan – Ijen 130 2019
28 Telaga Ngebel 165 2019
29 Baturaden 2202018,
2021.
30 Guci 55 2019
31 Seulawah Agam 55 2020
32 Ciremai 110 2020
No Island
The
number
of
location
Total Attached
1 Sumatera 93 12.886 122
2 Jawa 73 9.795 1189
3 Bali-Nusa Tenggara 33 1.907 12,5
4 Kalimantan 14 162,5 -
5 Sulawesi 76 3.229 80
6 Maluku 32 1.421 -
7 Papua 3 75 -
Total 324 29.475,5 1.403,5
No. Work Area
Capacity
Planning
(MW)
No. Work Area
Capacuty
Palnning
(MW)
No. Work Area
Capacity
Planning
(MW)
1. Bonjol 60 10. Songgoriti 20 19. Oka-Ile Ange 10
2. Gn. Talang – Bukit Kili 20 11. Gunung Lawu 165 20. Marana 20
3. Way Ratai 55 12.Sipoholon Ria-
Ria20 21. Bora Pulu 40
4. Gunung Endut 40 13. Kepahiang 110 22.Gunung
Hamiding2 x 5
5. Candi Umbul Telomoyo 55 14.Simbolon
Samosir110 23. Telaga Ranu 2 x 5
6. Gunung Wilis 20 15. Danau Ranau 110 24. Songa Wayaua 2 x 2,5
7. Gunung Arjuno Welirang 110 16. Graho Nyabu 110 25.Gn.
Geureudong2 x 55
8. Gunung Pandan 10 17. Suwawa 20 26. Gn.Galunggung 2 x 55
9.Gunung Gede
Pangrango55 18. Sembalun 20
GEOTHERMAL POWER PLANT PREPARATION AUCTION : 1.425 MW
INDONESIA GEOTHERMAL POTENTIAL : 28.910 MW
NOT YET IN PRODUCTION: 3.370 MW
Has been producing Not yet producing
Will Auction
No. PLTP
(Geothermal Power Plant)Total Capacity (MW)
1 Sibayak 12
2 Salak 377
3 Wayang Windu 227
4 Patuha 55
5 Kamojang 200
6 Darajat 270
7 Dieng 60
8 Lahendong 80
9 Ulubelu 110
10 Ulumbu 10
11 Mataloko 2,5
GEOTHERMAL POWER PLANT HAS BEEN OPERATION :1.403,5 MW
Geothermal Potency In Indonesia
Ministry of Energy and Mineral Resources| Energi Untuk Kesejahteraan Rakyat

Ministry of Energy and Mineral Resources
NoPotential
(MWe)Unit Sumatera Kalimantan
Jawa-Bali-
Madura
Nusa
Tenggara Sulawesi Maluku Papua Total
1 Palm oil MWe8.812 3.384 60 - 323 - 75 12.654
2 Sugar cane MWe399 - 854 - 42 - - 1.295
3 Rubber MWe1.918 862 - - - - - 2.781
4 Coconut MWe53 10 37 7 38 19 14 177
5 Rice husk MWe2.255 642 5.353 405 1.111 22 20 9.808
6 Corn MWe408 30 954 85 251 4 1 1.733
7 Cassava MWe110 7 120 18 12 2 1 271
8 Wood MWe1.212 44 14 19 21 4 21 1.335
9 Cow dung MWe96 16 296 53 65 5 4 535
10 MSW MWe326 66 1.527 48 74 11 14 2.066
Total potential MWe 15.588 5.062 9.215 636 1.937 67 151 32.654
1) Based on MEMR survey in 2011 – 2012
2) Biofuel resources are palm oil, molasses, cassava, etc

Energy and Mineral Resources for People’s Welfare
POTENTAL LANDS FOR INTENSIVE BIOFUEL PLANTATIONS IN INDONESIA
1. EX MINING AREAS
2. FOREST FOR INDUSTRIAL PLANTATIONS : 14,7 juta Ha. ( APHI, 2013 )
3. CRITICAL LANDS : 27,2 Juta Ha (Statistik Kehutanan, 2011)
LAND
POTENTION
TO
CULTICATION
CANDLE NUT
ON GOING FINISH EX MININGOUTSIDE EX
MINING(Ha)
1 2 3 4 5 6 7 8 9 10 11 12 13 14
1 2010 1.438.685,03 35.204,66 40.910,59 38.163,46 48.808,08 64.390,66 189.313,99 55.110,09 7.596,94 62.707,03 126.606,96
2 2011 1.644.540,68 46.745,92 46.647,63 41.617,84 199.084,29 67.538,39 360.016,23 64.777,95 7.158,64 71.936,59 288.079,64
3 2012 1.839.721,54 48.927,06 60.634,73 52.515,49 87.056,66 73.403,94 270.022,39 88.002,03 8.919,80 96.921,83 173.100,56
4 2013 94.742,79 736,32 594,24 431,92 1.569,83 321,24 3.221,63 1.360,14 468,44 1.828,58 1.393,05
5.017.693,04 131.617,96 148.792,19 132.734,71 336.525,86 205.662,23 822.583,24 209.260,21 24.154,82 233.406,03 589.193,21
SUMBER : DIOLAH DARI SIM REKLAMASI TAMBANG, DJ MINERBA KESDM, 2013
JUMLAH
NOTE
LAND AREA OPERATIONING ( Ha ) RECLAMATION ARAE (Ha)
MINING AREA HOARDING AREA
OTHERS
USE
SUM
(4+5+7+8)
REVEGE
TASITOTAL
NO YEAR
AREA
PROPOSED
(Ha) OTHERS
SHAPE

WHY DO WE NEED TO ACCELERATE NRE DEVELOPMENT9
NO KEY ISSUES CHALLENGES PROPOSED SOLUTIONS
1. Technology • Relatively immature technology and high costs
• Value chain has not been established
• Limited expertise
• Capacity building for local human resources• Fiscal and tax incentives for NRE technology• Significant improvement on budget
allocation for NRE R&D
2. Economic of feedstock
• Frequently higher of biofuel feedstock prices than petroleum ones
• Limited allocation land for bioenergy feedstock
• Implementation of energy forest andplantations
• Mandatory use of NRE policy
3. Funding • NRE investment is not attractive• Requirement of significant amount
of working capitals
• Special fund from national financial institution for supporting NRE projects
• Special state budget allocation for initial project development on NRE
4. Regulation • Various regulation related constraints
• Lack of law enforcement• Legal uncertainty on the
implementation of regulation for feed in tariff
• Implementation of cost related pricing policy• Harmonization of various NRE related
regulations• Legal certainty• Simplifying license procedure for land
acquisition

GENERAL STRATEGY TO INCREASE NRE UTILIZATION10
1. CREATING MARKET
Through the activities of privisioning (supplying) and utilization of bio-fuel, obligating National
Electric Company (PT PLN) to buy electricity, the application of Indonesian National Standard
(SNI), biofuel mandatory;
Intensive large scale NRE development: bioenergy forest and platations
Development of cluster economy based on NRE utilization
Integrated NRE and rural regional development
2. SUBSIDY
The subsidy program for bio-fuel has been running since 2009. Subsidies are provided on the
difference between fuel prices and bio-fuel prices, distributed through Pertamina;
Subsidy is also provided for plantation
3. FEED-IN TARIFF
Declared through the Minister of Energy and Mineral Resources Regulation, regulates the selling
price of electricity from renewable energy purchased by National Electric Company. There should
be no negotiations;
4. PROVIDING INCENTIVES AND FACILITIES
Reduction of taxes and customs duties, licensing procedures to be simplified;
Electricity produced by power plants up-to 10 MW will be sold to PLN; no signing of Power
Purchase Agreement is needed.

HOW CAN COE SUPPORT THE ACCELERATION OF NRE DEVELOPMENT IN
INDONESIA11
Broad
Market Place
Adoption
Deployment
& Market
Transformation
Research and
Development
• Invent & innovate
• New technologies
• New products
• Create options for society
• Improve performance
• Improve reliability
• Reduce technology risks
• Test new advances
• Accelerate adoption
• Integrate with other systems
• Take technologies from demo
to replicable adoption
• Validate performance and
reliability
• Partner with stakeholders
• Overcome barriers to use
• Reduce investment risks
• Develop and implement codes
& standards
• Accessible to consumers
• Easy to use & maintain
• Reliable
• Affordable and secure
• Attractive investment option
• Demand from marketplace
• Diverse supply options
• Creation of jobs
Early
Demos
Demos at ScaleTHE ROLE
OF COE

Function:
To enable concerted effort in developing
and deploying NRE by bringing together
national and international expertise and
public-and private-entities to assist in the
transfer and deployment of technologies
through innovative financing and business
models, and to provide a collaborative
learning and training environment of NRE.
12 FUNCTION AND TASKS OF COE

1. NRE technology integration and knowledge development at micro
through to medium enterprise and industry levels;
2. Research, development and demonstration activities in controlled
environments and as pilot projects;
3. Project development and implementation support in cooperation
with MEMR, related sector ministries and provincial governments;
4. Optimising policy and regulatory frameworks to enhance private-sector investment and participation; and
5. Innovative solutions to mitigate costs and risks for the public- and
private-sector in the deployment of NRE.
13 OBJECTIVES OF COE

COE’S SCOPE OF WORK14
INVESTMENT FACILITATION
• Investment and Funding
• Project Facilitation
• Manufacture & Processing
KNOWLEDGE SUPPORT
• Geographic Analysis
• Technical Information
• Monitoring and Evaluation
• Technology Innovation
LEARNING FACILITIES
• Demographics and Geospatial Analysis
• Business Modelling
• TechnologyDeployment
• Policy Integrationand Standards
• Reportingand Lessons Learnt
• Value-chain Development
• Science and Society

COE FIELD STATIONS15
The development of the COE will require partnering with, or establishing, field stations that will function
as support centres for ground truthing, project implementation support and monitoring and evaluation.
These stations, the location of which are to be determined and demand driven, will provide an interface
with local governments and communities and report on potential or emerging bottlenecks which can be
relayed to the appropriate authorities through mechanisms to be established by the Centre.

• Located at Jembrana, on apprx 30
hectare of land
• Main Building ± 2000 m2
• Supporting facilities: Renewable Energy
Lab, Computation Lab, Meeting room,
Information center etc.
16 OFFICE OF COE: BUILDING AND FACILITIES
• Energy analysis and decision support
• Data and information
• Information clearing house
• Networking and cooperation
17 COE’S CAPACITIES

DATA ANALYSIS CENTRE18
Equipment
• 1 x Server
• 2 x Desktop Computer
• 4 x Laptop
• 7 x Monitor 27"
• 3 x LCD Screen 70”
• 2 x Wi-Fi Projector and Screen.
Office Facilities
• Minimum 60m2 partitioned 35m2 (meetings) and 25m2
(operations)
• Specialised electrical wiring and cabling
• 24-hour access to premises for operations and maintenance
Personnel
• 1 x Data Research Coordinator
• 2 x Geospatial Specialist and Analyst
• 2 x Web Operations Programmer and Database Specialist
Services & Software
• Internet
• Web services
• Google Apps
• ArcGIS (desktop)
DataAnalysis Centre
(PADAT)

POTENTIAL COOPERATION WITH STAKEHOLDERS19
Cooperation on Human Resources Development
• Capacity building on policy, planing and technical issues
• Exchange of experiences and sucess stories
• Conducting joint seminar, conference and exhibition
• Graduate and post graduate studies on NRE
Cooperation on tecnological development and deployment
• Research and development ofNRE
• Research and development of second generation of biofuel with focusing on macro algae and cellulosic based bioethanol
• Development and deployment of technologies on hybrid energy system
• R&D on smart system and other NRE
Cooperation on Business Development
• Model project for nre
• Feasibility study on nre projects for investment
• Investment on nre based project, such as bioenergy, MSW, waste of agroindustry, biomass, biogas, wind energy, ocean energy, solar, and other NRE
• Utilization of NRE
• Trading

COE START UP ACTIVITIES20
KNEB-BALI
PETDES, Program Energi Terbarukan Desa, designed to increase the national
electrification ratio to 100% by providing renewable off-grid systems
Raising Bioenergy Crops on degraded land, programs have already started in Central
Kalaimantan
Field stations, partnering with, or establishing, tol function as support centres for ground
truthing, project implementation support and monitoring and evaluation
Seven economic clusters
The COE will begin immediately to assist national programmes as a “virtual”
Centre. This involvement will support the Centres development.

21 COE PROGRAM : THREE TIER RELATING TO KNEB DEVELOPMENT
Time
TIER
Cakrawala 1:0 s/d 18 month
Cakrawala 2:12 s/d 36 month
Cakrawala 3: 36 months
Enabling Conditions:
• Data and Information management.
• Goverment regulation : incentive, gas supply , Public Private Partnership Regulation, financial regulation, etc.
• Local regulation, Bali city planning (RTRW), infrastructure planning, and permission (LULUCF).
• Socialitation and local campaign.
a. Reuse waste heat becomes
cooling system of Pesanggaran
Diesel Power Plant
b. Smart system in Universitas
Udayana and Bali
c. Building Pilot Project Marine
Current Turbin in Toyopakeh Strait
d. Revitalization Windmill Turbin in
Nusa Penida and Solar Power
Plant in Bangli
e. Waste to energy plant in TPA
Suwung
• Fuel conversion from coal
to gas for Pasangaran,
Gilimanuk, Pemaron power
plant
• Building Gas Power Plant in
Jembrana
• Building renewable field stations monitoring centre in Indonesia.
• Encourage applied research for clean energy , especially marine -based such as currents , algae , OTEC , and other clean energy
Clean and Green2018
2015-
2016
2016-
2017
2017-
2018

Quick Win:
• Setting up of Virtual CoE at Balitbang
(Data Research Laboratory, LAPEDA)
• Smart System at Bali (Bali Governor Office
complex) and Udayana University
• Biofuel pilot plan at North Sulawesi/Sam
Ratulangi University (as a CoE Field
Station)
22 PROGRAM AND ACTIVITIES (1/5)

1. Function, tasks and organization structure of CoE
2. Program and activities of CoE in the short, medium and long terms,
especially quick wins of CoE
3. Office of CoE: building and facilities
4. Maximize the benefit of cooperation with various parties:
Prospectus financial institutions among others Asian Development
Bank (ADB), Korea Trade Investment Promotion Agency (KOTRA),
US Agency for International Develpment (USAID), Australian
Indonesian Cooperation (AIC); and internationally reputable R&D
institutions such as NREL
5. How does the KNEB Team develop roadmap based on the above items?
23 AREAS FOR FURTHER ELABORATION BY KNEB TEAM :

BUKU STATISTIK
THANK YOUhttp://www.litbang.esdm.go.id
http:// www.lemigas.esdm.go.id
http:// www.p3tkebt.esdm.go.id
http:// www.tekmira.esdm.go.id
http:// www.mgi.esdm.go.id

25 PROGRAM AND ACTIVITIES (2/5)
On Going Project:
a. Smart grid/smart system at Universitas
Udayana
b. Ocean current Pilot Project on Toyopakeh
Strait
c. Waste heat to cooling system utilization on
PLTD Pasanggaran.

Short Term Project:
• Reuse waste heat becomes cooling system of
Pesanggaran Diesel Power Plant
• Smart system in Bali and Universitas Udayana
• Building Pilot Project Marine Current Turbin in
Toyopakeh Strait
• Revitalization Windmill Turbin in Nusa Penida
and Solar Power Plant in Bangli
• Waste to energy plant in TPA Suwung
26 PROGRAM AND ACTIVITIES (3/5)
Medium Term Project:
• Fuel conversion from coal to gas for
Pasangaran, Gilimanuk, Pemaron power
plant
• Building Gas Power Plant in Jembrana
27 PROGRAM AND ACTIVITIES (4/5)

Long Term Project:
• Building renewable field stations
monitoring centre in Indonesia.
• Encourage applied research for clean
energy , especially marine -based such as
currents , algae , OTEC , and other clean
energy
28 PROGRAM AND ACTIVITIES (5/5)

29 TIMELINE
No KegiatanJuli Agustus Sept Oktober November Desember Januari
1 2 3 4 1 2 3 4 1 2 3 4 1 2 3 4 1 2 3 4 1 2 3 4 1 2 3 4
Sayembara Konsep Desain Center of Excellence 2015
1
Persiapan
koordinasi (teknis
dan budget)
1
2
Pendekatan
pemangku
kepentingan
2
3 MoU Bali 3
4
Peluncuran
kompetisi dan
konferensi pers
4
5Pendaftaran dan
penyerahan desain5
6Penutupan
pendaftaran6
7 Penjurian 7
8
Pengumuman
pemenang &
Konferensi Pers
8
Pengembangan Center of Excellence 2015 - 2016
9 Pembuatan FS 9
10Peletakan batu
pertama10
11Mulai
pembangunan** Setelah proses DED selesai – mulai 2016

• establishment and operationalization of an Indonesian Centre of
Excellence designed to support the acceleration of BLB’s
renewable energy program;
• development of the Centre’s portfolio of research, development, demonstration and deployment programs;
• joint energy-analysis projects focusing on the sustainability of
renewable-energy technologies with respect to Indonesia's climate
and environment, including land, water and air;
• technology partnerships to facilitate an exchange of knowledge
and the development and deployment of renewable technologies
within Indonesia and for the broader global context, and
• establishment of education and workforce development programs
30 PROPOSED OBJECTIVE OF COOPERATION BETWEEN BLB AND NREL

• Indonesia’s Centre of Excellence enables rapid deployment of
renewable energy nation-wide and, through continued cooperation with NREL, contributes to the global shift towards clean
energy;
• Scientific advancements in renewable energy for mainly tropical climates and environments continue to provide improved
sustainable solutions for national and international clean-energy
programs; and
• Established avenues for sharing and exchanging knowledge of, and
technologies for, renewable energy that strengthens regional
energy security and mitigates climate change.
31 PROPOSED OUTCOME OF THE COOPERATION BETWEEN BLB AND NREL
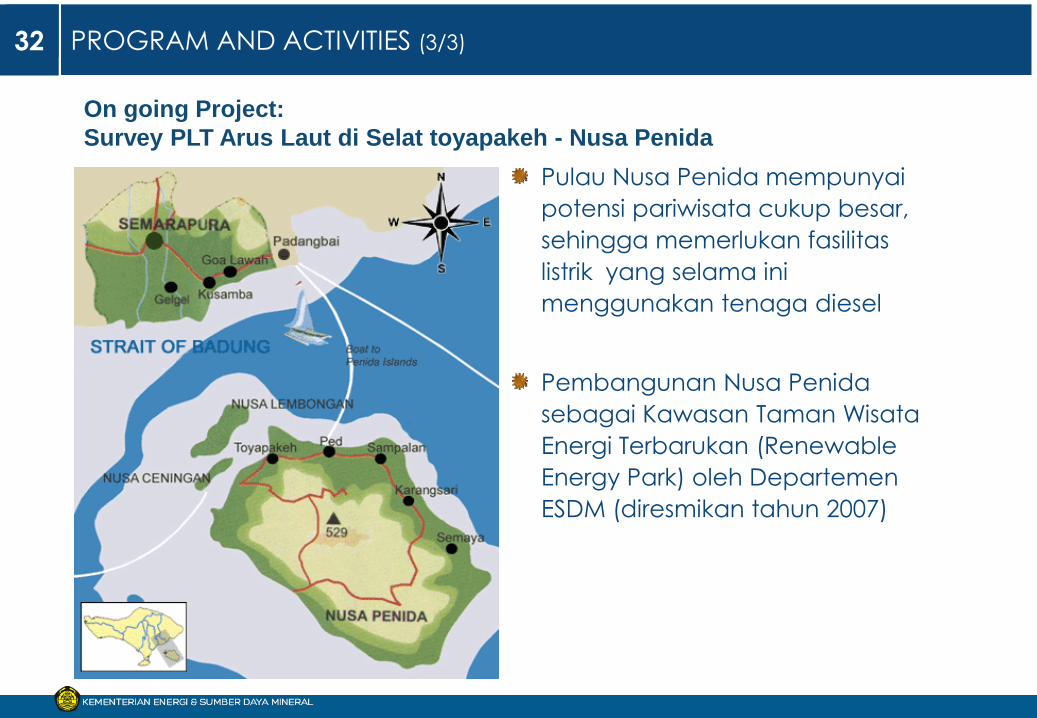
Pulau Nusa Penida mempunyai
potensi pariwisata cukup besar,
sehingga memerlukan fasilitas
listrik yang selama ini
menggunakan tenaga diesel
Pembangunan Nusa Penida
sebagai Kawasan Taman Wisata
Energi Terbarukan (Renewable
Energy Park) oleh Departemen
ESDM (diresmikan tahun 2007)
PROGRAM AND ACTIVITIES (3/3)32
On going Project:
Survey PLT Arus Laut di Selat toyapakeh - Nusa Penida